Article

Empirical Validation of a Streamlined Three-Repetition Sit-to-Stand Protocol Using MAI Motion

1
School of Computer Science, University of Lincoln, Brayford Pool, Lincoln LN6 7TS, UK
2
MSK Doctors, MSK House, London Road, Silk Willoughby, Sleaford NG34 8NY, UK
3
RKEU Psychology, Health & Wellbeing, Bishop Grosseteste University, Longdales Road, Lincoln LN1 3DY, UK
4
United Lincolnshire Teaching Hospitals NHS Trust, 101 Manthorpe Rd, Grantham NG31 8DG, UK
*
Author to whom correspondence should be addressed.
Appl. Sci. 2025, 15(10), 5688; https://doi.org/10.3390/app15105688
Submission received: 2 April 2025 / Revised: 8 May 2025 / Accepted: 16 May 2025 / Published: 20 May 2025

Abstract

:
MAI Motion is a motion capture system designed to assess lower-limb biomechanics during functional movements like the sit-to-stand (STS) test. Determining how many repetitions are needed to obtain reliable measurements is critical for balancing data quality and participant burden. This study evaluates whether three repetitions (3x) of STS provide reliable data compared to five repetitions (5x). Three-dimensional videos of participants (n = 20) performing 5x STS movements were captured using MAI Motion. Primary measurements were the mean values of each joint angle and the coefficient of variation (CV). Statistical comparisons (including one way ANOVA followed by paired t-tests or non-parametric equivalents) determined whether differences in mean (DiM) values or CV existed between 3x and 5x. The analysis revealed minimal DiM angles between 3x and 5x. Variability, assessed via CV, showed no clinically meaningful differences. Although ankle angle, knee and hip abduction had higher CV values than the other metrics, 3x and 5x performed similarly. Participants reported that 3x required less effort than 5x, underscoring its potential for clinical application. These findings demonstrate that the MAI Motion system captures comparable biomechanical data to the 5x STS protocol when using a 3x approach. This supports the adoption of 3x as a practical alternative, reducing participant burden.

1. Introduction

The integration of artificial intelligence (AI) in motion capture has gained significant attention across multiple fields, especially in healthcare and rehabilitation. However, AI-based motion-tracking systems employing markerless technology are emerging as viable alternatives to traditional methods that rely on physical markers and controlled laboratory environments. These advancements are particularly relevant in clinical settings, where the use of markers may be impractical due to the time, expertise, and facilities required to employ such systems [1,2].
These AI-based investigative tools facilitate motion capture in diverse clinical domains, including orthopaedic clinics, physiotherapy and rehabilitation, without the need for extensive physical setups [3]. The shift towards markerless motion capture is further supported by its lower cost, greater accessibility, and ability to perform whole-body kinematics tracking [4].
MAI Motion is a markerless digital platform that allows for the analysis of everyday movements, including the transition from a seated to standing position, known as the sit-to-stand (STS) test [1,2]. Moving from a seated to standing position involves a multifaceted process that requires a complex interplay of kinematic phases and biomechanical adjustments across four distinct phases: flexion momentum, momentum transfer, extension, and stabilisation [5,6], also known as the pelvic tilt, trunk extension, hip flexion, and knee extension. Each phase is characterised by specific kinematic actions that facilitate the successful transfer of the centre of mass (COM) from a stable base of support (the seat) to a less stable position (the feet) [7]. The STS test is primarily conducted for its ability to effectively indicate lower limb strength, functional capacity, and risk of falls, which are critical for maintaining independence in daily activities [7].
The STS test is a widely utilised and validated tool in clinical and research settings for assessing lower limb function, balance, and physical performance, particularly among older adults and individuals with musculoskeletal (MSK) impairments [8,9]. While various STS protocols exist, the five-repetition format (5x STS) is commonly adopted due to its balance between practicality and sensitivity in detecting functional deficits [10,11].
However, in clinical practice, a significant proportion of individuals with chronic MSK conditions are unable to complete five full repetitions due to pain, fatigue, or movement limitations. For example, 18% (13 of 71) of participants who were one year post total knee arthroplasty failed to complete the 5x STS test [12] whilst 6% (6 of 96) of males aged 51–72 years were unable to complete the test in a study investigating the impact of ageing and MSK pain [13]. This constraint presents a potential barrier to inclusive assessment and data acquirement, particularly when advanced kinematic analysis tools such as MAI Motion are employed.
To address this challenge, we hypothesised that three repetitions (3x) of the STS test may yield data of comparable reliability to the conventional five-repetition protocol. The aim of this study, therefore, was to systematically evaluate whether kinematic parameters captured via 3D MAI Motion during 3x STS trials could reliably replicate those obtained from 5x trials. By directly comparing both protocols across a range of key biomechanical metrics, we sought to establish whether the shorter protocol offers a valid alternative, thereby enhancing accessibility without compromising the integrity of the diagnostic assessment.

2. Materials and Methods

2.1. Ethical Approval

The study was performed in accordance with the Declaration of Helsinki and followed Good Clinical Practice (as outlined by NIHR) and the guidance set forth by the General Medical Council (GMC). Ethics approval was received from the Doctors Medical Advisory Committee Ethics Board (2021_7084). All participants provided informed consent for their involvement in the study, for their personal data to be stored in accordance with the General Data Protection Regulation (GDPR), and for the prospective dissemination of study outcomes to be published in an anonymised format to ensure privacy and confidentiality.

2.2. Subjects

Twenty participants (seventeen male and three female, age = 52.5 ± 13.3 mean ± SD; min 35/max 73 years) without MSK conditions were included in the study. The participants were selected according to the following inclusion criteria: ability to perform the STS test 5x; exclusion criteria were not being able to complete five repetitions without assistance (no participants were unable to complete five repeats).

2.3. Experiment and Task

A standard RGB camera (Model: Kinect DK, Microsoft, Sleaford, UK) (resolution 1920 × 1080, frame rate 30 fps), capable of processing motion-tracking and depth-sensing, was used to capture movement. The video recorded was uploaded on the MAI Motion platform for analysis.
All participants were introduced to the MAI Motion platform, taken through the process, and afforded the opportunity to ask any questions prior to performing the 5x STS test. The whole procedure took between 10 and 15 min. All participants started from a seated position on a chair (seat height was 48 cm) with both feet placed level to the ground in a neutral position and shoulder-width apart. For a complete movement cycle, the participant was asked to stand up and then sit down. This was repeated for 5 cycles, performed continuously without any break until completion. This typically took 15–25 s.
Through the MAI Motion platform, angles of the knee, hip and ankle, abduction of the knee and hip, and L/R and core movement were determined for participants (n = 20) who repeated the STS test 5x. Measurements were determined for all 5x repeats or the first 3x repeats.
The definition of kinematic measurements, termed parameters, reported throughout the manuscript is as follows: for angle and abduction measures (knee, hip and ankle); Impulse (+ve and −ve) represents the speed of change in degrees per second (°s); impulse ratio is defined as the product of the +ve impulse divided by the −ve impulse for that parameter (no units); range is the range of motion in degrees (°). The measures of L/R movement and core movement were as follows: impulse (+ve and −ve) represent the speed of change in metres per second (m/s), and range is the range of motion in metres (m).
Coefficient of Variation (CV): (Standard Deviation/Mean) × 100 was reported as percent (%) and used to measure variability across repeats. CV thresholds commonly define <10% as “ideal” and 10–20% as “acceptable” [14].
Difference in mean (DiM): (5x − 3x)/5x × 100 was reported as a percent (%) and used to compare differences across the measurements.

2.4. Statistical Analysis

Statistical analysis was performed using Excel and GraphPad Prism (version 10.4.1). Statistical tests included ordinary one-way ANOVA followed by Šídák’s multiple comparisons tests or paired t-tests. A p-value of <0.05 was considered significant (see Figure captions for details).

3. Results

This study employed 3D MAI Motion capture technology to analyse key kinematic parameters, including positive and negative impulse, impulse ratio, and range of motion across critical joint movements, or categories such as knee angle, knee abduction, hip angle, hip abduction, and ankle angle, as well as left/right and core movement. These parameters were assessed during a repeated STS test performed five times (5x) by 20 participants, providing a comprehensive evaluation of dynamic joint and body motion under varying biomechanical loads [15]. The purpose of this evaluation was to determine whether 5x repeats are necessary or whether 3x repeats provide equivalent data and results.
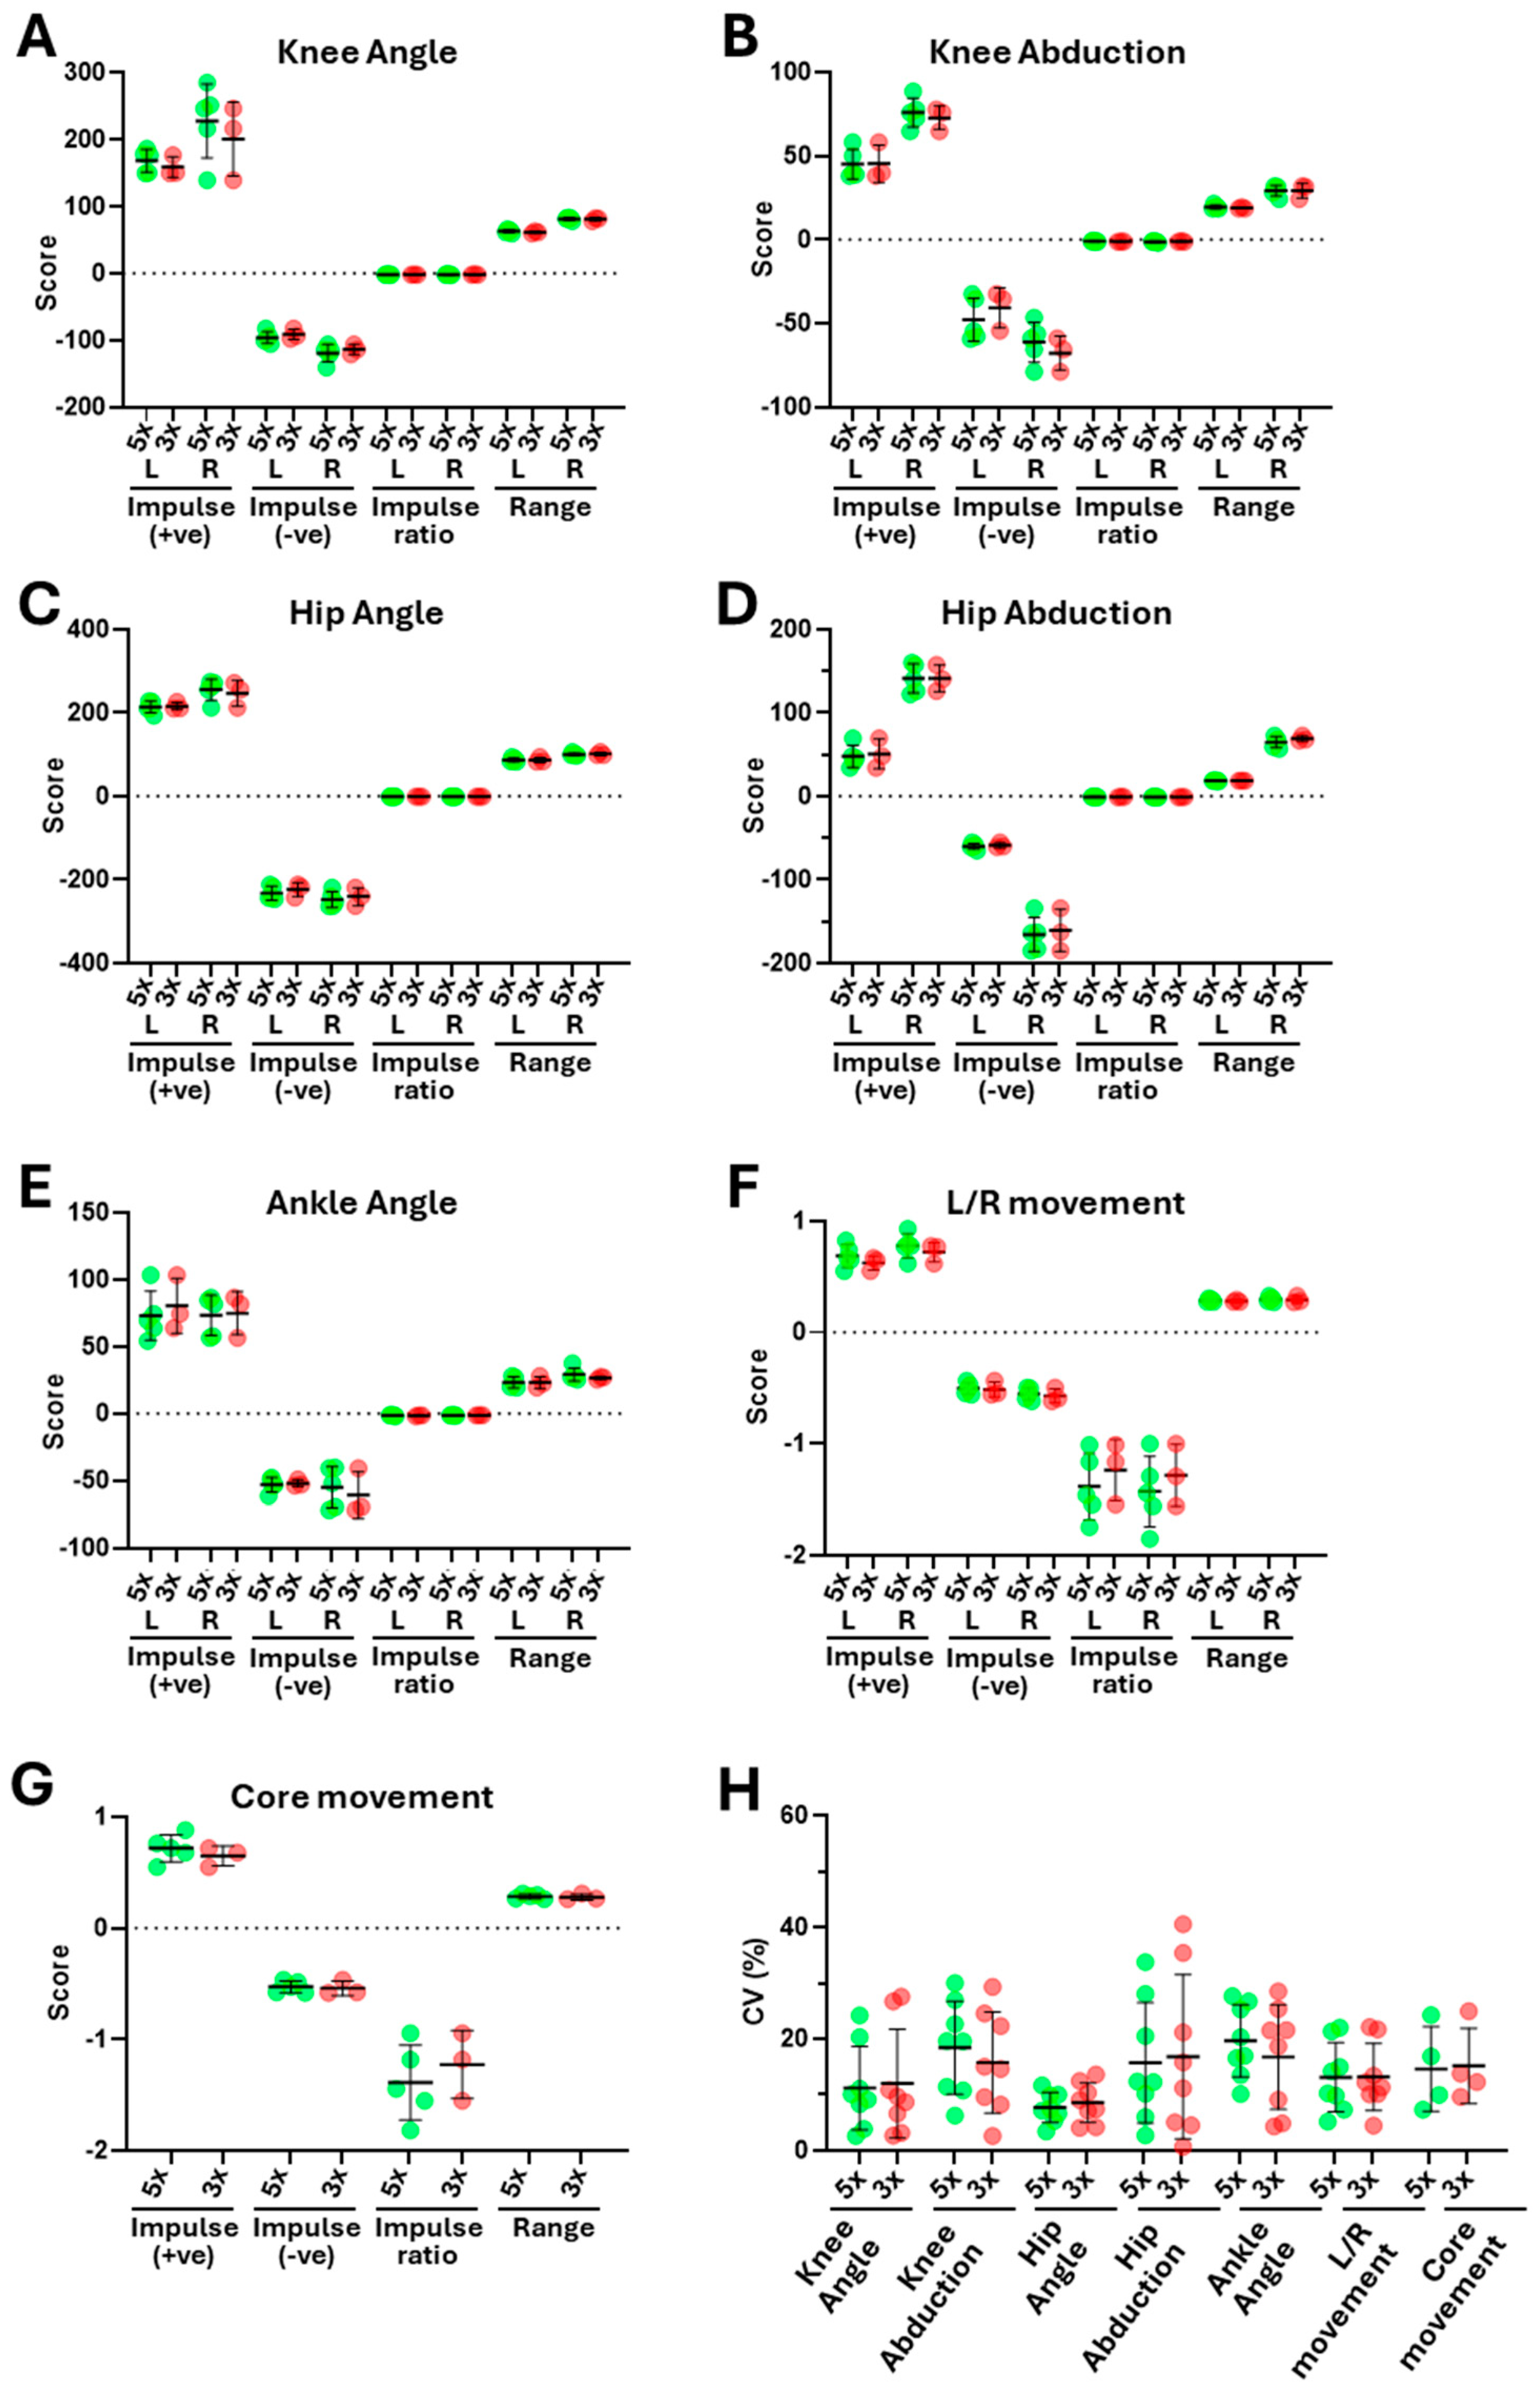
Figure 1 shows an overview of the representative data from one participant. Whilst there was considerable variation across the parameter scores within categories (for example, when comparing left and right positive and negative impulse scores for knee angle—Figure 1A) and across categories (when comparing the same parameters for knee, hip and ankle angle—Figure 1A–C), there was relatively limited variation between scores derived from 5x vs. 3x for the same parameter, with comparable means and standard deviations. Consistent with this, there were no significant differences between the means for scores derived from 5x or 3x for the same parameter. Furthermore, analysis of the coefficient of variation (CV) across the scores (Figure 1H) showed comparable CVs for 5x and 3x, which were statistically indistinguishable and typically in the range of 10 to 20%, values considered ideal to acceptable in this context [14].
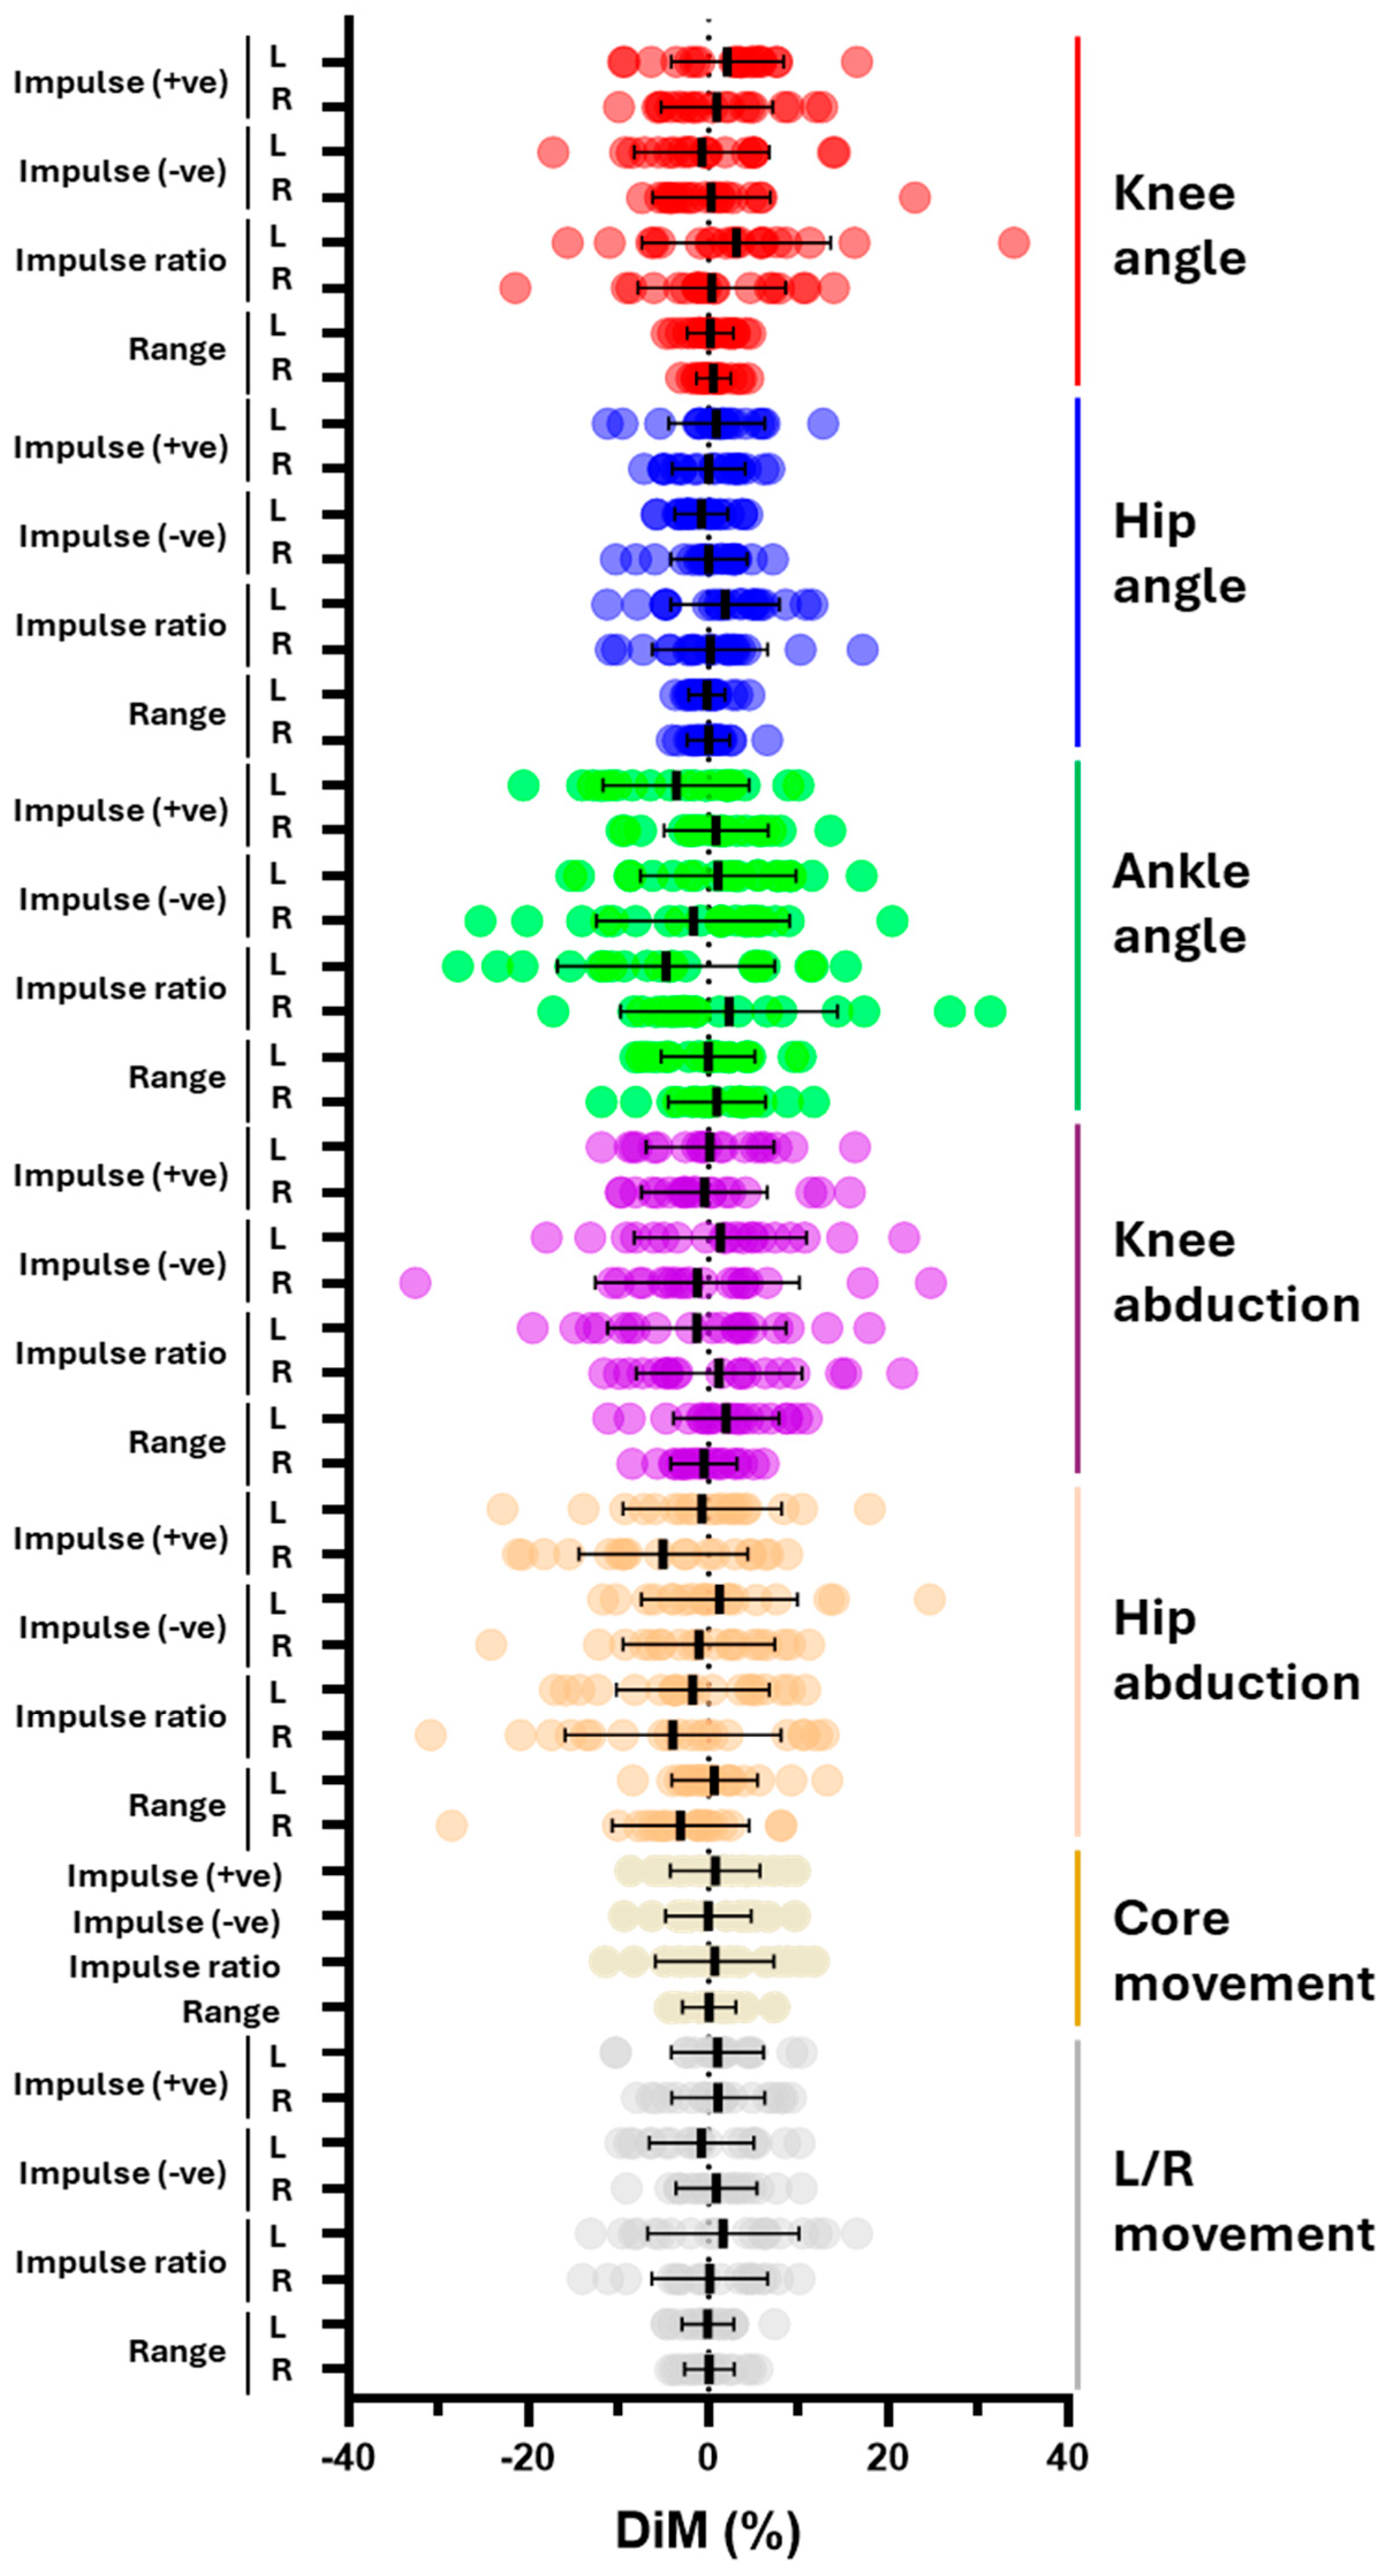
Next, we analysed the difference in means (DiMs) to establish whether there were any significant differences between the results generated from an analysis of 5x or 3x repeats from all 20 participants (Figure 2). There were no significant differences between 5x or 3x, with DiMs for most parameters typically ranging between 0 and 10%, indicating good consistency between 5x and 3x repeats (as illustrated by all the mean DiMs being less than 10%). Higher values of up to 30%, were seen for some individual DiMs (which represent the DiM for that parameter for one participant), most notably for impulse ratio in knee angle, ankle angle, and hip abduction (Figure 2). Similar results were seen when mean data were grouped and analysed per participant, with no significant differences between 5x vs. 3x repeats when compared at the level of the individual participants or after combining values across participants (see Supplementary Figure S1A,B). The analysis of DiMs between 5x vs. 3x for individual participants further emphasised the consistency between the data generated by 5x and 3x repeats (see Supplementary Figure S1C). Collectively, the absence of any statistically significant differences between the DiMs for 5x and 3x and the consistency between measures suggests that an analysis of the data from 3x repeats generates results comparable to data from 5x repeats.
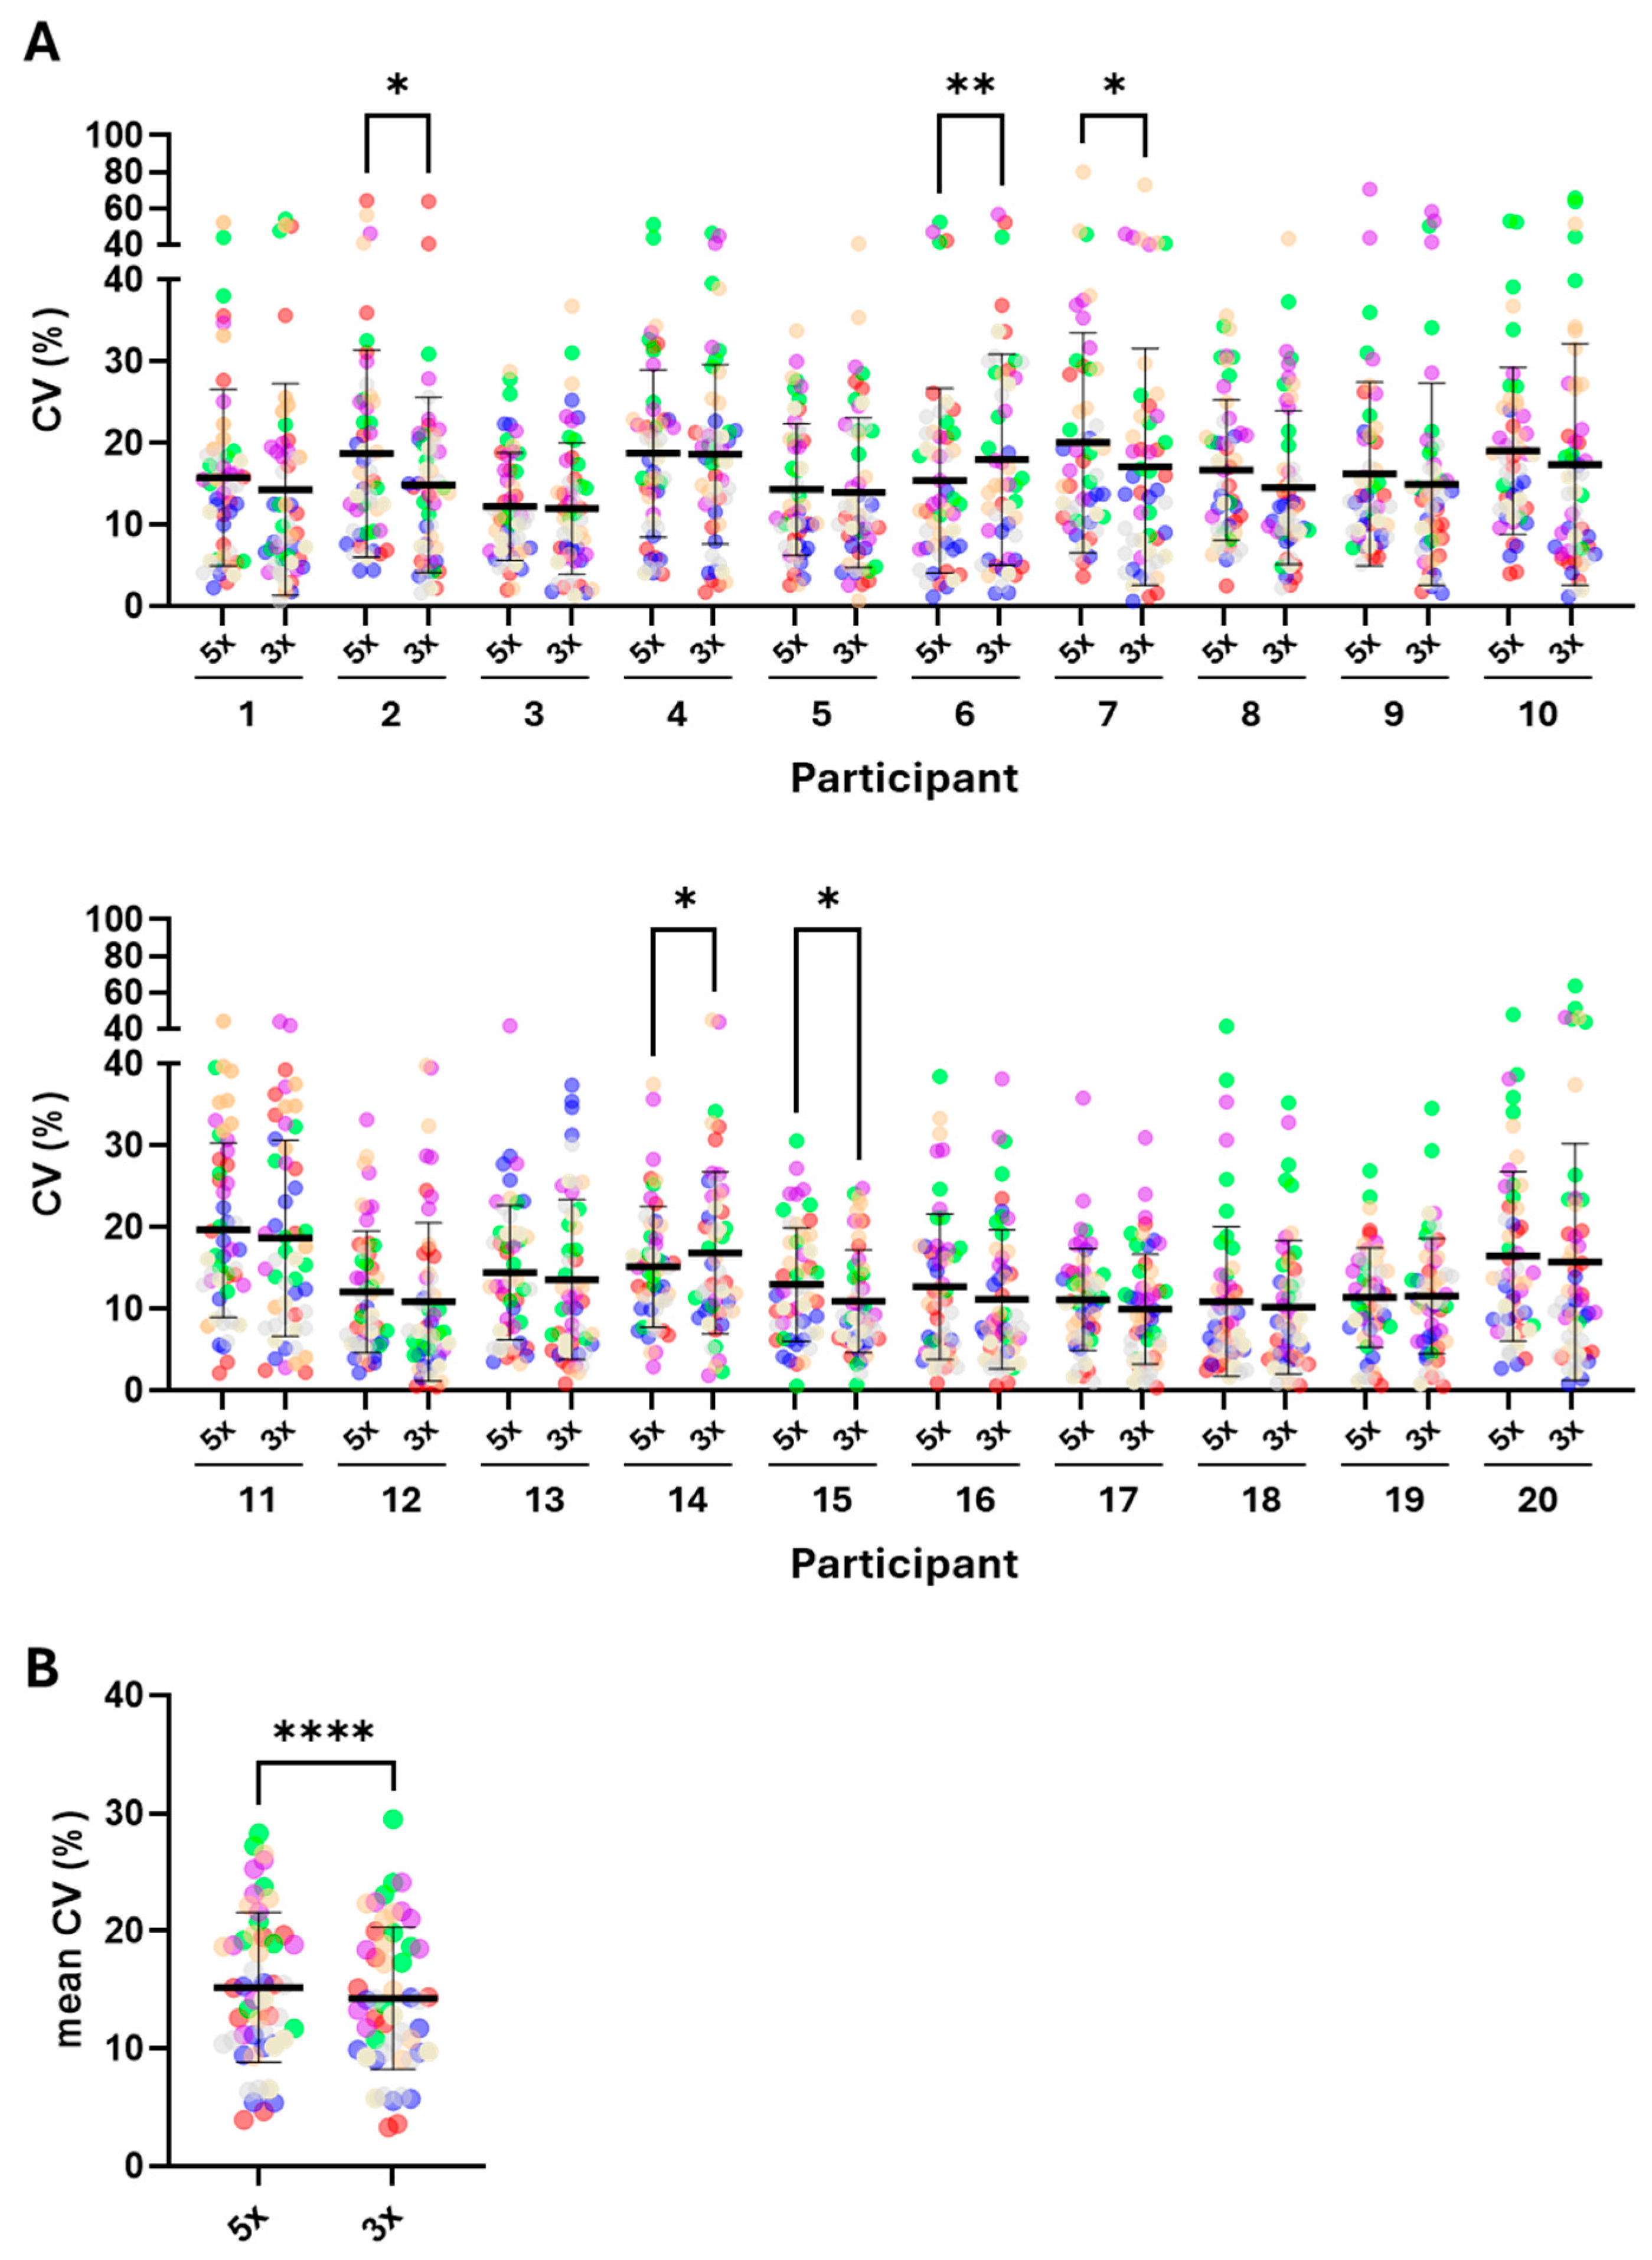
To investigate this further, we analysed the CVs generated from the 5x or 3x repeats from all participants (Figure 3). Whilst most CV values were below 20%, in some instances higher values around 60 to 70% were evident (for example, participants 2 and 7, knee angle (red) and hip abduction (orange), Figure 3A). Importantly, where such high values were found, they were present in both the 5x and 3x repeats. Statistically significant differences were revealed when comparing the CVs between 5x vs. 3x for participants 2, 6, 7, 14, and 15. For participants 2, 7, and 15, the CVs were significantly lower in the 3x compared to 5x (14.9 ± 10.7 vs. 18.7 ± 12.7; 17.1 ± 14.5 vs. 20.1 ± 13.5; 13.0 ± 6.94 vs. 10.9 ± 6.3, mean ± SD, * p < 0.025) whereas this difference was reversed for participants 6 and 14 (18.0 ± 12.9 vs. 15.4 ± 11.3; 15.2 ± 7.4 vs. 16.9 ± 10.0 mean ± SD, * p < 0.025 or ** p < 0.002, respectively (Figure 3A). Further statistical analysis of the mean CVs for each parameter (generated by calculating the mean CV for each parameter, itself derived by combining the mean CV for that parameter per participant) also showed a modest, but significantly lower, mean CV for 3x vs. 5x (14.3 ± 6.0 vs. 15.2 ± 6.4, mean ± SD, **** p < 0.0001, Figure 3B). This is presented more qualitatively in Figure 4, which shows a comparison of the mean CV derived from 5x or 3x repeats for every parameter, allowing for the visual identification of the variation between parameters and across categories, as exemplified by the differences in parameters across ankle angle, and knee and hip abduction (Figure 4—denoted by the increase in red intensity).
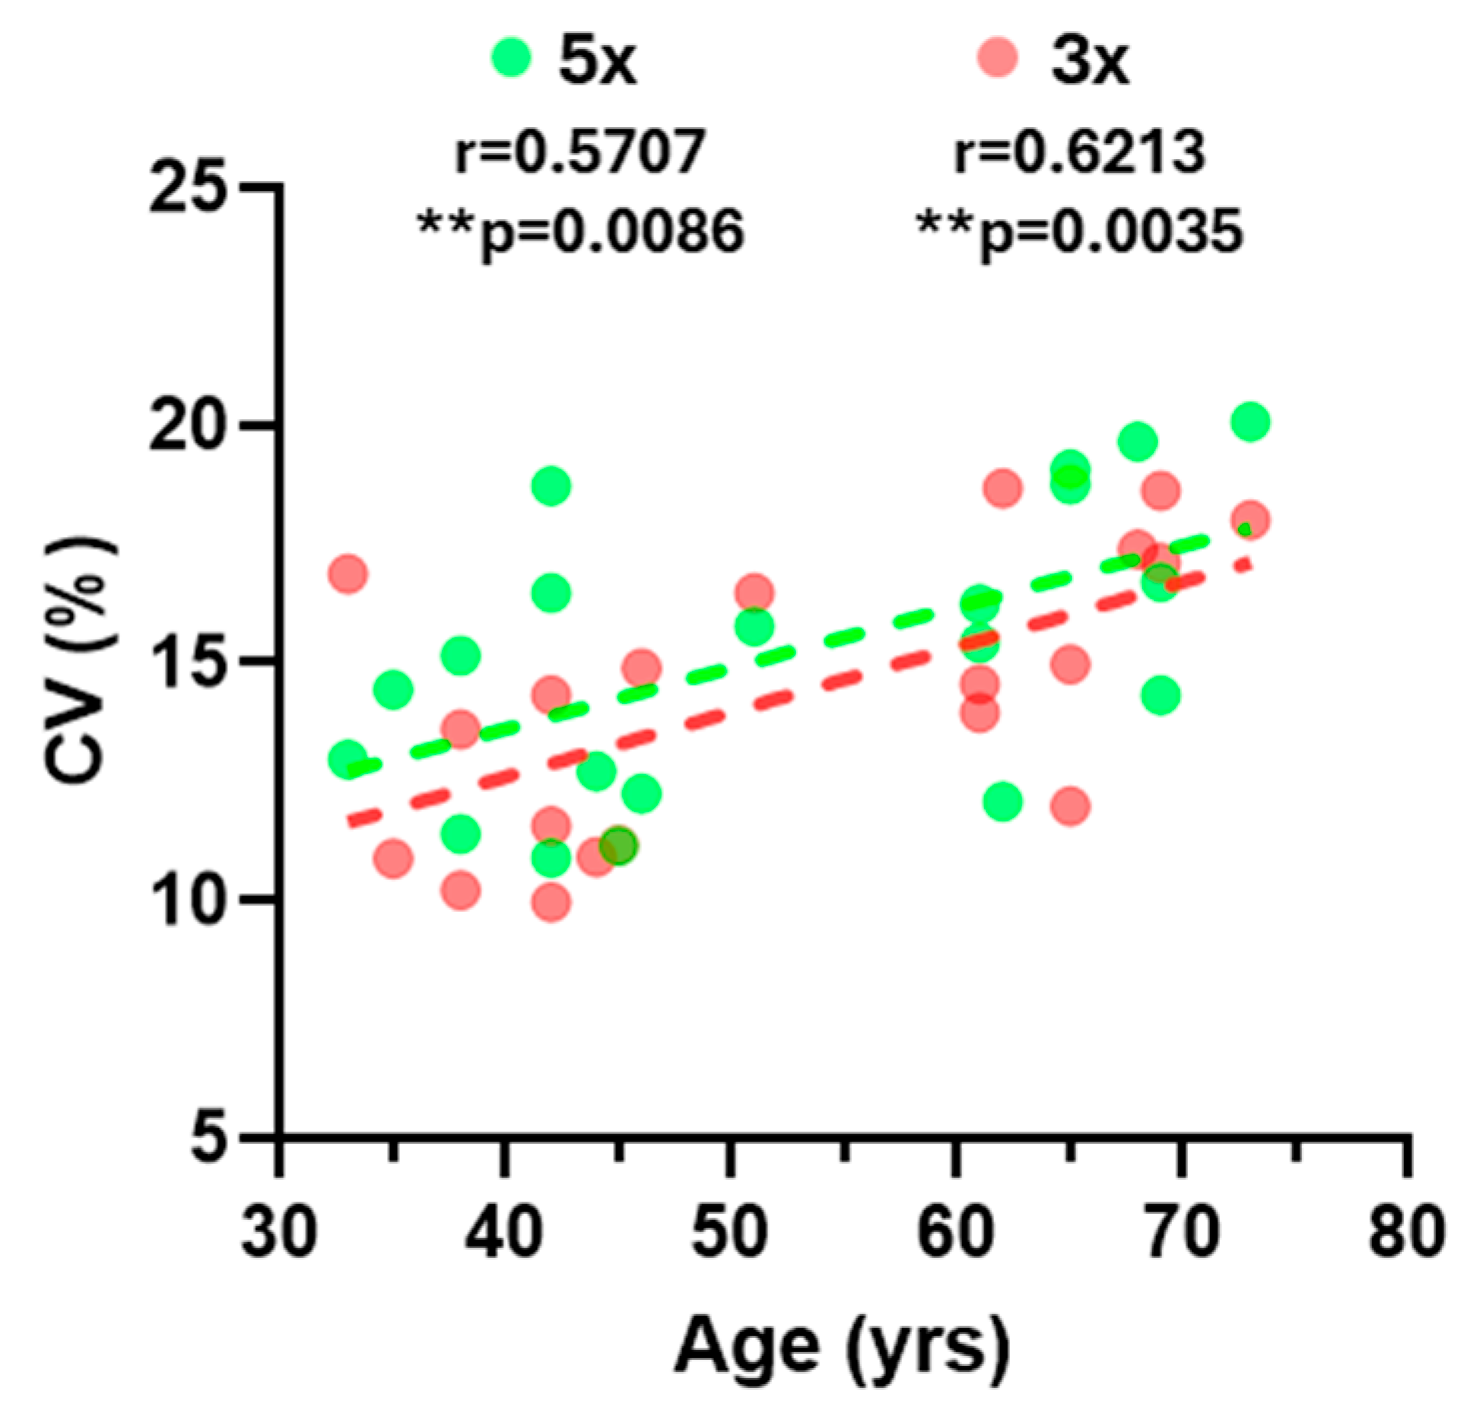
Finally, the correlation analysis revealed a significant correlation between participant age and variability, as defined by the mean CV for each participant (Figure 5). Pearson correlation coefficients were similar for 5x (r = 0.5707) and 3x (r = 0.6213) indicating, once again, that the results obtained for the 3x comparison are comparable to those obtained for the 5x.
Overall, these quantitative and qualitative comparisons indicate that the results generated from 3x are equivalent to, or even superior to, the results from 5x.

4. Discussion

This study aimed to evaluate whether the kinematic data generated by the MAI Motion system from participants performing the STS test over three repetitions were equivalent to the data obtained from five repetitions.
The results indicate a high degree of consistency between the results generated through an analysis of 3x or 5x repeats across multiple parameters, including positive and negative impulse, impulse ratio, and range of motion, evaluated across key joint categories. Statistical and qualitative analysis demonstrated that the results from 3x were comparable to, or even outperformed, those from 5x. This supports the use of a shorter 3x protocol without compromising the reliability or diagnostic benefit of the data.
A statistical analysis of the results generated through an investigation of the data from 5x or 3x repeats, including a comparison of DiMs and CVs, showed a lack of significant differences between mean values or the levels of variability of all parameters when considered individually. Significant differences in variability were only observed when comparing grouped data, namely the mean variation across CVs for all 52 parameters in five out of twenty participants (2, 6, 7, 14, and 15) and the ‘meta-mean’ of the CVs for each parameter, with the analysis of 3x repeats generating significantly less variability than that of 5x.
These findings are consistent with prior research in functional testing, indicating that beyond a modest number of repetitions, additional cycles yield diminishing returns regarding measurement precision. This likely reflects the effects of participant fatigue due to the increased number of repetitions, potentially resulting in greater variability in neuromuscular control, posture and/or movement, especially across the 4th and 5th repeats. Whilst further analysis would be required to address this more formally, previous studies have reported that increased fatigue can lead to adaptations in movement [16], giving rise to changes in biomechanical parameters [17]. Based on these observations and the results presented here, it seems reasonable to propose that 3x repeats are recommended to reduce fatigue-related variability while maintaining measurement accuracy.
The high variability observed across impulse ratio measures for knee and hip abduction, ankle angle, and, to a lesser extent, knee angle, is a well-recognised feature in biomechanical analyses [18,19]. This variability likely arises from the inherent complexity of joint mechanics and neuromuscular control. The knee, despite being primarily a sagittal plane joint, contributes to both shock absorption and propulsion while exhibiting subtle off-axis motion. Hip abduction, which is crucial for frontal plane stability, demands precise neuromuscular regulation—especially in tasks requiring mediolateral balance or single-leg stance. Ankle angle variability further adds to the dynamic interplay of lower limb function. While technical factors may introduce some variation, the consistent patterns observed across trials suggest that this variability primarily reflects true biological diversity rather than measurement limitations.
From a diagnostic perspective, the opportunity to effectively capture movement dynamics using digital platforms such as MAI Motion has real-world applicability in musculoskeletal healthcare. For example, for individuals who are frail or exhibit considerable mobility impairments or chronic musculoskeletal conditions, the increased accessibility afforded through remote evaluation, combined with the adoption of a shorter protocol, will make assessments less demanding and more inclusive. Furthermore, many individuals undergoing rehabilitation find it challenging to complete five repetitions in a single session [20], making the 3x test a more realistic and inclusive option. An array of alternative digital systems to the MAI Motion platform are in development for widespread use across the health and wellbeing landscape. These include devices for remote home health monitoring [21] as well as more focused, AI-driven motion sensors [22,23].
The limitations of this study are the relatively small number of participants (particularly females), which restricts subgroup analyses (e.g., male vs. female), and the inclusion of the analysis of only one functional task. Increasing the number of participants and including other functional tasks (e.g., squats or single-leg stance) in future studies would help to address these limitations. Increasing the age range of the cohort at both ends of the spectrum (currently 35–73 years old), to include more younger and more elderly participants, will also be required to demonstrate the broader applicability of our results. This would also permit the further exploration of the observed correlation between variability (as determined by CV) and age.
More broadly, investigations to determine the ability of the MAI Motion platform to provide accurate and useful information in clinical cohorts (e.g., patients with osteoarthritis, sarcopenia, or post-stroke) will be required. Future studies will also include the continued development and optimisation of remote-data capture, which is already available in beta form via a standard mobile phone camera through the MAI Motion app (https://maimotion.com/), enabling greater accessibility and the platform’s integration into tasks such as rehabilitation tracking.

5. Conclusions

In conclusion, this study provides evidence supporting the use of a three-repetition protocol for STS movement, as analysed by the 3D MAI Motion markerless motion capture platform. From a practical perspective, reducing repetitions from five to three can improve time-efficiency, reduce participant burden, and enhance protocol adherence. This is particularly essential in clinical populations of elderly or frail cohorts, where fatigue, discomfort, or compliance may limit viability. Hence, the 3x protocol can be confidently adopted for routine testing.

Supplementary Materials

The following supporting information can be downloaded at: https://www.mdpi.com/article/10.3390/app15105688/s1, Figure S1: Difference in means (DiMs) derived from analysis of 5x or 3x repeats of the STS test grouped by participant.

Author Contributions

Conceptualization, methodology and supervision, P.L.; software and data curation, Y.W.; validation, Y.W., T.V. and J.P.W.; formal analysis, J.P.W.; writing, review and editing, T.V. and J.P.W. All authors have read and agreed to the published version of the manuscript.

Funding

This work was supported by external funding through the Knowledge Transfer Partnership (KTP) programme, funded by Innovate UK for Yan Wen.

Institutional Review Board Statement

The study was conducted in accordance with the Declaration of Helsinki, and approved by the Doctors Medical Advisory Committee Ethics Board (2021_7084, 15 September 2021).

Informed Consent Statement

Informed consent was obtained from all subjects involved in the study.

Data Availability Statement

All data supporting the findings of this study are available on request.

Acknowledgments

The authors would like to thank the participants who contributed to this study.

Conflicts of Interest

Yan Wen and Tanvi Verma were compensated by MSK Doctors for their contributions to this work. Jonathan P. Whitehead received consultancy fees from MSK Doctors for their role in the study. Paul Lee serves as the CEO and founder of MSK Doctors and is credited as the inventor of MAI Motion as part of the Innovate UK Knowledge Transfer Partnership funds from The UK government. And Author Paul Lee was employed by the company United Lincolnshire Teaching Hospitals NHS Trust.

References

  1. Armstrong, K.; Wen, Y.; Zhang, L.; Ye, X.; Lee, P. Novel clinical applications of marker-less motion capture as a low-cost human motion analysis method in the detection and treatment of knee osteoarthritis. J. Arthritis 2022, 11, 1–5. [Google Scholar]
  2. Armstrong, K.; Zhang, L.; Wen, Y.; Willmott, A.P.; Lee, P.; Ye, X. A marker-less human motion analysis system for motion-based biomarker identification and quantification in knee disorders. Front. Digit. Health 2024, 6, 1324511. Available online: https://www.frontiersin.org/journals/digital-health/articles/10.3389/fdgth.2024.1324511/full (accessed on 2 April 2025). [CrossRef] [PubMed]
  3. Wagh, V.; Scott, M.W.; Kraeutner, S.N. Quantifying Similarities Between MediaPipe and a Known Standard to Address Issues in Tracking 2D Upper Limb Trajectories: Proof of Concept Study. JMIR Form. Res. 2024, 8, e56682. [Google Scholar] [CrossRef]
  4. Lorenz, E.A.; Su, X.; Skjæret-Maroni, N. A review of combined functional neuroimaging and motion capture for motor rehabilitation. J. Neuroeng. Rehabil. 2024, 21, 3. [Google Scholar] [CrossRef]
  5. Li, J.; Xue, Q.; Yang, S.; Han, X.; Zhang, S.; Li, M.; Guo, J. Kinematic analysis of the human body during sit-to-stand in healthy young adults. Medicine 2021, 100, e26208. [Google Scholar] [CrossRef]
  6. Schenkman, M.; Berger, R.A.; Riley, P.O.; Mann, R.W.; Hodge, W.A. Whole-body movements during rising to standing from sitting. Phys. Ther. 1990, 70, 638–648; discussion 648–651. [Google Scholar] [CrossRef] [PubMed]
  7. Janssen, W.G.; Bussmann, H.B.; Stam, H.J. Determinants of the Sit-to-Stand Movement: A Review. Phys. Ther. 2002, 82, 866–879. [Google Scholar] [CrossRef]
  8. Alcazar, J.; Losa-Reyna, J.; Rodriguez-Lopez, C.; Alfaro-Acha, A.; Rodriguez-Mañas, L.; Ara, I.; García-García, F.J.; Alegre, L.M. The sit-to-stand muscle power test: An easy, inexpensive and portable procedure to assess muscle power in older people. Exp. Gerontol. 2018, 112, 38–43. [Google Scholar] [CrossRef]
  9. Park, T.S.; Shin, M.-J. Comprehensive Assessment of Lower Limb Function and Muscle Strength in Sarcopenia: Insights from the Sit-to-Stand Test. Ann. Geriatr. Med. Res. 2024, 28, 1–8. [Google Scholar] [CrossRef]
  10. Jones, S.E.; Kon, S.S.C.; Canavan, J.L.; Patel, M.S.; Clark, A.L.; Nolan, C.M.; Polkey, M.I.; Man, W.D.-C. The five-repetition sit-to-stand test as a functional outcome measure in COPD. Thorax 2013, 68, 1015–1020. [Google Scholar] [CrossRef]
  11. Zhang, Q.; Li, Y.-X.; Li, X.-L.; Yin, Y.; Li, R.-L.; Qiao, X.; Li, W.; Ma, H.-F.; Ma, W.-H.; Han, Y.-F.; et al. A comparative study of the five-repetition sit-to-stand test and the 30-second sit-to-stand test to assess exercise tolerance in COPD patients. Int. J. Chronic Obstr. Pulm. Dis. 2018, 13, 2833–2839. [Google Scholar] [CrossRef]
  12. Onitsuka, K.; Kubota, K.; Yokoyama, M.; Miyazawa, T.; Hamaguchi, T.; Taniguchi, H.; Usuki, N.; Miyamoto, S.; Okazaki, K.; Murata, K.; et al. Clinical utility of markerless motion capture for kinematic evaluation of sit-to-stand during 30 s-CST at one year post total knee arthroplasty: A retrospective study. BMC Musculoskelet. Disord. 2023, 24, 254. [Google Scholar] [CrossRef] [PubMed]
  13. Norheim, K.L.; Samani, A.; Bonlokke, J.H.; Omland, O.; Madeleine, P. On the role of ageing and musculoskeletal pain on dynamic balance in manual workers. J. Electromyogr. Kinesiol. 2020, 50, 102374. [Google Scholar] [CrossRef] [PubMed]
  14. Shechtman, O. The Coefficient of Variation as an Index of Measurement Reliability. In Methods of Clinical Epidemiology; Doi, S.A.R., Williams, G.M., Eds.; Springer: Berlin/Heidelberg, Germany, 2013; pp. 39–49. [Google Scholar]
  15. Kwon, Y.; Kim, J.W.; Heo, J.H.; Jeon, H.M.; Choi, E.B.; Eom, G.M. The effect of sitting posture on the loads at cervico-thoracic and lumbosacral joints. Technol. Health Care 2018, 26, 409–418. [Google Scholar] [CrossRef] [PubMed]
  16. Burdack, J.; Horst, F.; Aragonés, D.; Eekhoff, A.; Schöllhorn, W.I. Fatigue-Related and Timescale-Dependent Changes in Individual Movement Patterns Identified Using Support Vector Machine. Front. Psychol. 2020, 11, 551548. Available online: https://www.frontiersin.org/journals/psychology/articles/10.3389/fpsyg.2020.551548/full (accessed on 21 March 2025). [CrossRef]
  17. Aquino, M.; Petrizzo, J.; Otto, R.M.; Wygand, J. The Impact of Fatigue on Performance and Biomechanical Variables—A Narrative Review with Prospective Methodology. Biomechanics 2022, 2, 513–524. [Google Scholar] [CrossRef]
  18. Thomas, D.T.R.S.; Prabhakar, A.J.; Dineshbhai, P.V.; Eapen, C. Hip abductor strengthening in patients diagnosed with knee osteoarthritis—A systematic review and meta-analysis. BMC Musculoskelet. Disord. 2022, 23, 622. [Google Scholar] [CrossRef]
  19. van Tittelboom, V.; Alemdaroglu-Gurbuz, I.; Hanssen, B.; Heyrman, L.; Feys, H.; Desloovere, K.; Calders, P.; Broeck, C.V.D. Reliability of Isokinetic Strength Assessments of Knee and Hip Using the Biodex System 4 Dynamometer and Associations with Functional Strength in Healthy Children. Front. Sports Act. Living 2022, 4, 817216. [Google Scholar] [CrossRef]
  20. Yee, X.S.; Ng, Y.S.; Allen, J.C.; Latib, A.; Tay, E.L.; Abu Bakar, H.M.; Ho, C.Y.J.; Koh, W.C.C.; Kwek, H.H.T.; Tay, L. Performance on sit-to-stand tests in relation to measures of functional fitness and sarcopenia diagnosis in community-dwelling older adults. Eur. Rev. Aging Phys. Act. 2021, 18, 1. [Google Scholar] [CrossRef]
  21. Chan, A.; Cai, J.; Qian, L.; Coutts, B.; Phan, S.; Gregson, G.; Lipsett, M.; Rincón, A.M.R. In-Home Positioning for Remote Home Health Monitoring in Older Adults: Systematic Review. JMIR Aging 2024, 7, e57320. [Google Scholar] [CrossRef]
  22. Park, C.; Mishra, R.; Sharafkhaneh, A.; Bryant, M.S.; Nguyen, C.; Torres, I.; Naik, A.D.; Najafi, B. Digital Biomarker Representing Frailty Phenotypes: The Use of Machine Learning and Sensor-Based Sit-to-Stand Test. Sensors 2021, 21, 3258. [Google Scholar] [CrossRef] [PubMed]
  23. Linn, N.; Goetzinger, C.; Regnaux, J.P.; Schmitz, S.; Dessenne, C.; Fagherazzi, G.; Aguayo, G.A. Digital Health Interventions among People Living with Frailty: A Scoping Review. J. Am. Med. Dir. Assoc. 2021, 22, 1802–1812.e21. [Google Scholar] [CrossRef] [PubMed]
Figure 1. Overview of kinematic measurements from a participant performing a repeated sit-to-stand (STS) test following analysis of five or three repeats. Measures for each parameter (impulse +ve, impulse −ve, impulse ratio, and range of motion (Range)) within each of the categories, (A) knee angle, (B) knee abduction, (C) hip angle, (D) hip abduction, (E) ankle angle, (F) L/R movement, and (G) core movement, were extracted from video of a participant performing the STS test five times, captured using MAI Motion. Each panel (AG) depicts parameters measured across all five repeats (5x—green) or the first three repeats (3x—red), the mean ± SD (black lines). Left (L) and Right (R) are shown for all measures except the core. For panels (AE), the units are as follows: impulse +ve and impulse −ve (°/s); range (°). For panels (F,G), units are as follows: impulse +ve and impulse −ve (m/s); range (m). (H) shows the Coefficients of Variance (CV (%)) for each parameter derived from 5x or 3x repeats for each category. No significant differences were observed between the means (using ordinary one-way ANOVA followed by multiple comparisons) or CVs (using paired t-tests) of any parameter when comparing 5x vs. 3x.
Applsci 15 05688 g001
Figure 2. Difference in means (DiMs) derived from analysis of 5x or 3x repeats of the STS test grouped by parameter. DiMs for each parameter were derived by establishing the difference between the means calculated from 5x or 3x repeats for each participant (n = 20) and are presented as % of 5x mean. Mean ± SD (black lines) of the DiM for each parameter are shown.
Applsci 15 05688 g002
Figure 3. Coefficient of variance (CV) derived from analysis of 5x or 3x repeats of the STS test grouped by participant. (A) CVs for each parameter (describing knee angle (red), knee abduction (purple), hip angle (blue), hip abduction (orange), ankle angle (green), L/R movement (grey), and core movement (tan)) were derived by comparing the CVs from 5x vs. 3x repeats for each participant (1–20). Mean ± SD (black lines) are shown. Statistical significance between 5x vs. 3x for each participant was determined using repeated measures one-way ANOVA, followed by Šídák’s multiple comparisons tests (* p < 0.025; ** p < 0.002). (B) Mean CVs for each parameter across all 20 participants were calculated using data from 5x or 3x repeats. Mean ± SD (black lines) are shown. Statistical significance between 5x vs. 3x was determined using a paired t-test (**** p < 0.0001).
Applsci 15 05688 g003
Figure 4. Summary of CVs derived from analysis of 5x or 3x repeats of the STS test grouped by parameter. Mean CVs for each parameter from all 20 participants are represented using a colour scale ranging from yellow (ideal/low CV), to amber (acceptable/intermediate CV), to red (poor/high CV)—CV values are depicted in the scale bar at the bottom. Difference in colour for a parameter between 5x vs. 3x denotes the differences between the means of CVs for that parameter (e.g., 5x cf 3x for Impulse −ve, L and R, knee angle). Similarly, colours differing between the same parameter across different categories denotes differences between the means of CVs for that parameter (e.g., impulse +ve and impulse −ve for knee angle cf ankle angle).
Applsci 15 05688 g004
Figure 5. Positive correlation between age and variability (CV). Participant age and mean CVs (determined from 5x or 3x repeats, respectively) for all 20 participants are depicted in green (5x) or red (3x). Lines of linear regression are included, and Pearson correlation coefficients (r) and p values are shown.
Applsci 15 05688 g005
Disclaimer/Publisher’s Note: The statements, opinions and data contained in all publications are solely those of the individual author(s) and contributor(s) and not of MDPI and/or the editor(s). MDPI and/or the editor(s) disclaim responsibility for any injury to people or property resulting from any ideas, methods, instructions or products referred to in the content.

