Featured Application
This study presents an integrated microscale modelling approach to assess whether green infrastructure and material-based measures can offset limited traffic reduction in improving outdoor thermal comfort and air quality on a Mediterranean university campus. Results show that traffic mitigation is most effective, while nature-based solutions play a supporting role. The methodology is transferable and supports sustainable planning in compact urban environments.
Abstract
Urban campuses face critical environmental challenges due to high pedestrian density, traffic-induced air pollution, and thermal stress, especially in compact Mediterranean settings. These conditions can compromise the usability and livability of outdoor spaces. This study investigates whether greening and material-based interventions can offset a lower degree of traffic reduction in improving air quality and thermal comfort. The University Campus of Catania (Southern Italy) served as the case study. An integrated microscale simulation framework using ENVI-met was developed, calibrated, and validated with local traffic, meteorological data, and field measurements of PM10 and PM2.5. Three scenarios were tested: a baseline, Scenario 1 (50% traffic reduction with moderate greening), and Scenario 2 (30% traffic reduction with more extensive greening and material interventions). Results showed that Scenario 1 consistently outperformed Scenario 2 in all pedestrian hotspots. The highest reductions recorded in Scenario 1 were −0.150 μg/m3 for PM2.5 (−11.5%), −0.069 μg/m3 for PM10 (−5.9%), −2.16 °C for UTCI (−7.6%), and −2.52 °C for MRT (−4.5%). These findings confirm that traffic reduction is the dominant factor in achieving environmental improvements, although greening and innovative materials play a valuable complementary role. The study supports integrated planning strategies for climate-responsive and healthier university environments.
1. Introduction
Rapid urbanization has significantly intensified the demand for housing, transportation, and infrastructure, leading to the depletion of natural resources and the worsening of environmental challenges, especially in densely populated cities [1]. Among these challenges, urban air pollution and the urban heat island (UHI) effect stand out as key issues with serious implications for public health and climate resilience. The replacement of vegetated surfaces with impermeable, low-reflectance materials such as asphalt and concrete plays a major role in these phenomena, as such materials absorb and re-emit solar radiation, increasing ambient temperatures and energy demand [2,3]. At the same time, motorized traffic remains one of the main sources of urban air pollution, emitting a complex mix of pollutants—including carbon monoxide (CO), nitrogen and sulfur oxides (NOx, SOx), particulate matter (PM2.5, PM10), volatile organic compounds (VOCs), and ozone (O3)—all of which are strongly associated with elevated risks of asthma, bronchitis, and cardiovascular diseases [4,5,6,7,8,9,10,11,12].
In response to these well-documented health impacts, several international and regional institutions have established air quality standards to define acceptable exposure levels. The 2021 guidelines of the World Health Organization (WHO) recommend a 24 h mean limit of 15 μg/m3 for PM2.5 and 45 μg/m3 for PM10, while the European Union’s Directive 2008/50/EC sets an annual mean of 25 μg/m3 for PM2.5 and a 24 h mean of 50 μg/m3 for PM10, not to be exceeded more than 35 times per year [13,14]. These regulatory thresholds are not only intended to protect public health but also serve as references for urban environmental assessments and the design of effective mitigation strategies.
Numerous studies have highlighted the potential of green infrastructure and innovative technologies to reduce air pollutants and thermal accumulation. Tree-lined streets, vegetative canopies, and photocatalytic surfaces with titanium dioxide can absorb or degrade NOx and PM while also offering thermal benefits through shading and evapotranspiration [15,16,17,18,19,20,21,22,23,24,25,26]. However, their effectiveness depends on factors such as climate, urban form, and plant physiology. High temperatures can limit stomatal uptake by inducing closure [27], while cooler microclimates may reduce ozone formation via atmospheric chemical processes [28]. Urban traffic modeling has emerged as a key tool for estimating pollutant emissions under real-world conditions and supporting urban planning decisions. Advanced simulation platforms such as SUMO and VISSIM are increasingly integrated with Computational Fluid Dynamics (CFD) approaches to represent the complex dispersion behavior of pollutants in built environments [29,30]. For example, combining SUMO with the Lattice Boltzmann method (OpenLB) allows for dynamic simulation of traffic-air quality interactions in highly detailed urban scenarios, while Gaussian process models integrated with CFD are used to optimize traffic flow and reduce CO emissions [30]. CFD-RANS models have also proven effective in reproducing pollution hotspots at the street and neighborhood scales, offering high spatial resolution in simulating the dispersion of PM, NOx, and CO under real-world conditions [31,32]. Simultaneously, solar radiation absorbed by dark surfaces and heat retention in densely built areas intensify the UHI effect, especially under increasingly frequent and intense heatwaves caused by climate change [33,34]. Urban materials and design play a central role in modulating thermal loads: the strategic use of high-albedo surfaces, vegetative shading, and traffic reorganization has been shown to reduce thermal stress and improve outdoor comfort [35,36,37,38,39,40,41].
Microscale modeling tools such as ENVI-met enable high-resolution simulation of key microclimatic parameters, including air temperature, Mean Radiant Temperature (MRT), and Physiological Equivalent Temperature (PET), by accounting for detailed urban morphology, surface materials, and vegetation properties. ENVI-met is widely used in urban climate studies due to its capability to represent small-scale interactions between the built environment and atmospheric processes, making it particularly suitable for scenario-based assessments in pedestrian-oriented areas [42,43,44,45,46,47,48,49,50]. Other models, such as SOLWEIG and OpenFOAM, provide complementary approaches: the former focuses on solar radiation and shading patterns in urban canyons, while the latter offers CFD-based simulations of airflow and pollutant dispersion. However, these tools typically operate at lower spatial and temporal resolution and may require more complex calibration [50,51].
A comparative overview of key studies is presented in Table 1, which summarizes modeling methods, spatial scales, and mitigation strategies. The table highlights how many contributions focus on isolated aspects—either microclimatic or air quality-related—often neglecting the systemic interaction between them. It also clearly shows the limited attention devoted to university campuses, and especially to those located in Mediterranean regions.

Table 1.
Main studies dealt with air pollution, urban microclimate, urban thermal comfort, numerical models, mitigation measures, and the scale of use.
Despite the breadth of existing literature, significant gaps remain in both methodology and application. In particular, there is a lack of studies employing an integrated and validated microscale approach capable of simultaneously modeling traffic, air pollution, and outdoor thermal comfort. Moreover, while various urban environments have been widely investigated, university campuses remain substantially underexplored despite their distinct characteristics—such as high pedestrian density; internal traffic flows; limited green coverage; and climate vulnerability—that make them highly relevant for environmental research. Even more notable is the absence of case studies focused on Mediterranean university campuses, which often feature complex urban morphologies and climatic conditions that exacerbate environmental vulnerability. University campuses represent unique urban microcosms, characterized by internal traffic flows, pedestrian zones, open spaces, and green areas that interact to influence both air quality and thermal comfort for students, faculty, and staff.
This study aims to fill this dual gap—methodological and contextual—by evaluating whether a validated integrated simulation framework can provide realistic and transferable insights into the combined effects of traffic reduction, greening, and material interventions in such a specific setting. In this context, walkability and user experience are closely tied to environmental conditions such as traffic congestion, shade availability, and vegetation cover. The lack of shaded areas, insufficient green infrastructure, and high vehicular traffic can significantly impair the livability of outdoor spaces, with consequences for sustainable mobility and environmental health [62,63]. Targeted interventions—such as expanding low-traffic zones; increasing green surfaces; and enhancing shaded pedestrian networks—are therefore essential to support healthier and more resilient urban environments.
To address these limitations, this study proposes an integrated and validated simulation framework that combines traffic modeling, air quality assessment, and outdoor thermal comfort analysis, applied to a Mediterranean university campus in Catania, southern Italy. The approach leverages advanced numerical tools and on-site measurements to simulate the effects of combined mitigation strategies—traffic reduction and urban greening—on pollutant dispersion and microclimatic conditions. The added value of this research lies not only in its methodological innovation but also in its practical relevance, offering scientific evidence and actionable guidance for advancing environmental sustainability in academic settings and, more broadly, in complex Mediterranean urban systems.
2. Materials and Methods
This study develops and applies a microscale modeling framework designed to be replicable in similar urban contexts, such as university campuses, hospital complexes, or institutional districts characterized by internal vehicular traffic, open spaces, and high pedestrian flows. Although implemented within the university campus of Catania (Southern Italy), the proposed method is intended to assess the effectiveness of integrated environmental mitigation strategies aimed simultaneously at reducing air pollution and improving outdoor thermal comfort in complex yet representative urban environments.
The study area is located within an open urban block of the University of Catania, a major city on the eastern coast of Sicily (37°30′ N, 15°04′ E). According to the Köppen-Geiger classification, Catania falls within the Csa category—Hot-Summer Mediterranean climate—characterized by dry and very warm summers and mild winters with relatively higher humidity. In summer, average outdoor temperatures typically range between 23 °C and 35 °C, with daytime peaks reaching up to 39 °C, contributing to thermal discomfort and high pollutant concentrations during low wind conditions.
The selected site, covering approximately 129,600 m2, is located in a suburban area relatively sheltered from central urban congestion and features vehicular and pedestrian traffic dynamics that reflect the institutional use of the site. It includes a mix of academic and administrative buildings, internal roadways, and paved open spaces. The built environment consists mainly of low- and mid-rise structures (three square buildings, 35 × 35 m, 5–15 m high, and two buildings up to 20 m), with an urban morphology that results in a high Sky View Factor (SVF > 0.60), indicating limited shading and strong solar exposure.
Although detailed surface cover data were refined through model input parameters, current land use distribution can be summarized as follows:
- approximately 7680 m2 of rooftops,
- about 13,700 m2 of impervious surfaces (roads and walkways),
- a limited presence of vegetation, mainly located at the periphery of the site.
These characteristics—open spatial configuration, limited greenery, and concentrated pedestrian activity—make the site particularly suitable for testing mitigation strategies based on traffic calming and urban greening. Furthermore, the contained scale of the study area allows for high-resolution microscale modeling using ENVI-met, offering detailed insight into local microclimatic conditions and pollutant dispersion patterns.
The methodological framework adopted, summarized in Figure 1, includes several phases: data collection (meteorological and traffic), model calibration, integrated simulation of traffic emissions, pollutant dispersion and microclimate, scenario development, validation using field data, and assessment of environmental and climatic impacts.
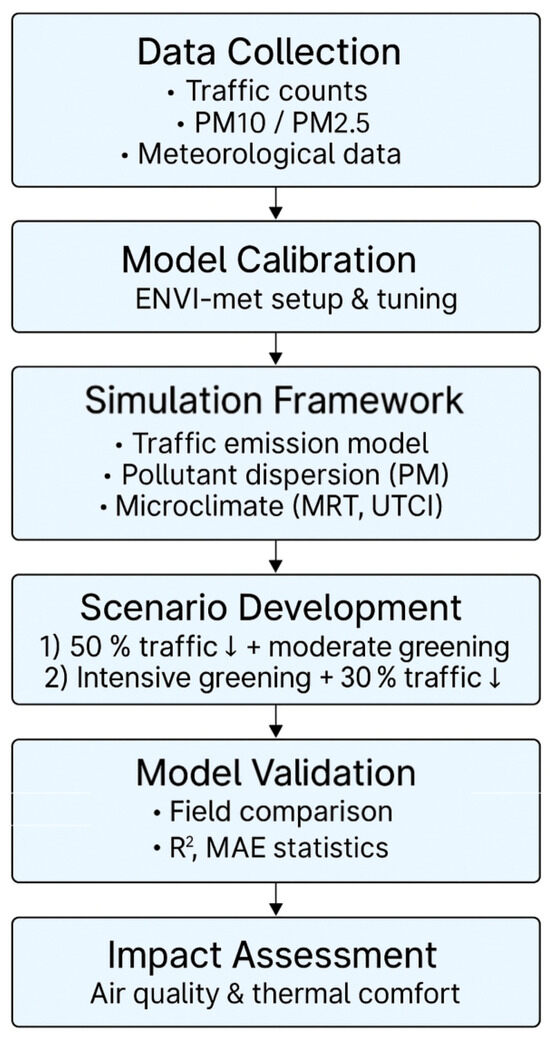
Figure 1.
Methodological framework adopted for the integrated analysis of air quality and outdoor thermal comfort.
The simulation employed the ENVI-met model, supported by CFD techniques, calibrated with local data, and validated through targeted monitoring of PM10 and PM2.5 concentrations. Two mitigation scenarios were analyzed:
- Scenario 1: traffic calming measures combined with moderate urban greening;
- Scenario 2: more intensive greening paired with moderate vehicular traffic reduction.
Both scenarios were compared to the current baseline condition, focusing on variations in pollutant concentrations and effects on key thermal comfort indicators, specifically Mean Radiant Temperature (MRT) and the Universal Thermal Climate Index (UTCI).
Figure 2a shows the satellite location of the study site within the broader urban context of Catania, while Figure 2b presents a simplified 2D view of the area, including the main buildings and circulation routes.
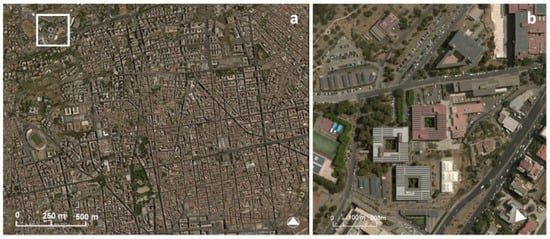
Figure 2.
(a) Satellite image of the study area within the city; (b) 2D view of the investigated area.
2.1. Data Collection and Monitoring Campaign
On 31 May 2023, a comprehensive and structured monitoring campaign was conducted to collect essential data for the estimation of traffic-related emissions and for the simulation of air quality within the university campus. Vehicular and pedestrian flows were recorded throughout the entire day to represent the full cycle of campus activity. Air quality measurements were specifically concentrated in the time window between 8:00 a.m. and 2:00 p.m., corresponding to peak mobility hours, including the morning arrival of students, faculty, and staff; lunchtime circulation; and transitions between classes and administrative functions.
Two Traffic Monitoring Stations (TMS1 and TMS2) were set up at the main intersection of the campus in order to intercept all characteristic vehicular flows along road Sections A, B, and C, as shown in Figure 3. At each station, a Miovision Scout® (Miovision Technologies Incorporated, Kitchener, Ontario, Canada) device was installed—an autonomous, video-based monitoring system equipped with high-efficiency sensors and LTE connectivity. The two units, owned by the Department of Civil Engineering and Architecture at the University of Catania, enable the accurate detection of directional traffic flow and vehicle classification, distinguishing between private cars, motorcycles, buses, and vans.
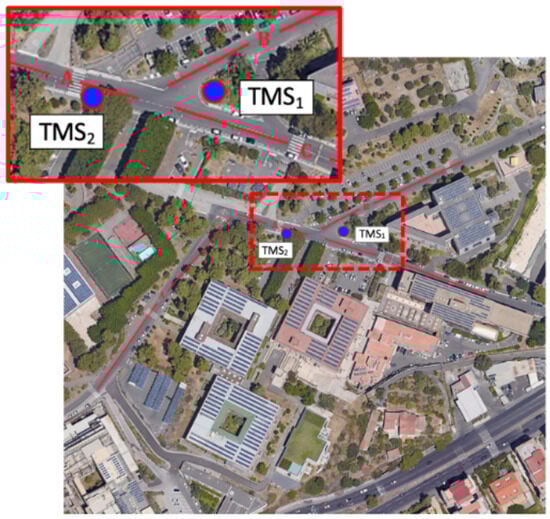
Figure 3.
Road sections A, B, and C and Traffic Monitoring Stations (TMS1 and TMS2).
The collected data enabled the development of detailed origin-destination matrices and the segmentation of vehicular flows along the three internal road sections. The recorded values are summarized in Table 2 and were subsequently input into the ENVI-met simulation model as stationary linear emission sources using the “Sources” module of the Database Manager. Each source was parameterized based on traffic volume, vehicle fleet composition, and emission rates calculated for each segment.
Table 2.
Road flow values for the three main sections are inserted in the “Sources” area.
Simultaneously, air quality measurements were carried out using Aeroqual S500 portable sensors (Aeroqual Ltd, Auckland, New Zealand), placed both at the TMS1 and TMS2 stations and at six additional locations corresponding to specific receptors, described in Section 2.6. The selection of these receptors was based on the following criteria: proximity to the main entrances of academic buildings and student residences and the presence of pedestrian crossings and high-traffic footpaths. At each of these locations, particulate matter concentrations (PM10 and PM2.5) were measured through sampling conducted between 8:00 a.m. and 2:00 p.m., with the aim of assessing the local environmental quality and enabling subsequent comparison with simulation results.
Additionally, continuous monitoring was performed at the TMS1 station for the entire duration of the same time window in order to support the validation process of the ENVI-met model, as described in Section 2.5. For the air quality component as well, the entire experimental setup was designed with attention to spatial and temporal consistency to ensure robustness and reliability in the model-based analyses.
The Aeroqual S500 sensors were configured to acquire data at high sampling frequencies, allowing the detection of short-term variations in pollutant concentrations. The technical specifications of the sensors are presented in Table 3.
Table 3.
Technical features of the Aeroqual S500 portable sensor.
Meteorological input data for ENVI-met calibration were collected using a Davis Vantage Pro 2 weather station (Davis Instruments Corp., Hayward, CA, USA) installed on the rooftop of a campus building. The station recorded air temperature, relative humidity, wind speed, and wind direction every 5 min, providing consistent and localized climatic data. The technical characteristics of the station are presented in Table 4. In addition, solar radiation values (global, direct, and diffuse irradiance) were retrieved from the SIAS station (Sicilian Agrometeorological Information Service), located near the study area, to improve the accuracy of radiation modeling.
Table 4.
Technical features of the Davis Vantage Pro 2 stationary weather station.
Finally, to ensure the external validity of the data collected, a comparison was made with reference values from the nearest ARPA (Regional Environmental Protection Agency) monitoring station. The consistency between datasets confirmed the reliability and representativeness of the locally collected information, which was used in the subsequent modeling phases.
2.2. ENVI-Met Model Setup and Calibration
The simulation domain was configured within ENVI-met V5.6 to replicate the microclimatic and pollutant dispersion conditions of the university campus of Catania. The selected area spans approximately 360 m × 360 m with a vertical domain extending up to 50 m. The computational grid consists of 180 × 180 × 25 cells, each 2 m in width, length, and height, with telescopic stretching above 20 m in the vertical direction to optimize simulation efficiency. To reduce boundary effects, six nested grid cells were applied at each edge.
To accurately reproduce the topography, Digital Elevation Models (DEMs) were incorporated into the model setup. This allowed the terrain’s natural slope and local altitude variations to influence airflow and surface temperature distribution, improving the physical reliability of the microclimate simulations. Figure 4 displays the modeled domain under the baseline scenario, both with (Figure 4a) and without (Figure 4b) the DEM.
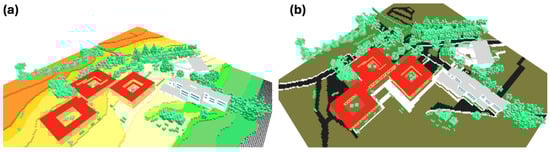
Figure 4.
Baseline scenario modeled in ENVI-met: (a) with the inclusion of the Digital Elevation Model (DEM); (b) without the inclusion of the DEM.
Urban materials used in the simulation were classified into six surface types, each assigned with specific values of albedo (ρ) and thermal emittance (ε), as shown in Table 5. These values reflect the typical properties of surfaces found on campus, such as asphalt, concrete, and plastered building walls. The albedo and emissivity values were extracted from the general ENVI-met database and are consistent with those reported in several studies and scientific papers [64,65,66,67,68].
Table 5.
Thermal and optical properties of input materials in ENVI-met.
Vegetation was also carefully parameterized. Tree canopies, hedges, and grass layers were modeled with detailed inputs on albedo, emissivity, and Leaf Area Density (LAD). Table 6 reports the thermophysical properties assigned to the various plant types simulated in the model, which include coniferous and deciduous trees, shrubs, and grass with realistic heights and densities based on on-site surveys [64,65,66,67,68].
Table 6.
Thermo-physical and optical properties of plants included in the model.
The setup phase concluded with a preliminary simulation run to calibrate the model using meteorological inputs collected from a Davis Vantage Pro 2 station and pollution data from Aeroqual sensors. This calibration ensured consistency between modeled and observed microclimatic conditions before implementing the mitigation scenarios.
2.3. Simulation Framework
The simulation framework integrates traffic emission modeling, pollutant dispersion, and outdoor thermal comfort evaluation within a unified and coherent microscale approach, implemented using the ENVI-met software. This holistic method allows for the simultaneous assessment of environmental variables that are usually treated separately, offering a more comprehensive view of the interactions between mobility patterns, atmospheric conditions, and built form. Traffic data collected from the extensive monitoring campaign were used to calculate the emission rates of PM10 and PM2.5, applying vehicle-specific emission factors obtained from internationally recognized databases, such as COPERT and the EMEP/EEA Guidebook. These emissions were input into ENVI-met using the “Sources” module, where urban roads were represented as linear stationary emitters positioned at a standardized height of 0.3 m, reflecting the average exhaust outlet of light-duty vehicles. Each emission line was defined by three key parameters: hourly traffic flow, the proportional composition of the local vehicle fleet, and the corresponding emission intensity (expressed in µg/m2/s).
Pollutant dispersion was simulated through the CFD-based module integrated into ENVI-met, which employs a high-resolution Eulerian approach to solve the advection-diffusion equation under complex urban boundary conditions. The model incorporates several physical processes that influence the behavior of airborne particles, including advection driven by prevailing winds, gravitational settling, and dry deposition on both artificial and vegetated surfaces. Particular attention is given to the role of urban morphology, as elements such as tall buildings, narrow street canyons, and open courtyards can generate turbulence, channeling, or stagnation zones that influence pollutant accumulation and dispersion patterns. These geometric characteristics were incorporated into the simulation domain using detailed 3D representations of the study area.
To evaluate thermal comfort, ENVI-met computed the Mean Radiant Temperature (MRT) and the Universal Thermal Climate Index (UTCI) at high spatial and temporal resolutions. MRT quantifies the overall radiative load on the human body by integrating the effects of shortwave and longwave radiation from buildings, vegetation, and the sky dome. The model uses the formulation from VDI 3787 [69], combining Stefan–Boltzmann’s law, directional view factors, and fixed coefficients for emissivity (εp = 0.97) and shortwave absorption (αp = 0.7) [70,71,72,73]. Recent studies have shown that Mean Radiant Temperature (MRT) plays a central role in determining outdoor thermal comfort, especially in highly urbanized and sun-exposed environments. According to ISO 7726 and the German VDI 3787 Part 2 standard, outdoor MRT values below 30 °C are typically associated with neutral or slightly warm thermal sensations under moderate air temperature and wind conditions, while values exceeding 40 °C often indicate strong or extreme heat stress, particularly when coupled with low wind speed and high humidity [74,75,76]. Studies have suggested that MRT thresholds of 35–40 °C represent the upper limits of thermal acceptability for pedestrian comfort in Mediterranean summer conditions [77,78].
UTCI was selected as a complementary index for its robustness in characterizing dynamic thermal stress conditions. It is based on a sophisticated multi-node human thermoregulation model developed by Fiala et al. [79,80,81,82], simulating 187 tissue nodes across 12 body segments. UTCI calculations incorporate meteorological parameters such as air temperature, wind speed, humidity, and MRT, along with metabolic activity and clothing insulation values. In this study, a metabolic rate of 2.3 MET (135 W) was assumed. Thermal stress categories were classified according to the internationally validated UTCI classification system, ranging from extreme cold to extreme heat, as detailed in Table 7 [83].
Table 7.
Thermal sensations and different groups in UTCI.
This integrated modeling approach supports a realistic and detailed assessment of the environmental performance of different urban design strategies, ensuring comparability across scenarios. It plays a central role in evaluating the effectiveness of the mitigation interventions described in Section 2.4.
2.4. Scenario Development
To assess the effectiveness of different mitigation strategies in reducing air pollution and improving outdoor thermal comfort, two design scenarios were developed and simulated using the calibrated ENVI-met model. Both scenarios were compared to the current configuration of the university campus, which serves as the baseline scenario, with a focus on spatial variations in PM concentrations and thermal comfort indicators such as MRT and UTCI.
The two scenarios were specifically designed to test the influence of traffic reduction as a key variable affecting environmental outcomes. Scenario 1 was conceived as a high-intensity traffic mitigation scenario, involving strong interventions to reduce vehicular circulation and assess the maximum achievable benefits through mobility-focused actions. Scenario 2, by contrast, was developed to explore whether a more moderate and politically feasible reduction in traffic could still deliver comparable environmental improvements if combined with more substantial material and vegetative interventions.
Importantly, both scenarios follow an integrated approach, combining mobility strategies with physical transformations of the urban space in order to assess potential synergies between traffic management and environmental design.
Scenario 2, in particular, was also intended to evaluate whether solutions such as photocatalytic pavements, permeable surfaces, and increased greenery could partially compensate for the more limited traffic reduction while still ensuring measurable benefits in terms of air quality and thermal comfort. This structure reflects realistic urban planning practices where mobility constraints are moderate but supported by spatial and material innovation.
Scenario 1 emphasizes a strong reduction in traffic volume (−50%) through the introduction of mini-roundabouts, raised pedestrian crossings, and redesigned road layouts aimed at reducing vehicle speeds and promoting walkability. Green interventions are limited to the planting of small trees and shrubs at strategic locations such as building entrances and pedestrian paths. The spatial configuration of Scenario 1 is illustrated in Figure 5.
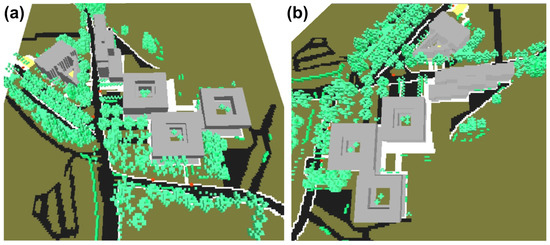
Figure 5.
(a,b) Two different 3D perspectives of Scenario n. 1 simulated with ENVI-met.
Scenario 2, in contrast, applies a 30% traffic reduction and prioritizes enhanced environmental interventions, including a higher density of vegetation, the addition of medium-to-large canopy trees along major roads, the replacement of asphalt parking areas with permeable pavements, and the resurfacing of pedestrian paths with photocatalytic materials. These interventions are illustrated in Figure 6.
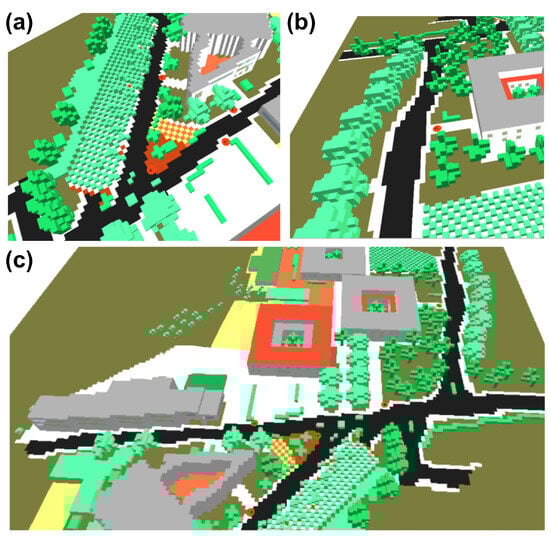
Figure 6.
Detailed 3D views of Scenario 2 simulated with ENVI-met: (a) draining pavement in a redesigned parking area; (b) tree rows along a main road; (c) upgraded pedestrian paths with photocatalytic paving.
A total of 6480 m2 was renovated in Scenario 2: 2450 m2 (37.8%) with draining pavements and 4030 m2 (62.2%) with photocatalytic pavements, as summarized in Table 8. Materials were selected based on their thermal and optical properties, ensuring both functional performance and visual compatibility with the campus context.
Table 8.
Surface cover (%) treated with draining and photocatalytic pavements and their optical properties.
The Green Cover Ratio (GCR) in Scenario 2 increased to 10.2%, compared to 8.0% in the baseline and 8.8% in Scenario 1, corresponding to relative improvements of +26% and +15.5%, respectively. Vegetation types used in both scenarios include deciduous and coniferous trees, dense hedges, and grass cover, selected for their shading potential, physiological resilience, and suitability for Mediterranean climate conditions.
To facilitate a direct and concise comparison between the two proposed strategies, Table 9 summarizes the main characteristics of Scenario 1 and Scenario 2. The table highlights differences in traffic reduction intensity, green coverage, material treatments, and design approaches, offering a synthetic overview that supports the subsequent impact assessment.
Table 9.
Summary of the main variables and interventions in Scenario 1 and Scenario 2.
Overall, the dual-scenario structure allows for a realistic comparison of urban mitigation strategies with varying levels of ambition and feasibility, providing practical insights for environmental planning in university campuses and urban areas located in warm-temperate climates. The results of these simulations form the basis for the impact assessment presented in Section 2.6.
2.5. Model Validation and Statistical Analysis
To ensure the reliability of the simulation outputs generated by the ENVI-met model, a validation procedure was carried out by comparing simulated values of air pollutants (PM10 and PM2.5) and microclimatic parameters with experimental measurements collected on-site during the monitoring campaign. This step was essential to verify the model’s performance and support the credibility of subsequent impact assessments.
The validation process involved both temporal and spatial comparisons between measured and simulated data, focusing on the time window between 8:00 and 14:00. Continuous measurements of PM10 and PM2.5 at Traffic Monitoring Station TMS1 provided high-resolution reference data for model evaluation. Additional comparisons were made at selected receptor locations, where both air quality and thermal comfort parameters were recorded.
To evaluate model performance, the following statistical indices were used:
- Mean Absolute Error (MAE): quantifies the average magnitude of errors between measured and simulated data, regardless of direction. Lower MAE values indicate better agreement.
- Bland-Altman index (μ): calculates the average difference between simulated and observed values and provides upper and lower acceptance limits based on the standard deviation. This index is useful for detecting potential biases and assessing data consistency.
- Coefficient of determination (R2): represents the proportion of variance in the measured data explained by the simulated values. It ranges from 0 to 1, with values closer to 1 indicating stronger correlation and better predictive performance.
These indices were calculated separately for PM10, PM2.5, air temperature, and UTCI at multiple receptor points within the study area.
2.6. Impact Assessment Strategy
To evaluate the effectiveness of the proposed mitigation strategies, a comparative analysis was conducted between the baseline condition and the two alternative scenarios described in Section 2.4. This assessment focused on quantifying variations in both air quality and outdoor thermal comfort parameters, using spatially explicit indicators derived from ENVI-met simulations.
The first phase of the analysis involved generating full-domain maps of PM10, PM2.5, air temperature, MRT, and UTCI for each scenario. These outputs enabled a synoptic understanding of how pollutant dispersion and thermal stress conditions evolved under different urban configurations. Key environmental indicators were examined during the most critical hours of the day (8:00–14:00), corresponding to the time window of the measurement campaign and peak campus activity.
To complement this domain-wide analysis, a targeted receptor-based evaluation was carried out. Eight representative receptors were selected within the study area (Figure 7), including entrances to academic buildings, pedestrian crossings, internal courtyards, and other zones with high pedestrian exposure. The selection aimed to capture the most sensitive locations from both a climatic and an environmental perspective.
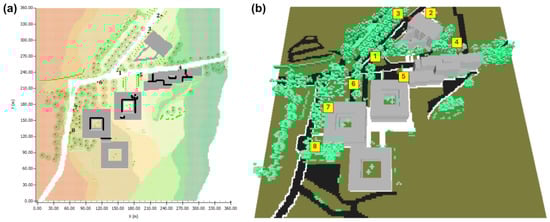
Figure 7.
Location of the eight receptors: (a) 2D top view including x and y coordinates; (b) 3D model view of the study area simulated with ENVI-met.
At each receptor, simulated values of PM10, PM2.5, MRT, and UTCI were extracted and compared across the three scenarios. These data were then analyzed to determine local improvements or deteriorations resulting from the mitigation interventions. Table 10 summarizes the spatial coordinates of the receptors and specifies the mitigation measures planned at each location under Scenarios 1 and 2.
Table 10.
Planned interventions for optimizing the microclimatic comfort of receptors.
This receptor-based approach enabled a precise assessment of localized effects, capturing microclimatic variations that may not be fully evident in domain-scale outputs. The strategy also allowed for identifying which types of interventions yielded the most significant environmental benefits in specific contexts, supporting a more nuanced and site-responsive design logic.
3. Results and Discussion
3.1. Validation of the Numerical Model
The reliability of the ENVI-met model in reproducing the measured concentrations of PM2.5 and PM10 was assessed using the statistical indicators described in Section 2.5, based on the data collected by portable sensors during the monitoring campaign. In particular, continuous measurements carried out at Traffic Monitoring Station TMS1 provided a high-resolution dataset suitable for direct comparison with simulation results. Figure 8 illustrates the comparison between the measured and simulated hourly concentrations of PM10 and PM2.5.
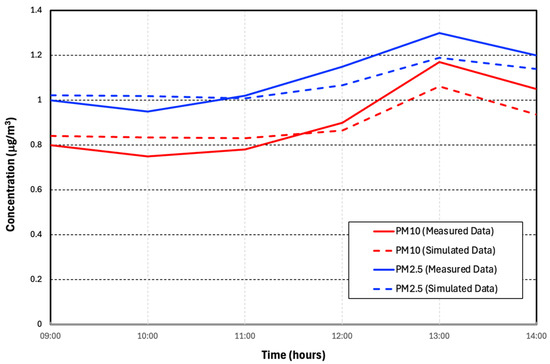
Figure 8.
Comparison between measured and simulated hourly concentrations of PM10 and PM2.5.
The observed hourly concentration profile ranged from 0.95 μg/m3 to 1.3 μg/m3 for PM2.5, and from 0.75 μg/m3 to 1.17 μg/m3 for PM10. These values are consistent with the prevailing traffic conditions, characterized by a low-emission vehicle fleet and the absence of congestion. Under such conditions, the contribution of particulate matter from exhaust, brakes, and tires is limited [84]. Moreover, the open campus morphology, low-rise buildings, and good natural ventilation support pollutant dispersion and help maintain low concentration levels. Similar outcomes have been documented in other studies conducted in comparable urban environments [85]. The key statistical indicators used to evaluate the model’s performance are presented in Table 11.
Table 11.
Statistical validation indices of the ENVI-met model.
The results of the statistical analysis provide robust evidence of the ENVI-met model’s reliability in simulating the dispersion of PM10 and PM2.5. The coefficients of determination (R2), which approach 0.80 for both pollutants, indicate a strong linear relationship between measured and simulated values and confirm the model’s ability to reproduce a substantial portion of the variability observed in the experimental data. The Mean Absolute Error (MAE) values are remarkably low, highlighting the model’s accuracy in replicating the temporal dynamics of the observed concentrations. These results are further supported by the Bland–Altman analysis, which shows minimal mean differences and narrow acceptance limits, all within the ranges considered acceptable by current standards. Taken together, these indicators confirm the solid performance of the ENVI-met model in representing particulate matter distribution under the specific environmental and traffic conditions analyzed in this study.
Although the recorded PM10 and PM2.5 concentrations were well below regulatory thresholds, the site was not selected due to high pollution levels but for its representativeness. The university campus combines several microclimatic vulnerability factors—high pedestrian density, intense solar radiation, limited vegetation, and internal vehicular circulation—which make it an ideal testbed for assessing integrated mitigation strategies under typical Mediterranean urban conditions.
3.2. Comparative Analysis of the Investigated Scenarios
This section presents a comparative evaluation of the three simulated scenarios—Baseline, Scenario 1, and Scenario 2—with a dual focus on air quality and outdoor thermal comfort. The objective is to assess the effectiveness of the proposed mitigation strategies in improving environmental conditions across the campus, both in terms of pollutant concentration and microclimatic comfort experienced by users.
To ensure a comprehensive and spatially aware interpretation of the results, the analysis is supported by two complementary visualizations. Figure 9 displays the ENVI-met simulation maps for PM10 and PM2.5 concentrations under each scenario, illustrating how air pollution varies spatially across the study area as a function of traffic intensity, surface types, and vegetation coverage. Figure 10 presents the spatial distributions of MRT and UTCI, providing insight into how thermal conditions change in response to the different interventions. These maps serve to visually contextualize the effectiveness of the design strategies prior to quantitative interpretation. The outputs shown in Figure 9 and Figure 10 refer to the hour between 12:00 and 13:00, which was identified as the period of maximum vehicular traffic during the monitoring campaign. This time window was selected because it best represents the peak exposure conditions in the area. Moreover, the simulation considers the cumulative effect of pollutant emissions from the start of the reference period (8:00 a.m.), thereby accounting for the progressive build-up of particulate matter due to ongoing traffic activity and atmospheric conditions. This approach allows for a more realistic representation of the air quality and thermal comfort impacts resulting from the different mitigation interventions applied in each scenario.
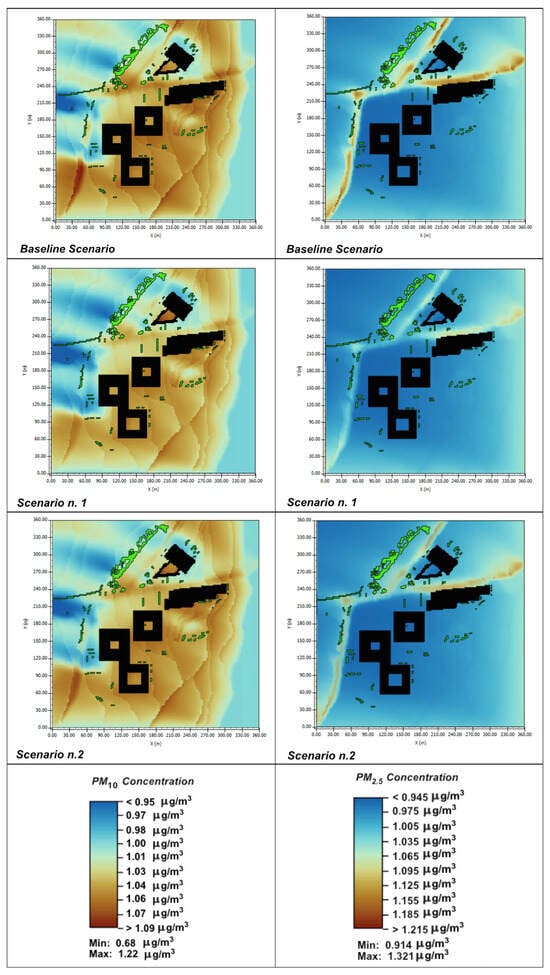
Figure 9.
ENVI-met maps of pollutant concentrations (PM10 and PM2.5) for the considered scenarios.
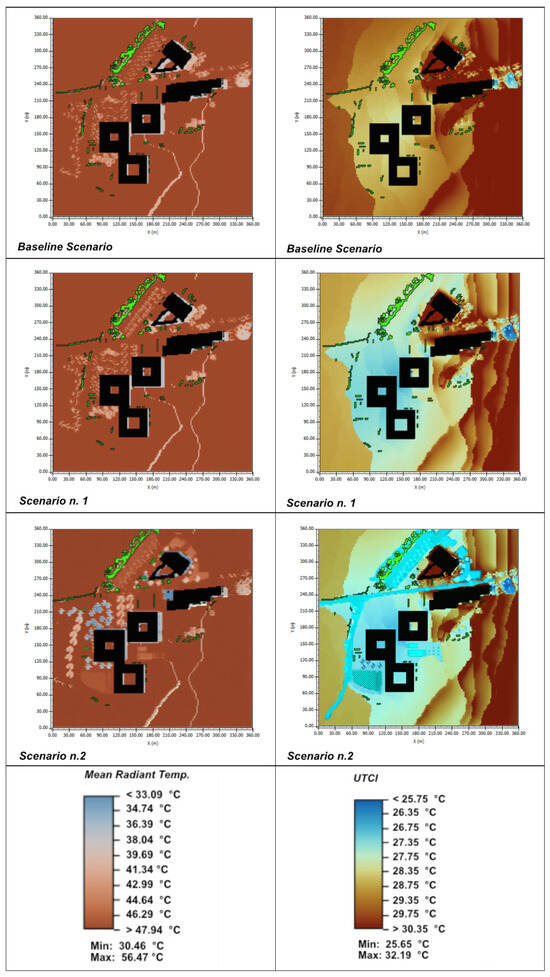
Figure 10.
ENVI-met maps related to MRT and UTCI for the considered scenarios.
Following the spatial analysis, Table 12 and Table 13 report the simulated values of key environmental parameters at the eight representative receptors described in Section 2.5.
Table 12.
Simulated values of PM10 and PM2.5 across scenarios and selected receptors.
Table 13.
Simulated values of MRT and UTCI across scenarios and selected receptors.
These tables allow for a direct comparison of air quality and thermal comfort indicators across the three scenarios, referring specifically to the simulation hour between 12:00 and 13:00. Table 12 presents both absolute and relative variations in PM10 and PM2.5 concentrations, while Table 13 shows the corresponding data for MRT and UTCI. Baseline values and changes under both mitigation scenarios are included, enabling a clear and quantitative assessment of their performance.
The detailed discussion of these results is structured into three subsections. Section 3.2.1 analyzes changes in air quality, focusing on the reduction of coarse and fine particulate matter. Section 3.2.2 evaluates improvements in thermal comfort based on MRT and UTCI indicators. Finally, Section 3.2.3 integrates both dimensions to assess the overall effectiveness of the mitigation strategies and identify synergies between traffic reduction, green infrastructure, and material interventions.
This structured approach allows for both localized and systemic assessments of environmental improvement, providing practical insights for sustainable urban and campus planning.
3.2.1. Air Quality Analysis
This subsection presents the air quality simulation results for the three scenarios under investigation, with a particular focus on PM10 and PM2.5 concentrations. The simulations were performed using the ENVI-met model at pedestrian height (z = 1.0 m) in order to realistically assess the exposure of campus users to atmospheric pollutants during daily activities.
In the baseline scenario, PM10 concentrations ranged from 0.68 to 1.22 μg/m3, while PM2.5 levels varied between 0.914 and 1.321 μg/m3. The highest values were recorded near internal roadways characterized by intense traffic flows, poor ventilation, and the presence of impervious surfaces that promote dust resuspension. These findings confirm that urban morphology and surface material characteristics play a key role in determining the persistence of pollutants near the ground.
The introduction of mitigation scenarios resulted in a systematic reduction of both pollutants. In particular, Scenario 1, which includes a 50% reduction in vehicular traffic combined with targeted interventions in vegetation and street layout, proved significantly more effective than Scenario 2, which involves a smaller traffic reduction (30%) but incorporates extensive greening and the use of permeable and photocatalytic materials.
Specifically, the average PM10 concentration decreased from 1.028 to 0.985 μg/m3 in Scenario 1 (−4.2%) and to 1.019 μg/m3 in Scenario 2 (−0.9%). For PM2.5, levels dropped from 1.078 to 0.997 μg/m3 (−7.5%) in Scenario 1 and to 1.038 μg/m3 (−3.7%) in Scenario 2. These differences were also evident at the receptor level. At receptors 1, 3, 4, and 5—those most exposed to vehicular emissions—the reductions in Scenario 1 were particularly marked, reaching up to −11.5% for PM2.5 (receptor 4) and −5.9% for PM10 (receptor 5). By contrast, the same receptor 4 in Scenario 2 showed more modest reductions of −5.8% for PM2.5 and −1.2% for PM10.
Even at receptors located in more ventilated or less exposed areas (e.g., receptors 6, 7, and 8), Scenario 1 consistently delivered more substantial improvements. For instance, at receptor 8, PM10 decreased from 0.750 to 0.719 μg/m3 (−4.1%), and PM2.5 decreased from 0.950 to 0.925 μg/m3 (−2.6%). In Scenario 2, the reductions at the same receptor were more limited: −0.8% for PM10 and −1.6% for PM2.5.
All these data, represented in Figure 9, clearly illustrate the spatial distribution of PM10 variation across the eight receptors and provide visual confirmation of the greater effectiveness of Scenario 1 in reducing airborne particulate matter.
These results suggest that, while the material and greening interventions in Scenario 2 contribute to localized air quality improvements, the magnitude of traffic reduction remains the primary determining factor. Fine particulate matter (PM2.5), being more persistent and harder to remove, is especially sensitive to changes in vehicular flows and benefits significantly from the combined effects of reduced emissions and improved ventilation resulting from lower traffic volumes.
It is also worth noting that the effectiveness of the interventions depends not only on the magnitude of traffic reduction but also on local urban configuration, the presence of physical barriers to pollutant dispersion (e.g., closely spaced buildings), and the capacity of surfaces and vegetation to function as pollutant sinks. Scenario 1, although less ambitious in terms of vegetation enhancement, demonstrated higher overall efficiency because it directly targets the primary source of air pollution.
In summary, the results are consistent with recent literature [86,87,88], which highlights the value of integrating traffic reduction policies with microscale environmental strategies as an effective approach to improving air quality in dense urban settings. However, to achieve significant and widespread benefits, structural measures must be coupled with a substantial reduction in direct emission sources, particularly internal vehicular traffic.
3.2.2. Outdoor Thermal Comfort
This subsection analyzes the effects of the three simulated scenarios on outdoor thermal comfort, using the Mean Radiant Temperature (MRT) and the Universal Thermal Climate Index (UTCI) as reference indicators, both calculated at pedestrian level (z = 1.0 m). Results are presented in both absolute and percentage terms to highlight the differences between scenarios. The spatial configurations of the three scenarios are illustrated in Figure 10, as simulated through ENVI-met.
In the baseline scenario, MRT values across the selected receptors range from 52.8 °C to 56.5 °C, with an average of approximately 55.0 °C, reflecting extensive impervious surfaces, asphalt-covered areas, parked vehicles, and minimal vegetation. UTCI values range between 27.6 °C and 32.2 °C, averaging around 28.6 °C, indicating conditions of moderate to severe heat stress, especially in zones with low shading and limited ventilation.
Scenario 1, which includes a 50% reduction in vehicular traffic and a moderate increase in vegetated surfaces, achieves the most consistent improvements:
- MRT average: 53.6 °C, with an absolute reduction of 1.43 °C compared to the baseline (−2.6%). The maximum drop occurs at receptor 5, from 55.44 °C to 52.92 °C (−2.52 °C, −4.5%).
- UTCI average: 27.2 °C, showing a decrease of 1.36 °C from baseline (−4.8%). The greatest improvement is observed at receptor 2, where values drop from 28.27 °C to 26.11 °C (−2.16 °C, −7.6%).
Scenario 2, which combines a smaller traffic reduction (30%) with more intensive greening measures and the use of permeable and photocatalytic pavements, also leads to improved thermal comfort, albeit with more localized effects:
- MRT average: 54.0 °C, with an overall reduction of 1.06 °C compared to baseline (−1.9%). The largest decrease is recorded at receptor 5, from 55.44 °C to 53.77 °C (−1.67 °C, −3.0%).
- UTCI average: 27.4 °C, corresponding to a reduction of 1.19 °C (−4.2%). The best result is at receptor 7, with UTCI decreasing from 27.61 °C to 25.65 °C (−1.96 °C, −7.1%).
The comparison clearly shows that Scenario 1 enables reductions of up to 4.5% in MRT and 7.6% in UTCI, outperforming Scenario 2, where maximum improvements reach 3.0% for MRT and 7.1% for UTCI. The greater effectiveness of Scenario 1 is attributed to the direct reduction of anthropogenic heat sources, particularly vehicle engines and asphalt surfaces. Conversely, the material and greening interventions in Scenario 2 play a more complementary role, offering significant but spatially limited cooling benefits.
These results are in line with recent findings in the literature [89,90,91], which confirm that the integration of traffic reduction, green infrastructure, and high-albedo materials constitutes an effective strategy for mitigating urban heat stress. However, to achieve widespread and uniform benefits, it is essential to combine physical and material interventions with substantial cuts in direct heat emissions, especially from internal vehicular circulation.
3.2.3. Integrated Evaluation of Traffic Flows, Air Quality, and Thermal Comfort
This subsection provides an integrated assessment of the simulated effects of the two mitigation strategies on both air quality and outdoor thermal comfort. The analysis, based on data from eight strategically selected receptors, enables a direct comparison of the spatial and environmental performance of the Baseline, Scenario 1, and Scenario 2 configurations. Receptors were placed in areas characterized by diverse morphological and functional conditions, including zones with high pedestrian density, vehicular traffic exposure, and variable vegetation cover.
The comparative results, detailed in Table 12 and Table 13, show that Scenario 1, which implements a 50% reduction in vehicular traffic along with moderate greening interventions, achieves more substantial and consistent improvements than Scenario 2, which features a 30% traffic reduction combined with extensive urban greening and material-based interventions such as photocatalytic pavements and permeable surfaces.
From a quantitative perspective, PM2.5 concentrations decreased by an average of 0.081 μg/m3 (−7.5%) in Scenario 1, compared to a reduction of 0.040 μg/m3 (−3.7%) in Scenario 2. Similarly, PM10 dropped by 0.043 μg/m3 (−4.2%) in Scenario 1 versus only 0.009 μg/m3 (−0.9%) in Scenario 2. For thermal comfort indicators, Scenario 1 yielded an average decrease of 1.43 °C in MRT (−2.6%) and 1.36 °C in UTCI (−4.8%), while Scenario 2 resulted in reductions of 1.06 °C (−1.9%) for MRT and 1.19 °C (−4.2%) for UTCI.
The integrated analysis highlights the strong synergy between reduced traffic volumes and improved microclimatic conditions. Receptors located near main roads and hard surfaces—particularly receptors 3, 4, and 5—recorded the highest reductions in both pollutant concentrations and UTCI values. For instance, at receptor 4, PM2.5 decreased by 0.150 μg/m3 (−11.5%), and UTCI improved by 0.38 °C (−1.2%) in Scenario 1. At receptor 5, the UTCI dropped by 1.12 °C (−3.8%) and MRT by 2.52 °C (−4.5%).
While the more ambitious greening strategy adopted in Scenario 2 produced some localized improvements, particularly in receptor 7 (UTCI −1.96 °C, −7.1%), it was not sufficient to match the overall effectiveness of Scenario 1, which directly addressed the primary source of pollution and thermal load through aggressive traffic mitigation.
Overall, the results support the conclusion that traffic reduction is the dominant factor influencing both air quality and thermal comfort. Vegetation and sustainable materials play a crucial complementary role by enhancing shading, lowering surface temperatures, and capturing pollutants. However, their effectiveness is maximized only when combined with a significant decrease in vehicular flows.
Importantly, these findings are in line with the initial expectations formulated during the design phase of the scenarios. It was hypothesized that a more ambitious traffic reduction (Scenario 1) would outperform a strategy relying more heavily on greening and materials (Scenario 2), even if the latter involved broader spatial interventions. The results confirmed this assumption, demonstrating that Scenario 1 consistently led to greater environmental improvements across all key indicators.
The persistence of thermal stress and pollution hotspots in some receptors, despite mitigation efforts, underscores the need for a more targeted spatial distribution of greening and reflective materials, especially in less ventilated or highly impervious areas.
These findings are consistent with recent studies [89,90,91] that emphasize the importance of integrating mobility policies with urban microclimate interventions. They reinforce the notion that a site-specific, multi-scale strategy, combining traffic calming, urban greening, and high-albedo materials, is essential to achieve effective and equitable environmental improvement in complex urban settings such as university campuses.
4. Conclusions
This study addressed a specific research gap: the lack of integrated assessments comparing the environmental effectiveness of traffic reduction strategies with those based primarily on urban greening and material innovations in dense university settings. In particular, most existing studies have focused on single-variable evaluations or isolated mitigation measures, without validating their combined impact through a unified microscale simulation framework grounded in real-world data.
The core research question was whether greening and material interventions can partially offset a lower level of traffic mitigation while still achieving comparable improvements in air quality and outdoor thermal comfort.
The modeling framework, based on ENVI-met simulations and supported by field measurements, allowed for a detailed evaluation of two alternative scenarios. Scenario 1, focused on a 50% traffic volume reduction with limited greening, was hypothesized to yield stronger improvements in air quality. Scenario 2, featuring a 30% traffic reduction combined with extensive vegetative and material interventions, was expected to improve thermal comfort more substantially.
The results confirmed that traffic reduction remains the most effective driver for improving both air quality and thermal comfort in compact urban areas. Scenario 1 consistently outperformed Scenario 2 across all key indicators, particularly in areas with high pedestrian activity and vehicular exposure. While vegetation and permeable or photocatalytic pavements contributed positively—especially in specific receptors—their effects were not sufficient to compensate for the lesser reduction in emissions under Scenario 2.
These findings have both scientific and practical implications. From a methodological perspective, the study demonstrates the value of integrated, multi-parameter simulation frameworks for assessing trade-offs among mitigation strategies. From a contextual perspective, it highlights the environmental vulnerability of Mediterranean university campuses and the need for place-based, data-driven assessments to guide effective interventions. From a planning perspective, it confirms that meaningful environmental benefits can only be achieved through ambitious traffic calming, supported—but not replaced—by spatial and material enhancements.
Although the simulations were validated and robust, they remain limited to a single meteorological condition. Future research should explore the replicability of these findings under seasonal variations and extreme climate scenarios and integrate a broader range of empirical data to refine calibration and improve transferability.
In summary, the study provides evidence-based guidance for urban planners and campus managers seeking to improve environmental quality in pedestrian-oriented environments. The approach and results are transferable to other compact urban contexts where climate-responsive design and sustainable mobility must be balanced in an integrated strategy.
Author Contributions
Conceptualization, M.D., N.G.L., S.L., N.D., F.N., and V.C.; methodology, M.D., N.G.L., S.L., N.D., F.N., and V.C.; software, M.D. and N.G.L.; validation, M.D., N.G.L., S.L., N.D., and F.N.; formal analysis, M.D., N.G.L., S.L., N.D., F.N., and V.C.; investigation, M.D., N.G.L., S.L., N.D., F.N., and V.C.; resources M.D., N.G.L., S.L., N.D., F.N., and V.C.; data curation, M.D., N.G.L., S.L., and N.D.; writing—original draft preparation, M.D., N.G.L., S.L., N.D., and F.N.; writing—review and editing, M.D., N.G.L., S.L., N.D., F.N., and V.C.; visualization, M.D., N.G.L., S.L., N.D., F.N., and V.C.; supervision, S.L. and F.N.; funding acquisition, S.L. All authors have read and agreed to the published version of the manuscript.
Funding
This work was carried out as part of the project “MO.S.A.I.C.—Monitoraggio satellitare, modellazioni matematiche e soluzioni architettoniche e urbane per lo studio, la previsione e la mitigazione delle isole di calore urbano” (DD.RR. n. 2961—08/10/2019 and n. 3412—05/11/2019), funded by the PIAno di InCEntivi per la Ricerca di Ateneo 2020–2022 (PIA.CE.RI 2020–2022) of the University of Catania. The work was also supported by the Research Project “Green Infrastructure and Renewable Energy for Sustainable Building Development (GREEN)” funded by the PIAno di InCEntivi per la Ricerca di Ateneo 2024–2026 (PIA.CE.RI 2024–2026) of the University of Catania (D.R. del 03.06.2024 rep.n.2306)—Principal Investigator: Prof. Francesco Nocera.
Institutional Review Board Statement
Not applicable.
Informed Consent Statement
Not applicable.
Data Availability Statement
The original contributions presented in this study are included in the article. Further inquiries can be directed to the corresponding author.
Conflicts of Interest
The authors declare no conflicts of interest.
References
- Sun, L.; Chen, J.; Li, Q.; Huang, D. Dramatic uneven urbanization of large cities throughout the world in recent decades. Nat. Commun. 2020, 11, 5366. [Google Scholar] [CrossRef] [PubMed]
- Castells-Quintana, D.; Dienesch, E.; Krause, M. Air pollution in an urban world. A global view on density, cities and emissions. Ecol. Econ. 2021, 189, 107153. [Google Scholar] [CrossRef]
- Santamouris, M.; Cartalis, C.; Synnefa, A.; Kolokotsa, D. On the impact of urban heat island and global warming on the power demand and electricity consumption of buildings—A review. Energy Build. 2015, 98, 119–124. [Google Scholar] [CrossRef]
- Szałata, L.; Derlukiewicz, N.; Mańkowska, D.; Zwoździak, J. Urban challenges and air quality in selected european cities. Environ. Prot. Eng. 2024, 50, 61–75. [Google Scholar] [CrossRef]
- Buccolieri, R.; Gatto, E.; Manisco, M.; Ippolito, F.; Santiago, J.L.; Gao, Z. Characterization of Urban Greening in a District of Lecce (Southern Italy) for the Analysis of CO2 Storage and Air Pollutant Dispersion. Atmosphere 2020, 11, 967. [Google Scholar] [CrossRef]
- El-Madany, T.S.; Niklasch, K.; Klemm, O. Stomatal and Non-Stomatal Turbulent Deposition Flux of Ozone to a Managed Peatland. Atmosphere 2017, 8, 175. [Google Scholar] [CrossRef]
- Chen, X.; Situ, S.; Zhang, Q.; Wang, X.; Sha, C.; Zhouc, L.; Wu, L.; Ye, L.; Li, C. The synergetic control of NO2 and O3 concentrations in a manufacturing city of southern China. Atmos. Environ. 2019, 201, 402–416. [Google Scholar] [CrossRef]
- Liu, J.; Zheng, B.; Xiang, Y.; Fan, J. The Impact of Street Tree Height on PM2.5 Concentration in Street Canyons: A Simulation Study. Sustainability 2022, 14, 12378. [Google Scholar] [CrossRef]
- Zhang, X.; Wang, Y.; Li, Z. Sources and Mitigation of Vehicular Pollution. Environ. Pollut. 2021, 280, 116971. [Google Scholar] [CrossRef]
- Piracha, A.; Chaudhary, M.T. Urban Air Pollution, Urban Heat Island and Human Health: A Review of the Literature. Sustainability 2022, 14, 9234. [Google Scholar] [CrossRef]
- Bayer-Oglesby, L.; Schindler, C.; Hazenkamp-von Arx, M.E.; Braun-Fahrlander, C.; Kiedel, D.; Rapp, R.; Kunzli, N.; Braendli, O.; Burdet, L.; Liu, L.-J.S.; et al. Living near Main Streets and Respiratory Symptoms in Adults: The Swiss Cohort Study on Air Pollution and Lung Diseases in Adults. Am. J. Epidemiol. 2006, 164, 1190–1198. [Google Scholar] [CrossRef] [PubMed]
- NSW Health. Particulate Matter (PM10 and PM2.5). 2021. Available online: https://www.health.nsw.gov.au/environment/air/Pages/particulate-matter.aspx (accessed on 3 March 2025).
- World Health Organization (WHO). WHO Global Air Quality Guidelines: Particulate Matter (PM2.5 and PM10), Ozone, Nitrogen Dioxide, Sulfur Dioxide and Carbon Monoxide; World Health Organization: Geneva, Switzerland, 2021; ISBN 9789240034228. [Google Scholar]
- European Parliament and Council of the European Union. Directive 2008/50/EC of the European Parliament and of the Council of 21 May 2008 on Ambient Air Quality and Cleaner Air for Europe. Off. J. Eur. Union 2008, L152, 1–44. [Google Scholar]
- Taleghani, M. Impact of Urban Heat Island on Pedestrian Comfort. Renew. Sustain. Energy Rev. 2018, 82, 531–544. [Google Scholar] [CrossRef]
- Coccolo, S.; Kämpf, J.H.; Scartezzini, J.L.; Pearlmutter, D. Climate-responsive Campus Planning. Build. Environ. 2018, 145, 234–246. [Google Scholar] [CrossRef]
- Xu, Y.; Zhan, X.; Zhang, Y.; Ji, J. Design of Sustainable Campus Spaces Based on Multidimensional Construction Theory. Econ. Soc. Humanit. 2024, 1, 50–55. [Google Scholar] [CrossRef]
- Huang, Y.; Li, J.; Zhao, L. Reflective Materials for Urban Heat Reduction. Energy Build. 2020, 224, 110238. [Google Scholar] [CrossRef]
- Yang, X.; Wang, J.; He, Y. Urban Heat Island Mitigation Using High-Reflective Surfaces. Environ. Res. 2023, 220, 115083. [Google Scholar]
- Karagulian, F.; Belis, C.A.; Dora, C.F.C.; Prüss-Ustün, A.M.; Bonjour, S.; Adair-Rohani, H.; Amann, M. Contributions to cities’ ambient particulate matter (PM): A systematic review of local source contributions at global level. Atmos. Environ. 2015, 120, 475–483. [Google Scholar] [CrossRef]
- Vailshery, L.S.; Jaganmohan, M.; Nagendra, H. Effect of street trees on microclimate and air pollution in a tropical city. Urban For. Urban Green. 2013, 12, 408–415. [Google Scholar] [CrossRef]
- Lindén, J.; Gustafsson, M.; Uddling, J.; Watne, Å.; Pleijel, H. Air pollution removal through deposition on urban vegetation: The importance of vegetation characteristics. Urban For. Urban Green. 2023, 81, 127843. [Google Scholar] [CrossRef]
- Da Rios, G.; Lambrugo, S.; Bacchi, M. Analisi sperimentale per pavimentazioni urbane fotocatalitiche. In Proceedings of the XVII Convegno Nazionale S.I.I.V., Enna, Italy, 10–12 September 2008; Available online: https://www.siiv.net/site/sites/default/files/Documenti/enna/63_2848_20080919091350.pdf (accessed on 18 February 2025).
- Wu, Q.; Huang, Y.; Irga, P.; Kumar, P.; Li, W.; Wei, W.; Shon, H.K.; Lei, C.; Zhou, J.L. Synergistic Control of Urban Heat Island and Urban Pollution Island Effects Using Green Infrastructure. J. Environ. Manag. 2024, 350, 122985. [Google Scholar] [CrossRef] [PubMed]
- Nowak, D.J.; Crane, D.E.; Stevens, J.C. The Role of Vegetation in Pollution Reduction. Environ. Pollut. 2020, 263, 114356. [Google Scholar] [CrossRef]
- Morakinyo, T.E.; DahanayakeKalani, K.W.D.C.; Ng, E.; Chow, C.L. Temperature and cooling demand reduction by green-roof types in different climates and urban densities: A co-simulation parametric study. Energy Build. 2017, 145, 226–237. [Google Scholar] [CrossRef]
- Miao, C.; Chen, W.; Yu, S. Assessing Ozone Distribution Vertically and Horizontally in Urban Street Canyons Based on Field Investigation and ENVI-met Modelling. Buildings 2022, 12, 262. [Google Scholar] [CrossRef]
- Coates, J.; Mar, K.A.; Ojha, N.; Butler, T.M. The influence of temperature on ozone production under varying NOx conditions– A modelling study. Atmos. Chem. Phys. 2016, 15, 11601–11615. [Google Scholar] [CrossRef]
- Mei, Y.; Liu, J. Bi-objective Optimization of Traffic Assignment with Air Quality Consideration via CFD-based Surrogate Model. Sustain. Cities Soc. 2023, 91, 104425. [Google Scholar] [CrossRef]
- Pasquier, M.; Jay, S.; Jacob, J.; Sagaut, P. A Lattice-Boltzmann-based modeling chain for traffic-related atmospheric pollutant dispersion at the local urban scale. Build. Environ. 2023, 242, 110562. [Google Scholar] [CrossRef]
- Ioannidis, V.; Li, X.; Boikos, C.; Jay, S.; Matthaios, V.; Helmis, C. Application of CFD Modelling for Pollutant Dispersion at an Urban Traffic Hotspot in Augsburg. Atmosphere 2024, 15, 42. [Google Scholar] [CrossRef]
- Boikos, C.; Ioannidis, G.; Rapkos, N.; Tsegas, G.; Katsis, P.; Ntziachristos, L. Estimating daily road traffic pollution in Hong Kong using CFD modelling: Validation and application. Build. Environ. 2025, 267 Pt 2, 112168. [Google Scholar] [CrossRef]
- Füssel, H.M.; Jol, A.; Kurnik, B.; Hemming, D. Climate Change, Impacts and Vulnerability in Europe 2012: An Indicator-Based Report; The European Environment Agency: Copenhagen, Denmark, 2012. [Google Scholar]
- Ulpiani, G. On the linkage between urban heat island and urban pollution island: Three-decade literature review towards a conceptual framework. Sci. Total Environ. 2021, 751, 141727. [Google Scholar] [CrossRef]
- Brozovsky, J.; Mahmood, R.; Leung, L.R. Urban Morphology and Microclimate Interactions. Atmosphere 2019, 10, 282 . [Google Scholar] [CrossRef]
- Matviienko, M. ENVI-MET Model as a Tool for Modern Urban Meteorological Studies. Hydrol. Hydrochem. Hydroecol. 2019, 4, 92–96. [Google Scholar] [CrossRef]
- Muñoz, L.S.; Duarte, D.H.S. Green Infrastructure as a Planning Tool: A Comprehensive Systematization of Urban Redesign Strategies to Increase Vegetation within Public Places. Cities 2025, 156, 105551. [Google Scholar] [CrossRef]
- Santamouris, M.; Synnefa, A.; Kolokotsa, D. Passive Cooling Strategies for Urban Areas. Energy Build. 2020, 214, 109858. [Google Scholar] [CrossRef]
- Shata, R.; Mohamed, M.F.; El-Banna, M. Pavement Materials and Thermal Effects in Campus Environments. Sustain. Cities Soc. 2021, 66, 102688. [Google Scholar] [CrossRef]
- Kasim, R.; Sulaiman, M.H.; Hassan, A.S. Influence of Green Infrastructure on Heat Mitigation. J. Build. Eng. 2019, 25, 100791. [Google Scholar] [CrossRef]
- Yuan, C.; Norford, L.; Ng, E. A semi-empirical model for the effect of trees on the urban wind environment. Landsc. Urban Plan. 2017, 168, 84–93. [Google Scholar] [CrossRef]
- Karaaslan, M.; Ali, T.H.; Kareem, I.M.; Dhuoki, R.M.S.B.; Ahmed, A.M. Assessing Microclimate and Green Space at Nawroz University Using Climate Model ENVI-Met Simulation. Environ. Res. Eng. Manag. 2024, 80, 39–47. [Google Scholar] [CrossRef]
- Liu, X.; He, J.; Song, J. Evaluating the Role of Urban Vegetation in Mitigating Heat and Pollution Using ENVI-met. Build. Environ. 2022, 217, 109036. [Google Scholar] [CrossRef]
- Savinda Heshani, M.; Winijkul, E. The Effect of Urban Greenery on Air Quality in High-Density Areas: An ENVI-met Simulation Approach. Atmos. Pollut. Res. 2022, 13, 101325 . [Google Scholar] [CrossRef]
- Sharmin, T.; Steemers, K.; Matzarakis, A. Microclimatic Modelling in Assessing the Impact of Urban Geometry on Urban Thermal Environment. Sustain. Cities Soc. 2017, 34, 293–308. [Google Scholar] [CrossRef]
- Eingrüber, N.; Bruse, M.; Papp, K. Investigation of the ENVI-met Model Sensitivity to Different Wind Direction Forcing Data. Adv. Sci. Res. 2023, 20, 65–73. [Google Scholar] [CrossRef]
- Chatzinikolaou, E.; Nikolopoulou, M.; Nikolopoulos, N. Urban Microclimate Improvement Using ENVI-Met Climate Model. Int. Arch. Photogramm. Remote Sens. Spatial Inf. Sci. 2018, XLII-4, 69–76. [Google Scholar] [CrossRef]
- Roth, M.; Lim, V.H. Evaluation of Canopy-layer Air and Mean Radiant Temperature Simulations by a Microclimate Model Over a Tropical Residential Neighbourhood. Build. Environ. 2017, 112, 177–189. [Google Scholar] [CrossRef]
- Wang, Y.; Zhou, D.; Wang, Y.; Fang, Y.; Yuan, Y.; Lv, L. Comparative Study of Urban Residential Design and Microclimate Characteristics Based on ENVI-met Simulation. Indoor Built Environ. 2019, 28, 1200–1216. [Google Scholar] [CrossRef]
- Lindberg, F.; Grimmond, C.S.B. The influence of vegetation and building morphology on shadow patterns and mean radiant temperatures in urban areas: Model development and evaluation. Theor. Appl. Climatol. 2011, 105, 311–323. [Google Scholar] [CrossRef]
- Ernst, M.; Le Mentec, S.; Louvrier, M.; Loubet, B.; Personne, E.; Stella, P. Impact of urban greening on microclimate and air quality in the urban canopy layer: Identification of knowledge gaps and challenges. Front. Environ. Sci. 2022, 10, 924742. [Google Scholar] [CrossRef]
- Morakinyo, T.E.; Ouyang, W.; Ka-Lun Lau, K.; Ren, C.; Ng, E. Right tree, right place (urban canyon): Tree species selection approach for optimum urban heat mitigation—Development and evaluation. Sci. Total Environ. 2020, 719, 137461. [Google Scholar] [CrossRef]
- Cruz, J.A.; Blanco, A.C.; Garcia, J.J.; Santos, J.A.; Moscoso, A.D. Evaluation of the cooling effect of green and blue spaces on urban microclimate through numerical simulation: A case study of Iloilo River Esplanade, Philippines. Sustain. Cities Soc. 2021, 74, 103184. [Google Scholar] [CrossRef]
- Gatto, E.; Ippolito, F.; Rispoli, G.; Carlo, O.S.; Santiago, J.L.; Aarrevaara, E.; Emmanuel, R.; Buccolieri, R. Analysis of urban greening scenarios for improving outdoor thermal comfort in neighbourhoods of Lecce (southern Italy). Climate 2021, 9, 116. [Google Scholar] [CrossRef]
- Mahdavinejad, M.; Salehnejad, H.; Moradi, N. An ENVI-met simulation study on influence of urban vegetation congestion on pollution dispersion. Asian J. Water Environ. 2018, 15, 187–194. [Google Scholar] [CrossRef]
- Moradpour, M.; Afshin, H.; Farhanieh, B. A Numerical Study of Reactive Pollutant Dispersion in Street Canyons with Green Roofs. Build. Simulat. 2018, 11, 125–138. [Google Scholar] [CrossRef]
- Coutts, A.M.; White, E.C.; Tapper, N.J.; Beringer, J.; Livesley, S.J. Temperature and human thermal comfort effects of street trees across three contrasting street canyon environments. Theor. Appl. Climatol. 2016, 124, 55–68. [Google Scholar] [CrossRef]
- Djekic, J.; Djukic, A.; Vukmirovic, M.; Djekic, P.; Dinic Brankovic, M. Thermal comfort of pedestrian spaces and the influence of pavement materials on warming up during summer. Energy Build. 2018, 159, 474–485. [Google Scholar] [CrossRef]
- Sánchez, J.M.; Ortega, E.; López-Lambas, M.E.; Martín, B. Evaluation of emissions in traffic reduction and pedestrianization scenarios in Madrid. Transp. Res. D Transp. Environ. 2021, 100, 103064 . [Google Scholar] [CrossRef]
- Kornyei, L.; Horváth, Z.; Ruopp, A.; Kovács, Á.; Liszkai, B. Multi-scale Modelling of Urban Air Pollution with Coupled Weather Forecast and Traffic Simulation on HPC Architecture. In Proceedings of the HPC Asia 2021: The International Conference on High Performance Computing in Asia-Pacific Region, Virtual, 20–22 January 2021; pp. 9–10. [Google Scholar] [CrossRef]
- Amorim, J.H.; Lopes, M.; Borrego, C.; Tavares, R.; Miranda, A.I. Air Quality Modelling As A Tool For Sustainable Urban Traffic Management. WIT Trans. Ecol. Environ. 2010, 136, 3–14. [Google Scholar] [CrossRef]
- Distefano, N.; Leonardi, S.; Liotta, N.G. Walking for sustainable cities: Factors affecting users’ willingness to walk. Sustainability 2023, 15, 5684. [Google Scholar] [CrossRef]
- Rahman, M.A.; Stratopoulos, L.M.F.; Moser-Reischl, A.; Zölch, T.; Häberle, K.H.; Rötzer, T.; Pretzsch, H.; Pauleit, S. Traits of Trees for Cooling Urban Heat Islands: A Meta-Analysis. Build. Environ. 2020, 170, 106606. [Google Scholar] [CrossRef]
- Paolini, R.; Terraneo, G.; Ferrari, C.; Sleiman, M.; Muscio, A.; Metrangolo, P.; Poli, T.; Destaillats, H.; Zinzi, M.; Levinson, R. Effects of soiling and weathering on the albedo of building envelope materials: Lessons learned from natural exposure in two European cities and tuning of a laboratory simulation practice. Sol. Energy Mater. Sol. Cells 2020, 205, 110264. [Google Scholar] [CrossRef]
- Carotenuto, F.; Brilli, L.; De Luca, G.; Nardino, M.; Cremonini, L.; Genesio, L.; Pancorbo, J.L.; Gioli, B. Emission offsets by albedo manipulations strategies based on bright materials and greening in urban areas assessed by hyperspectral remote sensing. Urban Clim. 2025, 60, 102357. [Google Scholar] [CrossRef]
- Ponce, V.M. Surface Albedo and Water Resources; San Diego State University: San Diego, CA, USA, 2004; Available online: https://ponce.sdsu.edu/surface_albedo_and_water_resources.html (accessed on 8 May 2025).
- Abd El-Hakim, R.; El-Badawy, S. Quantifying effects of urban heat islands: State of the art. In Counteracting Urban Heat Island Effects in a Global Climate Change Scenario; Musco, F., Ed.; Springer: Berlin/Heidelberg, Germany, 2019; pp. 42–69. [Google Scholar] [CrossRef]
- Pasetto, M.; Baliello, A.; Pasquini, E.; Giacomello, G. High albedo pavement materials. In Eco-Efficient Materials for Reducing Cooling Needs in Buildings and Construction; Pacheco-Torgal, F., Ed.; Woodhead Publishing: Sawston, UK, 2021; pp. 15–32. [Google Scholar] [CrossRef]
- Verein Deutscher Ingenieure (VDI). VDI 3783 Part 1: Environmental Meteorology—Atmospheric Dispersion Models—Fundamentals; VDI: Düsseldorf, Germany, 1998. [Google Scholar]
- American Society of Heating, Refrigerating & Air Conditioning Engineers, Inc. ASHRAE Fundamentals Handbook 2001 (SI Edition); ASHRAE Handbook series; American Society of Heating, Refrigerating & Air Conditioning Engineers, Inc.: Peachtree Corners, GA, USA, 2001. [Google Scholar]
- Gál, C.V.; Kántor, N. Modeling mean radiant temperature in outdoor spaces, A comparative numerical simulation and validation study. Urban Clim. 2020, 32, 100571. [Google Scholar] [CrossRef]
- Liu, D.; Hu, S.; Liu, J. Contrasting the performance capabilities of urban radiation field between three microclimate simulation tools. Build. Environ. 2020, 175, 106789. [Google Scholar] [CrossRef]
- Verein Deutscher Ingenieure (VDI). VDI 3783 Part 2: Environmental Meteorology—Atmospheric Dispersion Models—Wind Field Models; VDI: Düsseldorf, Germany, 1994. [Google Scholar]
- ISO 7726:1998; Ergonomics of the Thermal Environment—Instruments for Measuring Physical Quantities. International Organization for Standardization (ISO): Düsseldorf, Germany, 1998.
- Verein Deutscher Ingenieure (VDI). Environmental meteorology—Methods for the human-biometeorological evaluation of climate and air quality for urban and regional planning. In VDI 3787 Part 2; Verein Deutscher Ingenieure (VDI): Düsseldorf, Germany, 1998. [Google Scholar]
- Matzarakis, A.; Rutz, F.; Mayer, H. Modelling radiation fluxes in simple and complex environments—Application of the RayMan model. Int. J. Biometeorol. 2007, 51, 323–334. [Google Scholar] [CrossRef]
- Santos Nouri, A.; Charalampopoulos, I.; Matzarakis, A. Beyond singular climatic variables—Identifying the dynamics of wholesome thermo-physiological factors for existing/future human thermal comfort during hot dry Mediterranean summers. Int. J. Environ. Res. Public Health 2018, 15, 2362. [Google Scholar] [CrossRef] [PubMed]
- Soares, R.; Corvacho, H.; Alves, F. Summer thermal conditions in outdoor public spaces: A case study in a Mediterranean climate. Sustainability 2021, 13, 5348. [Google Scholar] [CrossRef]
- Fang, Z.; Feng, X.; Liu, J.; Lin, Z.; Mak, C.M.; Niu, J.; Tse, K.T.; Xu, X. Investigation into the differences among several outdoor thermal comfort indices against field survey in subtropics. Sustain. Cities Soc. 2019, 44, 676–690. [Google Scholar] [CrossRef]
- Weihs, P.; Staiger, H.; Tinz, B.; Batchvarova, E.; Rieder, H.; Vuilleumier, L. The uncertainty of UTCI due to uncertainties in the determination of radiation fluxes derived from measured and observed meteorological data. Int. J. Biometeorol. 2012, 56, 537–555. [Google Scholar] [CrossRef]
- Fiala, D.; Havenith, G.; Broede, P.; Kampmann, B.; Jendritzky, G. UTCI-Fiala multimode model of human heat transfer and temperature regulation. Int. J. Biometeorol. 2012, 56, 429–441. [Google Scholar] [CrossRef]
- Farajzadeh, H.; Saligheh, M.; Alijani, B. Application of universal thermal climate index in Iran from tourism perspective. Nat. Environ. Chang. 2016, 5, 117–138. [Google Scholar] [CrossRef]
- Yang, Z.; Peng, J.; Liu, Y.; Jiang, S.; Cheng, X.; Liu, X.; Dong, J.; Hua, T.; Yu, X. GloUTCI-M: A global monthly 1 km Universal Thermal Climate Index dataset from 2000 to 2022. Earth Syst. Sci. Data 2024, 16, 2407–2424. [Google Scholar] [CrossRef]
- Badyda, A.; Dąbrowiecki, P.; Lubiński, W.; Czechowski, P.; Majewski, G.; Gayer, A. Impact of traffic-related air pollutants on the reduction of spirometric parameters. Eur. Respir. J. 2013, 42 (Suppl. 57), 2974. [Google Scholar] [CrossRef]
- Bertin, M.; Chevrier, C.; Serrano, T.; Monfort, C.; Rouget, F.; Cordier, S.; Viel, J.-F. Association between prenatal exposure to traffic-related air pollution and preterm birth in the PELAGIE mother–child cohort, Brittany, France. Environ. Res. 2015, 142, 763–770. [Google Scholar] [CrossRef]
- Wang, Q.; Feng, H.; Li, J.Y.; Ning, E. Analysis of the Impact of Road Traffic on the Urban Air Quality. Res. Sq. 2021. [Google Scholar] [CrossRef]
- Meili, N.; Acero, J.A.; Peleg, N.; Manoli, G.; Burlando, P.; Fatichi, S. Vegetation cover and plant-trait effects on outdoor thermal comfort. Build. Environ. 2021, 199, 107733. [Google Scholar] [CrossRef]
- Gherri, B. The Role of Urban Vegetation in Counteracting Overheating in Different Urban Textures. Land 2023, 12, 2100. [Google Scholar] [CrossRef]
- Liu, K.; Li, J.; Sun, L.; Yang, X.; Xu, C.; Yan, G. Impact of Urban Forest and Park on Air Quality and the Microclimate in Jinan, Northern China. Atmosphere 2024, 15, 426. [Google Scholar] [CrossRef]
- Hwang, B.-H.; Sou, H.-D.; Oh, J.; Park, C. Cooling effect of urban forests on the urban heat island in Seoul, South Korea. PLoS ONE 2023, 18, e0288774. [Google Scholar] [CrossRef]
- Borna, M.; Turci, G.; Marchetti, M.; Schiano-Phan, R. Evaluating the Influence of Urban Blocks on Air Pollution Concentration Levels: The Case Study of Golden Lane Estate in London. Sustainability 2024, 16, 696. [Google Scholar] [CrossRef]
Disclaimer/Publisher’s Note: The statements, opinions and data contained in all publications are solely those of the individual author(s) and contributor(s) and not of MDPI and/or the editor(s). MDPI and/or the editor(s) disclaim responsibility for any injury to people or property resulting from any ideas, methods, instructions or products referred to in the content. |
© 2025 by the authors. Licensee MDPI, Basel, Switzerland. This article is an open access article distributed under the terms and conditions of the Creative Commons Attribution (CC BY) license (https://creativecommons.org/licenses/by/4.0/).