
Middle Rock Pillar Stability Criteria for a Bifurcated Small Clear-Distance Tunnel

 ,
,  , ,
, ,
Abstract
1. Introduction
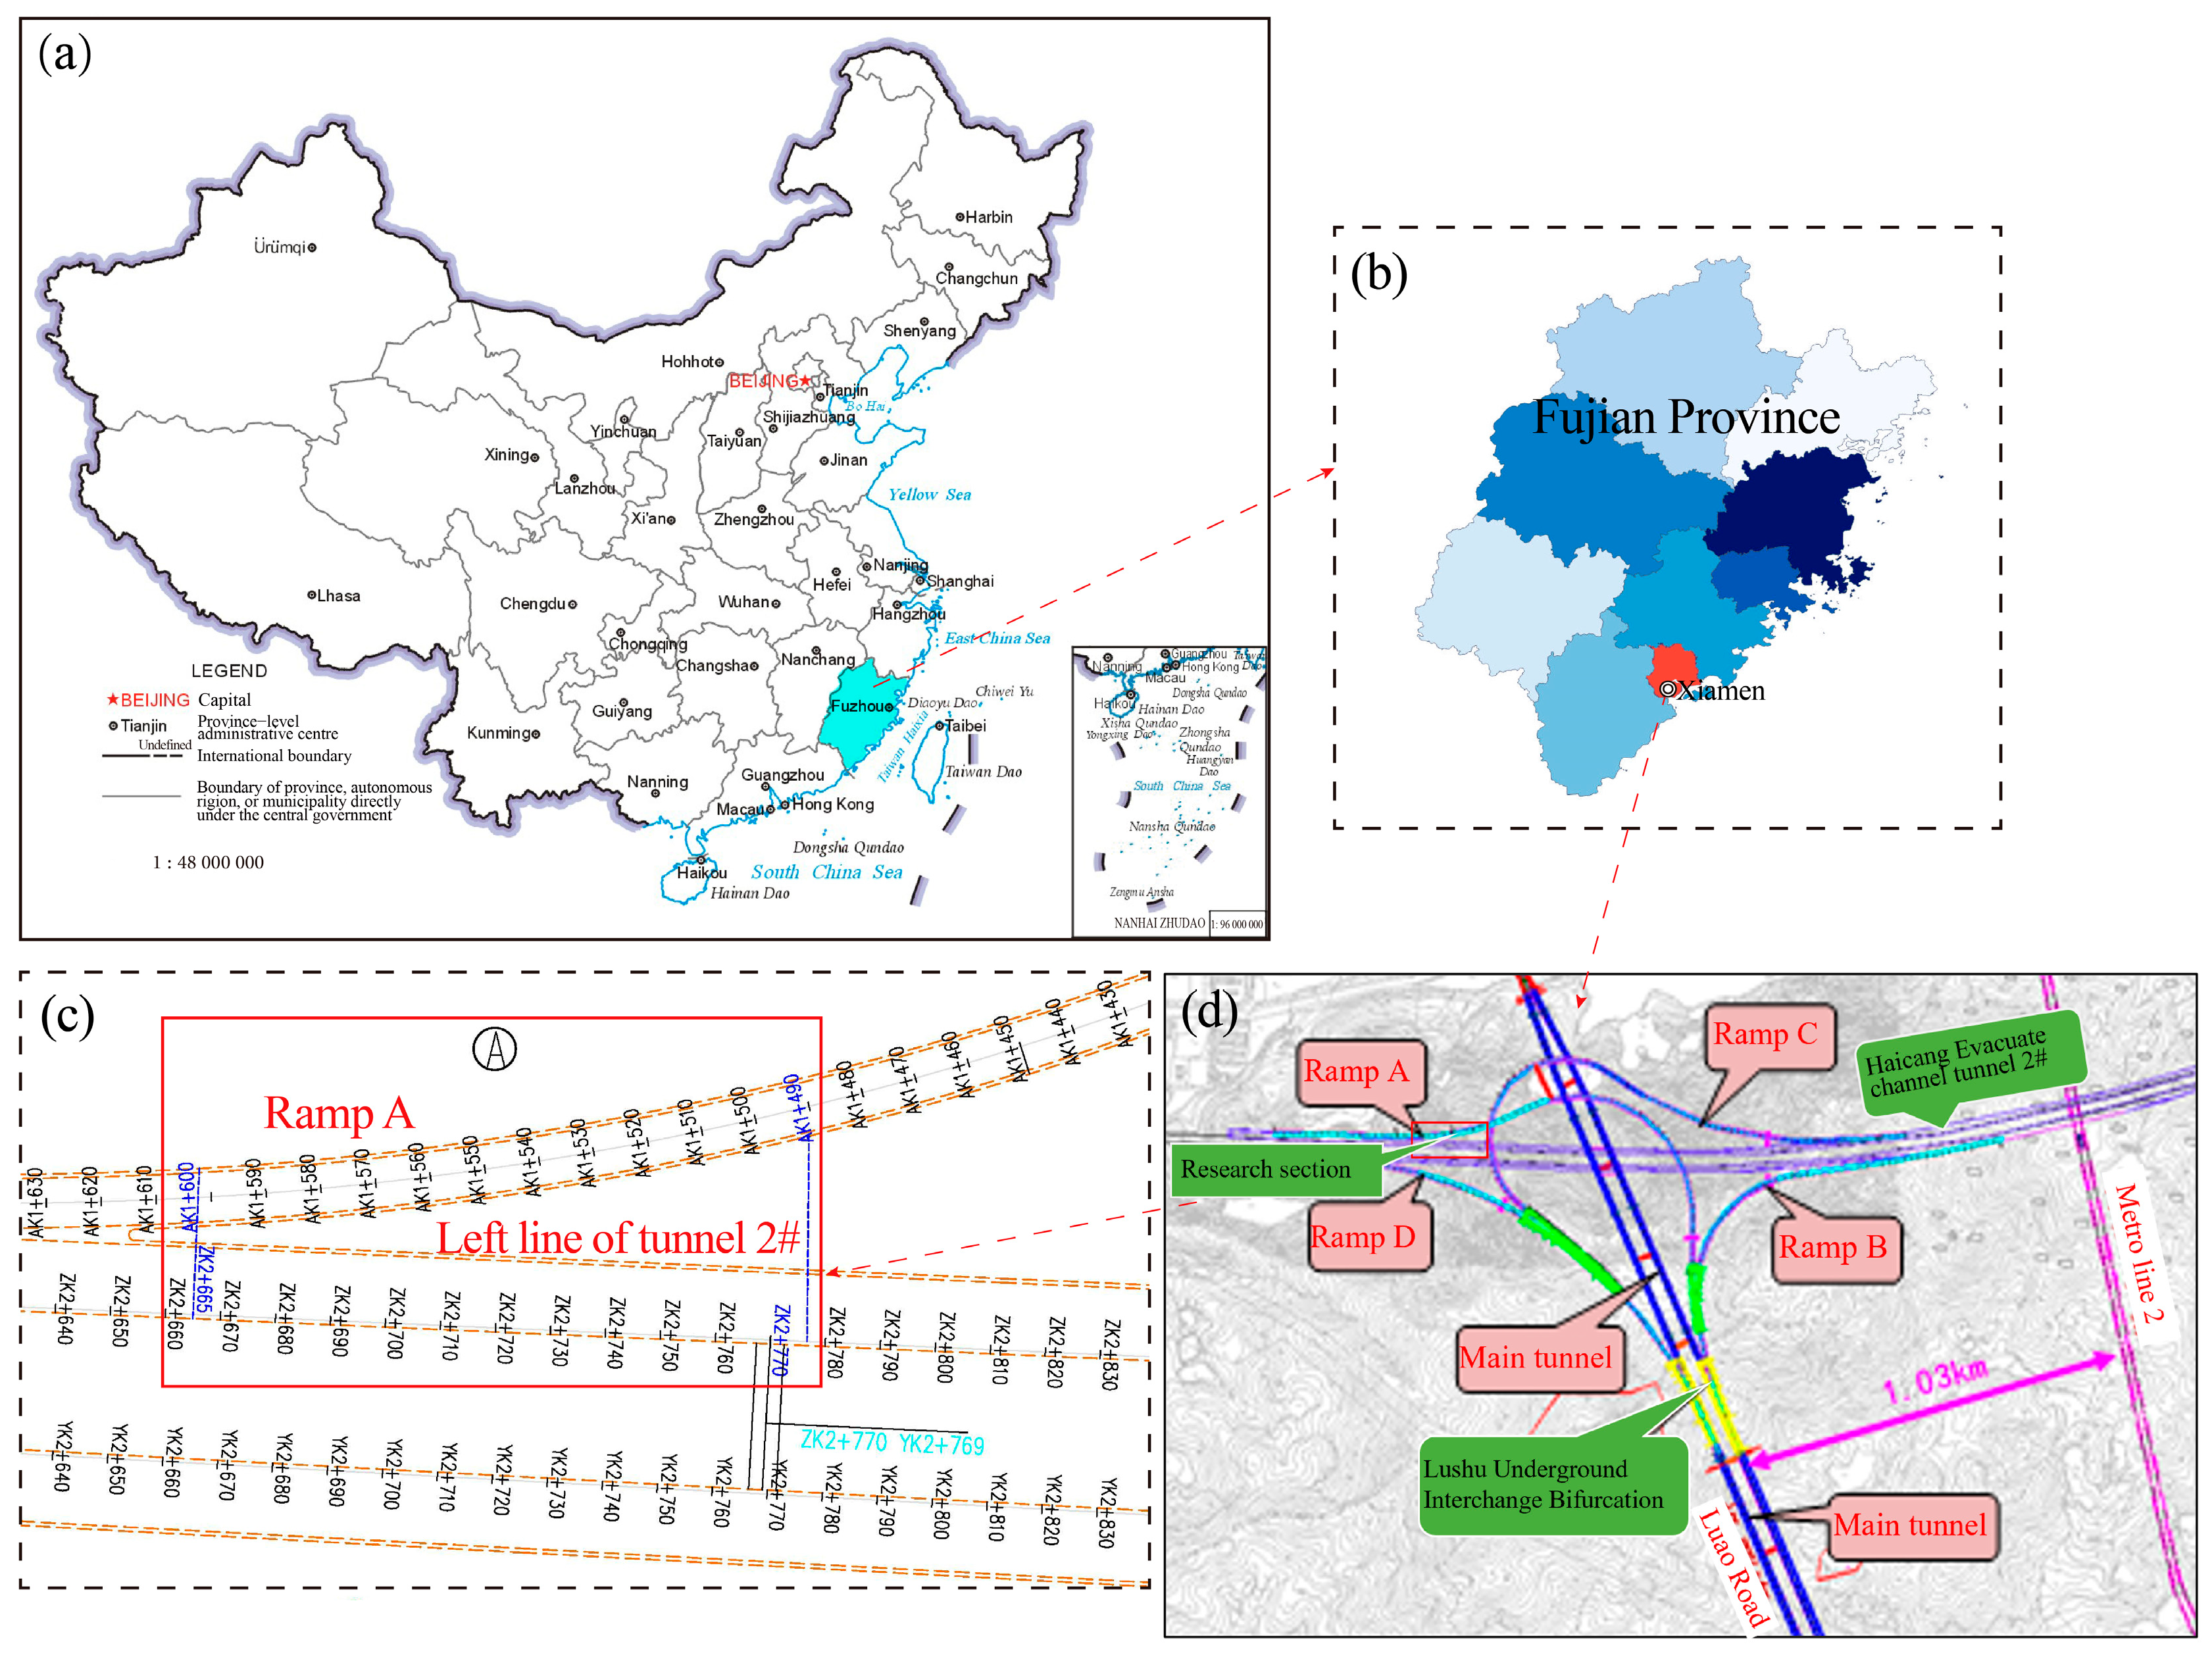
2. Project Overview
3. Numerical Model and Material Parameters
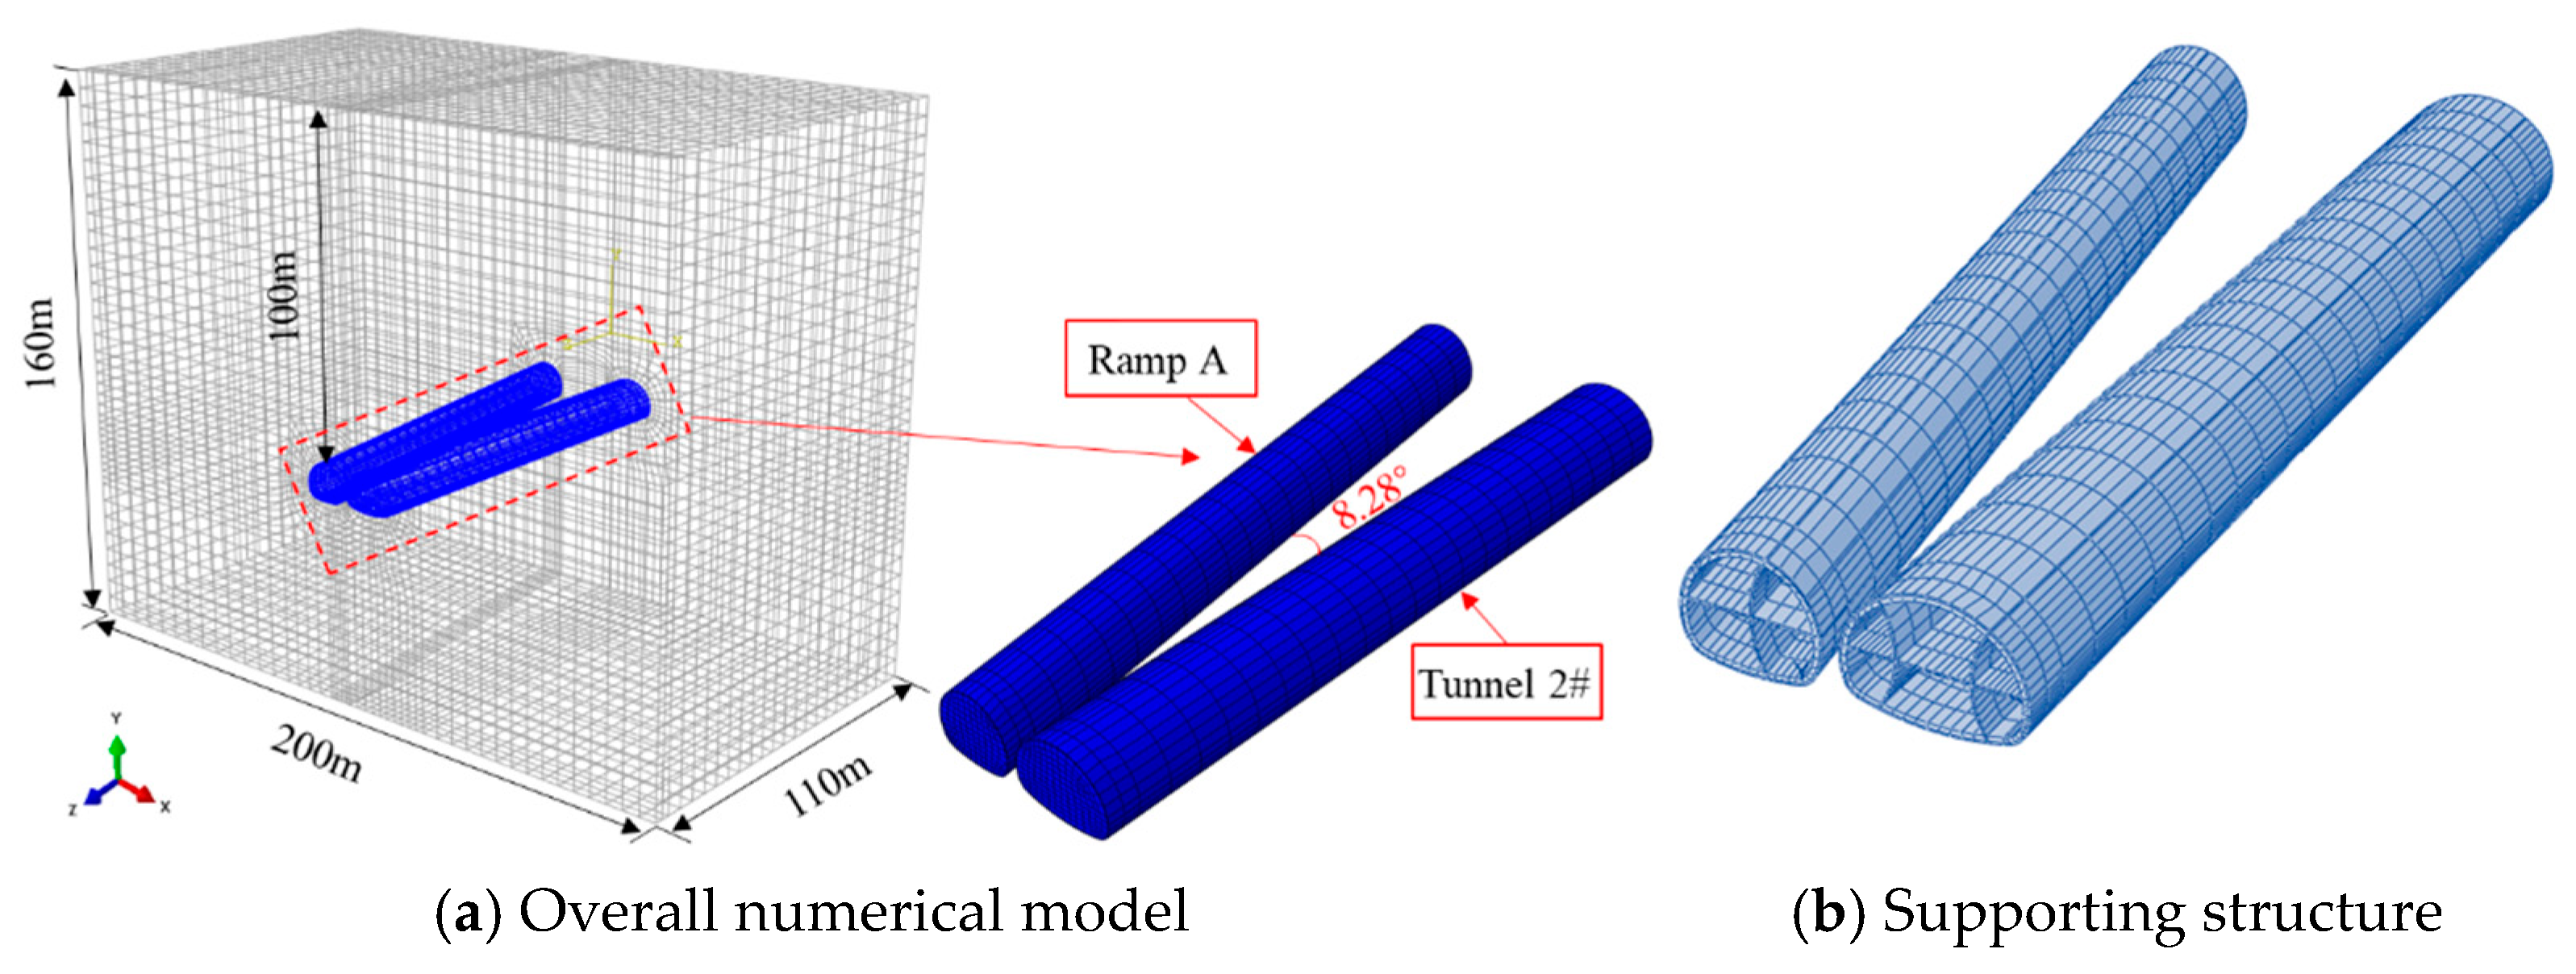
3.1. Numerical Model
3.2. Constitutive Models and Material Parameters
4. Stability Criteria of the MRP Before Construction
5. Stability Criteria of the MRP During Construction
5.1. Numerical Cases Design
5.2. Displacement Criteria
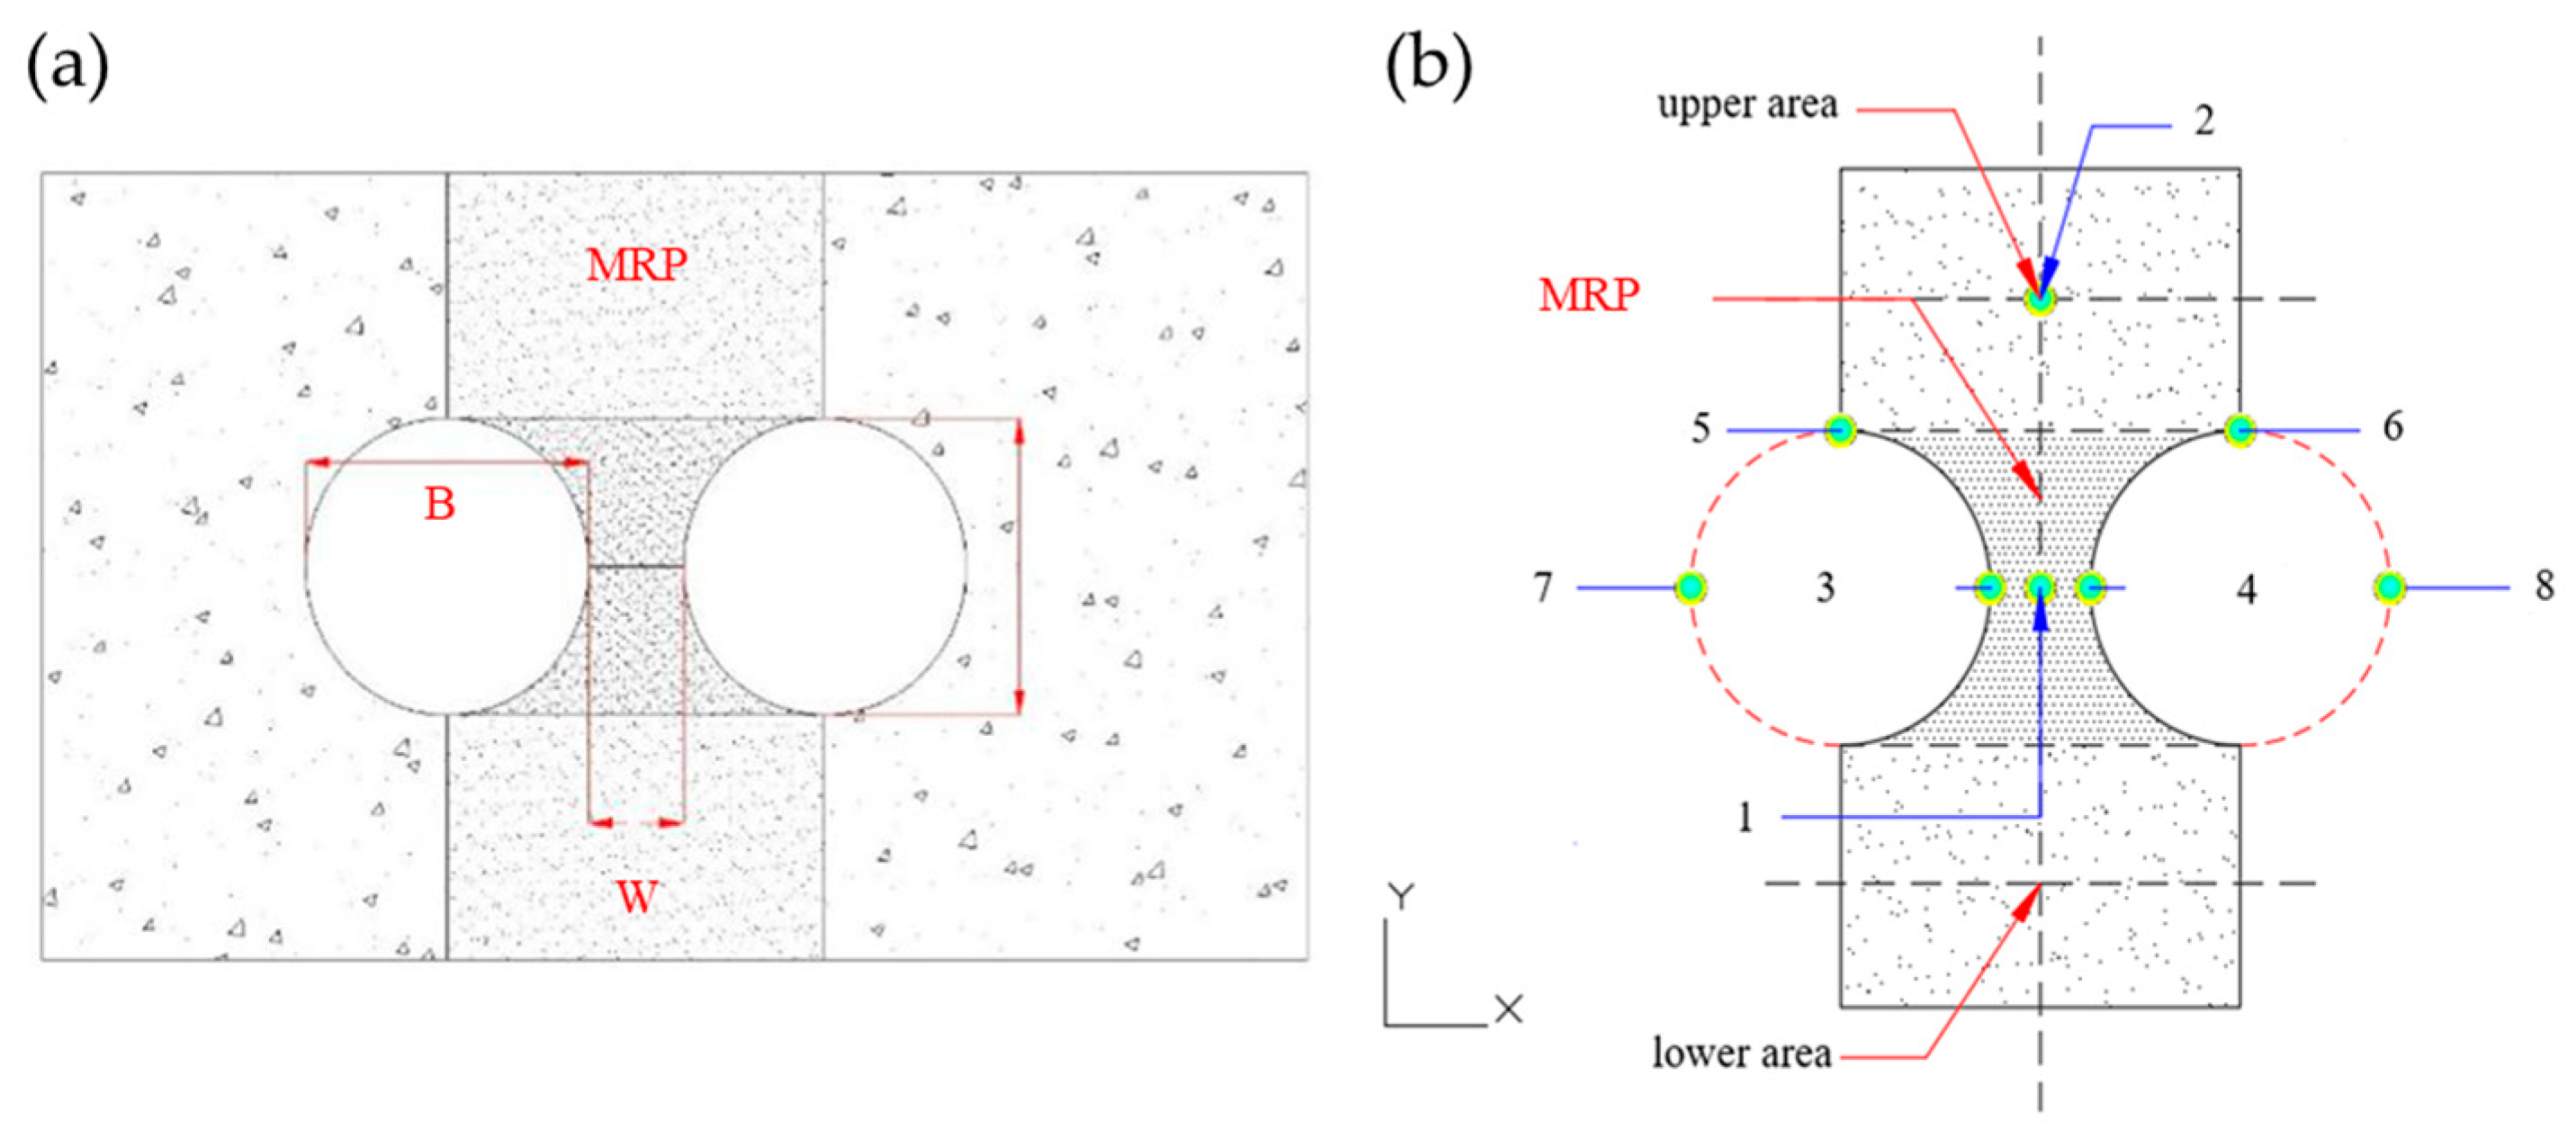
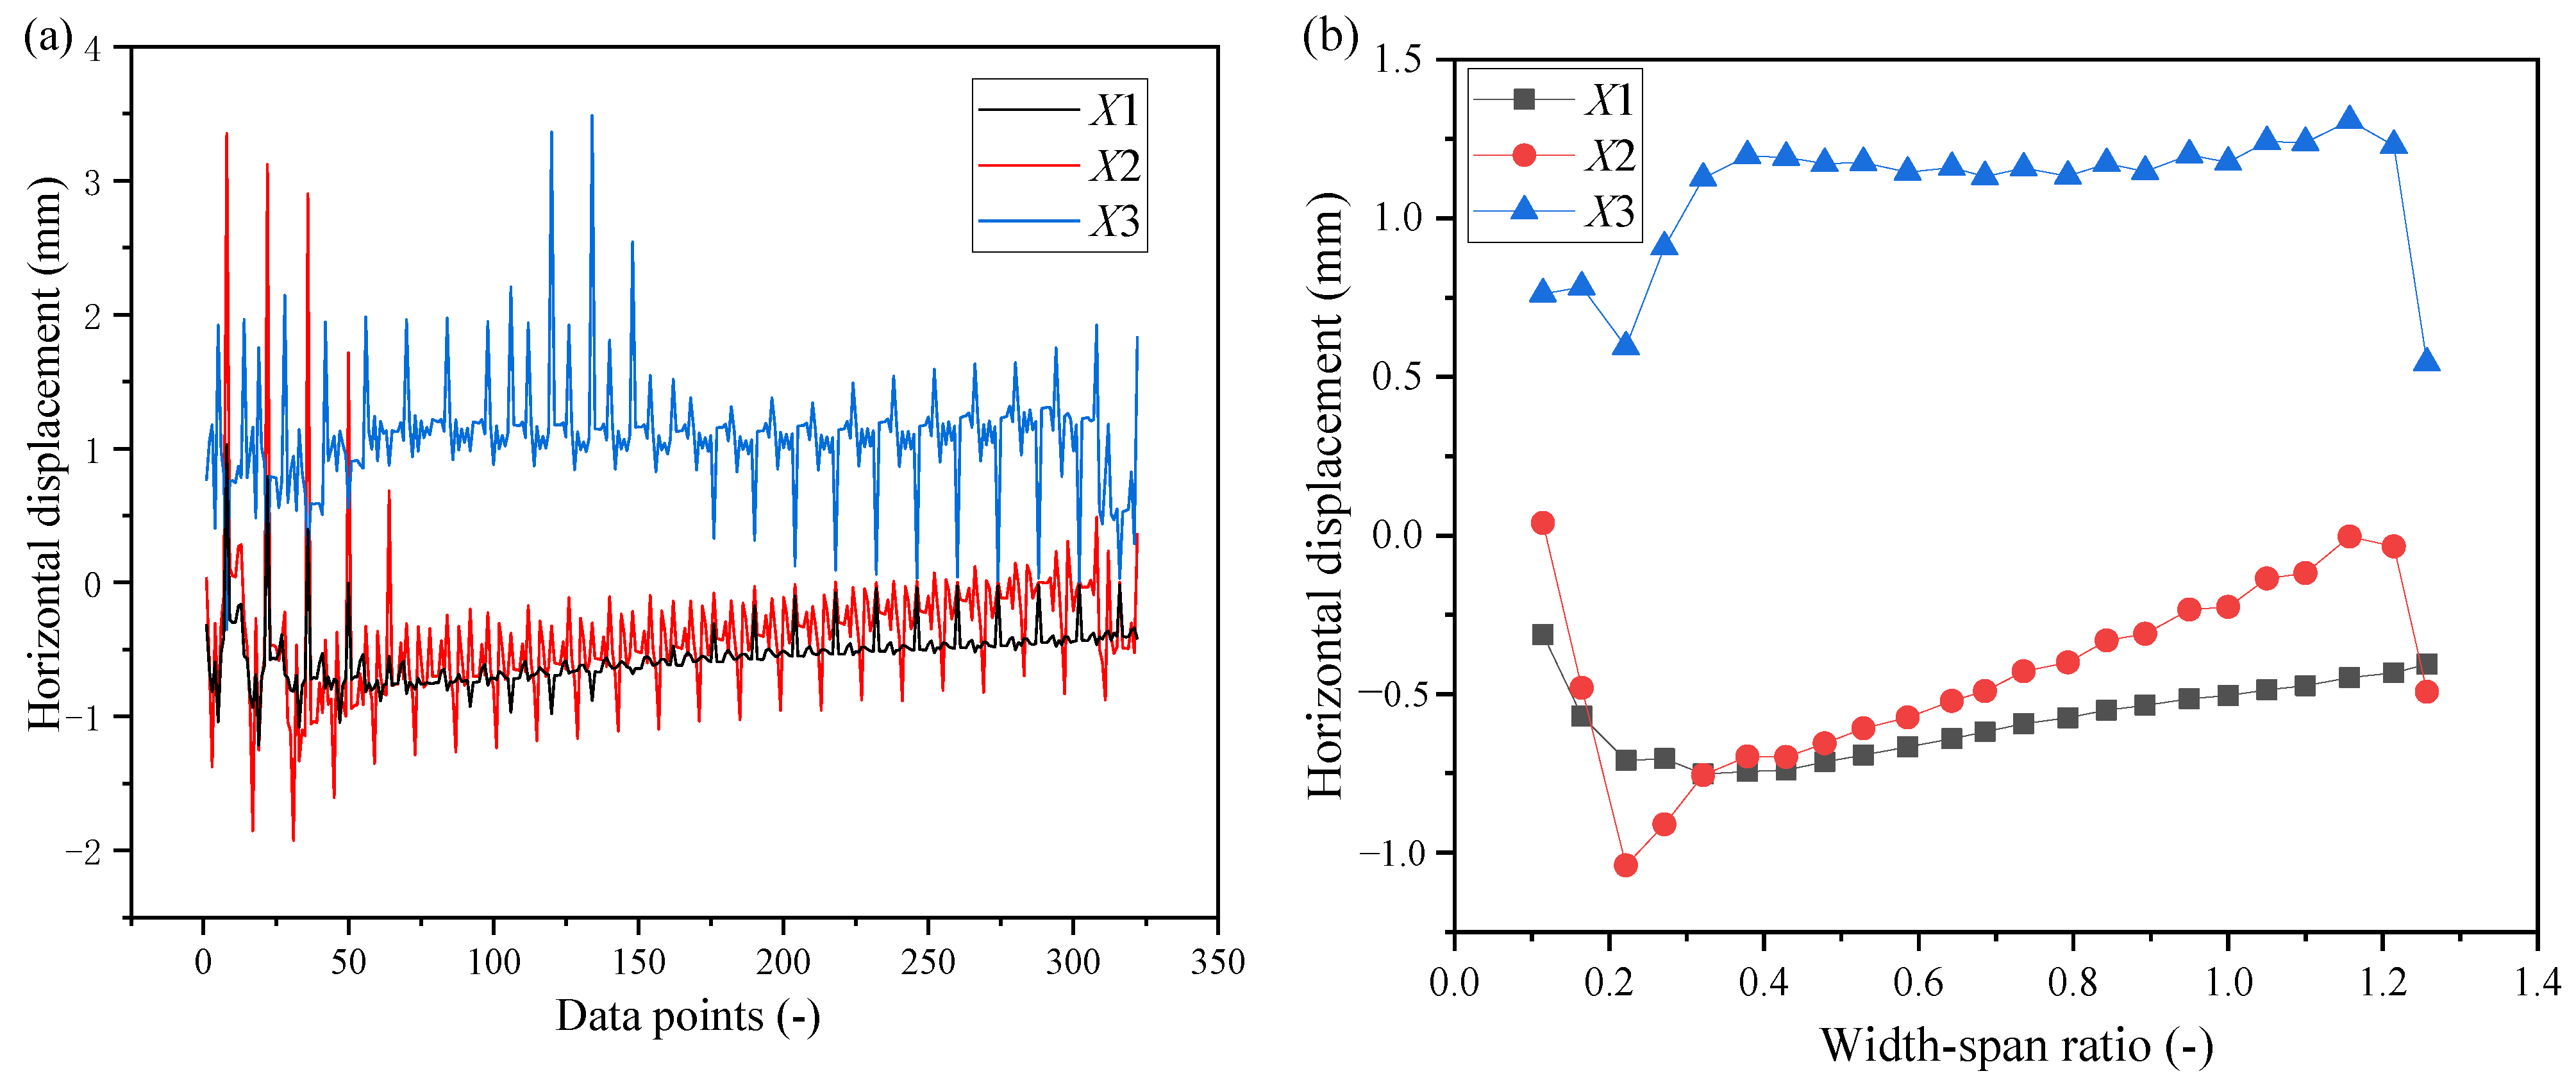
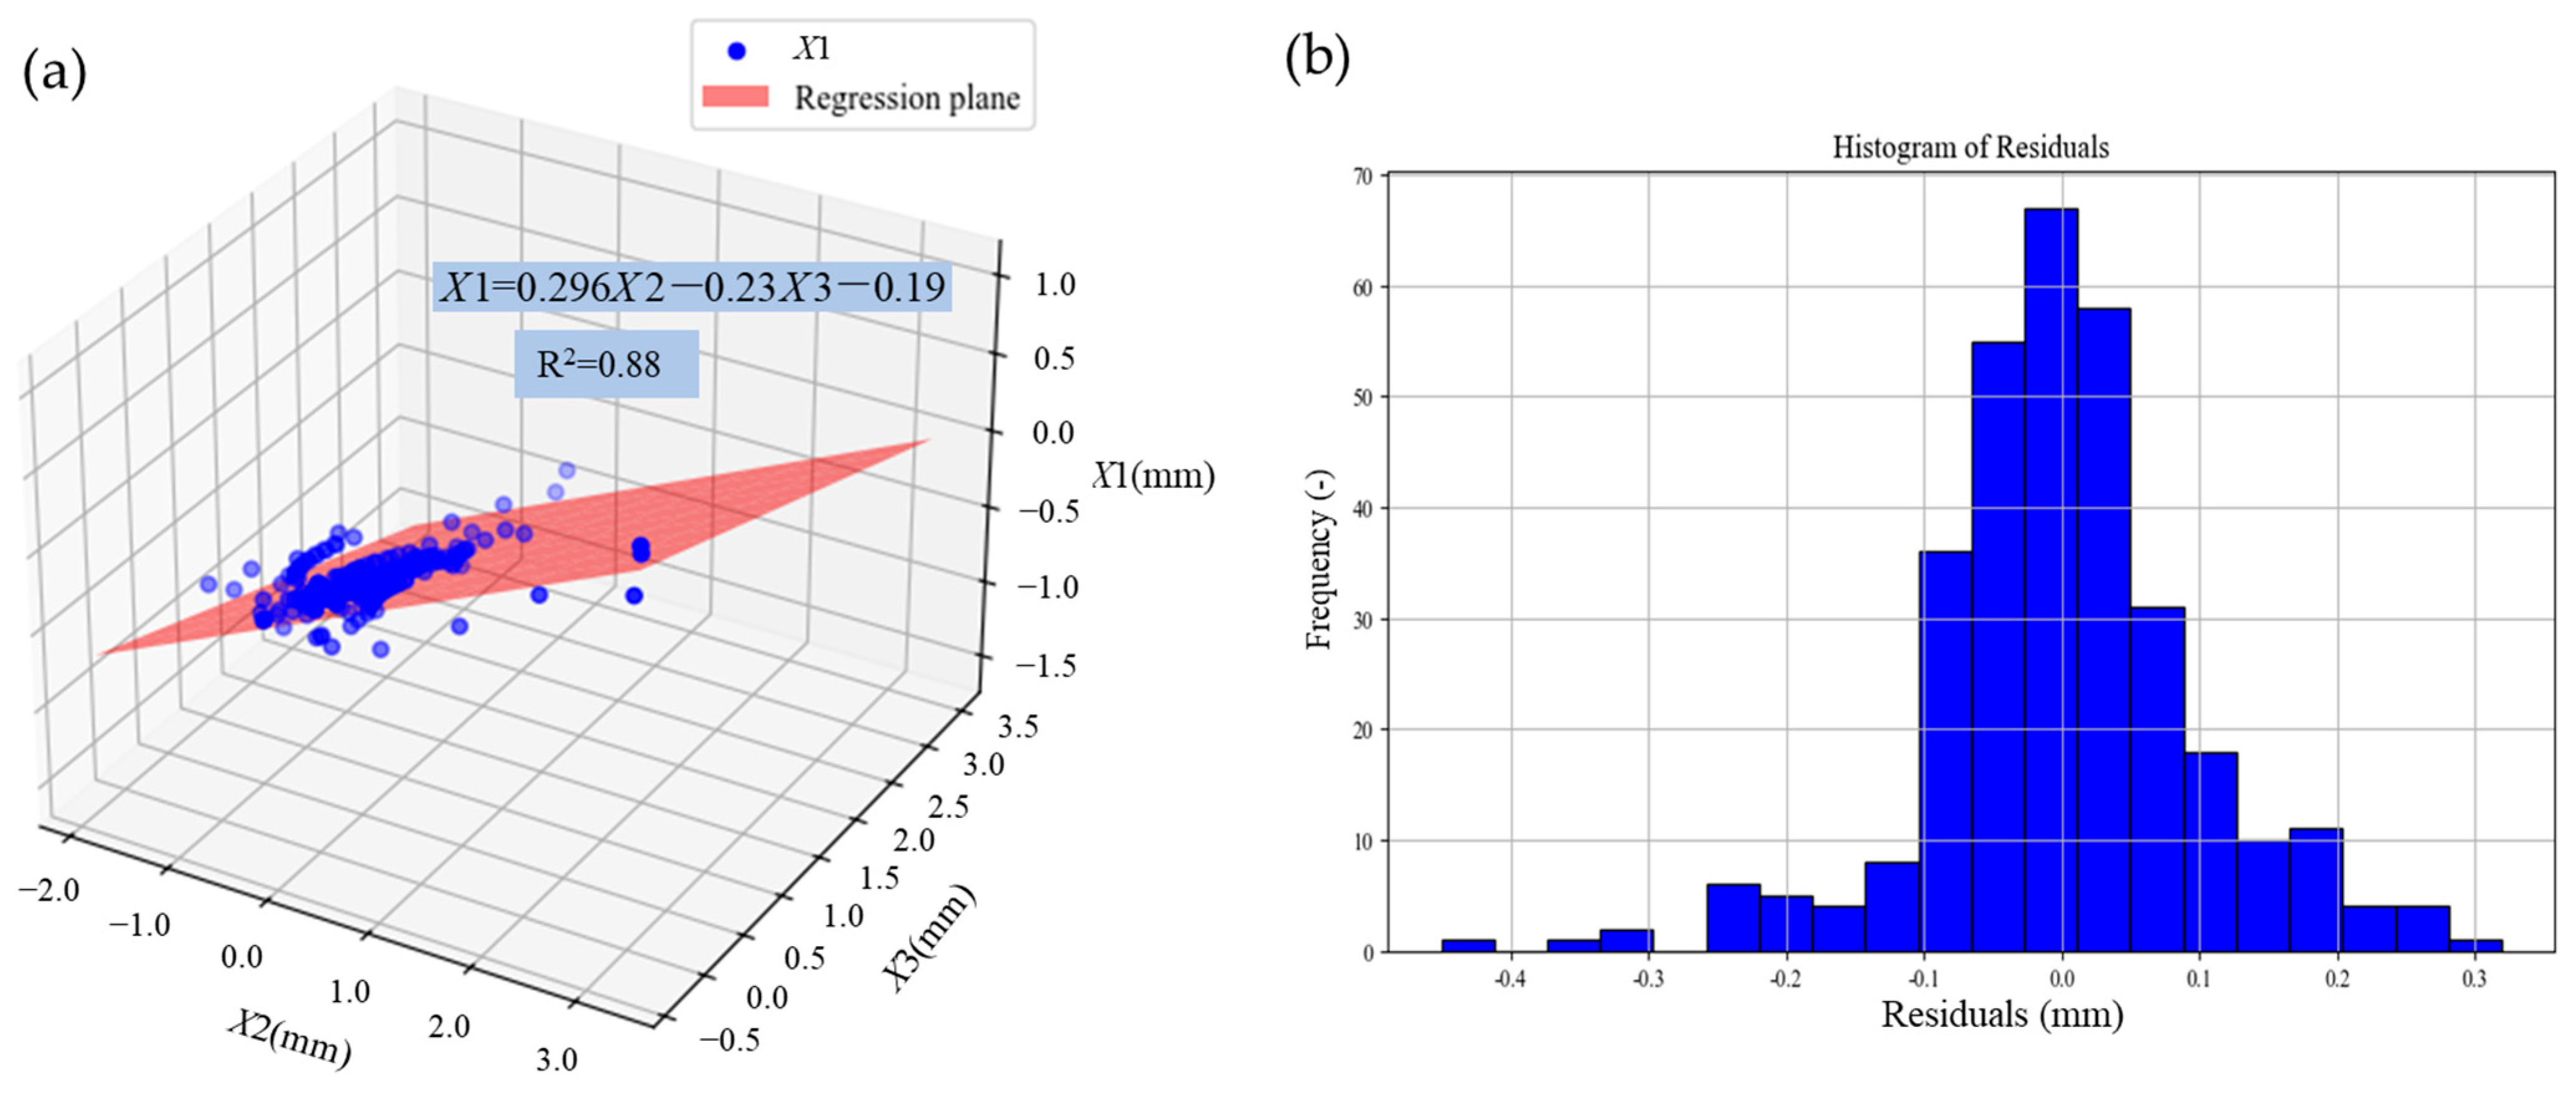
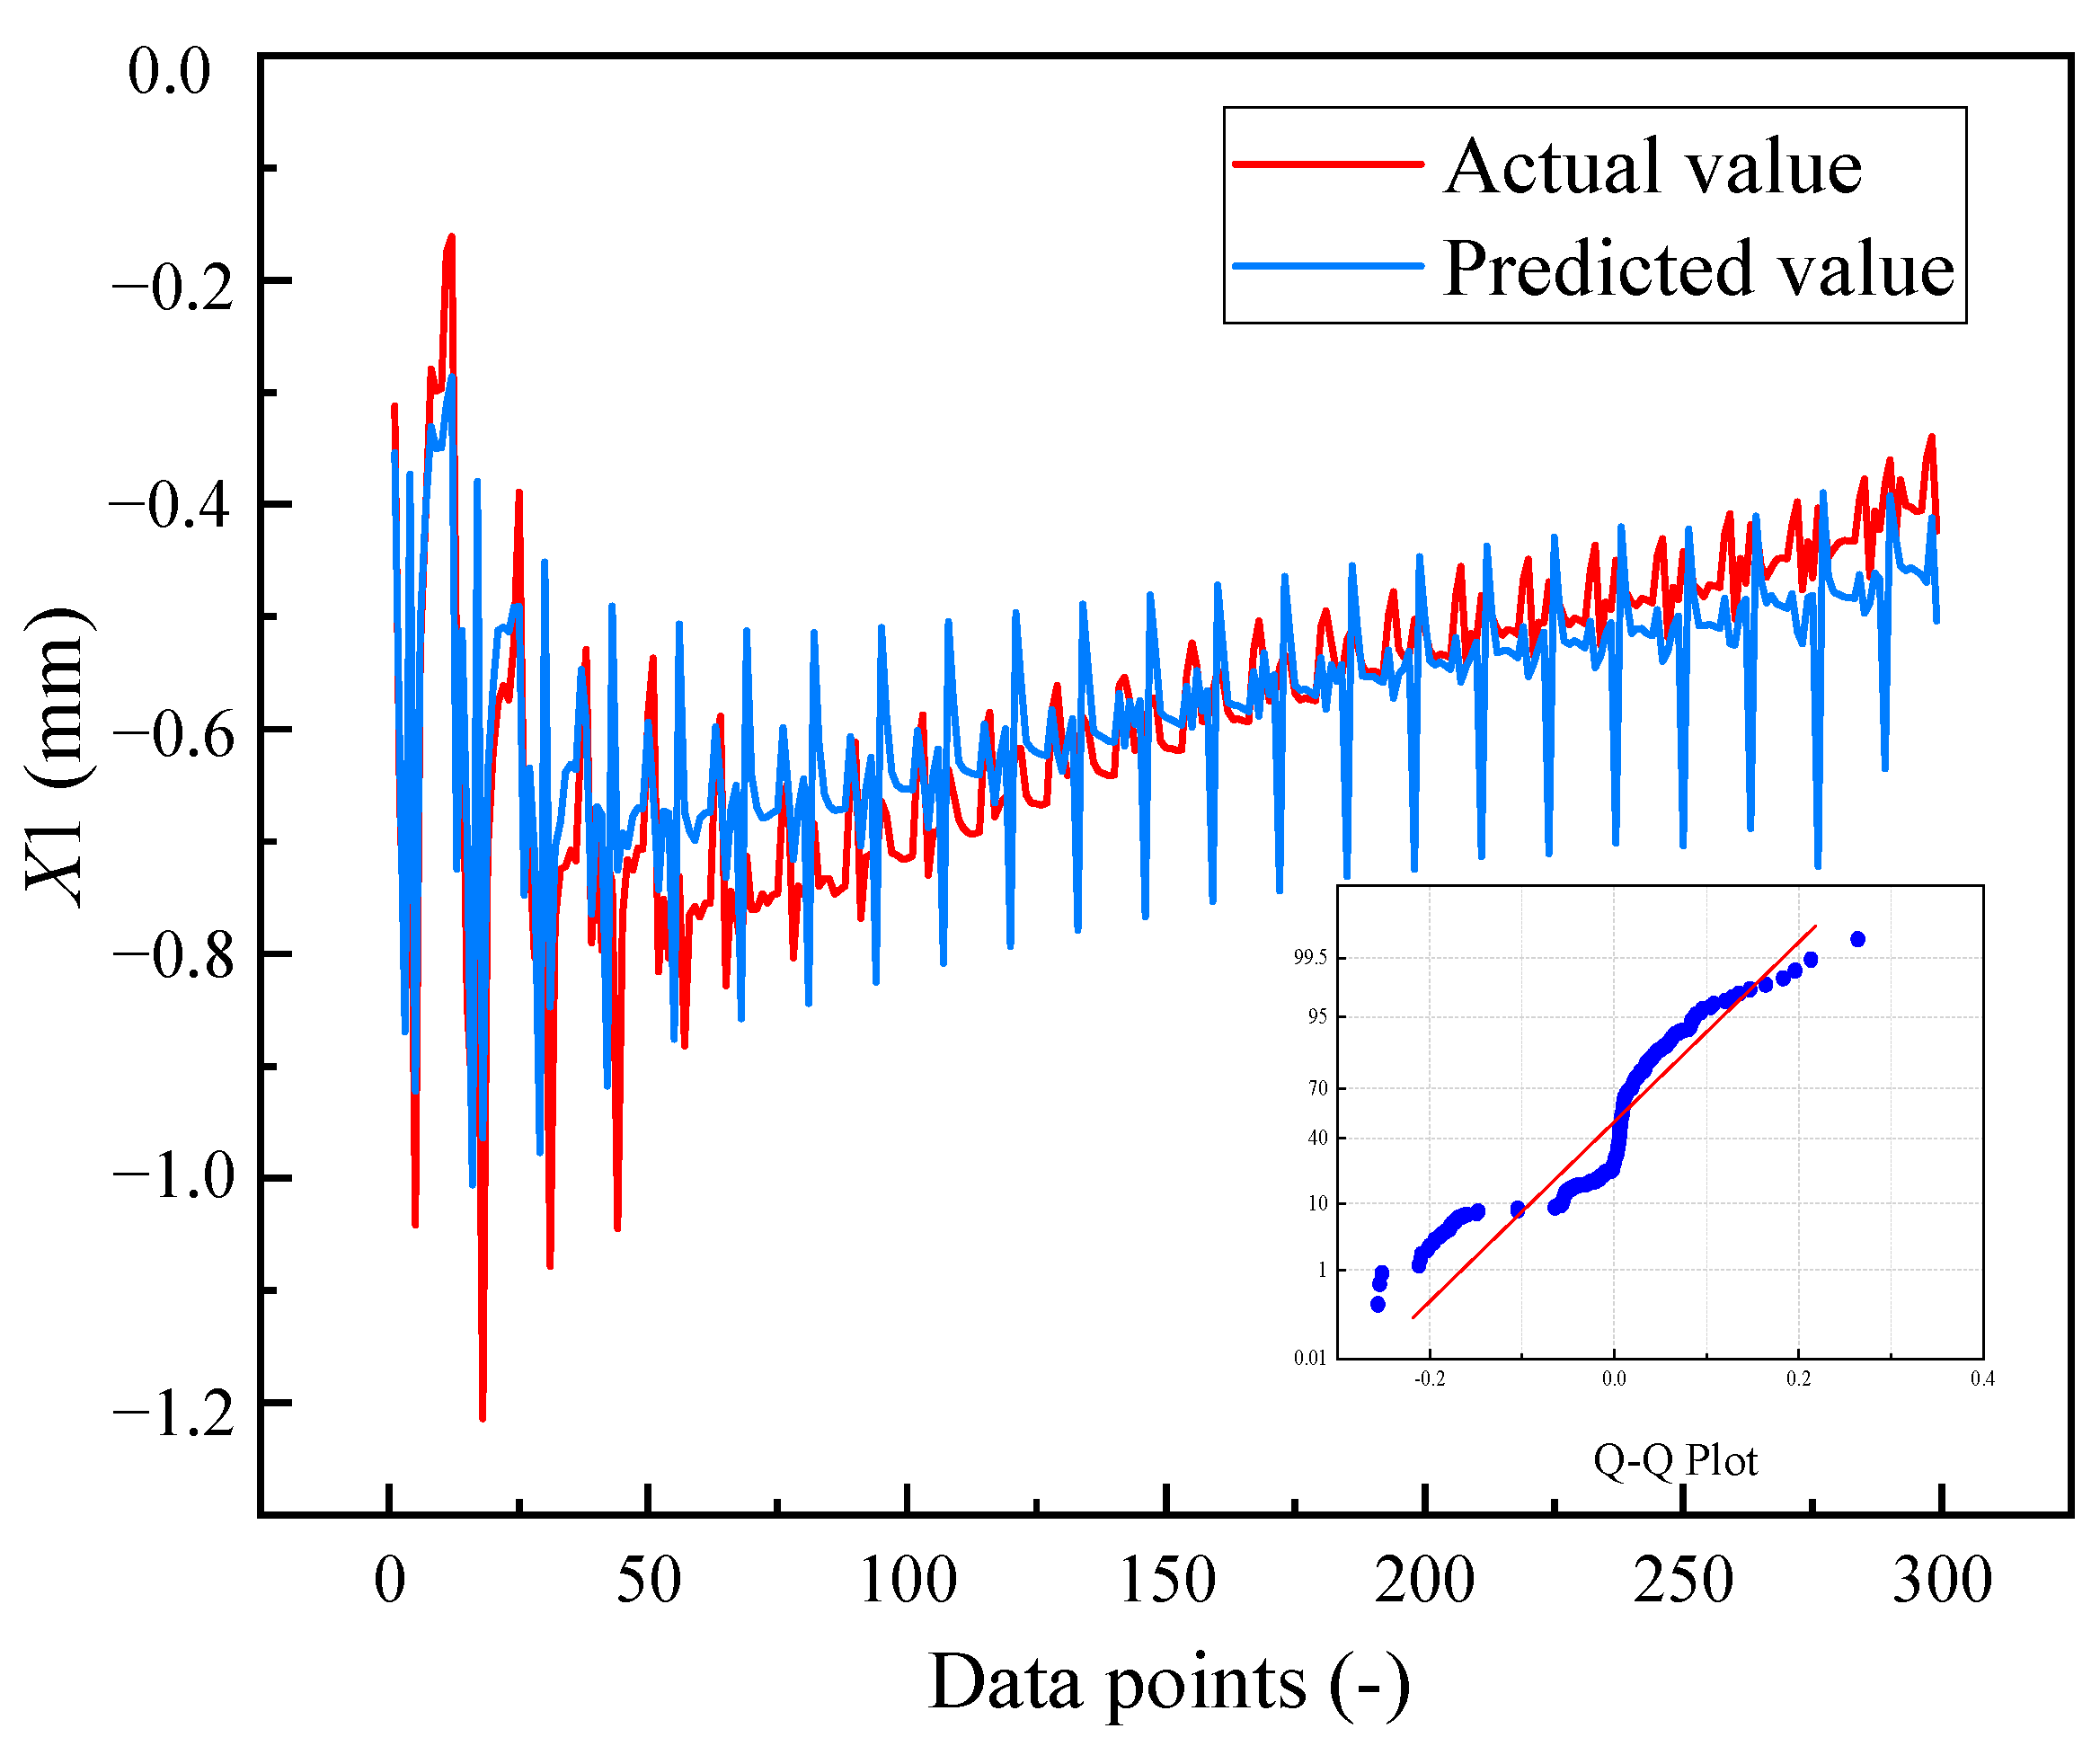
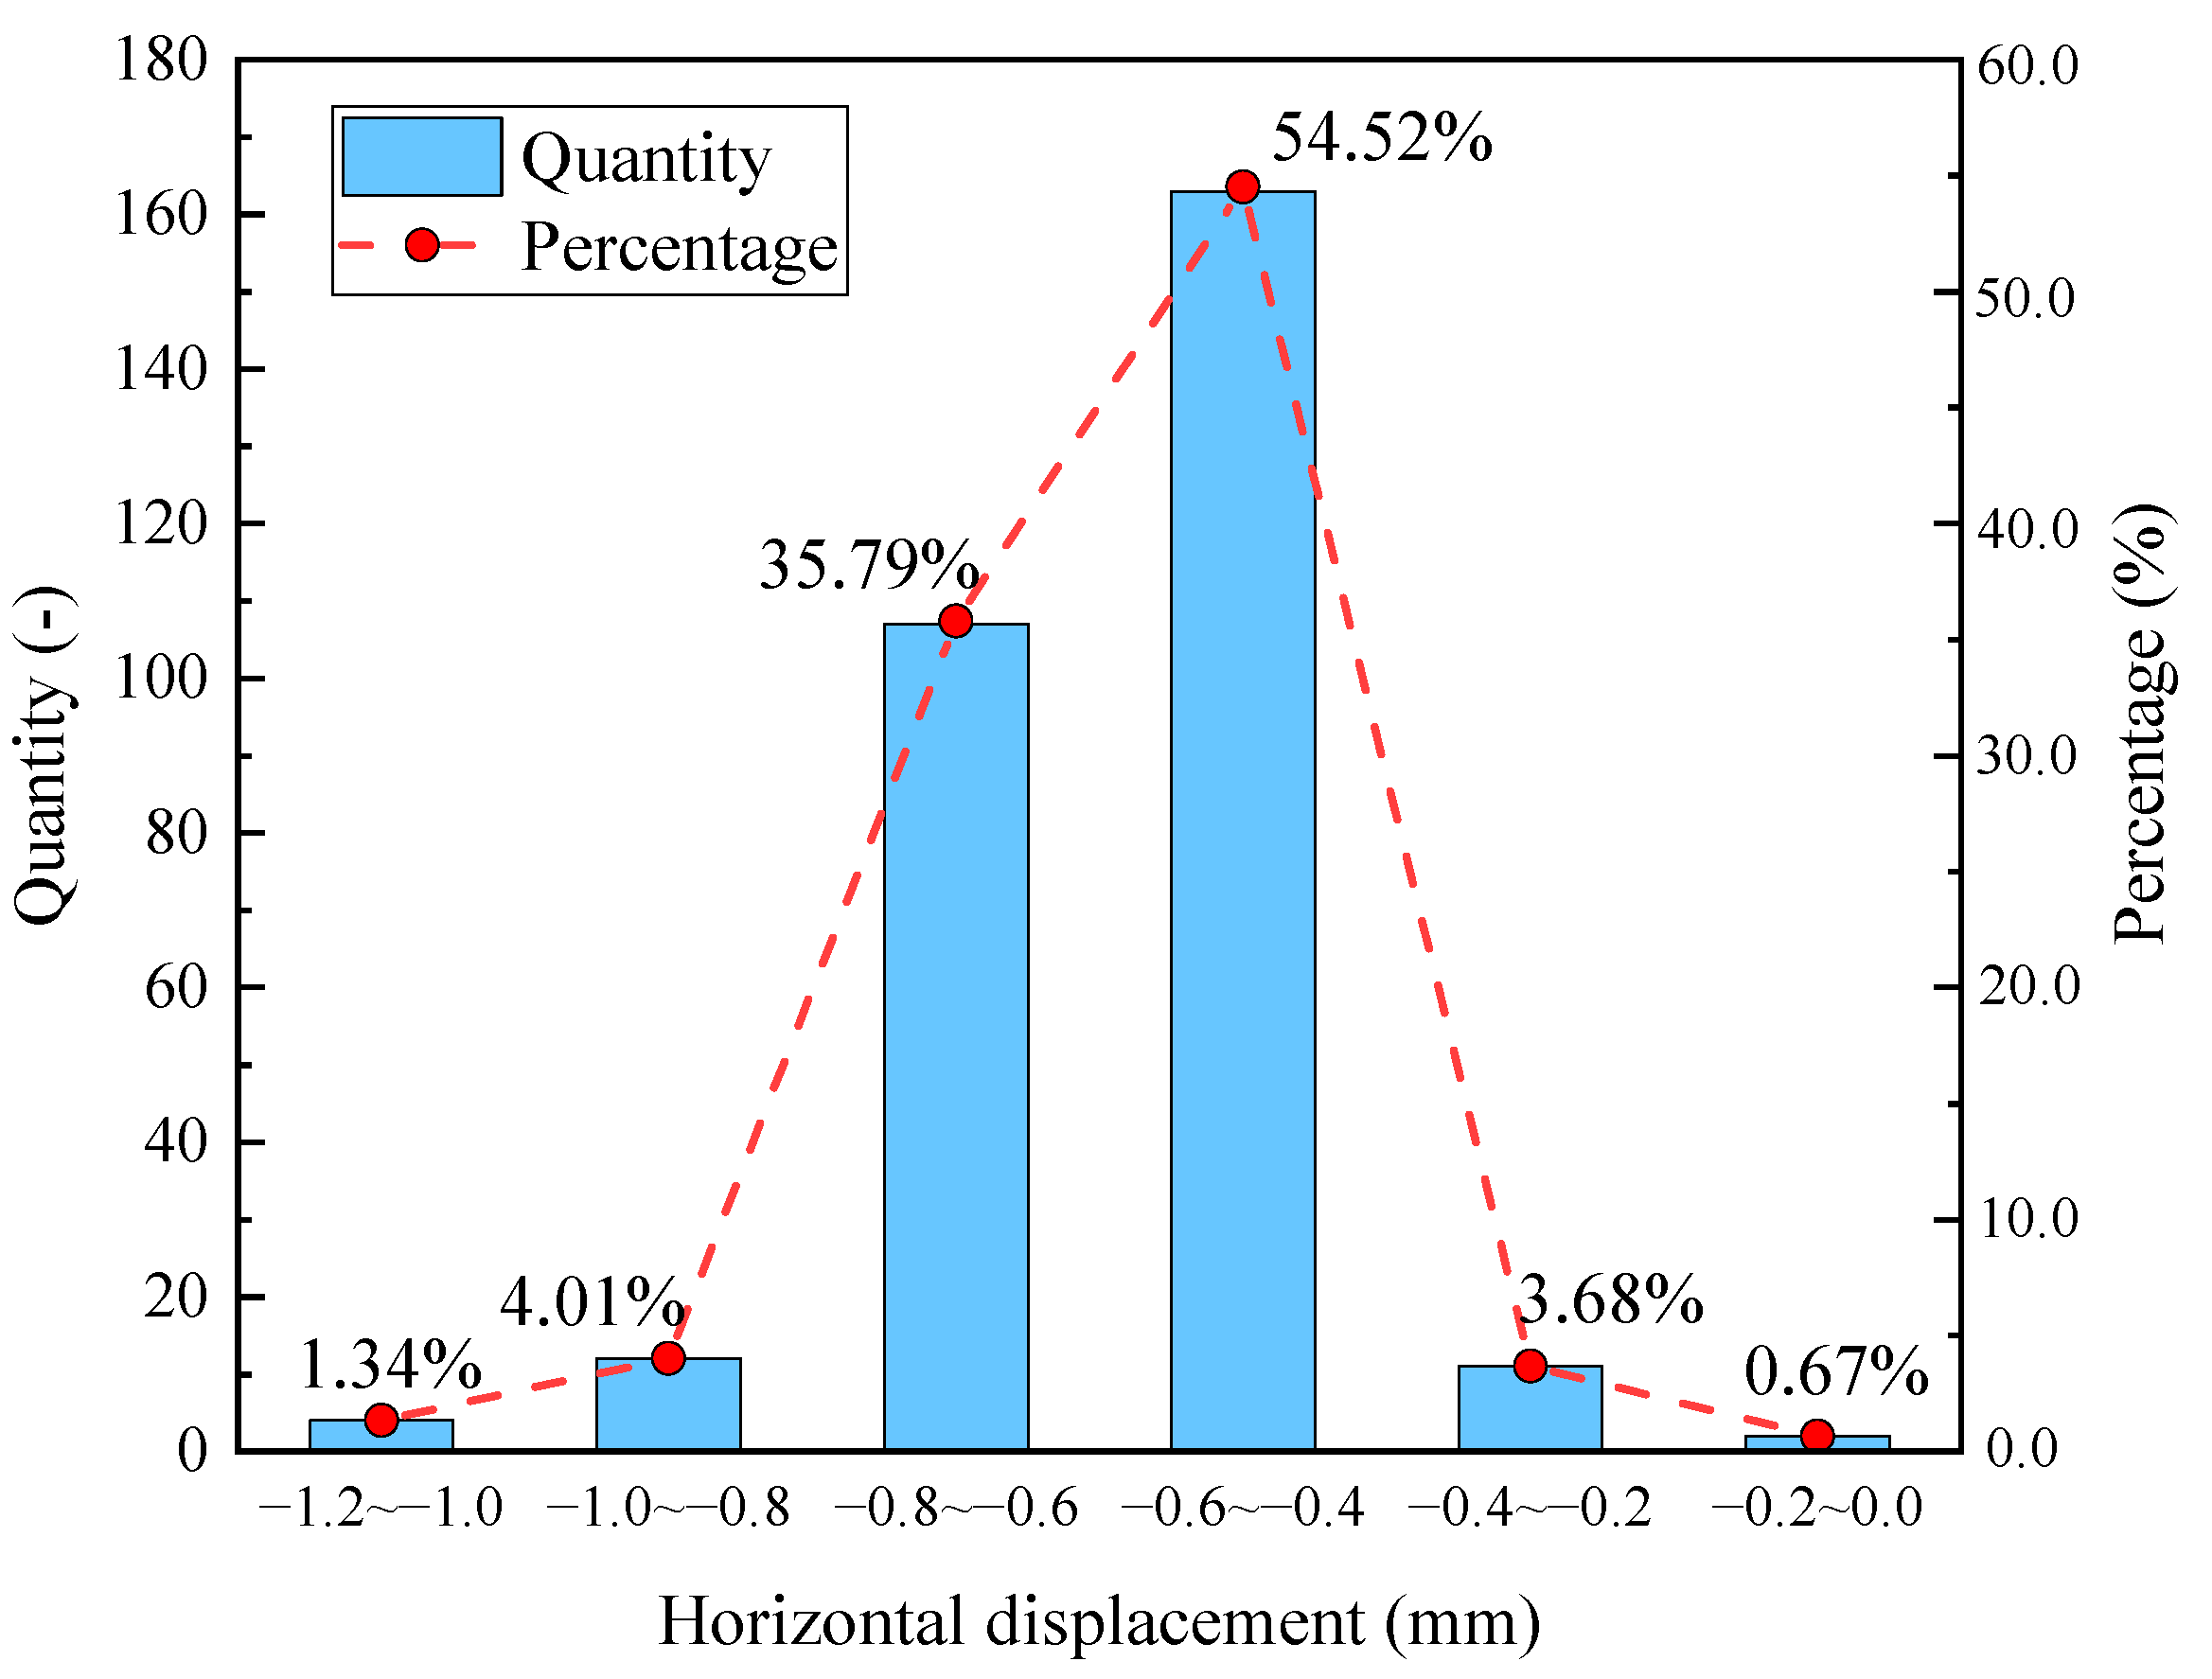
5.2.1. Horizontal Displacement Criterion
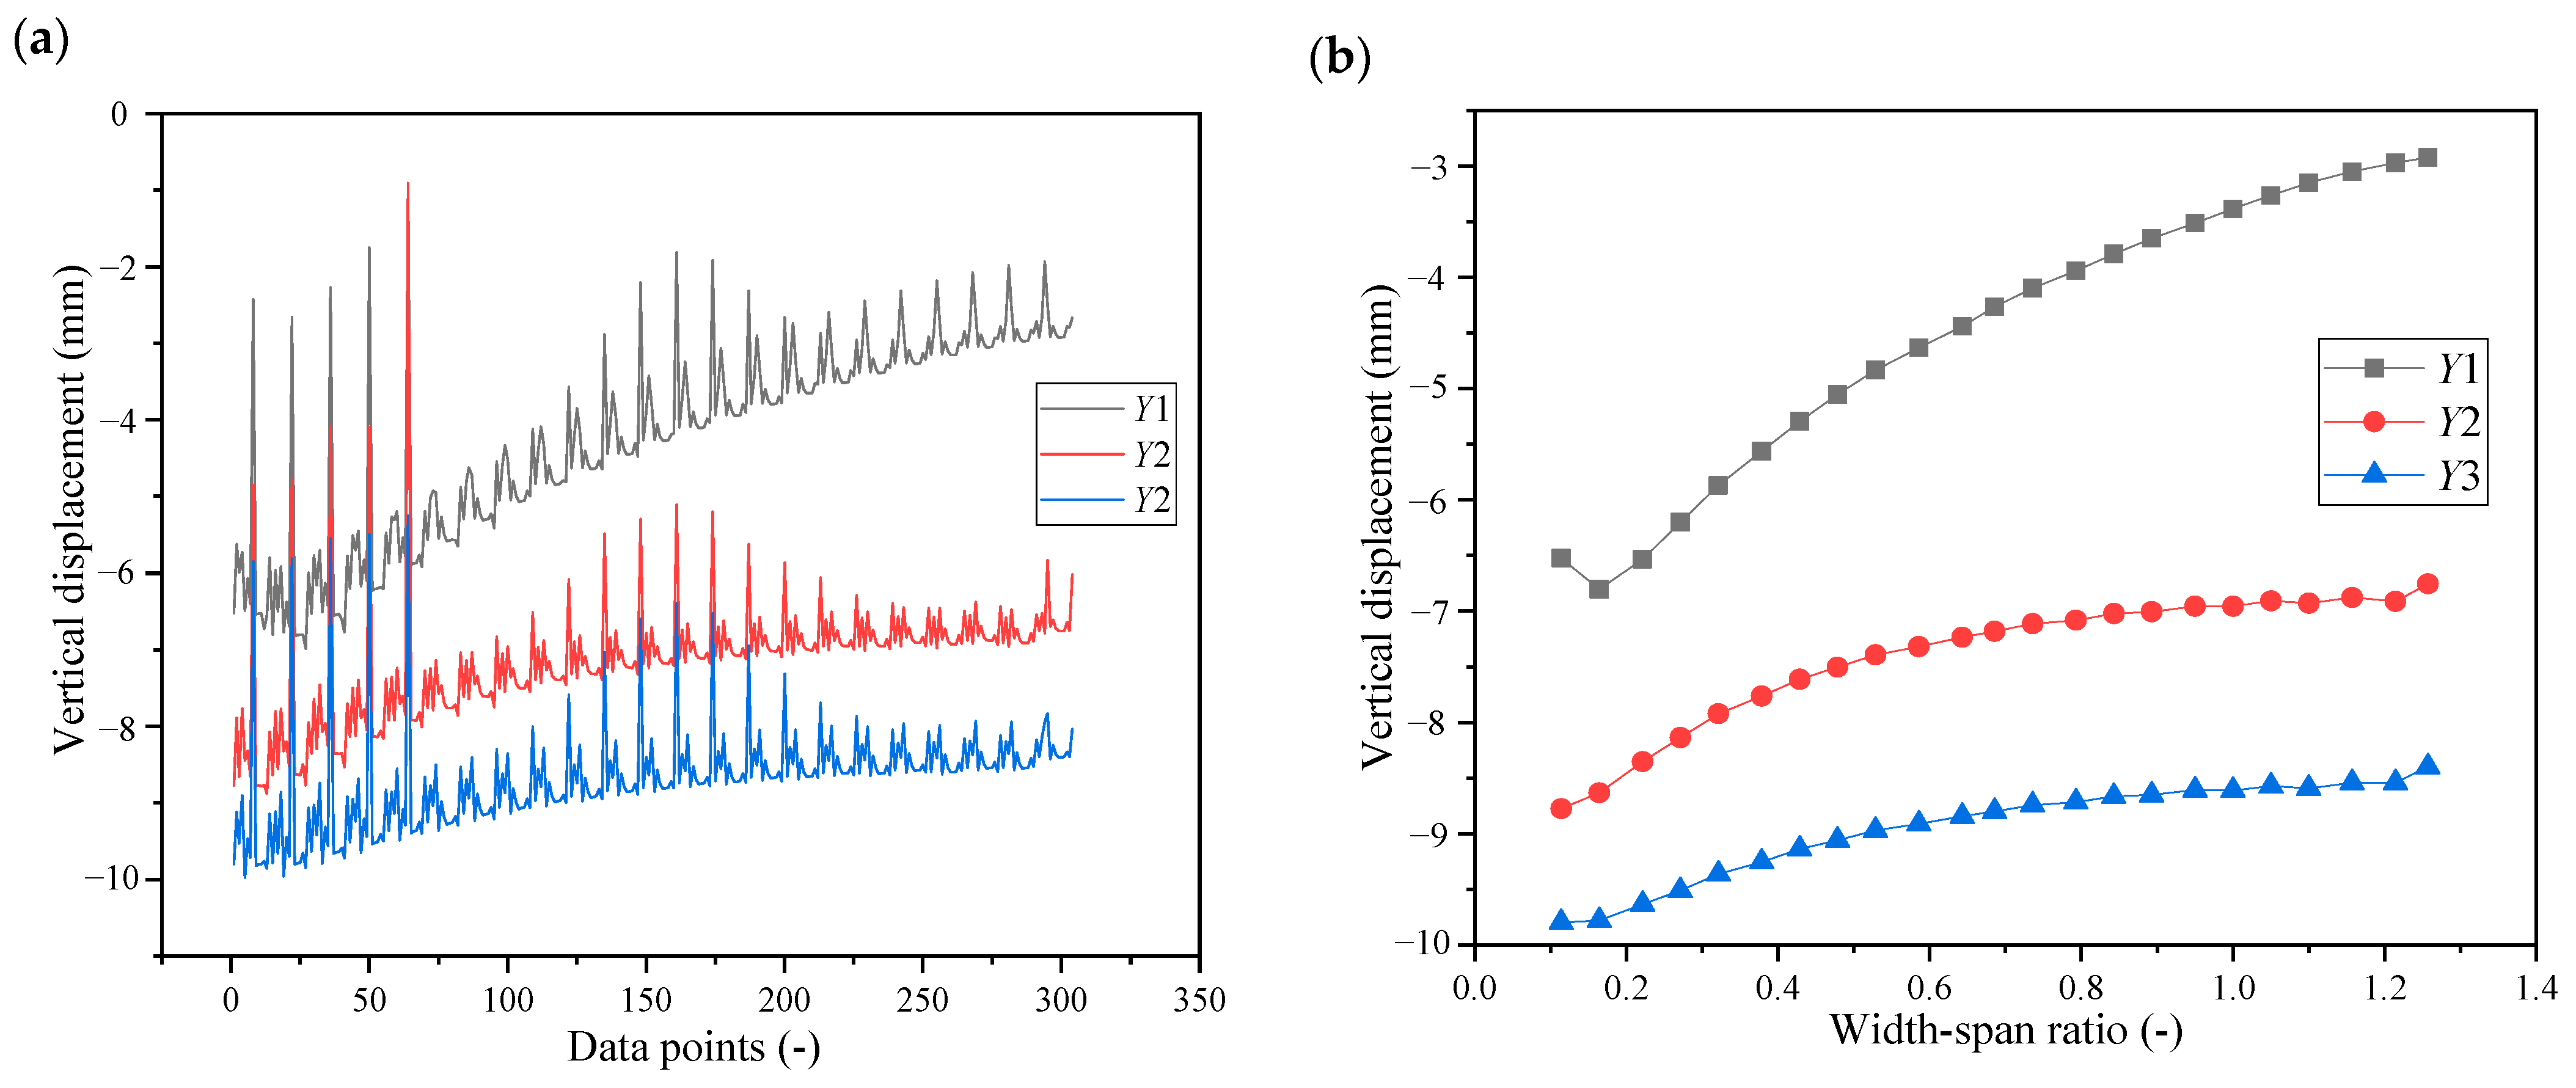
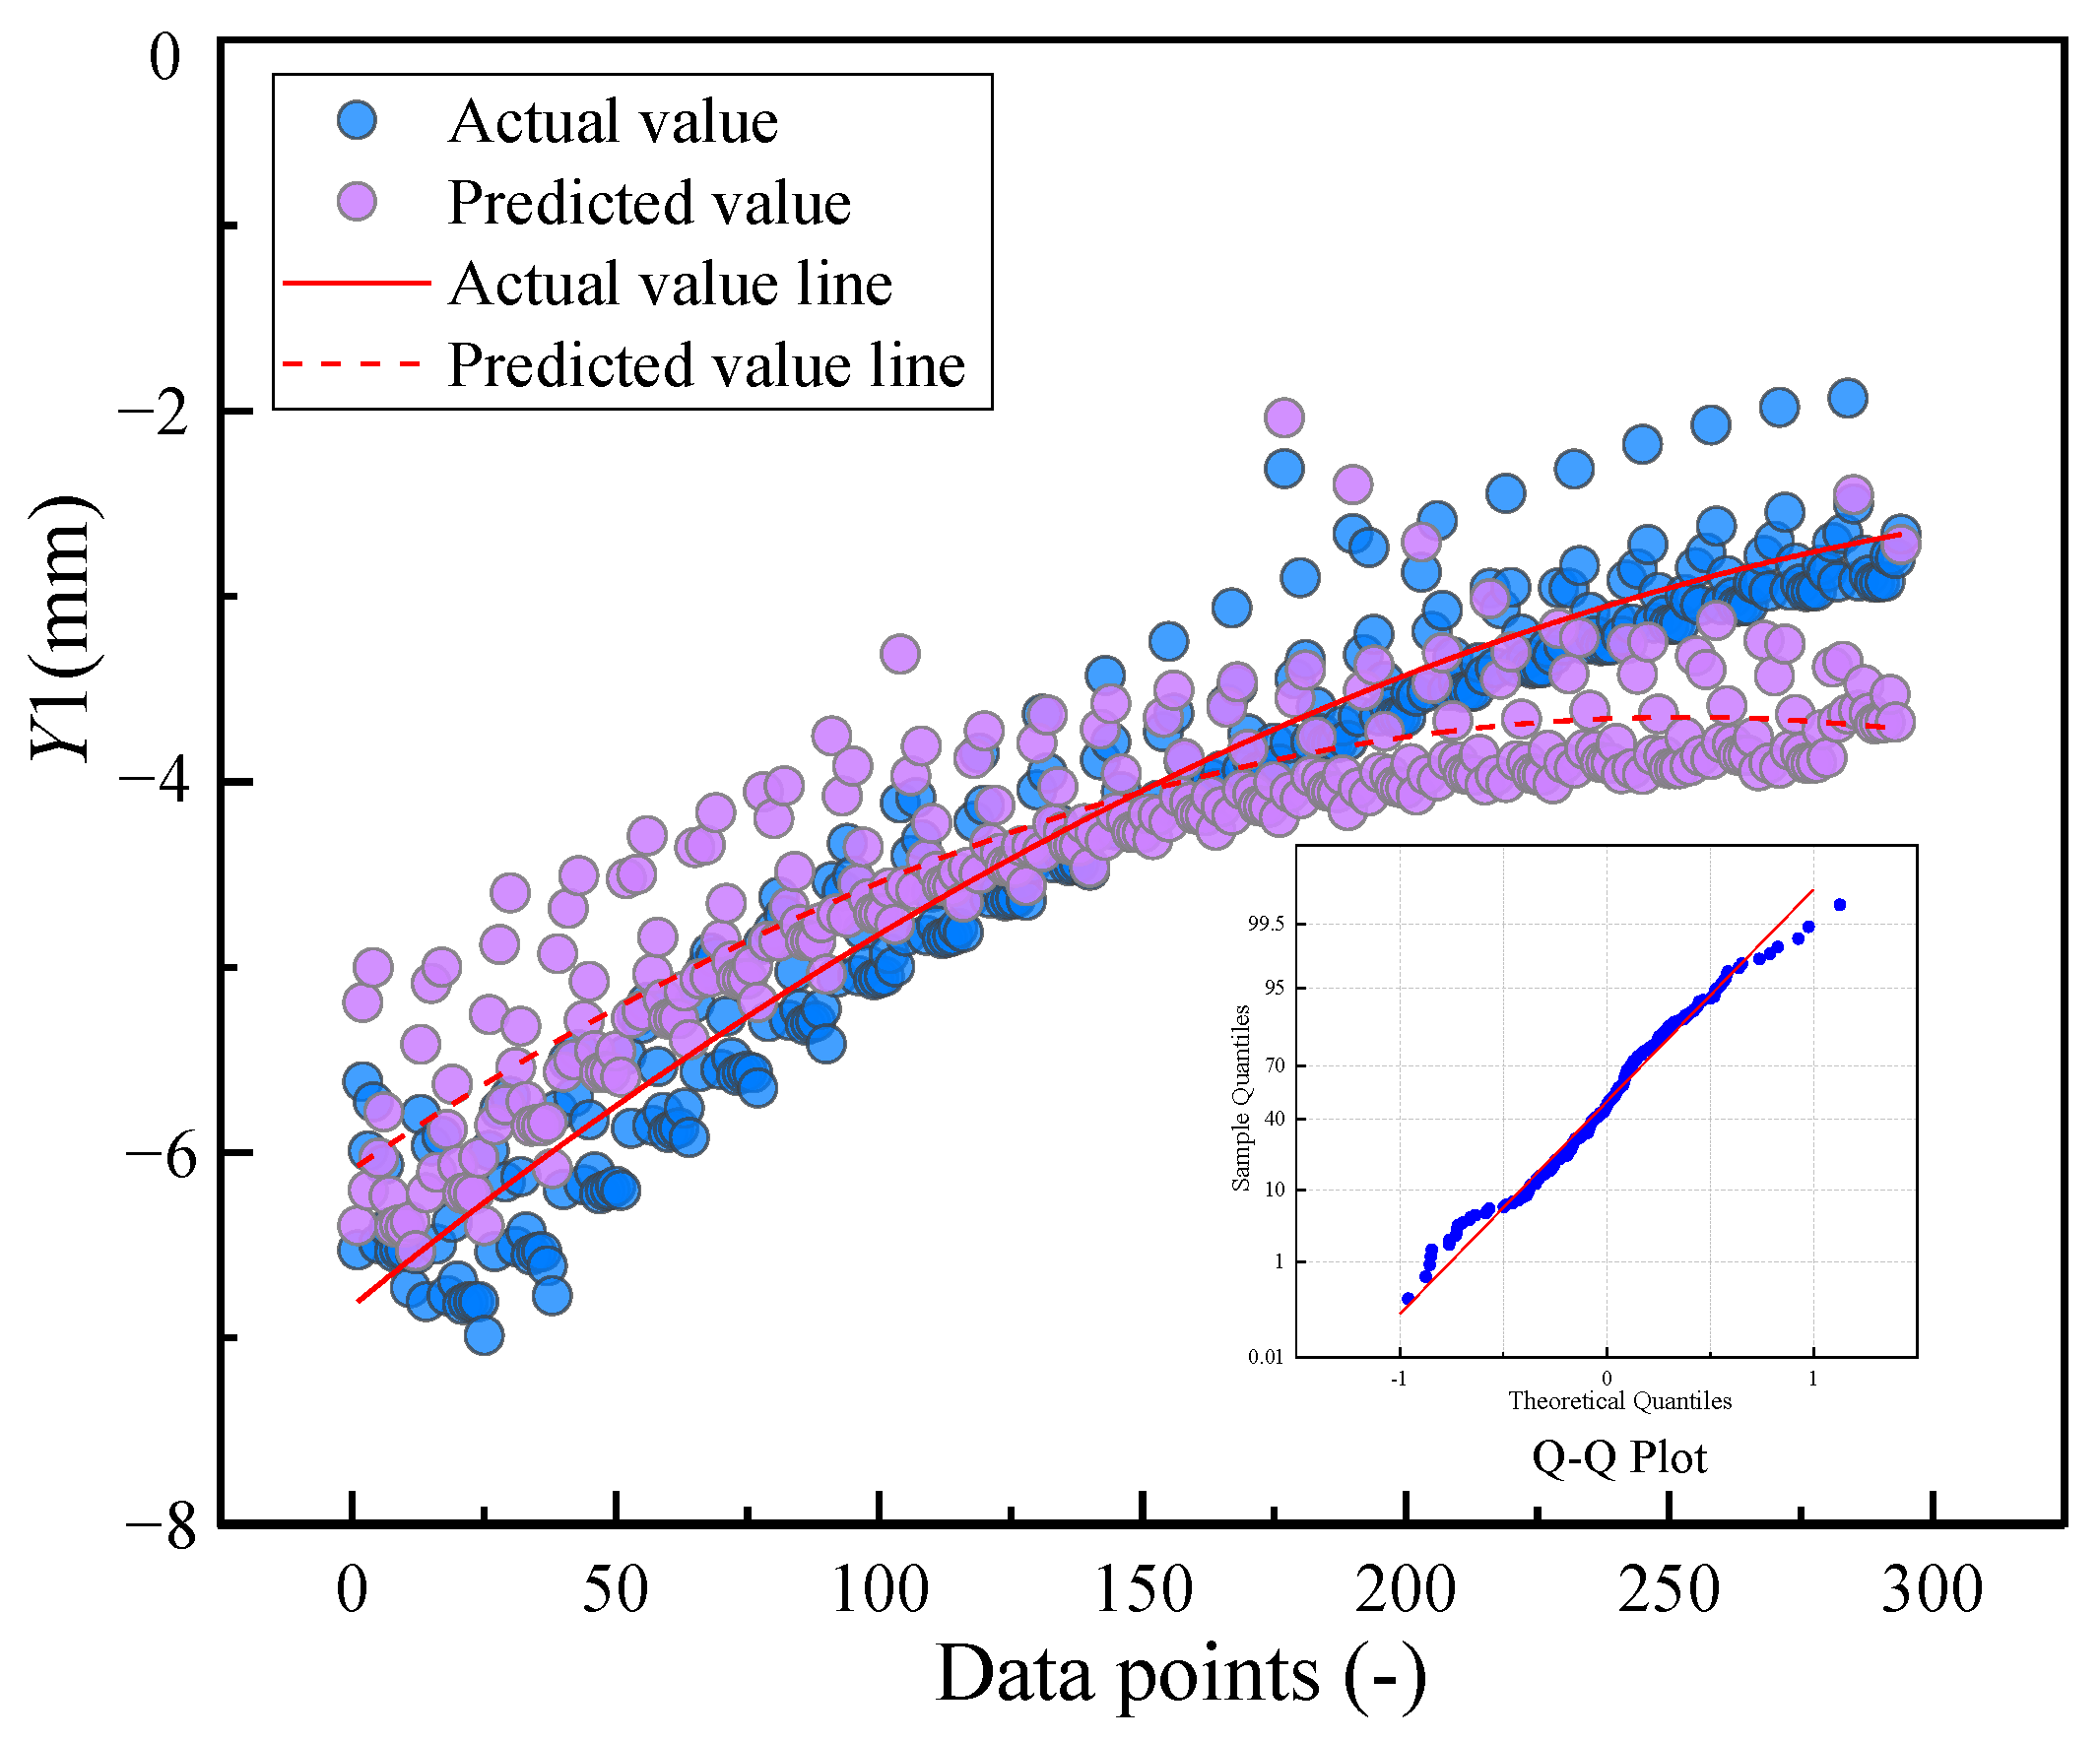
5.2.2. Vertical Displacement Criterion
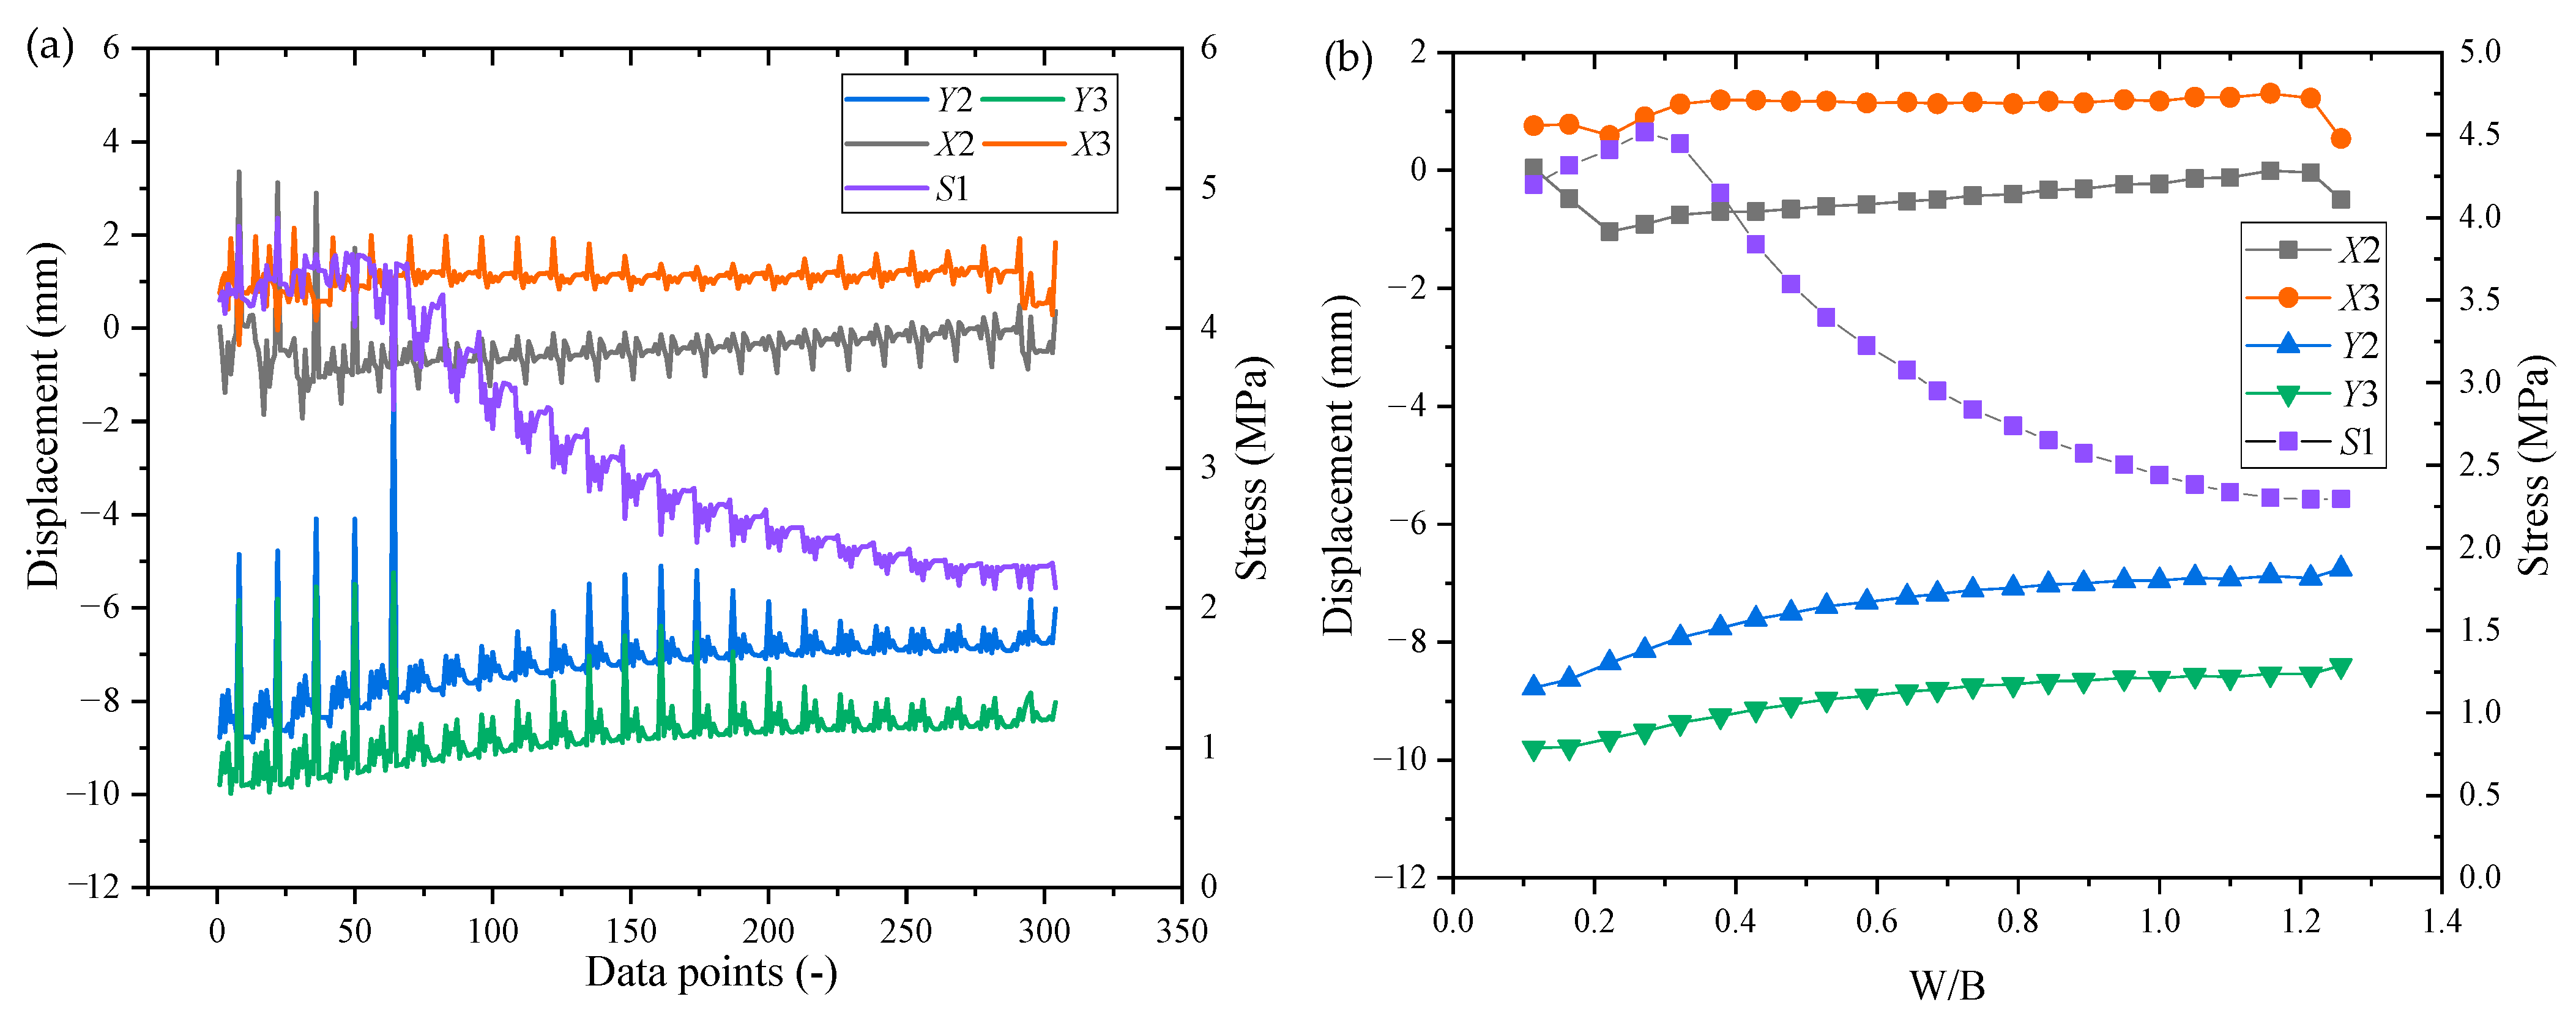
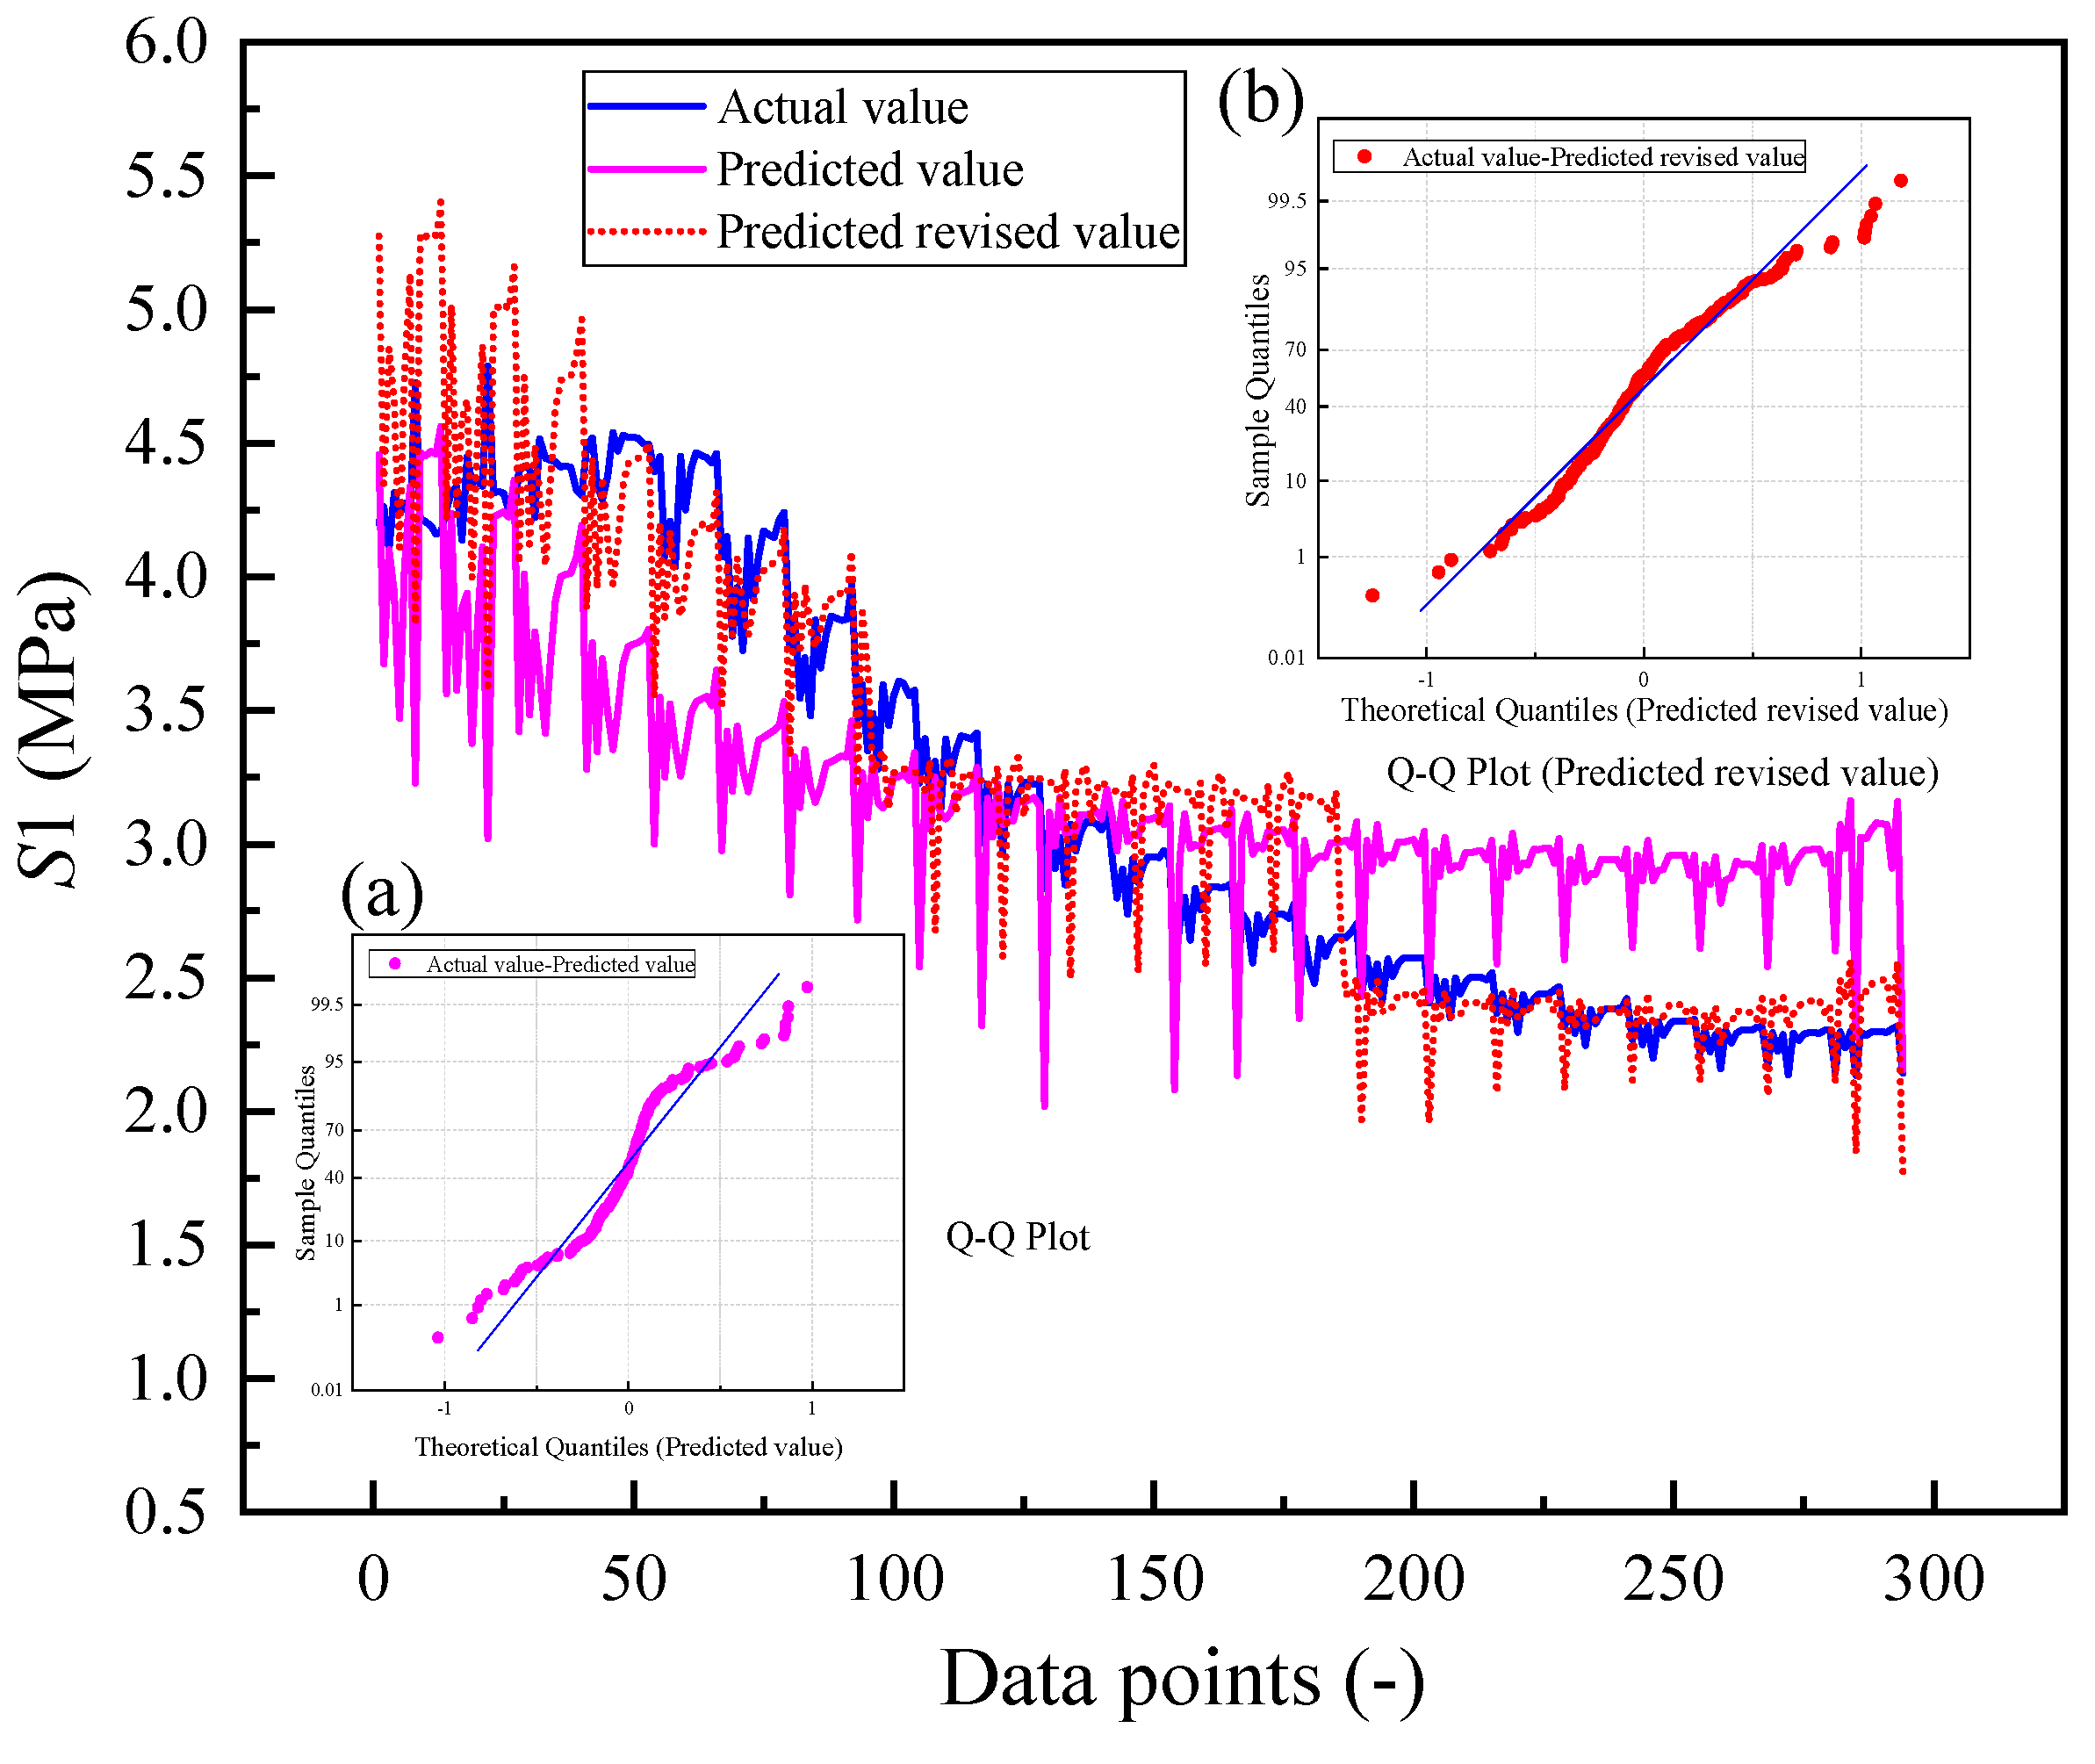
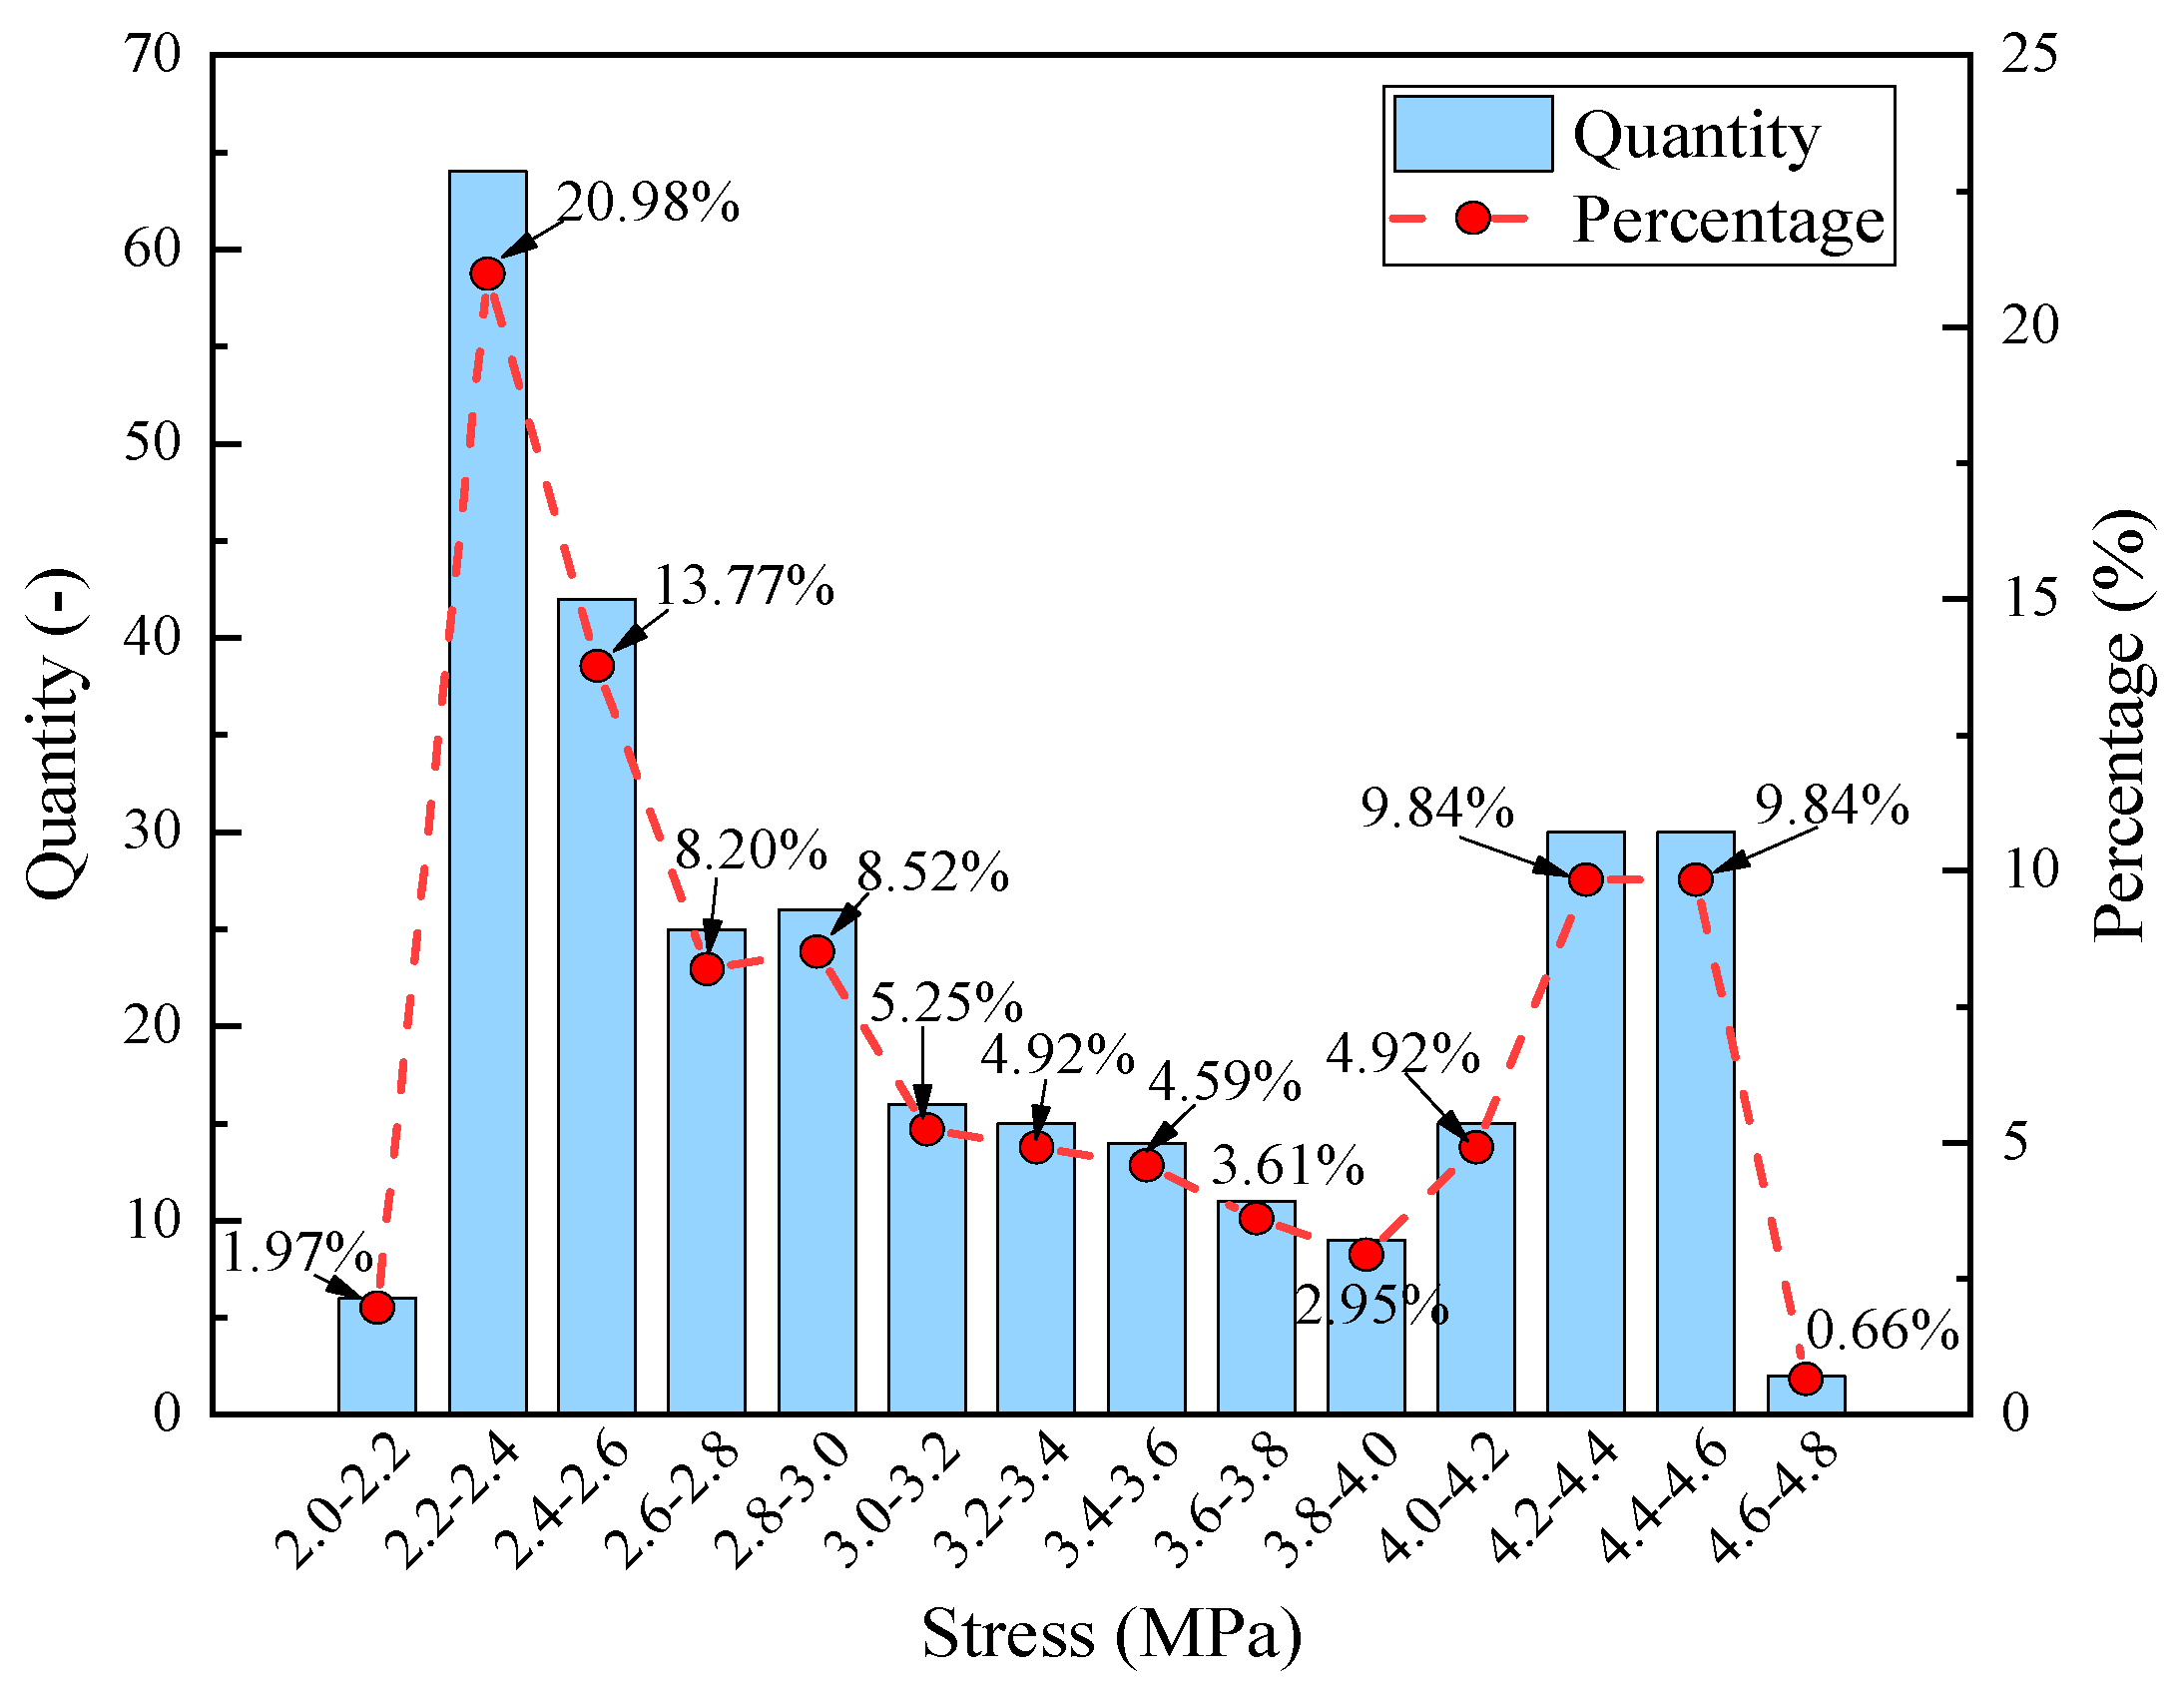
5.3. Stress Criteria of the MRP
5.4. Plasticity Criteria of the MRP
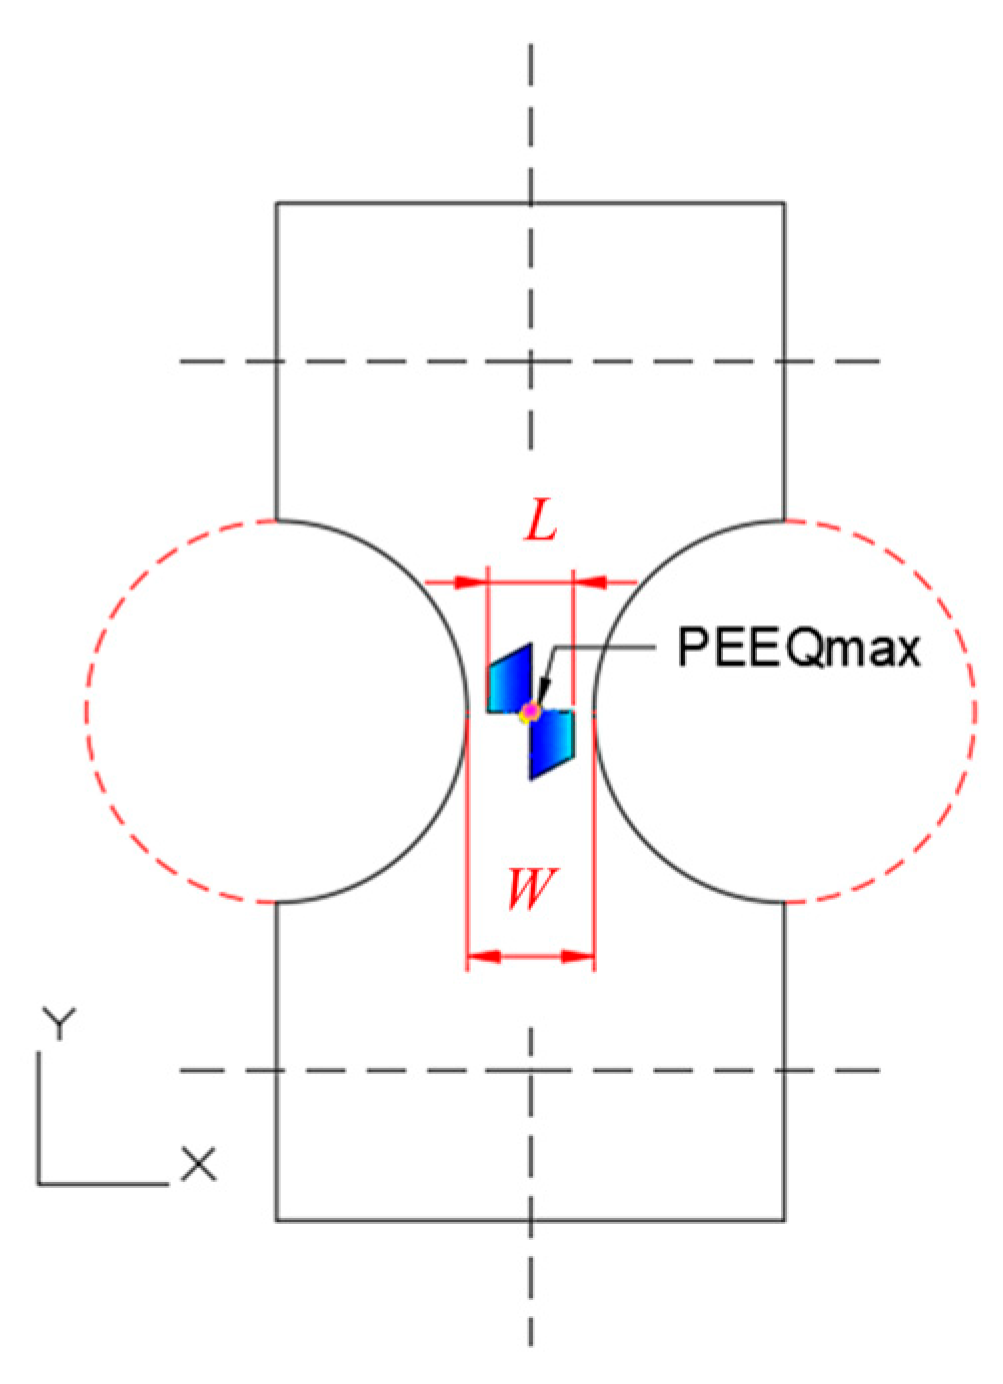
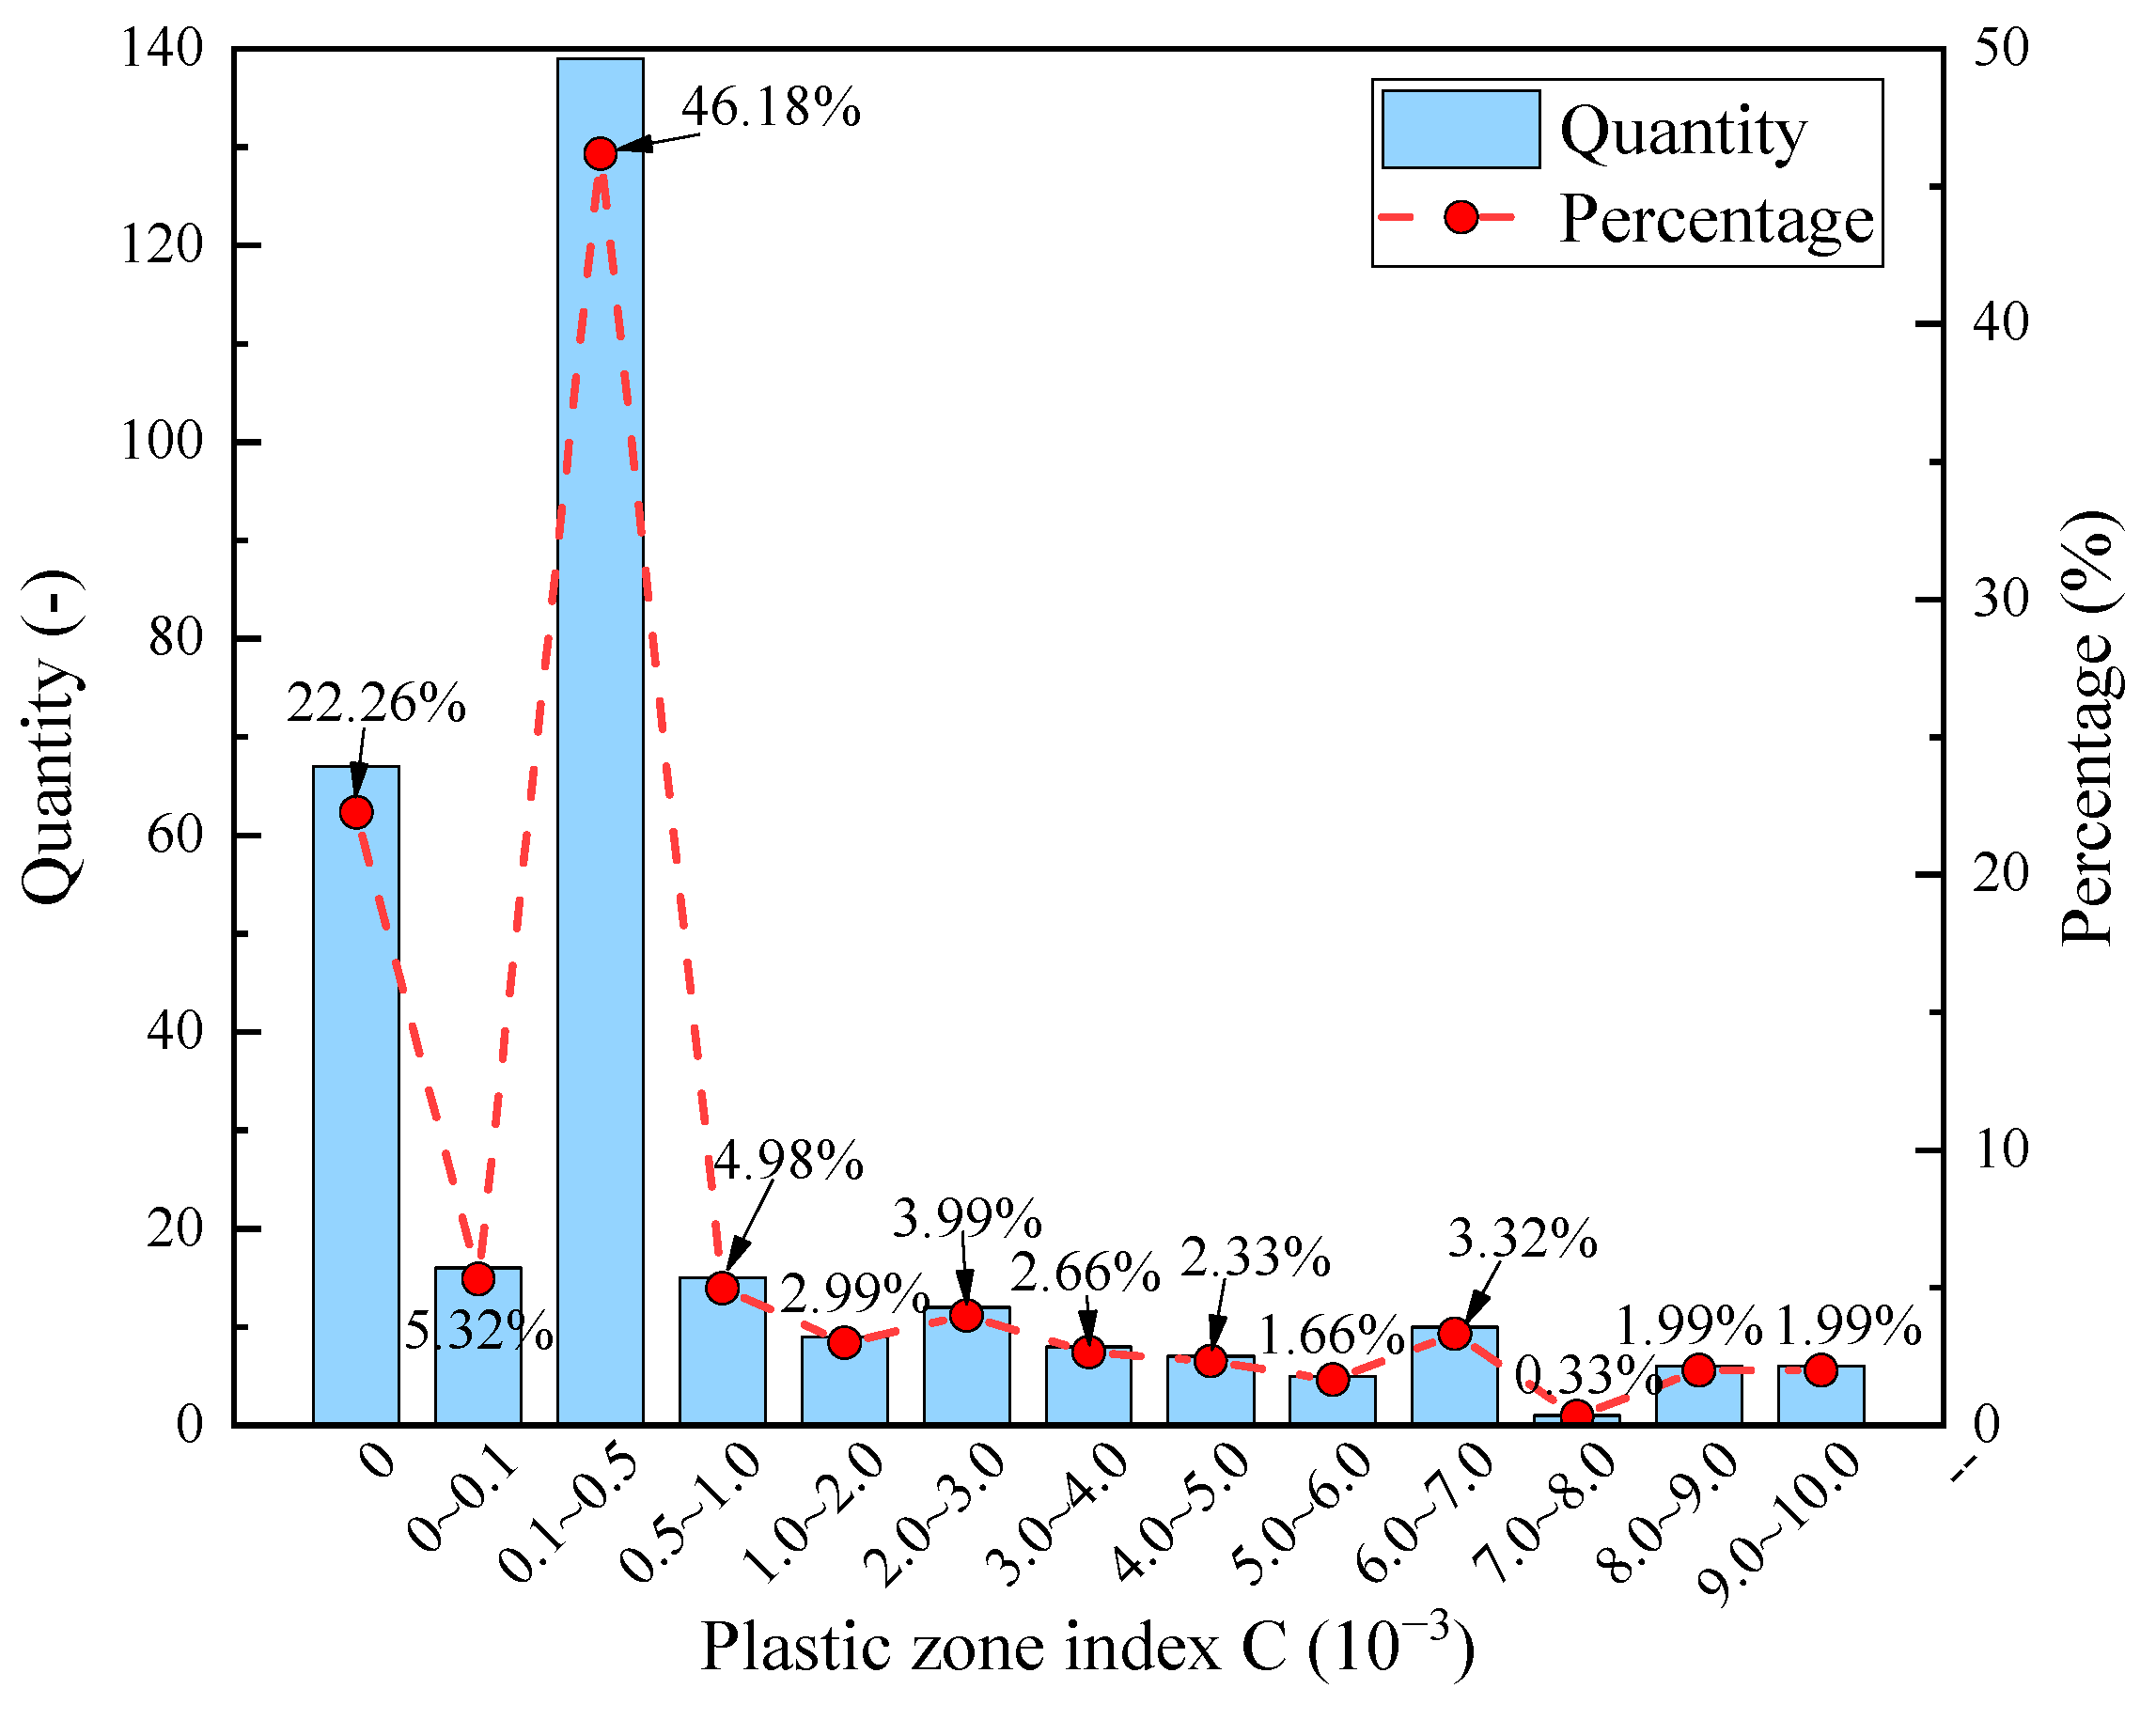
5.4.1. Distribution of the Plastic Zone
5.4.2. Plasticity Criteria Analysis of the MRP
6. Discussion
7. Conclusions
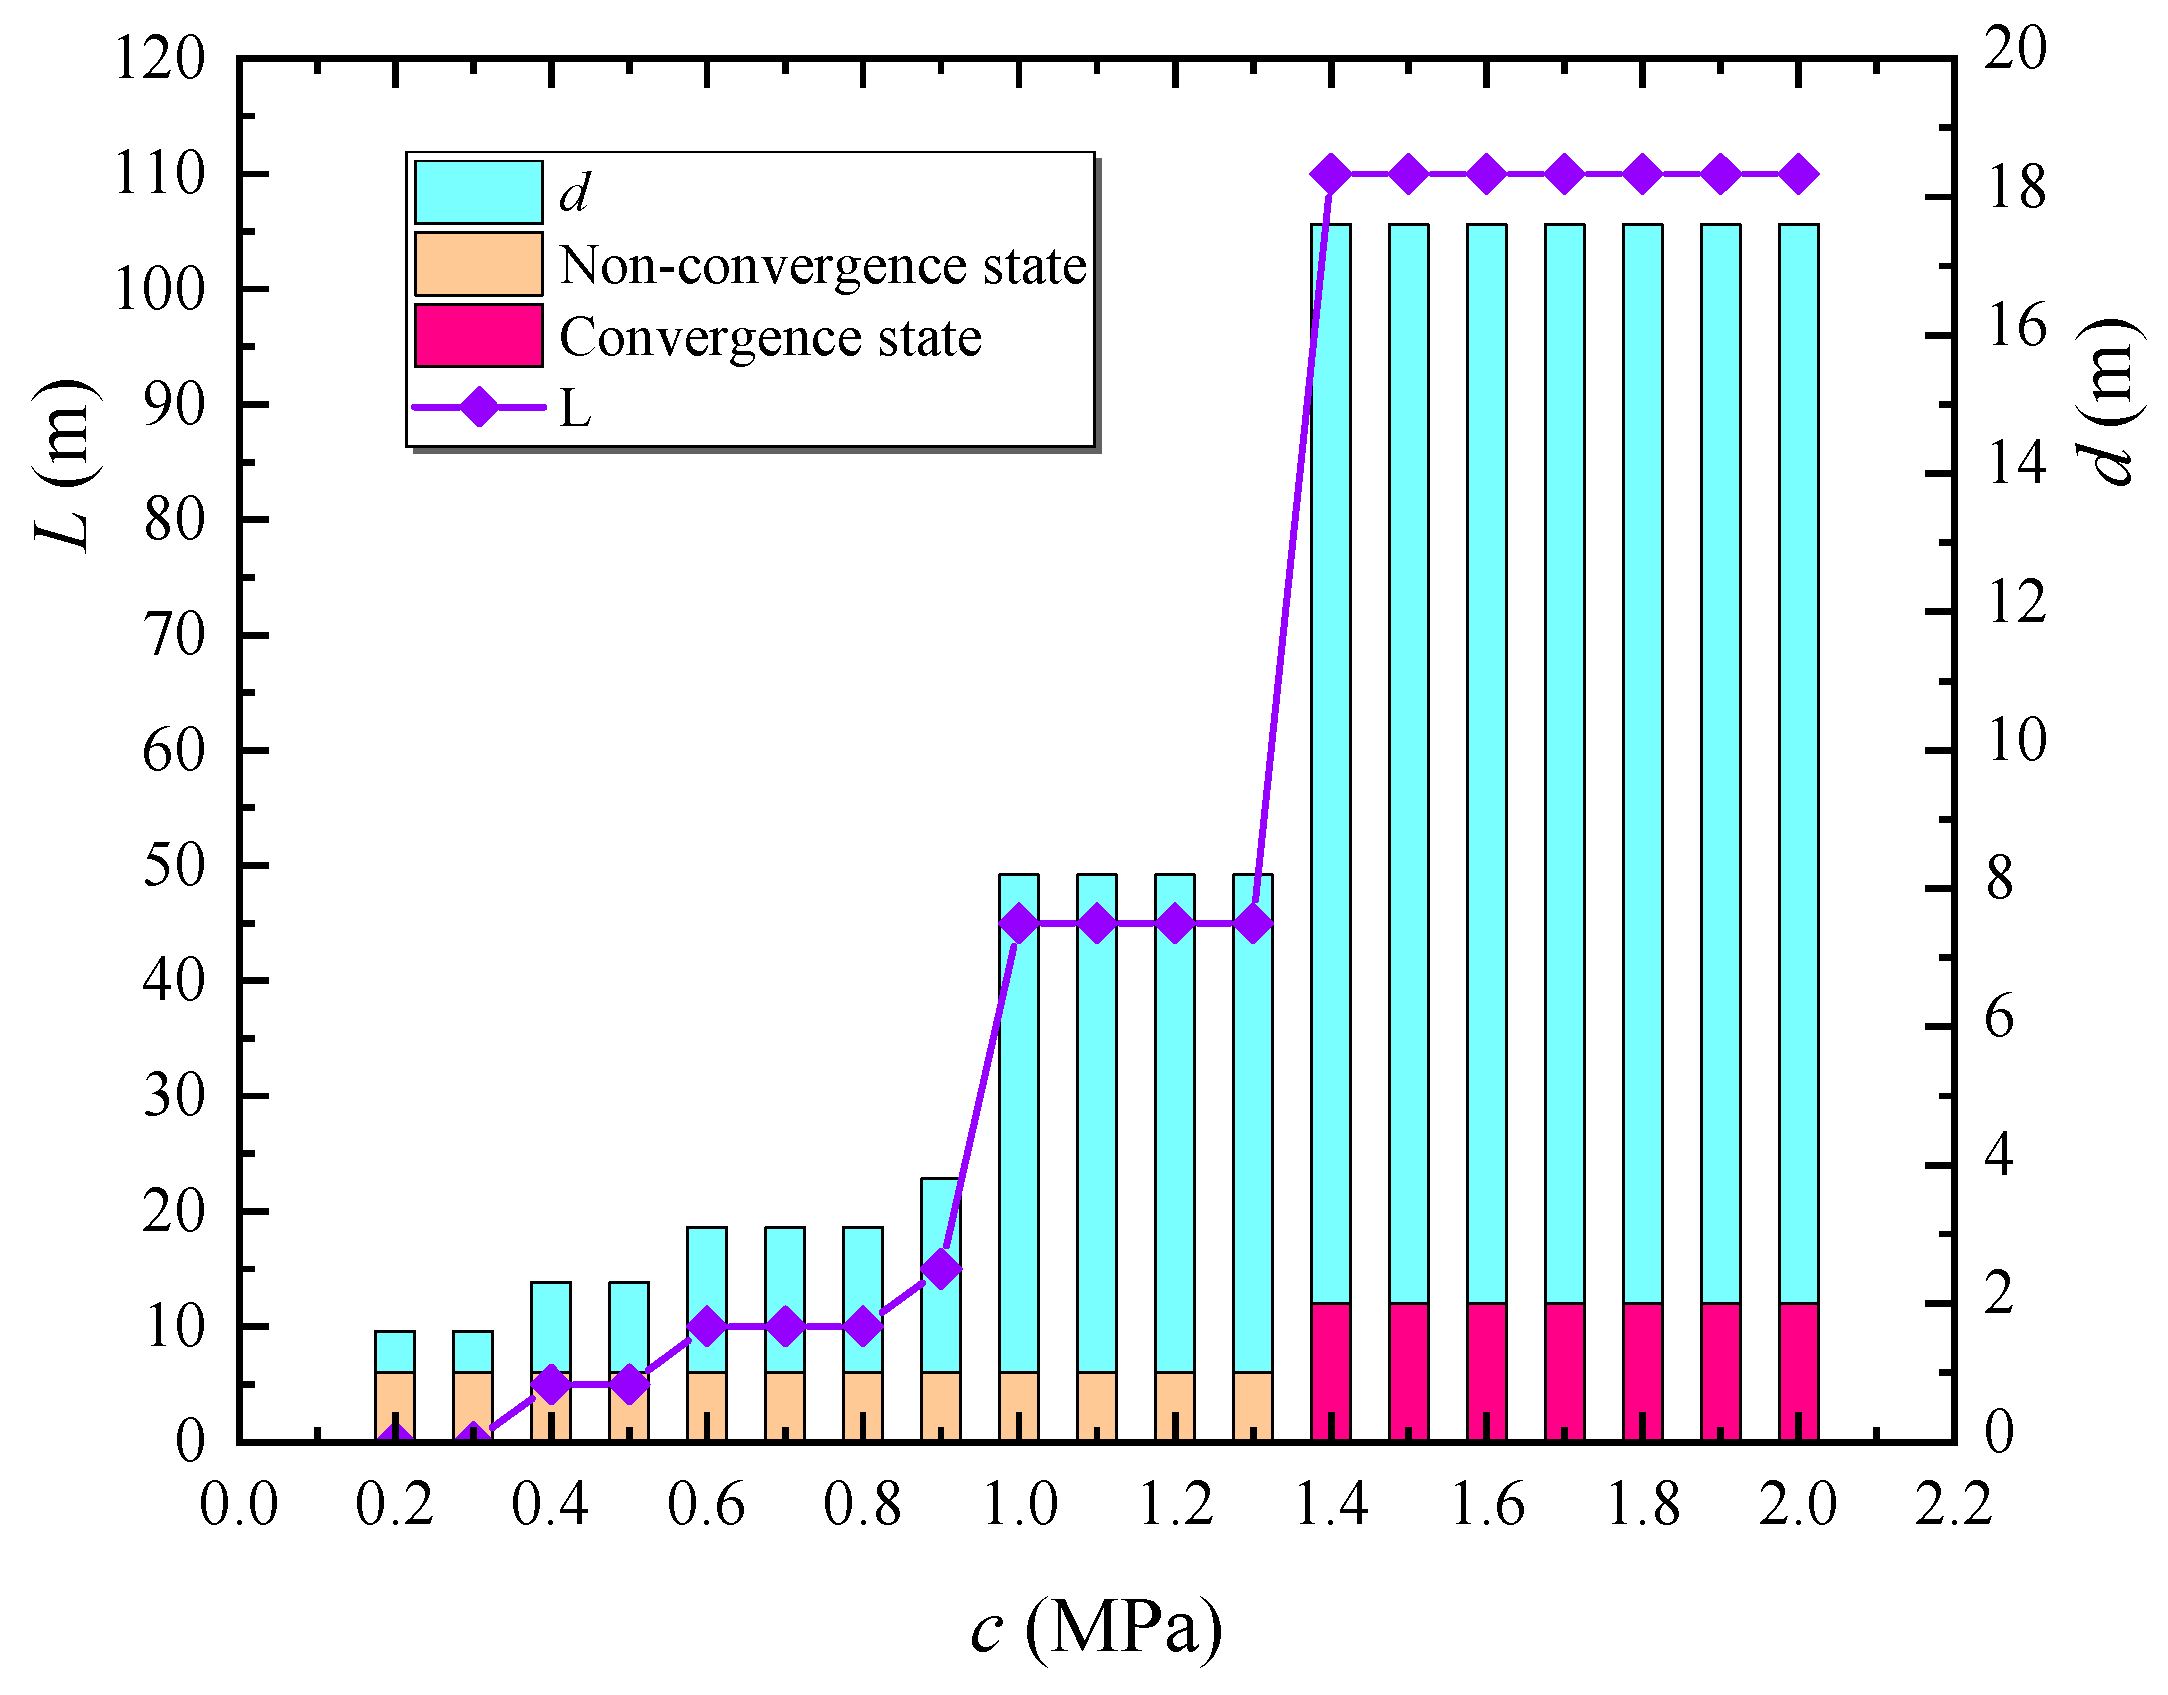
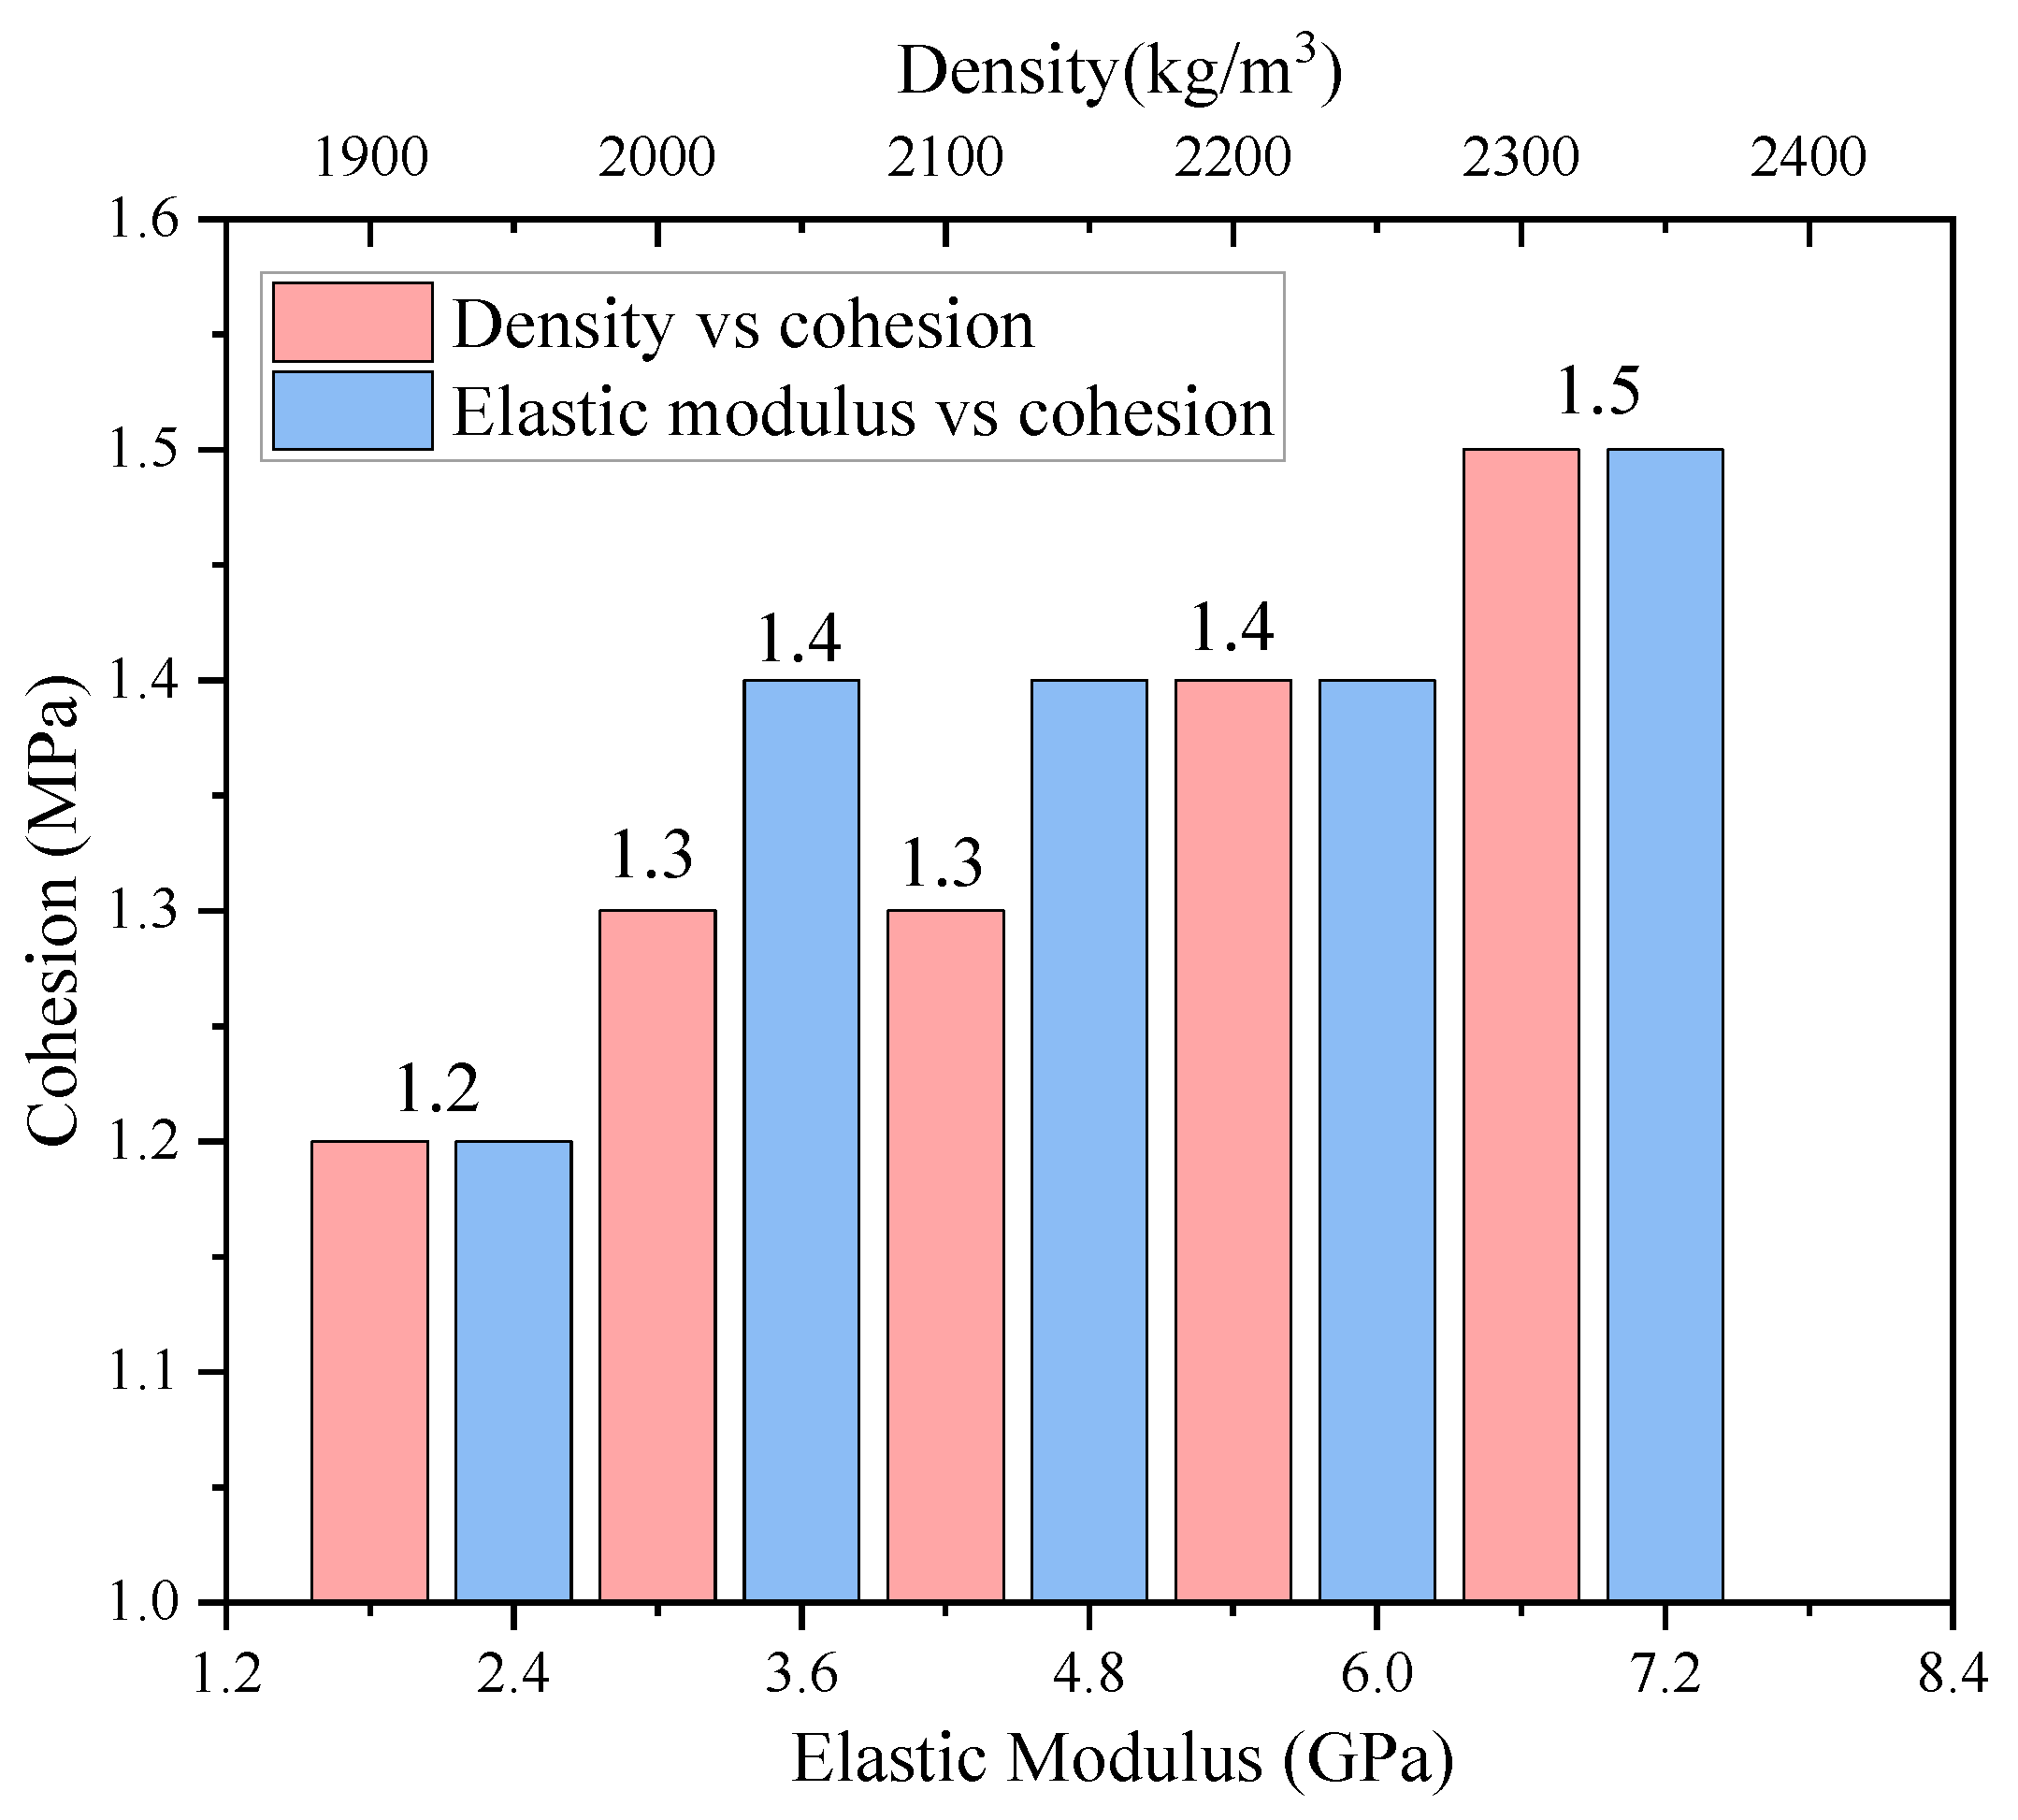
- (1)
- By varying the cohesion of the surrounding rock while keeping the other parameters constant, the stability state of a small clear-distance tunnel was investigated. It was observed that increasing the cohesion of the surrounding rock resulted in a longer distance of stable tunnel excavation. When the cohesion exceeded 1.4 MPa, the small clear-distance tunnel remained stable even with increasing clear distance. The minimum cohesion at convergence of the small-clearance tunnel excavation model increased as the density and modulus of elasticity of the surrounding rock increased. Therefore, this study proposes an initial determination of small-clearance tunnel stability on the basis of the parameters of the surrounding rock density, modulus of elasticity, and cohesion during the design stage.
- (2)
- By analyzing displacement data from monitoring points obtained through simulation, the relationships between horizontal clearance convergence and vertical displacement of the main line tunnel and ramp tunnel and between horizontal displacement and vertical displacement of the MRP were examined. This analysis led to the establishment of horizontal and vertical displacement criteria for the MRP.
- (3)
- This study analyzes the relationship between the convergence of horizontal clearance and the vertical displacement of the main line tunnel and ramp tunnel, as well as the stress of the MRP. The stress criteria for ensuring the stability of the MRP were determined via the linear regression method.
- (4)
- By analyzing the distribution and changes in the plastic zone of the MRP during excavation, it was determined that the plastic zone was initially distributed in the inner wall and center of the tunnel after the main tunnel and ramp were excavated. It was important to carefully consider construction speed and support measures to ensure construction safety and rock mass quality.
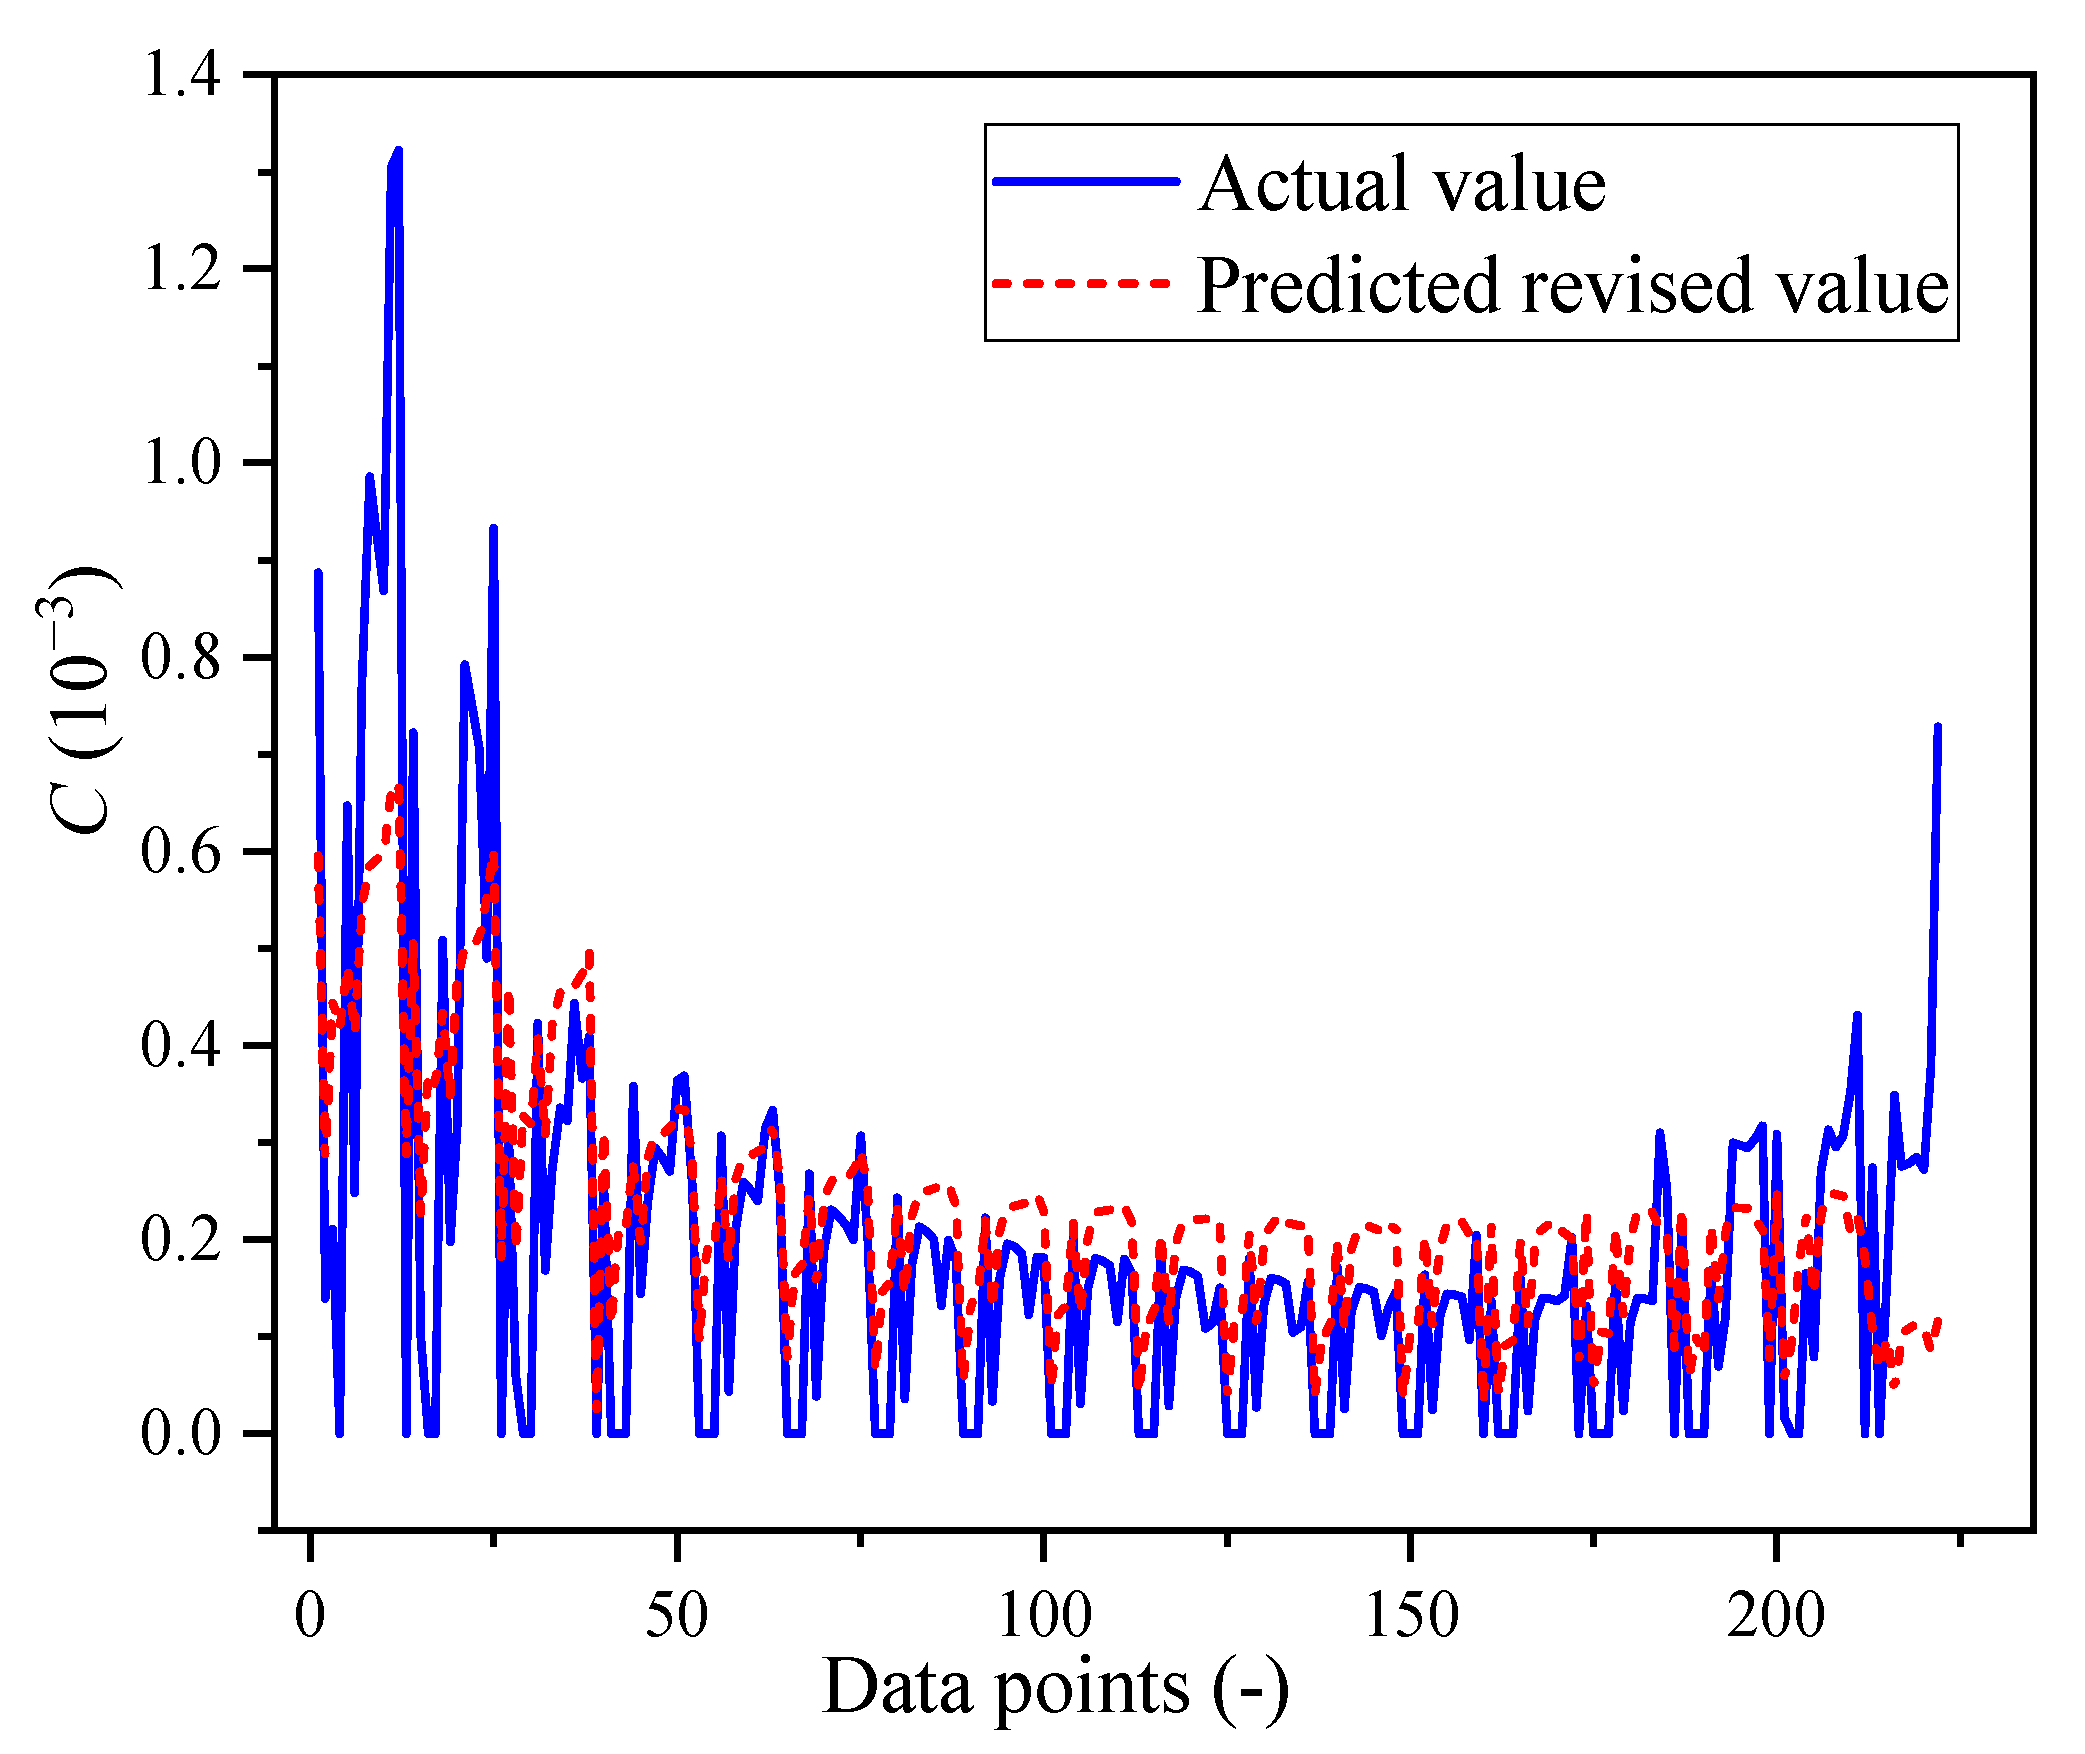
- (5)
- To assess the stability of the MRP, a plasticity zone index called C was introduced. By examining the correlation between C and the convergence of the horizontal headroom and the vertical displacement of the vault in small-clearance tunnels, the plasticity criteria for the stability of the MRP were proposed.
- (6)
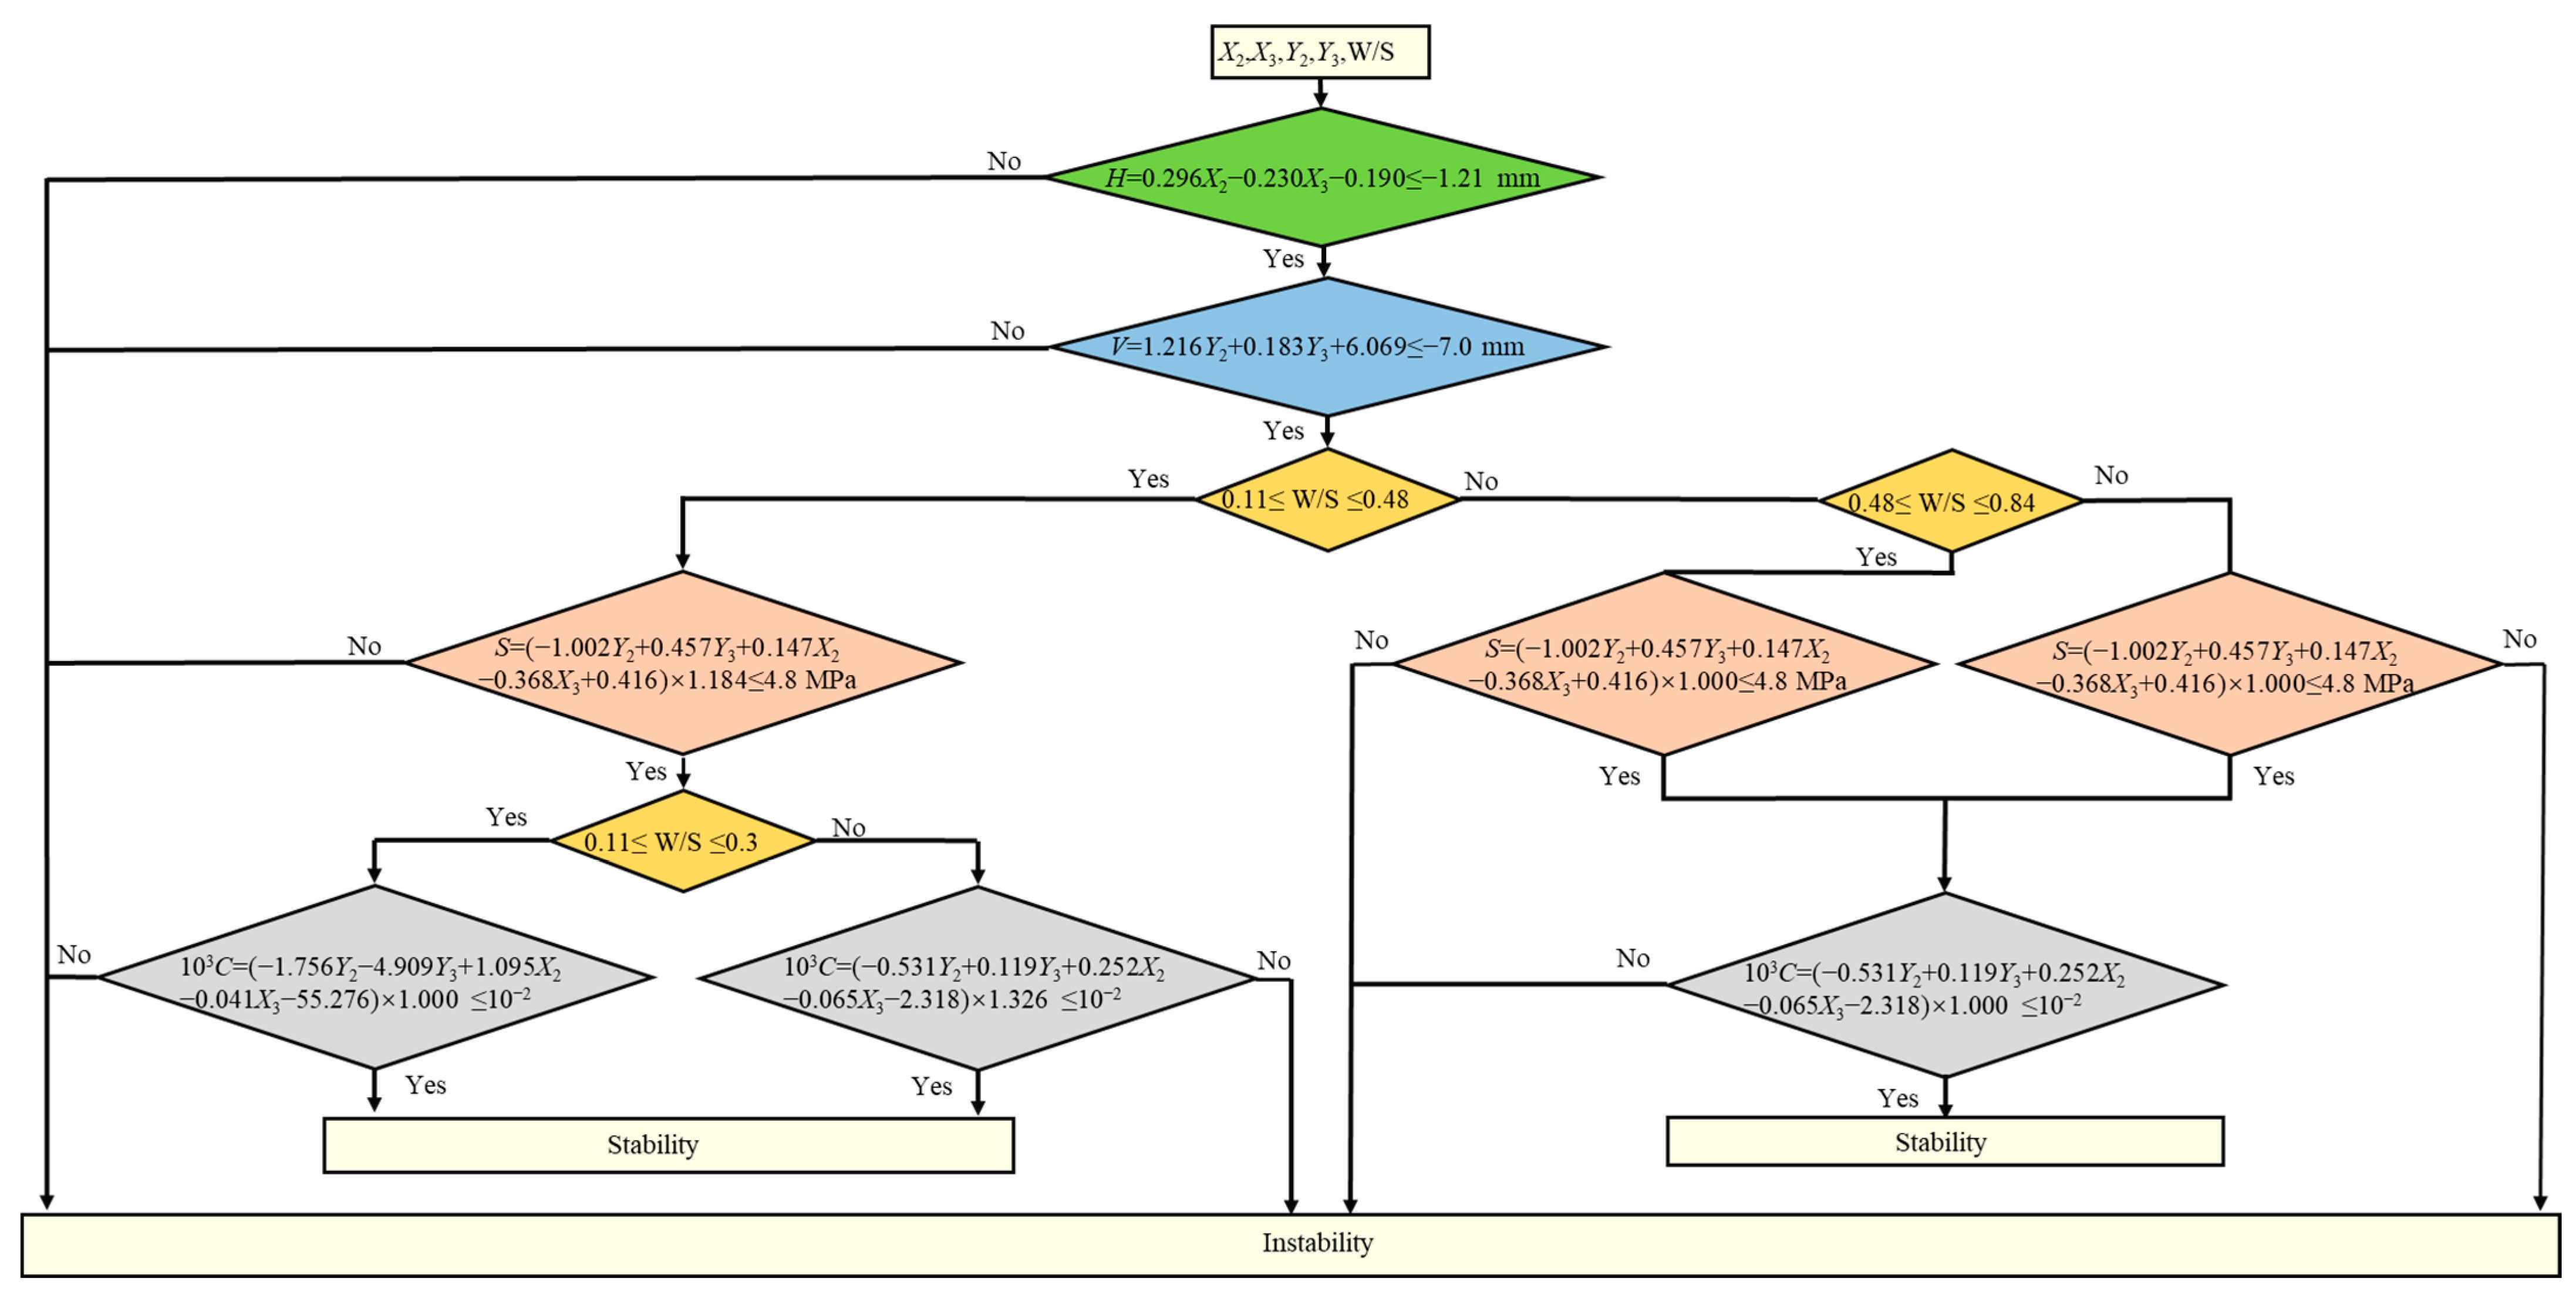
- In the construction of a bifurcated small-clearance tunnel, the stability of the MRP can be dynamically determined and controlled by considering the displacement, stress, and plasticity zone.
- (7)
- The proposed criteria, derived from a concrete engineering case study, can be extended to other similar projects with comparable frameworks. The threshold values and variables should be determined based on project-specific characteristics, such as clear-distance range, geological complexity, and data availability.
Author Contributions
Funding
Institutional Review Board Statement
Informed Consent Statement
Data Availability Statement
Acknowledgments
Conflicts of Interest
References
- Lyu, H.M.; Sun, W.J.; Shen, S.L.; Arulrajah, A. Flood risk assessment in metro systems of mega-cities using a GIS-based modeling approach. Sci. Total Environ. 2018, 626, 1012–1025. [Google Scholar] [CrossRef] [PubMed]
- Sun, M.M.; Jiang, C.W.; Yu, M.F.; Zhou, L.Y.; Mo, S.Y. Layout and Exploitation of Underground Traffic Space with City Growth. Chin. J. Undergr. Space Eng. 2019, 15, 980–989. [Google Scholar]
- Ren, D.J.; Shen, S.L.; Arulrajah, A.; Wu, H.N. Evaluation of ground loss ratio with moving trajectories induced in double-O-tube (DOT) tunnelling. Can. Geotech. J. 2018, 55, 894–902. [Google Scholar] [CrossRef]
- Tan, Y.; Jiang, W.Z.; Luo, W.J.; Lu, Y.; Xu, C.J. Longitudinal Sliding Event during Excavation of Feng-Qi Station of Hangzhou Metro Line 1: Postfailure Investigation. J. Perform. Constr. Facil. 2018, 32, 04018039. [Google Scholar] [CrossRef]
- Tan, Y.; Wei, B.; Lu, Y.; Yang, B. Is Basal Reinforcement Essential for Long and Narrow Subway Excavation Bottoming Out in Shanghai Soft Clay? J. Geotech. Geoenviron. Eng. 2019, 145, 05019002. [Google Scholar] [CrossRef]
- Ye, G.L.; Hashimoto, T.; Shen, S.L.; Zhu, H.H.; Bai, T.H. Lessons learnt from unusual ground settlement during Double-O-Tube tunnelling in soft ground. Tunn. Undergr. Space Technol. 2015, 49, 79–91. [Google Scholar] [CrossRef]
- Gong, Y.F.; Wang, Z.Y.; Zhang, J.R.; Li, S.P.; Zhang, H. Study on Supporting Effect of Middle Rock Pillars in Small Clear Distance Section of Long-span Forked Tunnel with Five lanes. J. Highw. Transp. Res. Dev. 2021, 38, 123–133. (In Chinese) [Google Scholar] [CrossRef]
- Song, S.G.; Li, S.C.; Li, L.P.; Shi, S.S.; Zhou, Z.Q.; Liu, Z.H.; Shang, C.S.; Sun, H.Z. Model test study on vibration blasting of large cross-section tunnel with small clearance in horizontal stratified surrounding rock. Tunn. Undergr. Space Technol. 2019, 92, 103013. [Google Scholar] [CrossRef]
- Gong, J.W.; Xia, C.C.; Lei, X.W. Analysis of field measurement and theoretical calculation on rock pressure in shallow-buried twin tunnels with small spacing. Chin. J. Rock Mech. Eng. 2010, 29, 4139–4145. [Google Scholar]
- Hou, F.J.; Liu, C.; Wang, K.; Yuan, Z.; Li, T.; Zhou, S. Net distance optimization of super-large section tunnel using new elastoplastic-damage model combining tensile and shear yield modes. Arab. J. Geosci. 2021, 14, 2657. [Google Scholar] [CrossRef]
- Jiang, Q.; Song, S.G.; Li, T.; Wang, K.; Gu, R.H. Study on Surrounding Rock Stability of Small Clear-Distance Twin Highway Tunnel with Eight Lanes. Geotech. Geol. Eng. 2019, 37, 593–598. [Google Scholar] [CrossRef]
- Shi, C.H.; Cao, C.Y.; Lei, M.F. Construction technology for a shallow-buried underwater interchange tunnel with a large span. Tunn. Undergr. Space Technol. 2017, 70, 317–329. [Google Scholar] [CrossRef]
- Xia, M.R. Influence factors of surrounding rock stability of neighborhood tunnel. J. Civ. Environ. Eng. 2021, 43, 73–80. [Google Scholar] [CrossRef]
- Yang, X.L.; Sui, Z.Y. Numerical simulation of construction sequence for shallow embedded bias tunnels with small clear distance. J. Cent. South Univ. Sci. Technol. 2007, 38, 764–770. [Google Scholar]
- Chen, J.X.; Xu, Z.L.; Luo, Y.B.; Song, J.K.; Liu, W.W.; Dong, F.F. Application of the Upper-Bench CD Method in Super Large-Span and Shallow Tunnel: A Case Study of Letuan Tunnel. Adv. Civ. Eng. 2020, 2020, 8826232. [Google Scholar] [CrossRef]
- Sahoo, J.P.; Kumar, J. Stability of long unsupported twin circular tunnels in soils. Tunn. Undergr. Space Technol. 2013, 38, 326–335. [Google Scholar] [CrossRef]
- Yamaguchi, I.; Yamazaki, I.; Kiritani, Y. Study of Ground-Tunnel Interactions of Four Shield Tunnels Driven in Close Proximity, in Relation to Design and Construction of Parallel Shield Tunnels. Tunn. Undergr. Space Technol. 1998, 13, 289–304. [Google Scholar] [CrossRef]
- Yamamoto, K.; Lyamin, A.V.; Wilson, D.W.; Sloan, S.W.; Abbo, A.J. Stability of a circular tunnel in cohesive-frictional soil subjected to surcharge loading. Comput. Geotech. 2011, 38, 504–514. [Google Scholar] [CrossRef]
- Wang, J.X.; Cao, A.S.; Li, Z.H.; Wu, Z.; Lin, L.H.; Liu, X.T.; Li, H.B.Q.; Sun, Y.W. Mechanical Behavior and Excavation Optimization of a Small Clear-Distance Tunnel in an Urban Super Large and Complex Underground Interchange Hub. Appl. Sci. 2023, 13, 254. [Google Scholar] [CrossRef]
- Zhang, W.G.; Goh, A.T.C. Numerical study of pillar stresses and interaction effects for twin rock caverns. Int. J. Numer. Anal. Methods Geomech. 2015, 39, 193–206. [Google Scholar] [CrossRef]
- Tan, Z.; Zhou, Z.; Kong, H.; Zhao, B.; Zhao, J. Single excavation face method for super-large-span bifurcated tunnels. Proc. Inst. Civ. Eng. Geotech. Eng. 2021, 174, 406–418. [Google Scholar] [CrossRef]
- Zhou, S.; Li, L.P.; An, Z.M.; Liu, H.L.; Yang, G.Y.; Zhou, P.F. Stress-Release Law and Deformation Characteristics of Large-Span Tunnel Excavated with Semi Central Diaphragm Method. KSCE J. Civ. Eng. 2021, 25, 2275–2284. [Google Scholar] [CrossRef]
- Fang, Q.; Zhang, D.L.; Wong, L.N.Y. Shallow tunnelling method (STM) for subway station construction in soft ground. Tunn. Undergr. Space Technol. 2012, 29, 10–30. [Google Scholar] [CrossRef]
- Li, L.P.; Shang, C.S.; Chu, K.W.; Zhou, Z.Q.; Song, S.G.; Liu, Z.H.; Chen, Y.H. Large-scale geo-mechanical model tests for stability assessment of super-large cross-section tunnel. Tunn. Undergr. Space Technol. 2021, 109, 103756. [Google Scholar] [CrossRef]
- Fu, J.Y.; Yang, J.S.; Yan, L.; Abbas, S.M. An analytical solution for deforming twin-parallel tunnels in an elastic half plane. Int. J. Numer. Anal. Methods Geomech. 2015, 39, 524–538. [Google Scholar] [CrossRef]
- Radi, E. Path-independent integrals around two circular holes in an infinite plate under biaxial loading conditions. Int. J. Eng. Sci. 2011, 49, 893–914. [Google Scholar] [CrossRef]
- Zhang, D.L.; Chen, L.P.; Fang, Q.; Song, R.G. Research and application on central rock wall dike stability of small interval tunnel. J. Beijing Jiaotong Univ. 2016, 40, 1–11. (In Chinese) [Google Scholar] [CrossRef]
- Su, F.; Chen, F.Q.; Shi, Y.Z. Analytic continuation solution of deep twin-tunnels. Chin. J. Rock Mech. 2012, 31, 365–374. (In Chinese) [Google Scholar]
- Kooi, C.B.; Verruijt, A. Interaction of circular holes in an infinite elastic medium. Tunn. Undergr. Space Technol. 2001, 16, 59–62. [Google Scholar] [CrossRef]
- Lyu, H.M.; Shen, S.L.; Zhou, A.N.; Chen, K.L. Calculation of pressure on the shallow-buried twin-tunnel in layered strata. Tunn. Undergr. Space Technol. 2020, 103, 103465. [Google Scholar] [CrossRef]
- Li, S.C.; Wang, H.P.; Zheng, X.F. Forked tunnel stability analysis and its construction optimization research. Chin. J. Rock Mech. Eng. 2008, 27, 447–457. (In Chinese) [Google Scholar]
- Luo, Y.B.; Wang, S.H.; Chen, J.X.; Wang, C.W. Calculation method of surrounding rock pressure in deep buried neighborhood tunnels considering safety reserve of middle rock pillar. J. Shandong Univ. Eng. Sci. 2023, 54, 81–93. Available online: https://link.cnki.net/urlid/37.1391.T.20230719.1526.002 (accessed on 5 June 2024). (In Chinese).
- Ying, G.G.; Zhang, S.L.; Zhou, M.; Chen, L.P. A Simplified Method for Calculating Stresses in Middle Rock Wall of Small Interval Tunnels Based on Reserved Supporting Hypothesis. J. Highw. Transp. Res. Dev. 2018, 35, 95–103. (In Chinese) [Google Scholar] [CrossRef]
- Lee, C.J.; Wu, B.R.; Chen, H.T.; Chiang, K.H. Tunnel stability and arching effects during tunneling in soft clayey soil. Tunn. Undergr. Space Technol. 2006, 21, 119–132. [Google Scholar] [CrossRef]
- Lei, M.F.; Peng, L.M.; Shi, C.H. Model test to investigate the failure mechanisms and lining stress characteristics of shallow buried tunnels under unsymmetrical loading. Tunn. Undergr. Space Technol. 2015, 46, 64–75. [Google Scholar] [CrossRef]
- Li, L.P.; Fan, H.Y.; Liu, H.L.; Li, S.G.; Cheng, S.; Zhang, Q.H.; Tu, W.F.; Zhou, S. Model test and numerical simulation research on the mechanical response law of lager span and small interval tunnels constructed by CD method. Tunn. Undergr. Space Technol. 2023, 132, 104947. [Google Scholar] [CrossRef]
- Zhu, H.H.; Huang, F.; Xu, Q.W. Model test and numerical simulation for progressive failure of weak and fractured tunnel surrounding rock under different overburden depths. Chin. J. Rock Mech. Eng. 2010, 29, 1113–1122. [Google Scholar]
- Tyagi, A.; Lee, F.H. Influence of tunnel failure on the existing large-diameter tunnel in improved soil surround. Tunn. Undergr. Space Technol. 2022, 120, 104276. [Google Scholar] [CrossRef]
- Yao, Y.; He, C.; Xie, Z.X. Study of mechanical behavior and reinforcing measures of middle rock wall of parallel tunnel with small interval. Rock Soil Mech. 2007, 28, 1883–1888. [Google Scholar] [CrossRef]
- Liu, Y.; Zhou, Y.B. Study on Partition and Reinforcement Method of Middle Rock Pillar in Soft Rock Tunnel with Small Clear Distance. Chin. J. Undergr. Space Eng. 2013, 9, 373–379. [Google Scholar]
- Lin, P.; Zhou, Y.N.; Liu, H.Y.; Wang, C. Reinforcement design and stability analysis for large-span tailrace bifurcated tunnels with irregular geometry. Tunn. Undergr. Space Technol. 2013, 38, 189–204. [Google Scholar] [CrossRef]
- Zhang, H.J.; Qiu, W.G.; Feng, J.M. Mechanical performance of shared rock of neighborhood tunnels. Chin. J. Geotech. Eng. 2010, 32, 434–439. [Google Scholar]
- Mortazavi, A.; Hassani, F.P.; Shabani, M. A numerical investigation of rock pillar failure mechanism in underground openings. Comput. Geotech. 2009, 36, 691–697. [Google Scholar] [CrossRef]
- Schneider-Muntau, B.; Medicus, G.; Fellin, W. Strength reduction method in Barodesy. Comput. Geotech. 2018, 95, 57–67. [Google Scholar] [CrossRef]
- Chen, X.; Ren, J.L.; Wang, D.Y.; Lyu, Y.N.; Zhang, H. A Generalized Strength Reduction Concept and Its Applications to Geotechnical Stability Analysis. Geotech. Geol. Eng. 2019, 37, 2409–2424. [Google Scholar] [CrossRef]
- Wang, W.; Zhang, J.Q.; Li, A. The Application of the Strength Reduction Shortest Path Method to the Stability Analysis of Shallow Buried Tunnel. Geotech. Geol. Eng. 2022, 40, 1091–1101. [Google Scholar] [CrossRef]
- Dawson, E.M.; Roth, W.H.; Drescher, A. Slope stability analysis by strength reduction. Géotechnique 1999, 49, 835–840. [Google Scholar] [CrossRef]
- Zienkiewicz, C.; Humpheson, C.; Lewis, R.W. Associated and non-associated visco-plasticity and plasticity in soil mechanics. Géotechnique 1975, 25, 671–689. [Google Scholar] [CrossRef]
- Peng, C.; Ji, D.; Zhao, L.; Qian, Z.Y.; Ren, F.H. Stability Analysis of Dump Slope Based on FEM Strength Reduction Method. Appl. Mech. Mater. 2014, 501–504, 51–55. [Google Scholar] [CrossRef]
- Tang, X.S.; Zheng, Y.R.; Wang, Y.F. Application of FEM Strength Reduction Method in Stability Analysis and Control of Tunnel Construction. Mod. Tunn. Technol. 2020, 57, 45–55+64. [Google Scholar] [CrossRef]
- An, Y.L.; Li, J.H.; Yue, J.; Zhou, J. Effect of Seepage Force on Tunnel Face Stability Using Limit Analysis with SRM. Geotech. Geotech. Geol. Eng. 2021, 39, 1743–1751. [Google Scholar] [CrossRef]
- Su, Y.; Su, Y.; Zhao, M.; Vlachopoulos, N. Tunnel Stability Analysis in Weak Rocks Using the Convergence Confinement Method. Rock Mech. Rock Eng. 2021, 54, 559–582. [Google Scholar] [CrossRef]
- Xia, C.C.; Xu, C.B.; Zhao, X. Study of the strength reduction dda method and its application to mountain tunnel. Int. J. Comput. Methods 2012, 9, 1250041. [Google Scholar] [CrossRef]
- Yang, X.L.; Huang, F. Stability analysis of shallow tunnels subjected to seepage with strength reduction theory. J. Cent. South Univ. Technol. 2009, 16, 1001–1005. [Google Scholar] [CrossRef]
- Zhou, L.; Zhu, Z.M.; Li, Y.X. Influence of Principal Stress Orientation on Tunnel Stability Based on the Finite-Element Strength Reduction Method. Mod. Tunn. Technol. 2017, 54, 61–67. [Google Scholar] [CrossRef]
- Zhou, G.N.; Yang, T.T.; Sun, Z.; Li, H.; Cheng, Y.; Song, Z.P.; Han, J.J. Investigation of Quantitative Evaluation Method and Engineering Application of Shallow Buried Tunnel Face Stability. Appl. Sci. 2022, 12, 6656. [Google Scholar] [CrossRef]
- Yang, F.; Gao, L.Z.; Gao, Y.K.; Yang, J.S. Stability of surrounding rock and failure mode of parallel multi-line tunnels. Chin. J. Geotech. Eng. 2023, 45, 976–985. (In Chinese) [Google Scholar] [CrossRef]
- Xu, J.S.; Liu, W.C.; Wang, X.R.; Du, X.L. Stability analysis of three-dimensional tunnel roofs in soil based on a modified MC criterion. Acta Geotech. 2024, 19, 5989–6004. [Google Scholar] [CrossRef]
- Man, J.H.; Huang, H.W.; Dias, D.; Wang, F.Y.; Chen, J.Y. Stability evaluation model for the tunnel face of large cross-section tunnel excavated by the bench method. Comput. Geotech. 2024, 170, 106311. [Google Scholar] [CrossRef]


| Name | Density /(kg/m3) | Elastic Modulus /(GPa) | Poisson | Cohesion /(MPa) | Friction /(°) |
|---|---|---|---|---|---|
| Grade III surrounding rock | 2200~2300 | 6~10 | 0.25~0.30 | 2.0 | 39~50 |
| Primary support | 2500 | 30 | 0.20 | / | / |
| Secondary lining support | 2500 | 32.5 | 0.15 | / | / |
| Temporary support | 7900 | 150~200 | 0.30 | / | / |
| Density Gradient | Other Fixed Parameters | |||
|---|---|---|---|---|
| Density/(kg/m3) | Cohesion /(MPa) | Elastic Modulus/(GPa) | Poisson | Friction/(°) |
| 1900 | 1.2 | 3.6 | 0.25 | 20 |
| 2000 | 1.3 | |||
| 2100 | 1.3 | |||
| 2200 | 1.4 | |||
| 2300 | 1.5 | |||
| Elastic Modulus Gradient | Other Fixed Parameters | |||
|---|---|---|---|---|
| Elastic Modulus/(GPa) | Cohesion /(MPa) | Density/(kg/m3) | Poisson | Friction /(°) |
| 2.4 | 1.2 | 2200 | 0.25 | 20 |
| 3.6 | 1.4 | |||
| 4.8 | 1.4 | |||
| 6.0 | 1.4 | |||
| 7.2 | 1.5 | |||
| Name | Density/(kg/m3) | Elastic Modulus/GPa | Poisson | Cohesion /(MPa) | Friction/(°) |
|---|---|---|---|---|---|
| Initial state of surrounding rock | 2200 | 3.6 | 0.25 | 1.32 | 20 |
| Strength reduction in the MRP | 2200 | 3.6 | 0.25 | 0.93 | 20 |
| Modulus softening of excavated rock mass | 2200 | 1.2 | 0.3 | 1.32 | 20 |
| Case | Footage Length/L | Excavation Method | Stagger the Distance | Excavation Sequence | Clear-Distance Range | |
|---|---|---|---|---|---|---|
| D1 | D2 | |||||
| 1 | 5 m | Step method | 15 m | 15 m | Mainline | 1.6 m~18.0 m |
| 2 | 5 m | Full section method | / | 15 m | Mainline | 1.6 m~18.0 m |
| 3 | 5 m | CD method | / | 15 m | Mainline | 1.6 m~18.0 m |
| 4 | 5 m | Double walls heading method | / | 15 m | Mainline | 1.6 m~18.0 m |
| 5 | 5 m | Step method | 15 m | 15 m | Ramp tunnel | 1.6 m~18.0 m |
| 6 | 5 m | Step method | 5 m | 15 m | Mainline | 1.6 m~18.0 m |
| 7 | 5 m | Step method | 10 m | 15 m | Mainline | 1.6 m~18.0 m |
| 8 | 5 m | Step method | 20 m | 15 m | Mainline | 1.6 m~18.0 m |
| 9 | 5 m | Step method | 15 m | 5 | Mainline | 1.6 m~18.0 m |
| 10 | 5 m | Step method | 15 m | 10 | Mainline | 1.6 m~18.0 m |
| 11 | 5 m | Step method | 15 m | 50 | Mainline | 1.6 m~18.0 m |
| 12 | 3 m | Step method | 15 m | 15 m | Mainline | 1.6 m~18.0 m |
| 13 | 4 m | Step method | 15 m | 15 m | Mainline | 1.6 m~18.0 m |
| 14 | 5 m | Double walls heading method | / | 15 m | Mainline | 1.6 m~18.0 m 19.0 m |
| Clear Distance | 1.60 m~4.50 m | 4.50 m~17.6 m |
| Width–Span Ratio | 0.11~0.30 | 0.30~1.26 |
| Regression formula | ||
| R2 | 0.776 | 0.637 |
Disclaimer/Publisher’s Note: The statements, opinions and data contained in all publications are solely those of the individual author(s) and contributor(s) and not of MDPI and/or the editor(s). MDPI and/or the editor(s) disclaim responsibility for any injury to people or property resulting from any ideas, methods, instructions or products referred to in the content. |
© 2025 by the authors. Licensee MDPI, Basel, Switzerland. This article is an open access article distributed under the terms and conditions of the Creative Commons Attribution (CC BY) license (https://creativecommons.org/licenses/by/4.0/).
Share and Cite
Wang, J.; Long, Y.; Cao, A.; Cui, T.; Lin, L.; Gao, Y.; Liu, X.; Li, H. Middle Rock Pillar Stability Criteria for a Bifurcated Small Clear-Distance Tunnel. Appl. Sci. 2025, 15, 5634. https://doi.org/10.3390/app15105634
Wang J, Long Y, Cao A, Cui T, Lin L, Gao Y, Liu X, Li H. Middle Rock Pillar Stability Criteria for a Bifurcated Small Clear-Distance Tunnel. Applied Sciences. 2025; 15(10):5634. https://doi.org/10.3390/app15105634
Chicago/Turabian StyleWang, Jianxiu, Yanxia Long, Ansheng Cao, Tao Cui, Luyu Lin, Yuanbo Gao, Xuezeng Liu, and Huboqiang Li. 2025. "Middle Rock Pillar Stability Criteria for a Bifurcated Small Clear-Distance Tunnel" Applied Sciences 15, no. 10: 5634. https://doi.org/10.3390/app15105634
APA StyleWang, J., Long, Y., Cao, A., Cui, T., Lin, L., Gao, Y., Liu, X., & Li, H. (2025). Middle Rock Pillar Stability Criteria for a Bifurcated Small Clear-Distance Tunnel. Applied Sciences, 15(10), 5634. https://doi.org/10.3390/app15105634