Abstract
This study aims to explore the methodology for assessing landslide susceptibility by using machine learning techniques based on a geographic information system (GIS) in an effort to develop landslide susceptibility maps and assess landslide risk in the Yiyang region. A landslide dataset in Yiyang was constructed after 16 landslide predisposing factors were identified across four categories, topography, geology, environment, and hydrometeorology, through factor state determination and multicollinearity analysis. A Blending ensemble model was created and achieved higher prediction accuracy by fusing predictions from Random Forest, CatBoost, and XGBoost with logistic regression used as the meta-learner, thus deriving the importance coefficients of the landslide predisposing factors and their contribution rates. The Blending ensemble model achieved high predictive accuracy with an AUC value of 0.8784, demonstrating balanced and stable performance characteristics. With the addition of the rainfall factor, the AUC value of the Blending ensemble model has increased by 0.1199. In combination with the information value method, this model was applied to assess landslide susceptibility and rainfall-induced landslide risks in Yiyang City, demonstrating its validity. In addition, experimental validation confirmed the prediction and evaluation accuracy of the GIS-based Blending ensemble model. Results showed that the frequency ratio (FR) of historical landslide occurrences in high-susceptibility and extremely high-susceptibility zones in Yiyang City exceeded 1, indicating strong consistency between the landslide risk classification and actual distribution of historical landslides. The landslide susceptibility maps created for Anhua County, Heshan District, and Taojiang County in Yiyang City may provide support for the early warning and prevention of landslides and land-use planning in this region. The proposed methodology may be of reference value for improving natural disaster prevention and risk management.
1. Introduction
Landslides, one of the most devastating geological disasters, occur frequently under the effect of climate change in mountainous areas of China and even the world [1,2], causing heavy casualties, economic losses, and severe damage to the ecological environment. Hunan Province stands out as an area prone to landslides, with 2561 landslides occurring in 2022 [3]. According to historical records from the Department of Emergency Management of Hunan Province, China, from 2015 to 2018, Anhua county witnessed a total of 434 landslides with the scales ranging from 10 to 969,620 m3, inflicting a direct economic loss of about ¥81,730,000 [4]. This study aims to conduct susceptibility analysis of landslides and explore rainfall-induced landslide vulnerable areas in Yiyang city to provide reference for local landslide warning and control.
Comprehensive consideration of the contribution of various factors is needed to assess landslide susceptibility. Due to the uncertainty of time and space of landslide occurrence, it is still a difficult task to predict landslide-prone areas and related hazards [5]. Landslide susceptibility analysis can be made by qualitative analysis and quantitative analysis. The qualitative method is mainly based on geomorphology and the heuristic method [6], and the weight of each susceptibility variable is determined by professional investigators based on actual conditions and their expertise in predicting potential slope failures [7]. The quantitative analysis approach for assessing landslides is to create the landslide susceptibility map of a certain area to predict the landslide probability based on the predisposing factors and numerical expressions of landslides [8]. The existing quantitative analysis methods can be divided into geotechnical engineering methods [9,10] and statistical methods [11,12]. Landslide prediction based on geotechnical engineering methods relies mainly on the application of slope stability theory and principles, such as limit equilibrium and the finite element method [13], requiring high accuracy of geomechanical parameters and hydrologic and other parameters and assuming that they are evenly distributed in the entire study area. Therefore, such methods are only suitable for conducting limited-range studies on landslide prediction [14].
Compared with geotechnical engineering approaches, statistics-based landslide prediction methods necessitate a larger dataset, rendering them suitable for the prediction of large-scale landslides [13]. The most representative is the landslide prediction method based on machine learning algorithms, which has been widely used in landslide early warning analysis in recent years. Peng et al. [15] proposed a methodology for analyzing landslide susceptibility and its driving factors based on an FR-weighted GeoDetector. Liu and Deng [16] conducted the modeling of landslide susceptibility by using XGBoost models. Taalab et al. [17] utilized random forests to construct a landslide susceptibility map. Arabameri et al. [6] employed a hybrid machine learning approach based on Credal decision trees (CDT) to assess the susceptibility of landslides in the Taleghan-Alamut basin of Iran. Gazibara et al. [18] conducted a large-scale susceptibility assessment of landslides in the city of Zagreb, Croatia, by employing an evidence weight model. Saha A. et al. [19] prepared landslide susceptibility mapping (LSM) using remote sensing thematic layers and adopted a multi-criteria decision analysis (MCDA) model analytical hierarchy process (AHP) to identify landslide-prone zones in one part of Darjeeling, India. As a powerful tool, GIS provides data processing, spatial analysis, and visualization functions for landslide susceptibility mapping, thus improving the accuracy and efficiency of landslide susceptibility assessment. Mario B. et al. [20] investigated the correlation between landslides in the Fiumarella di Corleto watershed in the southern Apennine Mountains, Italy, and several predisposing factors including lithology, slope gradient, aspect, and utilization of land. The findings of this study demonstrate that the spatial distribution and types of landslides can be more effectively characterized through a combination of geomorphological analysis and GIS data processing.
The susceptibility analysis of landslides in the region of Yiyang, which is highly prone to landslides, is usually based on expert knowledge assessment, evaluation of cataloged data, and physical evaluation of landslide processes [21]. However, there is a lack of specific and authentic susceptibility maps based on comprehensive study. And there exist great challenges in the applicability of the existing landslide susceptibility analysis method based on this specific area due to great differences from other areas in topography, geology, environment, hydrology, and meteorological conditions. With regard to that, landslide susceptibility in Yiyang was analyzed by using machine learning techniques in combination with a geographical information system in this study.
The primary contributions of this study are as follows: (1) A comprehensive dataset of landslides in Yiyang was constructed. (2) A landslide susceptibility model is proposed based on weighted information entropy by employing XGBoost to calculate the information value of predisposing factors and weighing them, thereby obtaining the landslide risk of the slope unit. (3) The landslide susceptibility maps of Anhua County, Heshan District, and Taojiang County in Yiyang City generated in this study may be used for natural disaster management and land-use planning to prevent or mitigate the losses caused by landslides and help future development.
In brief, the main innovation of this study is that we obtained landslide density and frequency ratios of different landslide susceptibility areas. We also found that area percentages of very low susceptibility areas, low susceptibility areas, moderate susceptibility areas, high susceptibility areas, and very high susceptibility areas in the study region were 13.32%, 23.76%, 23.22%, 21.73%, and 17.97%, respectively. It seems to be the first time that landslide susceptibility maps were generated for Heshan District and Taojiang County. This study fills the gap in this aspect.
2. Overview of the Study Area
2.1. Study Area
The study region, Heshan District, Taojiang County, and Anhua County of Yiyang City, is located in the central region of Hunan Province, China (Figure 1). The area is situated in 110°43′~112°43′ east longitude and 27°58′~28°41′ north latitude, covering 8297 km2. With a subtropical continental monsoon humid climate, it is one of the four major rainstorm centers in Hunan Province, with average annual rainfalls of 1517.6 mm, 1700 mm, and 1672.9 mm, respectively. The overall terrain of Yiyang City is high in the west and low in the east, forming a narrow and long shape and sloping from south to north. According to the statistics of the 2022 population census, the survey region is relatively densely populated, with a permanent population of 2.325 million. Mountainous and hilly, the terrain is intensely cut, with very developed V-shaped valleys and steep slopes. The geological structure is complex, and the strata are relatively developed. The stratum lithology is mainly a gravel layer and upper clay, mudstone, sandstone, shale, silty soil, slate, limestone, basalt, and so on. The study area is particularly susceptible to rainfall-induced landslides, under the influence of the complex geological structures, long duration of heavy seasonal rainfall, and uneven scattering of steep slopes [22,23].

Figure 1.
Elevation distribution of Anhua County, Taojiang County, and Heshan District of Yiyang City.
2.2. Methodology
The basic methodology aimed at assessing landslide susceptibility of the study area is shown in Figure 2. Firstly, to create a landslide inventory, we collected available data of 550 landslide points and 1670 non-landslide points. To create a landslide susceptibility map for the study area, the most significant landslide predisposing factors were selected in the light of multicollinearity analysis, relevant literature review, and evaluation of the local geological environment. Then, XGBoost algorithm was used to classify landslide-prone areas, and landslide susceptibility maps were generated. Finally, validation was conducted by using performance indicators such as receiver operating characteristic curve area under (ROC-AUC), sensitivity, specificity, accuracy, precision, recall, and kappa coefficient.
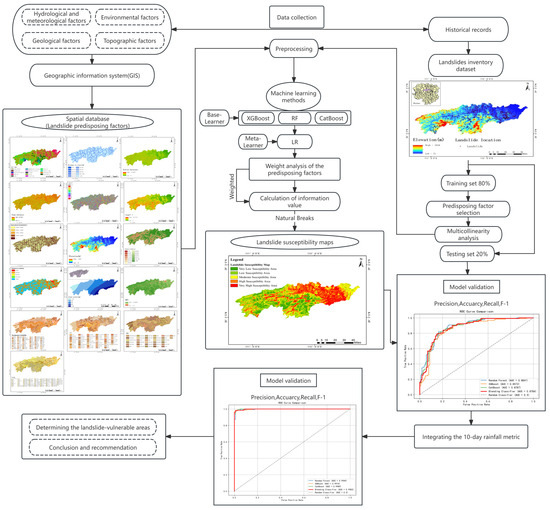
Figure 2.
Methodology flowchart of the research.
2.3. Investigation of Landslides
In the present study, we have compiled a comprehensive catalog of landslide points, conducting a statistical analysis of historical small-scale landslides, which may facilitate the investigation into the interrelationships between past landslide occurrences and various environmental factors [24]. According to the scope and objectives of the study, monitoring data of landslides during a heavy rainfall event in Yiyang City, Hunan Province, from July to August 2016 were collected from the Global Disaster Data Platform, along with 550 historical landslide records specific to Yiyang City, Hunan Province. As depicted in Figure 3, landslides in the study area are characterized by small scale, large quantity, and wide distribution.
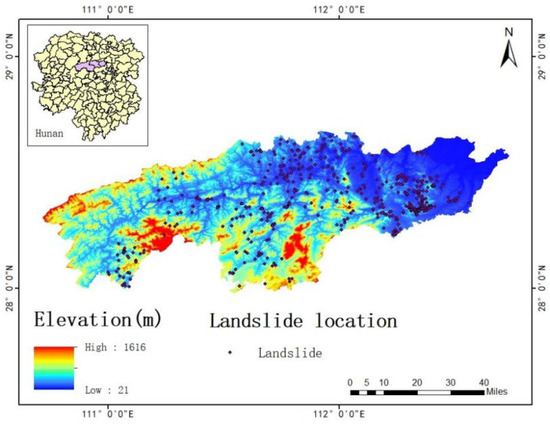
Figure 3.
Map of landslide inventory of study area.
3. Dataset Construction of Landslides in Yiyang City
3.1. Data Sources
Based on the breeding mechanism of landslides, the study collected data of the following 17 landslide predisposing factors [5]: topographic factors, geological factors, environmental factors, and hydrological and meteorological factors. The data collection of historical landslides and associated disaster factors was conducted based on landslide predisposing factors. Owing to the lack of relevant data of historical landslides and detailed time information, data of historical landslide points were extracted from the Global Disaster Data Platform in combination with the local geological hazard notification in Yiyang, supplemented with the geological disaster distribution data released by the Chinese Academy of Sciences (CAS). After preprocessing, the data were sorted out and used as the historical landslide case dataset for this paper. Table 1 presents the data sources, spatial resolution, and types of data collected for this study. The data types of landslide predisposing factors encompass raster data, vector data, and textual data.

Table 1.
Data sources.
3.2. Extraction of Landslide Predisposing Factors
3.2.1. Geological Factors
Geological factors have significant influence on landslide occurrence, as diverse geological structures exhibit varying mechanical and chemical properties, structural components, and rainfall infiltration rates. Based on the 1:200,000 Digital Geological Map Spatial Database, the extraction of rock structures (YSD), texture of rocks (YSC), stratigraphic types (DSN), and rock types (YSEB) is crucial in understanding their impacts on slope stability, as is illustrated in the following topographic illustrations, Figure 4a–e, respectively. Simultaneously, data of fault lines were extracted, and the distances to the faults were calculated as one of the influencing factors (shown in Figure 4f).
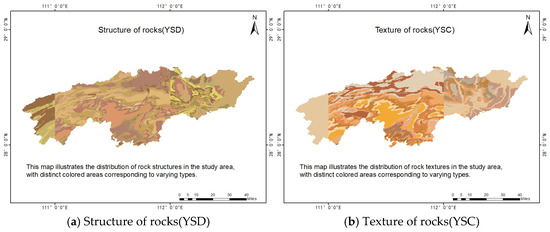
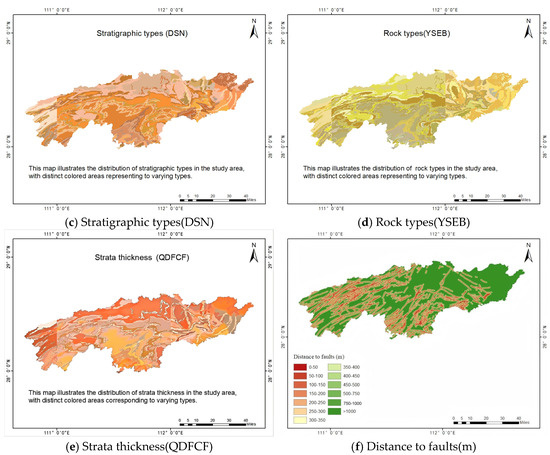
Figure 4.
Geological factors.
3.2.2. Topographical Factors
A 30 × 30 m digital elevation model (DEM) is utilized to derive topographic factors, such as slope, aspect, and elevation, which are widely employed in landslide susceptibility analysis. In the study area, the terrain exhibits slopes ranging from 0° to 65°, with over 50% of landslides occurring in areas characterized by slopes exceeding 15° and elevations below 200 m. Furthermore, plan curvature and profile curvature allow for the depiction of geometric features within the regional terrain, aiding in the identification of potential landslide areas. Therefore, these two factors are also given due consideration. Figure 5a–e display elevation, slope, aspect, plan curvature, and profile curvature, respectively, along with other terrain factors.
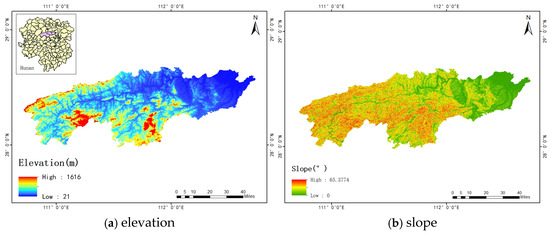
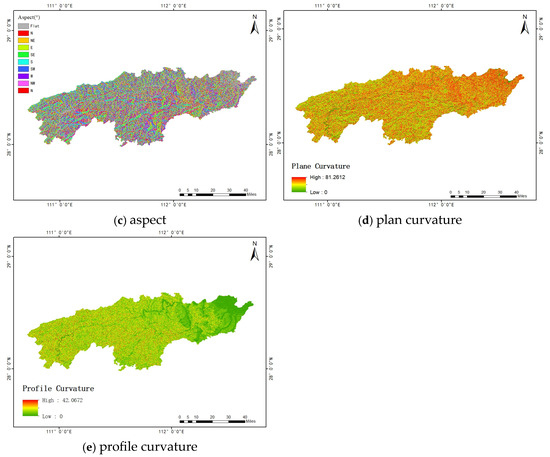
Figure 5.
(a–e) Topographical factors.
3.2.3. Environmental Factors
Among the environmental factors, vegetation coverage indirectly influences slope stability through its impact on soil erosion [26]. The Normalized Difference Vegetation Index (NDVI) maps serve as indicators widely utilized for assessing vegetation coverage. By calculating the NDVI values of vegetation coverage before and after the landslide during the heavy rainfall, we derived the NDVI value from the Landsat 8 OLI satellite remote sensing image acquired on 30 July 2016, as illustrated in Figure 6a,b. Subsequently, normalization was performed utilizing the following calculation formula:
NDVI = (NIR − R)/(NIR + R)
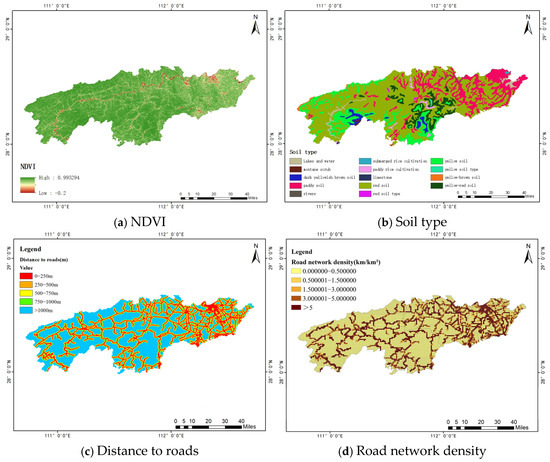
Figure 6.
(a–d) Environmental factors.
The abbreviation NIR refers to the near-infrared band, while R denotes the red light band. We also took into consideration the effect of anthropogenic activities, with a focus on road network density and distance to roads as two key factors for comprehensive assessment. Higher road network density and closer proximity to roads are associated with increased frequency of human activities, potentially exerting an influence on slope stability through anthropogenic engineering interventions. In addition, we derived the spatial distribution of soil types in the study area from the soil type data in Hunan Province and subsequently utilized it for a statistical analysis of landslide occurrences in each predominant soil type, aiming to investigate the specific patterns of landslides associated with different soil types. Figure 6a–d display the remotely sensed NDVI, soil type, distance to roads, and road network density, along with other environmental variables.
3.2.4. Hydrological and Meteorological Factors
In terms of hydrological factors, rivers exert erosive effects on slopes, potentially compromising slope stability. Hence, distance to rivers is considered a crucial factor. As for meteorological factors, rainfall is typically the primary predisposing factor for landslide occurrences. According to the research conducted by Huang et al., the effective rainfall duration before the landslide is ten days, and thus the cumulative volume of rainfall over the ten days preceding the landslide serves as the meteorological factor [27]. All the predisposing factors were analyzed with a spatial resolution of 30 m. Figure 7a,b display distance to rivers and the 10-day rainfall factor, respectively.
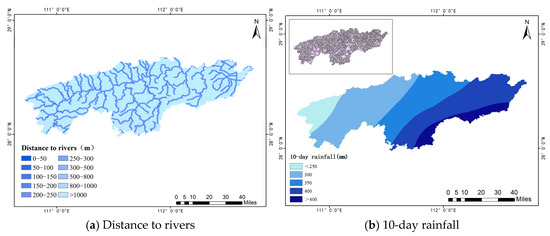
Figure 7.
Hydrological and meteorological factors.
3.3. Generation of Data Samples
The balanced sampling strategy is widely utilized in prior studies to assemble datasets, generally preserving an equilibrium ratio of 1:1 for landslide to non-landslide samples. Considering that the landslides in the study area are primarily small-scale occurrences, we conducted interpolation at 2 km intervals beyond the buffer zone (with a radius of 100 m) surrounding the landslide points to obtain non-landslide samples. We randomly selected 550 landslide points and 1670 non-landslide points, which were employed in constructing data samples, as illustrated in Figure 8.
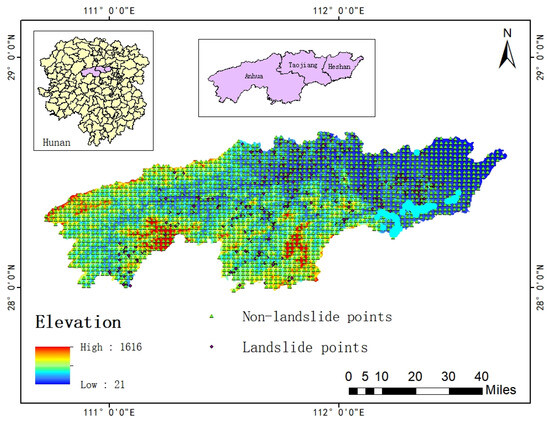
Figure 8.
Distribution of positive and negative samples.
The raw data consists of 2220 records (550 landslides, 1670 non-landslides). After anomaly filtering, 208 outliers were excluded, leaving 483 landslides and 1529 non-landslides. The number of landslide points and non-landslide points was balanced in the application of machine learning to landslide susceptibility analysis.
3.4. Selection of Predisposing Factors
Before creating a susceptibility model, it is essential to examine the multicollinearity among these landslide predisposing factors, as the correlation among the factors may result in inaccuracy of the model. In this study, variance inflation factor (VIF) and tolerance (TOL) were adopted to check the multicollinearity. Given the independent variable x, Rj2 is the coefficient of determination between the independent variable xj and the rest of the independent variables. The VIF and TOL can be calculated as follows:
According to some studies [28,29], the value of VIF is lower than 10, and the value of TOL is greater than 0.1, indicating that these variables are independent of each other, as is shown in Table 2.
Table 2.
Multi-collinearity analysis of landslide predisposing factors.
The VIF values after removing the QDFCF factor are presented in Table 3.
Table 3.
Multi-collinearity analysis of landslide predisposing factors.
The Pearson coefficient method was used to test the correlation, and it was found that there is a very high correlation (0.96) between QDFCF (strata thickness) and DSN (stratigraphic types), as shown in Figure 9. Finally, the factor of QDFCF was eliminated.
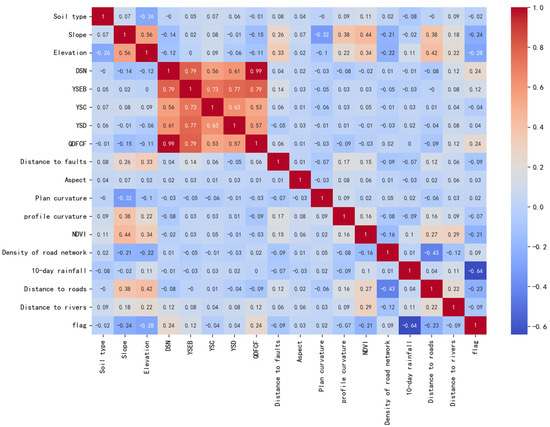
Figure 9.
Index factor correlation matrix.
4. Blending Ensemble Learning-Based Landslide Susceptibility Mapping and Risk Assessment
4.1. Optimization Method Based on Blending Ensemble Learning
4.1.1. A Brief Introduction to XGBoost Algorithm
XGBoost is guided by the Boosting integration concept, amalgamating multiple decision tree models to construct a more precise classifier. Owing to its superior accuracy and rapid computational speed, XGBoost has found application in landslide susceptibility analysis [30,31]. The optimization objective function of the XGBoost algorithm is formulated based on the decision tree algorithm and incorporates an additional regularization term to manage the complexity of models, encompassing both the number of leaf nodes and the sum of squares of the number of leaf nodes. Thus, the objective function comprises both the loss function and the regularization term, as depicted in the following equation:
where λ represents the fixed coefficient, γ represents the complexity parameter, T represents the number of leaf nodes in the tree, represents the sum of the first-order partial derivatives of the samples contained in leaf node j, and denotes the sum of the second-order partial derivatives of the sample contained in the leaf node j.
4.1.2. Random Forest
Random Forest, as a representative ensemble algorithm, employs a strategy of constructing multiple decision trees in parallel to achieve predictive functionality. It determines the final prediction outcome by using random subsets of training data to build decision trees, conducting majority voting for classification and averaging individual tree predictions for regression problems [32]. Each decision tree is trained based on different sample sets and feature sets, thereby reducing overfitting while enhancing the model’s robustness and accuracy. Sample perturbation and feature perturbation introduce diversity among the decision trees. The generalization performance can be improved by increasing the variability among the decision trees [33]. The initial performance of random forests is often relatively poor, which necessitates adding more decision trees to reduce generalization errors and enhance the overall accuracy of the model.
In the random forest classifier, the output results of the decision trees are determined by majority voting. The mean of the decision trees’ output is evaluated using the Sigmoid function [34] with a threshold of 0.5.
4.1.3. CatBoost
CatBoost is a high-performance open-source machine learning library developed by Yandex, primarily designed for handling categorical data. It particularly excels in processing datasets with a large number of categorical features.
Innovatively employing ordered boosting techniques, CatBoost addresses the common prediction bias issues in gradient boosting frameworks. It effectively prevents data leakage and model overfitting while significantly reducing the need for hyperparameter tuning. Compared to traditional machine learning algorithms, CatBoost can handle high-cardinality categorical variables [35]. It utilizes gradient boosting for regression trees [36] and constructs models in a phased manner through progressively refined approximations, thereby achieving more accurate predictive performance. The CatBoost algorithm demonstrates outstanding capabilities in both classification and regression tasks.
For geospatial factors in landslide susceptibility assessment (e.g., spatial distance parameters such as water systems, faults, and roads), CatBoost’s built-in target statistics technology automatically performs feature preprocessing. This feature eliminates the need for manual data normalization during modeling, allowing raw spatial database data to be directly used for constructing landslide hazard prediction models.
As a cutting-edge algorithm in ensemble learning, the innovation of CatBoost is manifested in its symmetric tree architecture. During leaf node splitting, the algorithm quantitatively evaluates feature contributions and integrates an innovative auto-encoding mechanism for categorical variables. By introducing a feature combination strategy, it effectively captures multi-dimensional feature interactions, enhancing the model’s ability to recognize complex data patterns.
4.1.4. Blending Ensemble Model
The basic idea of blending ensemble learning is to analyze and process the prediction results of different models to achieve better outcomes [37]. In this study, three heterogeneous algorithms—Random Forest, XGBoost, and CatBoost—were selected as the first-level base learners, while logistic regression served as the second-level meta-learner. The specific implementation process is as follows: First, the original training set was divided into a subtraining set (80%) and a validation set (20%) at a 4:1 ratio. The three base models were then trained on the subtraining set. Next, these base models were used to generate probabilistic predictions for the validation set, forming a meta-feature dataset that served as new training samples. A logistic regression model was trained as the meta-classifier on this meta-feature dataset. The predictions of the base models on the test set (acting as new test data) were then fed into the trained meta-classifier. Finally, the ensemble model output the landslide prediction results.
4.2. Evaluation of Model Accuracy
Over the past decades, the ROC curve has evolved from its roots in the radiology community into a specialized tool used for predictive purposes to assess the discriminative capabilities of various methods and test results. The ROC curve illustrates the sensitivity (true positive [TP] rate) and 1-specificity (false positive rate) function [38]. Four possible indices were used for measuring ACC, namely TP, True Negative (TN), FP, and False Negative (FN), where TP and FP denote correctly determined landslide and non-landslide pixels, and TN and FN denote incorrectly determined landslide and non-landslide pixels [2]. The calculation formulas for the aforementioned four indicators are shown as follows:
Precision, recall, and F-measure were used to validate model performance.
Precision and sensitivity (recall) are quantified using the following equations.
The F1-score integrates sensitivity and precision into a unified metric by calculating their harmonic mean, providing equitable importance to both aspects [39].
In landslide susceptibility analysis research, a higher F1-score typically indicates that the model has better predictive performance and can effectively identify high-risk landslide areas. Furthermore, the receiver operating characteristic (ROC) curve and the area under curve (AUC) value are important metrics for evaluating the performance of classification models, which have been widely applied in geological hazard susceptibility studies [40]. The ROC curve is formed by the variation curve of the True Positive (TP) and False Positive (FP) rates. The area under curve (AUC) value is used to measure the predictive accuracy of the model, with its numerical range between 0 and 1. The closer the AUC value is to 1, the better the predictive accuracy of the model.
4.3. Application and Evaluation of Blending Ensemble Model
4.3.1. Sample Training
In landslide prediction, the objective is to forecast the probability of landslide occurrence based on influencing factors. This is typically a binary classification task, where the prediction outcome is whether a landslide occurs or not. To improve prediction accuracy, a Blending ensemble learning method is adopted, combining three base learners—Random Forest (RF), XGBoost, and CatBoost—along with logistic regression as the meta-learner—to form an integrated model for landslide prediction.
A crucial step in model training is data preprocessing, during which the three-sigma rule was applied to eliminate outliers, and min-max normalization was used to standardize the data, ensuring that different features were on the same scale to avoid model bias caused by dimensional differences. Additionally, to prevent tree models from overemphasizing normal cases (non-landslides) due to sample imbalance, the dataset was balanced by selecting 966 sample records (483 landslide points and 483 non-landslide points).
The dataset was divided into a training set for model training and a test set to evaluate model performance at a ratio of 8:2. To construct the base learners, Random Forest (RF) was first employed for training. By integrating multiple decision trees, Random Forest effectively handles nonlinear relationships and provides strong generalization capabilities. Next, the XGBoost model was used. As a gradient-boosted tree model, XGBoost can process large-scale data and reduce overfitting risks, demonstrating strong performance in landslide prediction. Finally, the CatBoost model was adopted. It is a gradient-boosting model particularly suited for handling categorical features, with the ability to automatically process such features, making it suitable for complex datasets.
After being individually trained, the predictive performances of the three base models (Random Forest, XGBoost, and CatBoost) were compared to evaluate the accuracy of each model. To further enhance prediction effectiveness, this paper introduces ensemble learning methods. In the ensemble learning framework, logistic regression serves as the meta-learner, integrating the predictions of the base learners to make the final classification decision. As a linear model, logistic regression combines the outputs of each model through a simple weighted sum and decision rule, thereby leveraging the strengths of each base learner.
Target Encoding
Target encoding is a method for converting categorical variables into numerical features. Its core idea is to replace the original categorical values with statistical properties of the target variable (e.g., mean, probability) corresponding to each category, thereby effectively handling non-ordinal categorical data. In the study, a smoothed target encoding approach (Equation (9)) is adopted. This method preserves the distributional characteristics of different categories while mitigating overfitting during the encoding process.
The categorical features are shown in Table 4.
Table 4.
Categorical features.
4.3.2. Weight Analysis of Landslide Predisposing Factors and Model Reliability Testing
During the model evaluation process, the classification accuracy of each base model on the test set was first calculated, and they were quantified through common binary classification evaluation metrics such as precision, recall rate, and F1 value. To investigate the impact of the predisposing factor of rainfall on model evaluation, the factor of rainfall was initially excluded, and prediction results were computed based on the 15 predisposing factors. The importance coefficients of the factors and the prediction results of each model were as follows:
It can be known from Figure 10, Figure 11, Figure 12 and Figure 13 and Table 5, Table 6, Table 7 and Table 8 the prediction results of the three base learners are used as input features to train the meta-learner, and a logistic regression model is employed to generate the final prediction. Ensemble models typically significantly improve predictive performance, as they combine the outputs of multiple models, reducing the risk of overfitting or underfitting that may arise from a single model. The importance coefficients of the ensemble model and the ROC curve are shown below:
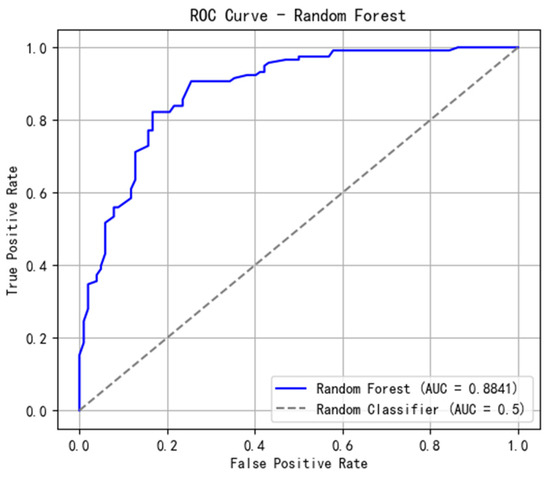
Figure 10.
ROC curve.

Figure 11.
ROC Curve-XGBoost.
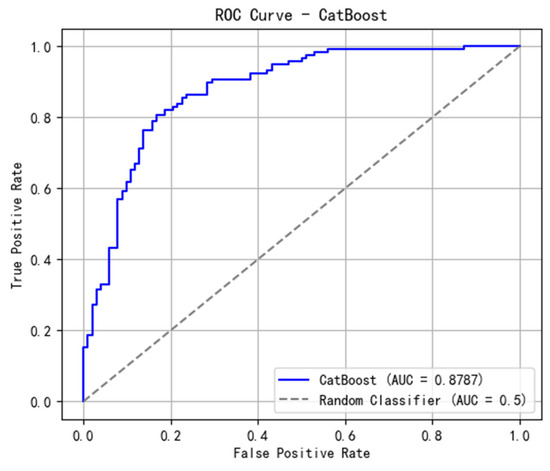
Figure 12.
ROC curve—CatBoost.
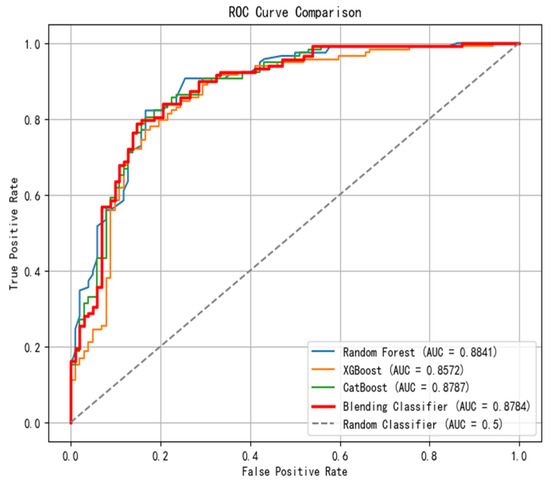
Figure 13.
ROC curve—Blending ensemble model.
Table 5.
Importance coefficients of predisposing factors (PF) in RF model.
Table 6.
Importance coefficients of predisposing factors (PF) in XGBoost.
Table 7.
Importance Coefficients of Predisposing Factors (PF) in CatBoost.
Table 8.
Importance coefficients of predisposing factors (PF) in Blending ensemble model.
The regression coefficients of the meta-learner (logistic regression) can be used to analyze the contribution of each of the three models to the ensemble model. XGBoost is found to contribute the most to the ensemble model.
To make an accuracy assessment of landslide prediction, a random sample of 100 landslide data points were used for prediction, with a threshold of 0.5. Predictions greater than 0.5 were classified as landslides (1), while those below 0.5 were classified as non-landslides (0). Among the 56 actual landslide points, 43 were correctly predicted, yielding an accuracy of 76.8%. For the 44 non-landslide points, 31 were correctly predicted, resulting in an accuracy of 70.5%.
The models can be evaluated, as is indicated in Table 9.
Table 9.
Evaluation metrics for binary classification of various models.
The weight analysis made above is based on the 15 predisposing factors without considering the dynamic landslide-inducing factor of rainfall.
Following the same steps, the predisposing factor of rainfall was reintroduced and weight analysis of the 16 landslide predisposing factors was conducted by using the prediction results from the three base learners as input features to train the meta-learner. And the final prediction was derived by applying the logistic regression model, thereby obtaining the importance coefficients of the 16 predisposing factors in the Blending model, as is illustrated in Table 10. A comparison of the ROC curves of each of the models can be made, as is shown in Figure 14.
Table 10.
Importance coefficients of predisposing factors (PF) in Blending ensemble model (Incorporate the 10-day cumulative rainfall factor).
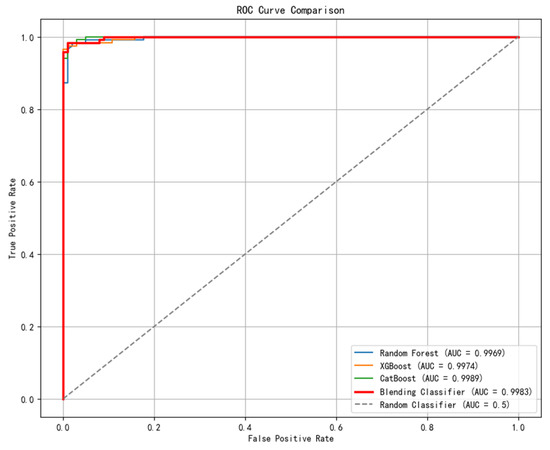
Figure 14.
Overall ROC curves of the models.
Similarly, 100 landslide data points were randomly selected for prediction. Among the 56 landslide points, 55 were correctly predicted, achieving an accuracy of 98.2%. For the 44 non-landslide points, 42 were correctly predicted, resulting in an accuracy of 95.5%. The model showed significant improvement compared to that without taking the factor of rainfall into account. As can be seen through a comparison of the statistics in Table 9 and Table 11, the AUC value of the Blending ensemble model increased by 0.1199 with the introduction of the ten-day rainfall factor.
Table 11.
Evaluation metrics for each model with the addition of rainfall factor.
4.3.3. Analysis of the Results
The experimental results indicate that the introduction of the ten-day rainfall factor significantly enhances the predictive performance of the model. The Blending ensemble model improves both the overall predictive performance and generalization capability in landslide prediction. Although the CatBoost model achieves the highest ROC value and prediction accuracy, its recall rate is relatively lower. By employing a multi-model fusion approach, the ensemble model not only attains a higher ROC value and the highest prediction accuracy but also achieves the highest recall rate, demonstrating its superior effectiveness in predicting landslide events and more robust predictive performance. Particularly in the binary classification task of landslide occurrence, the ensemble model fully leverages the strengths of each base learner, reducing potential errors that may arise from a single model in specific scenarios.
Overall, ensemble learning methods have effectively improved the accuracy of landslide prediction. By combining multiple base learners and the meta-learner logistic regression, the ensemble model exhibits its notable advantages in complex and dynamic data environments, delivering more reliable predictive performance.
4.4. Landslide Susceptibilty Mapping and Risk Assessment Based on Weighted Information Entropy
4.4.1. Calculation of Information Values of Predisposing Factors
The information value method is an important approach for landslide susceptibility analysis. By means of statistical methods, the information model is adopted to compute the information values of different subcategories of each predisposing factor, representing the extent to which they contribute to the occurrence of landslide. Initially, the information provided by each predisposing factor Xi for the occurrence of landslide events (L) is calculated separately as information i (Xi), using sample frequency calculation to determine the information value. The specific calculation formula is as follows:
Specifically, Xi denotes the number of disaster points at level i, S denotes the total area of the grid, Si represents the area of the grid at level i, and X represents the total number of landslide points in the study area. According to Formula (10), the category-specific information entropy of each predisposing factor was computed individually. The final weighted landslide susceptibility index () can be expressed as follows:
Among them, ωi is the importance coefficient of the i-th evaluation factor (such as slope, road distance, etc.), which must satisfy ∑ωi =1; i(L,xi) is the original unweighted information value, and its calculation method remains consistent with the previous approach. Sω is the weighted superposition landslide susceptibility index, reflecting the relative importance of different factors in contributing to landslides.
4.4.2. Analysis of Landslide Susceptibility Based on Blending Ensemble Model
The landslide susceptibility analysis was conducted without considering the factor of ten-day rainfall. In this study, the natural breaks classification method was employed to divide landslide risk into five levels. Based on the information value calculation results of 15 influencing factors, the factors were superimposed according to Equation (11), thereby generating a landslide susceptibility map (Figure 15). The contribution rates of each factor were obtained through the Blending ensemble model and then weighted, ultimately yielding the landslide susceptibility map for the study area (Figure 16).

Figure 15.
Landslide susceptibility map based on information entropy.
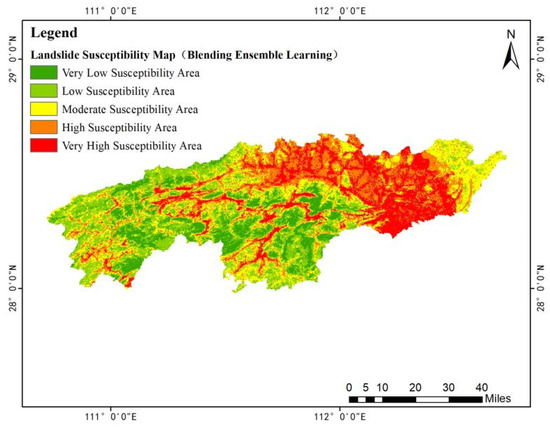
Figure 16.
Landslide susceptibility map based on weighted information entropy.
According to the landslide susceptibility classification based on weighted information entropy, the landslide points in the study area were statistically analyzed by zone, and the results are shown in Table 12. The frequency ratio (FR) reflects the importance of regional classification for landslide occurrence, which is calculated as the ratio of landslide proportion to area proportion. When FR ≥ 1, it indicates that the factors in the zone have a positive contribution to landslide occurrence; if FR < 1 in a low-susceptibility zone, it suggests that the factors in the zone have a negative contribution to landslide occurrence. It can be seen that the landslide susceptibility classification in the study area is consistent with the landslide formation conditions.
Table 12.
Susceptibility area (SA) proportions.
4.4.3. Landslide Risk Zoning Based on the Blending Ensemble Model
By incorporating the factor of ten-day rainfall, a landslide risk zoning map was generated (Figure 17). The contribution rates of the 16 predisposing factors obtained through the Blending ensemble model were weighted based on information entropy. Ultimately, the landslide risk zoning map of the study area (Figure 18) was obtained.

Figure 17.
Landslide risk zoning map based on information entropy.
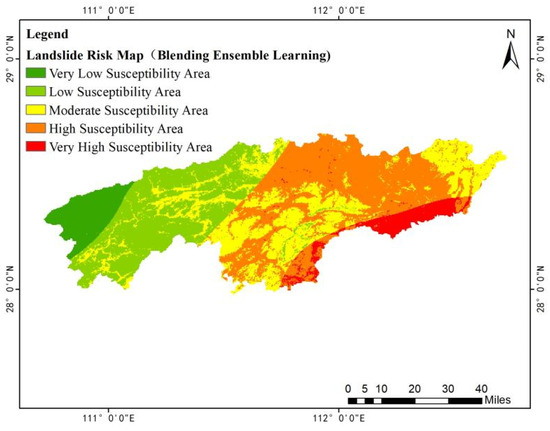
Figure 18.
Landslide risk zoning map based on weighted information entropy.
Comparing the risk zoning maps before and after weighting, it was found that in the map based on weighted information entropy, the proportion of extremely high-risk zones in Heshan District (eastern study area) significantly decreased, while some high-risk zones in Anhua County (western study area) were reclassified as medium-risk zones. Overall, the two models exhibited a certain degree of similarity in risk assessment results. In Yiyang City, high and extremely high-risk zones are mainly concentrated in the central-western part of Heshan District, the southern and northern parts of Taojiang County, and the southeastern part and central regions of Anhua County. Specifically, the high-risk zones in central Anhua County extend in an east-west belt-like pattern, while the central-western part of Heshan District and the southern part of Taojiang County collectively form the primary distribution area within Yiyang City. Urban expansion and increasingly frequent human engineering activities have created favorable conditions for landslide formation. The mountainous areas in the southeastern and central parts of Anhua County are also high-risk landslide zones, characterized by densely distributed hills and valleys, steep terrain, and a heightened susceptibility to landslides due to topographic factors.
The study indicates that in the weighted information model, a large proportion of areas were classified as high-risk zones, whereas in the single-information model, many regions were categorized as extremely high-risk zones, with the proportion of high-risk zones being much lower than that of extremely high-risk zones. This suggests that the single-information model has relatively weaker performance in identifying landslide-prone areas, lacking clear delineation and specificity in practical applications. During the classification process, it was observed that the landslide point density in the weighted information model was higher than that in the single-information model, particularly in high-risk and extremely high-risk zones, where landslide density increased by 0.036 points/km2 and 0.048 points/km2, respectively. The weighted information model demonstrated that landslide points in extremely high-risk zones and high-risk zones were more densely distributed, better aligning with the actual distribution characteristics of landslide occurrences. Therefore, the landslide risk classification based on weighted information entropy exhibits higher rationality and reliability.
According to the landslide risk classification based on weighted information entropy, the landslide points in the study area were statistically analyzed by zone, and the results are shown in Table 13. The frequency ratio (FR) reflects the importance of regional classification for landslide occurrence, which is calculated as the ratio of landslide proportion to area proportion. When FR ≥ 1, it indicates that the factors in the zone have a positive contribution to landslide occurrence; if FR < 1 in a low-risk zone, it suggests that the factors in the zone have a negative contribution to landslide occurrence. Evidently, the landslide risk classification in the study area is consistent with the conditions conducive to landslide formation.
Table 13.
Risk area (RA) proportions.
4.5. Validation of Landslide Risk Zoning Results
Based on the results of the landslide risk level zoning in the study area, 263 landslide points that occurred in Anhua County, Heshan District, and Taojiang County of Yiyang City in recent decades were extracted from the spatial distribution data of national geological disaster points released by the Chinese Academy of Sciences (CAS) for validation (as shown in Figure 19).
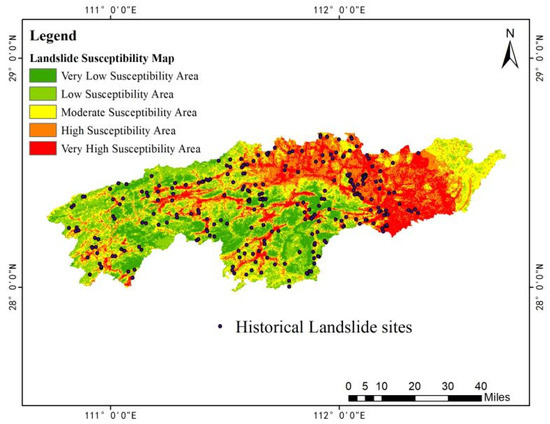
Figure 19.
Distribution map of historical landslide points.
A statistical table of susceptibility areas (Table 14) was obtained by applying the susceptibility analysis results to calculate the area, area proportion, and landslide proportion of each susceptibility zone. The table shows that historical landslides mainly occurred within the high susceptibility zone. The landslide densities for the very low, low, medium, high, and very high susceptibility zones are 0.009, 0.020, 0.030, 0.048, and 0.049, respectively. This indicates that as the susceptibility level increases, the landslide density gradually rises, and the likelihood of landslide occurrence also increases, demonstrating a positive correlation between landslide density and regional susceptibility levels. Similarly, the frequency ratio (FR) can be used to evaluate the contribution of regional landslides. An FR ≥ 1 indicates a positive contribution, while an FR < 1 indicates a negative contribution. The study found that the frequency ratios (FR) for the high and very high susceptibility zones are 1.505 and 1.523, respectively, both greater than 1, indicating the consistency between the classification of susceptibility zones with the conditions for the occurrence of landslides.
Table 14.
Susceptibility area (SA) proportions.
A comparison between the post-heavy rainfall landslide susceptibility zone ratios in Yiyang City and the historical susceptibility zone ratios revealed that their frequency ratios (FR) exhibited similar trends, with both high and extremely high susceptibility zones having FR values greater than 1 (Table 12, Table 13 and Table 14). This indicates a high consistency between the landslide susceptibility analysis results, the risk classification outcomes, and the actual distribution of historical landslide points, confirming the validity of the landslide risk zoning results. The landslide susceptibility analysis results can serve as a reference for landslide hazard risk identification and early warning in the Yiyang area and areas with similar geographical conditions.
5. Discussion
Landslide susceptibility mapping (LSM) is of great significance in the landslide-prone areas and it is challenging to create LSM with high accuracy and reliability. Firstly, it is usually not so easy to collect and preprocess enough multi-source data from historical data. Secondly, it is critical to select and determine appropriate landslide predisposing factors (LPFs) to establish a landslide susceptibility assessment system. There are numerous LPFs, varying with geographical and geological features locally and globally. Achour et al. [7] combined AHP and IV methods in GIS to analyze eight landslide factors (e.g., slope, aspect, distance to faults/drainage, lithology) and assess landslide susceptibility for a highway in Constantine, northeastern Algeria. Sanja Bernat Gazibara et al. [18] selected six factors (e.g., slope, terrain ruggedness, rock type, proximity to geological contacts/drainage, land use) and applied the Weight of Evidence model to assess landslide susceptibility across Zagreb, Croatia. Bentivenga Mario et al. [20] examined the relationship between landslides and four factors (lithology, slope, aspect, land use) in the Fiumarella di Corleto catchment, southern Apennines, Italy. There is a lack of standardized criteria for model factor selection up to now. In this study, 16 LPFs were selected through analysis of multicollinearity and of the contributing conditions in the study area by integrating GIS with machine learning.
Excluding the 10-day rainfall factor, the three base models—Random Forest, XGBoost, and CatBoost—as well as the ensemble model demonstrated strong performance in landslide prediction, achieving AUC values of 0.8841, 0.8572, 0.8787, and 0.8784, respectively, when 15 influencing factors were used for evaluation. From the table of importance coefficients of landslide-influencing factors obtained through the ensemble model, it can be observed that elevation ranked first in all models, while NDVI ranked second in all models except XGBoost. The ensemble model, which integrates the predictions of the three base learners, revealed the following importance coefficients for the top seven influencing factors: elevation (15.5971%), NDVI (11.6825%), stratigraphic types (DSN, 7.8708%), slope (7.4366%), rock texture (YSC), 6.5887%), plan curvature (6.4489%), and distance to faults (6.1751%).
After introducing the 10-day rainfall factor, 16 influencing factors were evaluated. The AUC values of the three base models and the ensemble model improved significantly. The ranking of factor importance also changed, with the top seven factors being:10-day rainfall (48.9018%), distance to rivers (7.703%), stratigraphic types (7.6972%), elevation (5.7843%), NDVI (5.0007%), distance to faults (4.0647%), and slope (3.5335%). A comparison of the results before and after the introduction of ten-day rainfall factor reveals that stratigraphic types, elevation, and NDVI remained among the top five most important factors in both scenarios. Notably, distance to rivers, which originally ranked 15th, rose to become the second most critical factor in landslide risk assessment after the introduction of rainfall. This highlights the cross-impact and interaction among the predisposing factors. Additionally, rainfall is a dynamic variable, and determining the threshold for the rainfall contributing to landslides is highly challenging. This may lead to uncertainty in landslide prediction. Overcoming the spatiotemporal scale mismatch between dynamic meteorological/hydrological factors and static geological parameters remains a critical challenge. Blending is an ensemble model method that improves overall predictive performance by combining the predictions of multiple base models to help analyze the relationship between various geographical factors and landslide occurrence, as well as estimate the probability of such events.
6. Conclusions
Landslide susceptibility analysis was conducted by employing geographic information system (GIS) and Blending ensemble learning techniques in this study. Based on historical landslide data in the study area, landslide predisposing factors were identified through factor analysis. We constructed a dataset of landslides in Yiyang and obtained contribution rates of the factors based on the Blending ensemble model. By comparing the AUC values of different prediction models, the performance differences were assessed. Finally, the validity of the prediction results was verified using a dual-validation mechanism incorporating statistical analysis and receiver operating characteristic (ROC) curves. A landslide susceptibility map and landslide risk zoning map in the study area were generated based on weighted information entropy using the Blending ensemble model. The methodology for landslide susceptibility analysis was optimized, and a quantitative assessment of regional disaster risk was achieved. The experimental results demonstrate that the susceptibility classification aligns closely with the spatial distribution of historical landslides and can be of great reference value to landslide prediction and prevention and land-use planning in the study area and in other regions with similar geological conditions.
Author Contributions
C.H.: Conceptualization, investigation, methodology, resources, data curation, formal analysis, visualization, validation, writing—original draft, revision and editing; Y.T. and X.Y. supervision, writing—review; H.L.: suggestions at the beginning; X.W.: writing—review, project administration; J.H.: computer algorithm. All authors have read and agreed to the published version of the manuscript.
Funding
This research was funded by Science and Technology Research and Development Plan of China Railway Co., Ltd. (2022-Major Project-07), grant number 2022-Major Project-07.
Data Availability Statement
Data will be available from the corresponding author on reasonable request.
Acknowledgments
The authors are thankful to Junsheng Yang, Leilei Liu, and Liu Yang for their support and suggestions.
Conflicts of Interest
The authors declare no conflict of interest.
References
- Froude, M.J.; Petley, D.N. Global fatal landslide occurrence from 2004 to 2016. Nat. Hazards Earth Syst. Sci. 2018, 18, 2161–2181. [Google Scholar] [CrossRef]
- Pham, B.T.; Jaafari, A.; Nguyen-Thoi, T.; Van Phong, T.; Nguyen, H.D.; Satyam, N.; Masroor; Rehman, S.; Sajjad, H.; Sahana, M.; et al. Ensemble machine learning models based on Reduced Error Pruning Tree for prediction of rainfall-induced landslides. Int. J. Digit. Earth 2020, 14, 575–596. [Google Scholar] [CrossRef]
- Available online: https://yjt.hunan.gov.cn/yjt/tszt/ywzl/dzdz/202305/t20230506_29330937.html (accessed on 6 May 2023).
- Liu, L.L.; Danish, A.; Wang, X.M.; Zhu, W.Q. Ensemble stacking: A powerful tool for landslide susceptibility assessment—A case study in Anhua County, Hunan Province, China. Geocarto Int. 2024, 39, 2326005. [Google Scholar] [CrossRef]
- Feizizadeh, B.; Blaschke, T. An uncertainty and sensitivity analysis approach for GIS-based multicriteria landslide susceptibility mapping. Int. J. Geogr. Inf. Sci. 2014, 28, 610–638. [Google Scholar] [CrossRef] [PubMed]
- Arabameri, A.; Chandra Pal, S.; Rezaie, F.; Chakrabortty, R.; Saha, A.; Blaschke, T.; Di Napoli, M.; Ghorbanzadeh, O.; Ngo, P.T.T. Decision tree based ensemble machine learning approaches for landslide susceptibility mapping. Geocarto Int. 2022, 37, 4594–4627. [Google Scholar] [CrossRef]
- Achour, Y.; Boumezbeur, A.; Hadji, R.; Chouabbi, A.; Cavaleiro, V.; Bendaoud, E.A. Landslide susceptibility mapping using analytic hierarchy process and information value methods along a highway road section in Constantine, Algeria. Arab. J. Geosci. 2017, 10, 194. [Google Scholar] [CrossRef]
- Dehnavi, A.; Aghdam, I.N.; Pradhan, B.; Varzandeh, M.H. A new hybrid model using Step-wise Weight Assessment Ratio Analysis (SWARA) technique and Adaptive Neuro-fuzzy Inference System (ANFIS) for regional landslide hazard assessment in Iran. Catena 2015, 135, 122–148. [Google Scholar] [CrossRef]
- Xiong, C.; Cui, F.; Liu, J.; Li, N.; Jie, R.; Meng, F. Formation mechanism and stability analysis of the DR landslide in national road 534 of Datian, Sanming, Fujian Province, China. Geomat. Nat. Hazards Risk 2021, 12, 3317–3345. [Google Scholar] [CrossRef]
- Seddiki, A.; Khemissa, M. Seismic stability analysis of a pre-cracked natural slope: A case study of Aomar slope in Algeria. Geomech. Geoengin. 2019, 16, 52–66. [Google Scholar] [CrossRef]
- Sepe, C.; Confuorto, P.; Angrisani, A.C.; Di Martire, D.; Di Napoli, M.; Calcaterra, D. Application of a statistical approach to landslide susceptibility map generation in urban settings. In IAEG/AEG Annual Meeting Proceedings; Shakoor, A., Cato, K., Eds.; Springer International: Cham, Switzerland, 2019; Volume 1, pp. 155–162. [Google Scholar] [CrossRef]
- Di Napoli, M.; Carotenuto, F.; Cevasco, A.; Confuorto, P.; Di Martire, D.; Firpo, M.; Pepe, G.; Raso, E.; Calcaterra, D. Machine learning ensemble modelling as a tool to improve landslide susceptibility mapping reliability. Landslides 2020, 17, 1897–1914. [Google Scholar] [CrossRef]
- Reichenbach, P.; Rossi, M.; Malamud, B.D.; Mihir, M.; Guzzetti, F. A review of statistically-based landslide susceptibility models. Earth-Sci. Rev. 2018, 180, 60–91. [Google Scholar] [CrossRef]
- Wang, H.J.; Xiao, T.; Li, X.Y.; Zhang, L.L.; Zhang, L.M. A novel physically-based model for updating landslide susceptibility. Eng. Geol. 2019, 251, 71–80. [Google Scholar] [CrossRef]
- Peng, L.; Sun, Y.; Zhan, Z.; Shi, W.; Zhang, M. FR-weighted GeoDetector for landslide susceptibility and driving factors analysis. Geomat. Nat. Hazards Risk 2023, 14, 2205001. [Google Scholar] [CrossRef]
- Liu, L.; Deng, J. Multi-model combination in key steps for landslide susceptibility modeling and uncertainty analysis: A case study in Baoji City, China. Geomat. Nat. Hazards Risk 2024, 15, 2344804. [Google Scholar] [CrossRef]
- Taalab, K.; Cheng, T.; Zhang, Y. Mapping landslide susceptibility and types using Random Forest. Big Earth Data 2018, 2, 159–178. [Google Scholar] [CrossRef]
- Bernat Gazibara, S.; Sinčić, M.; Krkač, M.; Lukačić, H.; Mihalić Arbanas, S. Landslide susceptibility assessment on a large scale in the Podsljeme area, City of Zagreb (Croatia). J. Maps 2023, 19, 2163197. [Google Scholar] [CrossRef]
- Saha, A.; Villuri, V.G.K.; Bhardwaj, A.; Kumar, S. A Multi-Criteria Decision Analysis (MCDA) Approach for Landslide Susceptibility Mapping of a Part of Darjeeling District in North-East Himalaya, India. Appl. Sci. 2023, 13, 5062. [Google Scholar] [CrossRef]
- Mario, B.; Giacomo, P.; Paola, G.; Giuseppe, P.; Marco, P.; Katia, S.; Francesco, C. Landslides and predisposing factors of the Southern Apennines, Italy. J. Maps 2022, 19, 2137065. [Google Scholar] [CrossRef]
- Huang, X.; Xiong, Y.; Li, H. Sensitivity analysis of landslide based on BP neural network in Yiyang City, Hunan Province. Urban Geol. 2023, 18, 8–14. [Google Scholar]
- Liu, L.L.; Yang, C.; Huang, F.M.; Wang, X.M. Landslide susceptibility mapping by attentional factorization machines considering feature interactions. Geomat. Nat. Hazards Risk. 2021, 12, 1837–1861. [Google Scholar] [CrossRef]
- Liu, L.L.; Yang, C.; Wang, X.M. Landslide susceptibility assessment using feature selection-based machine learning models. Geomech. Eng. 2021, 25, 1–16. [Google Scholar] [CrossRef]
- Youssef, A.M.; Pourghasemi, H.R.; Pourtaghi, Z.S.; Al-Katheeri, M.M. Landslide susceptibility mapping using random forest, boosted regression tree, classification and regression tree, and general linear models and comparison of their performance at Wadi Tayyah Basin, Asir Region, Saudi Arabia. Landslides 2016, 13, 839–856. [Google Scholar] [CrossRef]
- Li, C.Y.; Wang, X.C.; He, C.Z.; Wu, X.; Kong, Z.Y.; Li, X.L. Spatial Database of the National 1:200,000 Digital Geological Map (Public Version) (V1). Development Research Center of China Geological Survey; China Geological Survey [Founding Organization], 1957. National Geological Information Center [Dissemination Organization], 30 June 2019. Available online: http://geochina.cgs.gov.cn/article/doi/10.12029/gc2019Z101?viewType=citedby-info (accessed on 30 November 2019).
- Yi, Y.; Zhang, Z.; Zhang, W.; Xu, Q.; Deng, C.; Li, Q. GIS-based Earthquake-Triggered-Landslide Susceptibility Mapping with an Integrated Weighted Index Model in Jiuzhaigou Region of Sichuan Province, China. Nat. Hazards Earth Syst. Sci. 2019, 19, 1973–1988. [Google Scholar] [CrossRef]
- Ben, Y.; Yi, W.; Huang, X.; Huang, X.; Li, H.; Liu, W. Influence of prophase rainfall pattern-based study on rainfall threshold for monitoring and earlywarning of No.1 landslide at Machi Village on left bank of Duhe River: A Hanjiang River tributary. Water Resour. Hydropower Eng. 2023, 54, 38–50. [Google Scholar] [CrossRef]
- Dou, J.; Yunus, A.P.; Merghadi, A.; Shirzadi, A.; Nguyen, H.; Hussain, Y.; Avtar, R.; Chen, Y.; Pham, B.T.; Yamagishi, H. Different Sampling Strategies for Predicting Landslide Susceptibilities are Deemed Less Consequential with Deep Learning. Sci. Total Environ. 2020, 720, 137320. [Google Scholar] [CrossRef] [PubMed]
- Yi, Y.; Zhang, W.; Xu, X.; Zhang, Z.; Wu, X. Evaluation of neural network models for landslide susceptibility assessment. Int. J. Digit. Earth 2022, 15, 934–953. [Google Scholar] [CrossRef]
- Rabby, Y.W.; Hossain, M.B.; Abedin, J. Landslide susceptibility mapping in three Upazilas of Rangamati hill district Bangladesh: Application and comparison of GIS-based machine learning methods. Geocarto Int. 2021, 37, 3371–3396. [Google Scholar] [CrossRef]
- Quevedo, R.P.; Maciel, D.A.; Uehara, T.D.T.; Vojtek, M.; Rennó, C.D.; Pradhan, B.; Vojteková, J.; Pham, Q.B. Consideration of spatial heterogeneity in landslide susceptibility mapping using geographical random forest model. Geocarto Int. 2021, 37, 8190–8213. [Google Scholar] [CrossRef]
- Zhu, Q.; Zhang, M.; Ding, Y.; Zeng, H.; Wang, W.; Liu, F. Fuzzy logic analysis method for regional landslide sensitivity constrained by spatial characteristics of environmental factors. J. Wuhan Univ. Inf. Sci. Ed. 2021, 46, 1431–1440. [Google Scholar]
- Chen, Z. Research on the Evaluation Model and Application of Geological Disaster Susceptibility Based on Integrated Machine Learning. Master’s Thesis, Lanzhou University of Technology, Lanzhou, China, 2023. [Google Scholar] [CrossRef]
- Li, Y.; Wang, H.; Jin, X. Self-organizing Neural Network Algorithm Based on Random Forest Optimization. J. Jilin Univ. Sci. Ed. 2021, 59, 351–358. [Google Scholar]
- Li, G.; Liu, P.; Zhang, K.; Wu, Q.; Li, Y. Analysis of the Influence of Dimension Unification in the Evaluation of Landslide Susceptibility. Hydrogeol. Eng. Geol. 2024, 51, 118–129. [Google Scholar] [CrossRef]
- Friedman, J.H. Stochastic gradient boosting. Comput. Stat. Data Anal. 2002, 38, 367–378. [Google Scholar] [CrossRef]
- Shi, Q.; Yang, L.; Lei, P.; Xu, H. Research and Implementation of Text Resource Classification Method for Thematic Databases Based on Blending Ensemble Learning. Intell. Theory Pract. 2022, 45, 169–175. [Google Scholar]
- Khosravi, K.; Pham, B.T.; Chapi, K.; Shirzadi, A.; Shahabi, H.; Revhaug, I.; Prakash, I.; Bui, D.T. A comparative assessment of decision trees algorithms for flash flood susceptibility modeling at Haraz watershed, northern Iran. Sci Total Environ. 2018, 627, 744–755. [Google Scholar] [CrossRef] [PubMed]
- Agrawal, N.; Dixit, J. Assessment of landslide susceptibility for Meghalaya (India) using bivariate (frequency ratio and Shannon entropy) and multi-criteria decision analysis (AHP and fuzzy-AHP) models. All Earth. 2022, 34, 179–201. [Google Scholar] [CrossRef]
- Hong, H.; Wang, D.; Zhu, A.; Wang, Y. Landslide susceptibility mapping based on the reliability of landslide and non-landslide sample. Expert Syst. Appl. 2023, 243, 122933. [Google Scholar] [CrossRef]
Disclaimer/Publisher’s Note: The statements, opinions and data contained in all publications are solely those of the individual author(s) and contributor(s) and not of MDPI and/or the editor(s). MDPI and/or the editor(s) disclaim responsibility for any injury to people or property resulting from any ideas, methods, instructions or products referred to in the content. |
© 2025 by the authors. Licensee MDPI, Basel, Switzerland. This article is an open access article distributed under the terms and conditions of the Creative Commons Attribution (CC BY) license (https://creativecommons.org/licenses/by/4.0/).