Abstract
In this study, a series of unrelieved cutting tests was conducted to analyze the effect of joints on rock cutting using a conical pick. The tests were performed on jointed rock mass specimens with joint spacings (Js) of 30, 60, and 90 mm and at cutting depths of 3, 6, 9, and 12 mm. For each case, the distance between the cutting path and the joint plane (d) was varied from 0.1Js to 0.5Js. The cutting force decreased as the distance from the joint plane increased but reached the level observed in intact rock at the midpoint between adjacent joint planes (d = 0.5Js). Regardless of joint spacing, the cutting force reached its minimum when d was between 0.2Js and 0.3Js. The rock fragmentation zone extended beyond the joint plane when d was 0.1Js but became confined within the joint plane from around 0.2Js to 0.3Js. These results indicate that the influence of the joint is most pronounced within this range. Three types of crack propagation patterns were observed near the joint plane: (1) cracks that terminate at the joint along the shortest path, (2) cracks that pass through the joint and reach the opposite free surface, and (3) cracks that end at a free surface located just inside the joint plane. These observations suggest that the reduction in cutting force can be attributed to shorter crack propagation paths due to the presence of the joint. This study contributes to a better understanding of the cutting behavior of jointed rock masses when using a conical pick.
1. Introduction
The major expressways in the Seoul metropolitan area of South Korea have exceeded their originally planned capacity, preventing them from fully functioning as highways. However, conventional expansion methods to increase road capacity are virtually impossible due to the urbanization surrounding these expressways. In this context, underground expressway projects could serve as an effective solution. The underground expressway projects for the section of the Gyeongbu Expressway between Giheung IC and Yangjae IC, and the section of the Gyeongin Expressway between South Cheongna IC and Sinwol IC (Figure 1), have passed preliminary feasibility evaluations and are scheduled to begin construction in 2027.
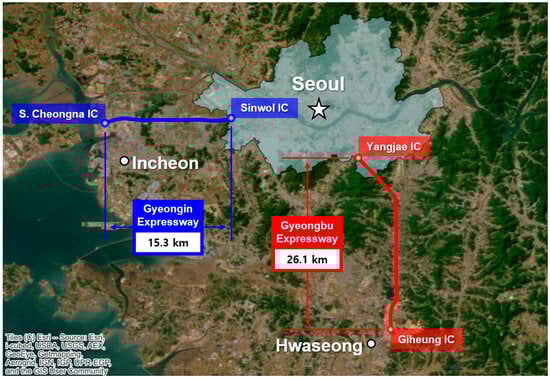
Figure 1.
Underground Expressway Projects That Passed Preliminary Feasibility Evaluation in South Korea.
The Gyeongbu and Gyeongin underground expressways are planned as large cross-section, deep tunnels with four to six lanes, extending 26.1 km and 15.3 km in length, respectively. To ensure the successful implementation of these projects, it is essential to employ an appropriate combination of the conventional drill-and-blast method and mechanical excavation methods, along with effective responses to geological and geotechnical variability.
Mechanical excavation machines can be categorized into full-face machines, such as tunnel boring machines (TBMs), and partial-face machines, such as roadheaders. TBMs typically employ disc cutters to excavate the tunnel face, whereas roadheaders use drag picks to break the rock. The performance of these machines is significantly influenced by geological and geotechnical conditions. Among these, joints are considered one of the key factors. Accordingly, many empirical models developed to predict TBM performance have incorporated joint-related parameters such as rock quality designation (RQD), joint spacing, and volumetric joint count [1,2,3,4,5,6]. Furthermore, various studies have been conducted to investigate the effects of joints on rock fragmentation.
Numerical simulations have been widely employed to investigate the influence of joints on TBM performance. Gong et al. [7] and Gong et al. [8] investigated the influence of joint spacing and joint orientation, which is defined by the angle between the tunnel axis and the joint planes, on rock fragmentation by disc. They identified two distinct fragmentation modes in jointed rock masses: one caused by disc cutter indentation, and the other induced by tensile cracks initiated at the joint planes. Bejari and Khademi Hamidi [9] conducted numerical simulations and showed that cutting efficiency decreases as joint spacing increases and reaches a maximum when the joint orientation is 60°. Choi and Lee [10] and Xue et al. [11] simulated the cutting process of disc cutters, rather than simple indentation, to better understand the influence of joints on TBM performance. Afrasiabi et al. [12] further advanced this line of research by modeling a full-scale TBM disc cutter to simulate TBM excavation in jointed rock masses.
Experimental methods have also been employed as an effective approach to investigate the impact of joints on TBM performance. Yin et al. [13] employed a full-scale linear cutting machine (LCM) test to investigate the effect of joint spacing on rock fragmentation. On the other hand, Yang et al. [14] and Yang et al. [15] analyzed the effects of joint orientation and spacing on the cracking behavior induced by disc cutters through rolling indentation abrasion tests (RIATs). They reported that cutting performance was optimized when joint spacing was smaller and the joint orientation ranged between 45° and 60°. Liu et al. [16], Song et al. [17], and Liu et al. [18] conducted double disc cutter indentation tests combined with digital image correlation (DIC) to analyze the effects of joints on crack propagation and rock fragmentation.
Meanwhile, most empirical models for predicting roadheader performance do not incorporate joint-related parameters [19,20,21,22,23,24,25,26], except for a few that consider RQD [27,28,29]. Dibavar et al. [30] pointed out that joints have a significant impact on roadheader performance and that RQD alone is insufficient to fully characterize the properties of jointed rock masses. Although studies such as the numerical analyses by Zhu et al. [31] and Wang [32] have examined drag pick cutting in jointed rock masses, detailed investigations into the effects of joints on roadheader performance remain limited.
This study employed an experimental method to examine the effects of joints on rock cutting with a conical pick. Conical picks are widely used as primary cutting tools in mechanical excavation equipment such as roadheaders and continuous miners, particularly for soft to medium-hard rock. Their self-rotating design reduces uneven wear and enhances overall cutting efficiency.
A series of unrelieved cutting tests was carried out on jointed rock mass specimens to examine the effect of joints on cutting behavior, considering various distances between the joint plane and the cutting path, as well as different cutting depths. Cutting forces were analyzed based on the distance from the joint plane. In addition, groove profiles were captured using a 3D scanner, and the obtained data were used to investigate the characteristics of crack propagation.
2. Experimental Methodology
2.1. Preparation of Jointed Rock Mass Specimens
Finike limestone, a medium-strength sedimentary rock from Finike in southern Turkey, was used in this study to fabricate jointed rock mass specimens. To fabricate the jointed rock mass specimens, an intact rock block measuring 360 mm × 360 mm × 250 mm, free from bedding planes or joints, was cut into replicate blocks of uniform thickness and bound with cement mortar layers to simulate joint planes. As an example, a joint spacing of 30 mm was achieved by cutting the intact rock block into 12 replicate blocks (360 mm × 250 mm × 30 mm), which were then bound using 2 mm thick cement mortar layers. The assembled blocks were placed in a steel mold, and the remaining space was cast with concrete. Figure 2 provides a clearer understanding of the fabrication process and the dimensions of the jointed rock mass specimens.
The uniaxial compressive strength (σc), elastic modulus (E), and Poisson’s ratio (ν) of Finike limestone, cement mortar, and concrete, which constitute the jointed rock mass specimens, were determined in accordance with ASTM D7012-14 [33]. The tensile strength (σt) and density (ρ) were additionally measured following ASTM D3967-08 [34] and ASTM C97/C97M-15 [35], respectively. Table 1 lists the physical and mechanical properties of these materials.

Table 1.
Physical and mechanical properties of joint rock mass specimen components [36].
The cement mortar used to simulate the artificial joint planes had significantly lower strength than the intact rock, allowing the specimens to realistically represent natural jointed rock masses. As the joint planes were identical in all specimens, factors such as joint roughness and strength were reasonably excluded from the analysis.
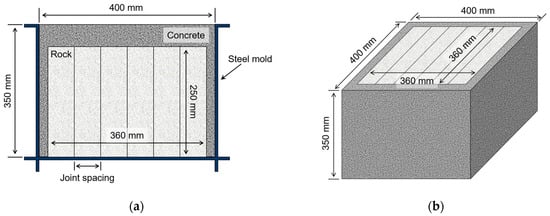
Figure 2.
Schematic diagram of jointed rock mass specimen [36]: (a) cross-sectional view and (b) full view.
2.2. Laboratory-Scale Linear Cutting Machine and Conical Pick
In this study, cutting tests were performed using a laboratory-scale LCM, as shown in Figure 3. The machine operates with three-axis servo motors. The x- and y-axis servo motors have stroke lengths of 500 mm and 700 mm, respectively, allowing precise control of the rock box movement. The z-axis servo motor drives the saddle, enabling vertical movement of the conical pick. Three orthogonally arranged load cells are employed to measure the tool forces exerted on the conical pick during cutting. The side force (FS) is measured by the x-axis load cell, while the normal force (FN) and cutting force (FC) are recorded by the y-axis and z-axis load cells, respectively. Tool force data are acquired at a sampling rate of 10 Hz and stored in CSV format. The control box provides real-time force visualization and allows configuration of cutting parameters.
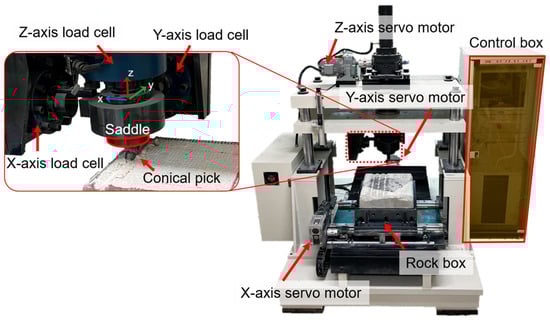
Figure 3.
Components of Laboratory-scale LCM used in this experiment [36].
The conical pick used in the rock cutting tests was the SM06 model manufactured by Kennametal (Pittsburgh, PA, USA), as shown in Figure 4. This pick has a total length of 87.2 mm, with a gauge length of 45.3 mm and a tip angle of 90°. To eliminate the influence of tool orientation, the attack angle was fixed at 45°, while both the skew and tilt angles were set to 0°.
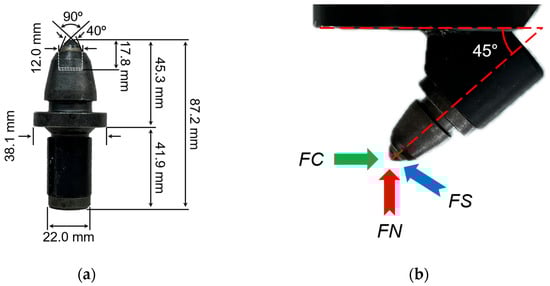
Figure 4.
Conical pick used in this experiment [36]: (a) geometry and specifications of SM06; (b) attack angle.
2.3. Laboratory-Scale Linear Cutting Machine and Cutting Tool
The influence of joints in rock cutting by a conical pick was investigated through a series of unrelieved cutting tests. Figure 5 shows a general view of the cutting test, along with the experimental variables considered in this study. Rock cutting tests were conducted on jointed rock mass specimens with joint spacings (Js) of 30 mm, 60 mm, and 90 mm. Cutting depths (p) were set to 3 mm, 6 mm, 9 mm, and 12 mm. To evaluate the effect of the distance from the joint plane (d), the cutting path was positioned at offsets ranging from 0.1Js to 0.5Js from the joint plane, with a cutting length of approximately 160 mm. After each test, the resulting cutting surface was scanned using a Calibry Mini 3D scanner by Thor3D (Moscow, Russia) to capture the cutting groove profile.
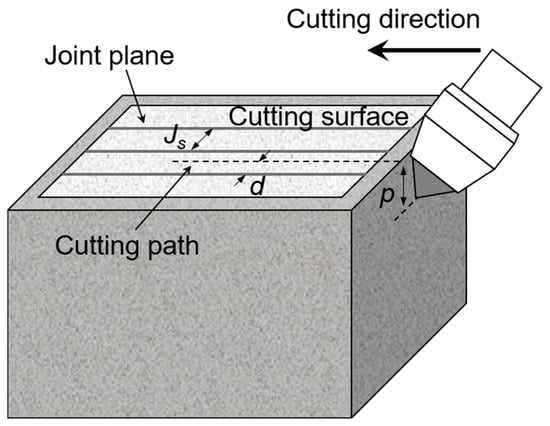
Figure 5.
Schematic overview of the cutting test showing key parameters.
The mean cutting force (FCm) was calculated based only on the cutting force generated during rock cutting, excluding the portion associated with concrete cutting. Crack propagation characteristics were analyzed in cases where larger rock chips were generated. According to Yasar and Yilmaz [37], when the cutting force peaks, it is considered an indicator of large chip formation. In this context, plots of cutting force versus cutting distance were synchronized with the 3D-scanned cutting groove to identify the positions where peak forces occurred. At these peak locations, transverse profiles of the cutting groove were extracted and analyzed using Rhino 7 (Robert McNeel & Associates, Seattle, WA, USA) to examine the corresponding crack propagation behavior (Figure 6).
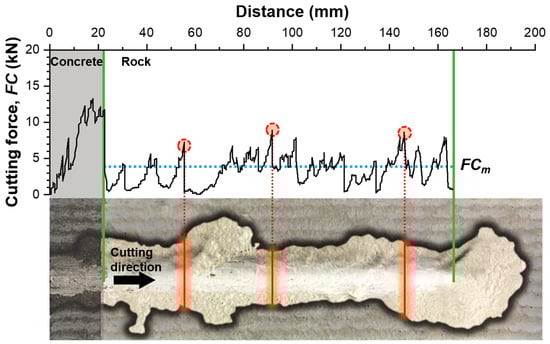
Figure 6.
Synchronization of FC and cutting groove profile.
3. Experimental Results and Discussion
3.1. Effect of Joints on Cutting Force
To investigate the effect of joints on FC, unrelieved cutting tests were performed by varying the distance between the cutting path and the joint plane (d) from 0.1Js to 0.5Js, corresponding to d values ranging from 3 mm to 45 mm depending on joint spacing. The analysis was based on FCm, and the values obtained from cutting tests for each joint spacing are summarized in Table 2, Table 3 and Table 4.
Table 2.
FCm for joint rock mass specimen with Js = 30 mm.
Table 3.
FCm for joint rock mass specimen with Js = 60 mm.
Table 4.
FCm for joint rock mass specimen with Js = 90 mm.
Figure 7 shows the relationship between d and FCm. It should be noted that the cutting depth of 3 mm was tested only under the 30 mm joint spacing. Since this limited the maximum d to just 15 mm, the data point was excluded from Figure 7, as it does not provide a sufficient basis for generalizing the trend of FCm with respect to d. It can be seen from Figure 7 that FCm decreases with increasing d up to a certain point and then increases thereafter. In addition, when cutting is performed at the midpoint between joint planes (d = 0.5Js), FCm shows consistent values for each cutting depth, regardless of joint spacing. For example, in the cutting test with a depth of 6 mm (Figure 7a), FCm was 4.91 kN at d = 3 mm, decreased to a minimum of 4.02 kN at d = 9 mm, and then increased to 4.57 kN at d = 15 mm (0.5Js) for the 30 mm joint spacing. Similar trends were observed for joint spacings of 60 mm and 90 mm, where FCm at d = 0.5Js was 4.86 kN and 4.80 kN, respectively, showing comparable values. It is noted that the FCm values at d = 0.5Js were very close to those observed in intact rock cutting at the same cutting depth (approximately 4.6 kN for 6 mm). This suggests that the influence of joints becomes negligible when the cutting path is positioned at the midpoint between joint planes. This consistent trend was also observed at cutting depths of 9 mm and 12 mm (Figure 7b,c), further supporting the interpretation that joint effects are minimal at d = 0.5Js.
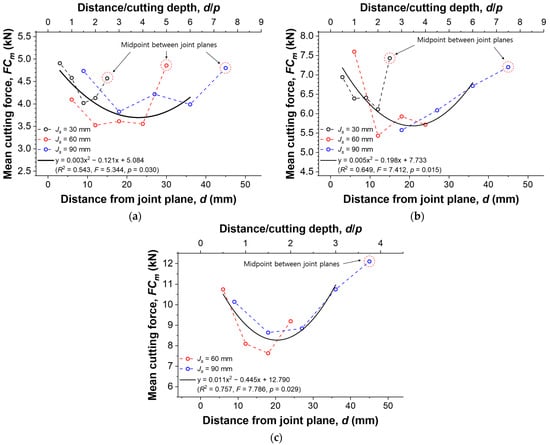
Figure 7.
Variation of FCm with distance from joint plane: (a) p = 6 mm, (b) p = 9 mm, and (c) p = 12 mm.
Therefore, to examine the general relationship between FCm and d independent of joint spacing, a regression curve was fitted using all data points except those at d = 0.5Js, where joint effects were considered negligible. The results confirmed that FCm and d exhibit a quadratic relationship for all cutting depths. All fitted regression curves were statistically significant at the 99% confidence level, as the R2 values were greater than 0.5, the F-values exceeded 5, and the p-values were less than 0.05. Notably, FCm reached its minimum value at approximately d = 20 mm across all cutting depths, suggesting that joint effects are most significant within this range. When viewed in terms of the ratio d/p, the minimum FCm was found to occur at lower d/p values as the cutting depth increased. Considering that the optimal ratio of line spacing to cutting depth (s/p) for achieving high cutting efficiency with conical picks under relieved cutting conditions typically ranges between 2 and 5 [38], this trend implies that the relative influence of joints tends to decrease as the cutting depth increases.
The effect of distance on cutting force, considering joint spacing, was examined by analyzing the correlation between normalized FCm, which represents the ratio of the mean cutting force in jointed rock to that in intact rock under the same cutting depth, and the ratio d/Js was analyzed. As shown in Figure 8, a statistically significant correlation was observed between normalized FCm and d/Js. The R2 value was 0.445, and the F-value exceeded 10, with a p-value of 0.000. These results indicate that the regression curve is statistically significant at the 99% confidence level. According to the regression curve, the normalized FCm reaches its minimum when the ratio d/Js is between 0.2 and 0.3. This suggests that joint effects are most pronounced when d falls within this range, regardless of joint spacing. In contrast, at d/Js = 0.5, the normalized FCm approaches 1 and exhibits low variability. This indicates that joint effects are minimal when cutting is performed at the midpoint between adjacent joint planes. At d/Js = 0.1, the normalized FCm values are distributed near 1, suggesting that the influence of joints is limited even when the cutting path is located very close to a joint plane. Therefore, it can be inferred that joint-induced reductions in cutting force are most significant when the cutting path is located between joints, rather than directly adjacent to one.
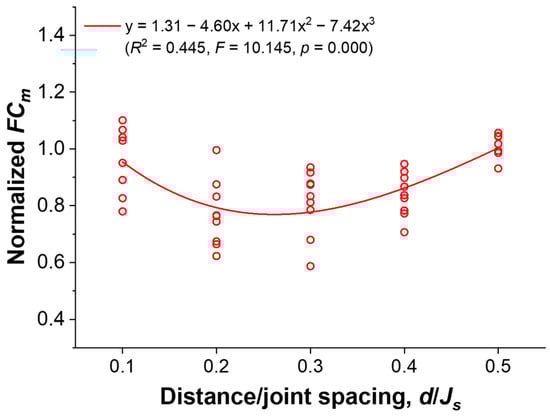
Figure 8.
Relationship between normalized FCm and d/Js.
3.2. Analysis of Cutting Groove Profiles
The cutting groove profiles obtained from 3D scanning were analyzed to investigate the characteristics of rock fragmentation depending on the distance from the joint plane. This analysis focused on cutting tests performed at depths of 6 mm and 9 mm for joint spacings of 60 mm and 90 mm. The condition at d = 0.5Js, where the influence of joints is considered negligible, was excluded from the analysis.
Figure 9 and Figure 10 show contour plots of cutting groove profiles obtained at cutting depths of 6 mm and 9 mm, respectively, for various values of d. It is observed that, regardless of joint spacing and cutting depth, the rock fragmentation zone extends beyond the joint plane when cutting is performed at d = 0.1Js (Figure 9a,e and Figure 10a,e). This phenomenon is clearly illustrated in Figure 11, where rock chips are observed either penetrating across the joint plane (Figure 11a) or forming on both sides of it (Figure 11b), indicating that the joint does not hinder the fragmentation process at this distance. These observations support the trend described in Section 3.1, where the normalized FCm values at d = 0.1Js clustered around 1, implying that joint effects are limited when cutting occurs near the joint plane.
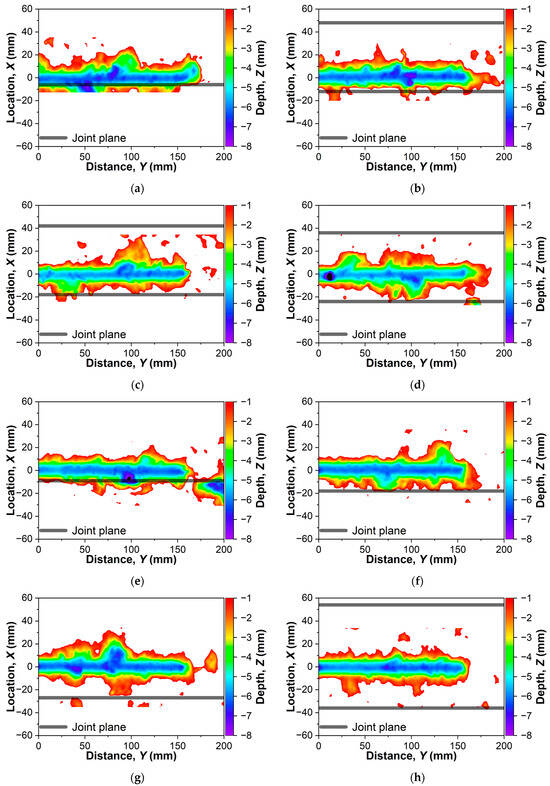
Figure 9.
Contour of cutting groove at p = 6 mm: (a) Js = 60 mm, d = 6 mm; (b) Js = 60 mm, d = 12 mm; (c) Js = 60 mm, d = 18 mm; (d) Js = 60 mm, d = 24 mm; (e) Js = 90 mm, d = 9 mm; (f) Js = 90 mm, d = 18 mm; (g) Js = 90 mm, d = 27 mm; (h) Js = 90 mm, d = 27 mm.
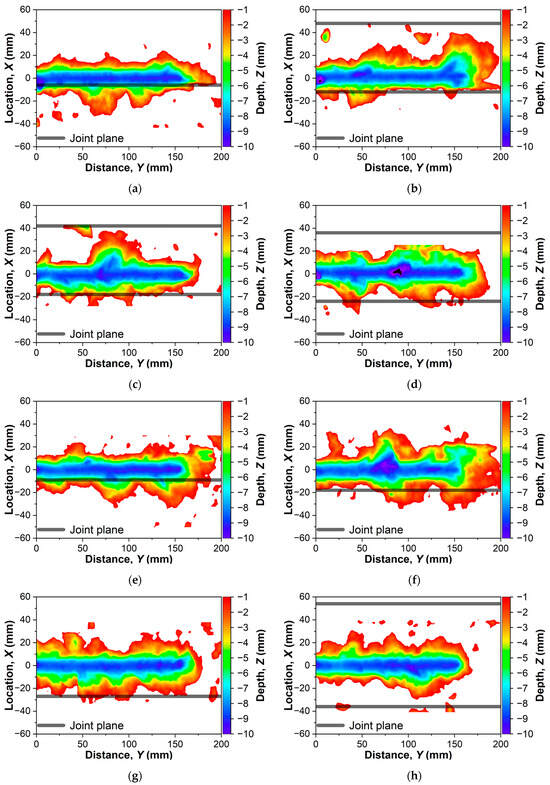
Figure 10.
Contour of cutting groove at p = 9 mm: (a) Js = 60 mm, d = 6 mm; (b) Js = 60 mm, d = 12 mm; (c) Js = 60 mm, d = 18 mm; (d) Js = 60 mm, d = 24 mm; (e) Js = 90 mm, d = 9 mm; (f) Js = 90 mm, d = 18 mm; (g) Js = 90 mm, d = 27 mm; (h) Js = 90 mm, d = 27 mm.
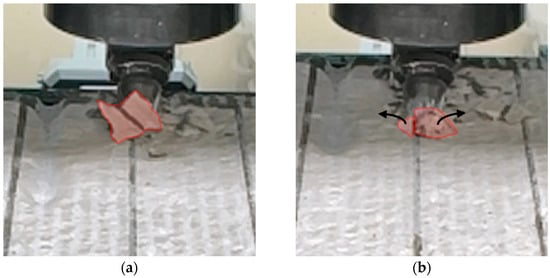
Figure 11.
Chip formation at d = 0.1Js (Js = 60 mm, p = 6 mm): (a) Y = 82 mm and (b) Y = 107 mm.
From approximately d = 0.2Js to 0.3Js, the rock fragmentation zone tended to become confined within the joint plane, and this confinement became more evident as d increased. This phenomenon is clearly illustrated in Figure 12, where rock chips are formed without extending beyond the joint plane, terminating precisely at the joint interface. When considered alongside the results presented in Section 3.1, where FCm reached its minimum within the same d/Js range, it can be inferred that this reduction in cutting force is due to limited crack propagation caused by the presence of the joint, thereby requiring less force for chip formation. Notably, d = 0.2–0.3Js approximately corresponds to twice the cutting depth (2p), indicating that the confining effect of the joint on fragmentation becomes apparent when the distance from the joint plane exceeds this threshold.
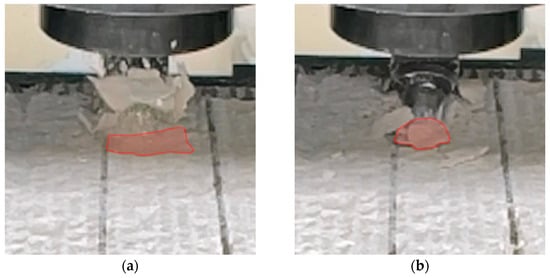
Figure 12.
Chip formation at d = 0.3Js (Js = 60 mm, p = 18 mm): (a) Y = 98 mm and (b) Y = 149 mm.
3.3. Analysis of Crack Propagation Characteristics
To analyze the crack propagation characteristics induced by joints, detailed investigations were conducted at locations where large rock chips formed during cutting. Large rock chips typically form when the FC peaks [36]. In this study, plots of cutting force versus cutting distance were synchronized with the 3D-scanned cutting grooves to identify the positions where FC peaked. At these peak points, transverse profiles were extracted to analyze the patterns of crack propagation. The analysis focused on cutting cases with joint spacings of 60 mm and 90 mm and cutting depths of 6 mm and 9 mm, considering d ranging from 0.1Js to 0.2Js. This range was selected based on the findings in Section 3.2 to investigate variations in crack propagation before the fragmentation zone becomes confined by the joint plane.
To interpret the observed crack behavior, it is useful to refer to Evans [39]. He found that, in rock cutting using point-attack picks such as conical picks, cracks typically initiate at the tip of a pick and propagate toward the free surface, forming a V-shaped groove (shown as a black dotted line in Figure 13). He also observed that the fracture surfaces form an included angle (Φ) relative to the central vertical axis of the groove.
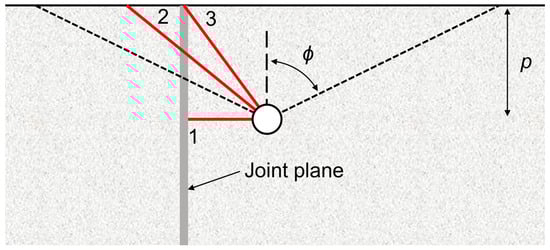
Figure 13.
Crack propagation patterns in jointed rock mass cutting compared with the theory of Evans [39] in intact rock.
Figure 13 illustrates three types of crack propagation patterns observed in jointed rock cutting. The first pattern involves a crack that initiates at the pick tip and terminates at the joint plane without reaching the free surface (1 in Figure 13). This behavior is clearly observed at Y = 118 mm in Figure 14c and at Y = 69 mm in Figure 15d. This observation is consistent with the findings of Gong et al. [7] and Song et al. [17], who noted that crack propagation tends to terminate upon encountering a joint plane. The second pattern features a crack that propagates through the joint plane and continues to the free surface on the opposite side (2 in Figure 13), as seen in Figure 15c. Liu et al. [40] noted that cracks may continue to propagate beyond thin joints, though their length is typically reduced by the presence of the joint. This observation is consistent with this study, where the crack extends past the joint plane but terminates earlier than in intact rock. The third pattern shows a crack terminating at a free surface just ahead of or within the joint plane, without crossing it (3 in Figure 13). This pattern is exemplified in Figure 14b and at Y = 140 mm in Figure 15b.
These crack propagation patterns near the joint plane suggest that the reduction in FCm may be attributed to shorter crack propagation lengths caused by joint interference. In the first pattern, the crack follows the shortest path to the joint plane. In the second and third patterns, although the cracks reach the free surface, the Φ becomes smaller compared to that in intact rock, further reducing overall propagation length.
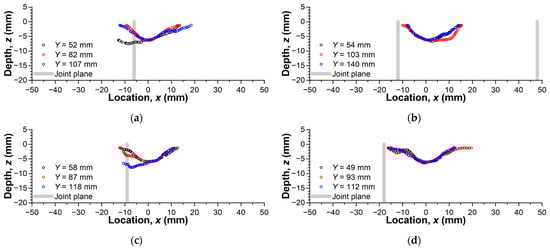
Figure 14.
Crack profiles at p = 6 mm: (a) Js = 60 mm, d = 6 mm; (b) Js = 60 mm, d = 12 mm; (c) Js = 90 mm, d = 9 mm; (d) Js = 90 mm, d = 18 mm.
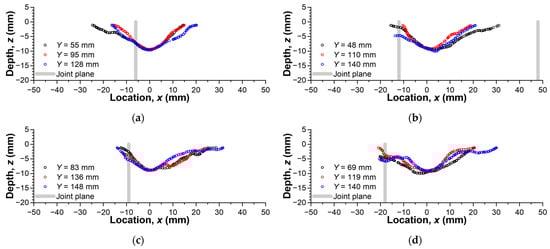
Figure 15.
Crack profiles at p = 9 mm: (a) Js = 60 mm, d = 6 mm; (b) Js = 60 mm, d = 12 mm; (c) Js = 90 mm, d = 9 mm; (d) Js = 90 mm, d = 18 mm.
4. Conclusions
This study investigated the influence of joints on rock cutting with a conical pick by conducting a series of unrelieved cutting tests. The cutting tests were conducted on jointed rock specimens with different joint spacings (Js), and each test was performed at various cutting depths. The distance between the cutting path and the joint plane (d) was set from 0.1Js to 0.5Js. After each test, the cutting surface was scanned using a 3D scanner to obtain the groove profiles, which were then used to analyze the rock fragmentation zone and the characteristics of crack propagation.
FCm initially decreased with increasing distance from the joint plane but increased again as the cutting path approached the midpoint between adjacent joints, ultimately reaching the level observed in intact rock. Regardless of cutting depth, FCm reached its minimum value when d was approximately between 0.2Js and 0.3Js, indicating that the influence of joints on cutting force was most pronounced within this range.
The rock fragmentation zone extended beyond the joint plane when d was 0.1Js, indicating that the influence of the joint was negligible at small d. In contrast, the fragmentation zone becomes confined within the joint plane from around 0.2Js to 0.3Js, further supporting that the joint effects are most significant within this range.
Three types of crack propagation patterns were observed near the joint plane: (1) cracks that terminate at the joint along the shortest path, (2) cracks that pass through the joint and reach the opposite free surface, and (3) cracks that end at a free surface located just inside the joint plane. These observations suggest that the reduction in FCm can be attributed to shorter crack propagation paths due to the presence of the joint.
The findings of this study provide improved insight into the influence of joints in rock cutting using a conical pick. However, it should be noted that this study represents a foundational investigation conducted under simplified and controlled conditions. Specifically, the tests were limited to a single rock type (Finike limestone) and considered only artificially generated planar joints with uniform spacing, orientation, and cohesion. These assumptions may limit the generalizability of the results to more complex geological settings.
To enhance the applicability of the findings, future research should incorporate a broader range of joint parameters (e.g., orientation, roughness, infill material, and mechanical strength), consider multiple rock types, and explore both experimental and numerical approaches under more realistic boundary conditions.
Author Contributions
Conceptualization, H.-E.K.; methodology, H.-E.K.; investigation, H.-E.K.; data curation, H.-E.K. and J.-S.Y.; writing—original draft preparation, H.-E.K.; writing—review and editing, M.-S.K., W.-K.Y. and C.-Y.K. All authors have read and agreed to the published version of the manuscript.
Funding
This work was supported by a Korea Agency for Infrastructure Technology Advancement (KAIA) grant funded by the Ministry of Land, Infrastructure, and Transport (Grant RS-2024-00416524, Development of technology to enhance safety and efficiency of ultra-long K-underground expressway infrastructure).
Institutional Review Board Statement
Not applicable.
Informed Consent Statement
Not applicable.
Data Availability Statement
The original contributions presented in this study are included in the article. Further inquiries can be directed to the corresponding author.
Conflicts of Interest
The authors declare no conflicts of interest.
References
- Sapigni, M.; Berti, M.; Bethaz, E.; Busillo, A.; Cardone, G. TBM performance estimation using rock mass classifications. Int. J. Rock Mech. Min. Sci. 2002, 39, 771–788. [Google Scholar] [CrossRef]
- Hassanpour, J.; Rostami, J.; Zhao, J. A new hard rock TBM performance prediction model for project planning. Tunn. Undergr. Space Technol. 2011, 26, 595–603. [Google Scholar] [CrossRef]
- Rasouli Maleki, M. Rock Joint Rate (RJR); a new method for performance prediction of tunnel boring machines (TBMs) in hard rocks. Tunn. Undergr. Space Technol. 2018, 73, 261–286. [Google Scholar] [CrossRef]
- Salimi, A.; Rostami, J.; Moormann, C. Application of rock mass classification systems for performance estimation of rock TBMs using regression tree and artificial intelligence algorithms. Tunn. Undergr. Space Technol. 2019, 92, 103046. [Google Scholar] [CrossRef]
- Farrokh, E. A study of various models used in the estimation of advance rates for hard rock TBMs. Tunn. Undergr. Space Technol. 2020, 97, 103219. [Google Scholar] [CrossRef]
- Xu, H.; Gong, Q.; Lu, J.; Yin, L.; Yang, F. Setting up simple estimating equations of TBM penetration rate using rock mass classification parameters. Tunn. Undergr. Space Technol. 2021, 115, 104065. [Google Scholar] [CrossRef]
- Gong, Q.M.; Zhao, J.; Jiao, Y.Y. Numerical modeling of the effects of joint orientation on rock fragmentation by TBM cutters. Tunn. Undergr. Space Technol. 2005, 20, 183–191. [Google Scholar] [CrossRef]
- Gong, Q.M.; Jiao, Y.Y.; Zhao, J. Numerical modelling of the effects of joint spacing on rock fragmentation by TBM cutters. Tunn. Undergr. Space Technol. 2006, 21, 46–55. [Google Scholar] [CrossRef]
- Bejari, H.; Khademi Hamidi, J. Simultaneous effects of joint spacing and orientation on TBM cutting efficiency in jointed rock masses. Rock Mech. Rock Eng. 2013, 46, 897–907. [Google Scholar] [CrossRef]
- Choi, S.O.; Lee, S.J. Numerical study to estimate the cutting power on a disc cutter in jointed rock mass. KSCE J. Civ. Eng. 2016, 20, 440–451. [Google Scholar] [CrossRef]
- Xue, Y.; Zhou, J.; Liu, C.; Shadabfar, M.; Zhang, J. Rock fragmentation induced by a TBM disc-cutter considering the effects of joints: A numerical simulation by DEM. Comput. Geotech. 2021, 136, 104230. [Google Scholar] [CrossRef]
- Afrasiabi, N.; Rafiee, R.; Noroozi, M. Investigating the effect of discontinuity geometrical parameters on the TBM performance in hard rock. Tunn. Undergr. Space Technol. 2019, 84, 326–333. [Google Scholar] [CrossRef]
- Yin, L.; Miao, C.; He, G.; Dai, F.; Gong, Q. Study on the influence of joint spacing on rock fragmentation under TBM cutter by linear cutting test. Tunn. Undergr. Space Technol. 2016, 57, 137–144. [Google Scholar] [CrossRef]
- Yang, H.; Liu, J.; Liu, B. Investigation on the cracking character of jointed rock mass beneath TBM disc cutter. Rock Mech. Rock Eng. 2018, 51, 1263–1277. [Google Scholar] [CrossRef]
- Yang, H.Q.; Li, Z.; Jie, T.Q.; Zhang, Z.Q. Effects of joints on the cutting behavior of disc cutter running on the jointed rock mass. Tunn. Undergr. Space Technol. 2018, 81, 112–120. [Google Scholar] [CrossRef]
- Liu, B.; Yang, H.; Haque, E.; Wang, G. Effect of Joint Orientation on the Breakage Behavior of Jointed Rock Mass Loaded by Disc Cutters. Rock Mech. Rock Eng. 2021, 54, 2087–2108. [Google Scholar] [CrossRef]
- Song, K.; Yang, H.; Xie, J.; Karekal, S. An Optimization Methodology of Cutter-Spacing for Efficient Mechanical Breaking of Jointed Rock Mass. Rock Mech. Rock Eng. 2022, 55, 3301–3316. [Google Scholar] [CrossRef]
- Liu, B.; Li, B.; Zhang, L.; Huang, R.; Gao, H.; Luo, S.; Wang, T. Disc-cutter induced rock breakage mechanism for TBM excavation in rock masses with different joint shear strengths. Undergr. Space 2024, 19, 119–137. [Google Scholar] [CrossRef]
- Thuro, K.; Plinninger, R.J. Roadheader excavation performance-geological and geotechnical influences. In Proceedings of the 9th ISRM Congress, Paris, France, 25–28 August 1999. [Google Scholar]
- Gehring, K.H. A cutting comparison. Tunn. Tunn. 1989, 21, 27–30. [Google Scholar]
- Tumac, D.; Bilgin, N.; Feridunoglu, C.; Ergin, H. Estimation of rock cuttability from shore hardness and compressive strength properties. Rock Mech. Rock Eng. 2007, 40, 477–490. [Google Scholar] [CrossRef]
- Ocak, I.; Bilgin, N. Comparative studies on the performance of a roadheader, impact hammer and drilling and blasting method in the excavation of metro station tunnels in istanbul. Tunn. Underg. Space Technol. 2010, 25, 181–187. [Google Scholar] [CrossRef]
- Kahraman, E.; Kahraman, S. The performance prediction of roadheaders from easy testing methods. Bull. Eng. Geol. Environ. 2016, 75, 1585–1596. [Google Scholar] [CrossRef]
- Kahraman, S.; Sercan Aloglu, A.; Aydin, B.; Saygin, E. The needle penetration index to estimate the performance of an axial type roadheader used in a coal mine. Geomech. Geophys. Geo-Energy Geo-Resour. 2019, 5, 37–45. [Google Scholar] [CrossRef]
- Rostami, J.; Ozdemir, L.; Neil, D.M. Performance prediction: A key issue in mechanical hard rock mining. Min. Eng. 1994, 46, 1263–1267. [Google Scholar]
- Copur, H.; Ozdemir, L.; Rostami, J. Roadheader applications in mining and tunneling industries. In Proceedings of the Annual Meeting of American Society for Mining, Metallurgy and Exploration (SME), Orlando, FL, USA, 9–11 March 1998. [Google Scholar]
- Bilgin, N.; Seyrek, T.; Erding, E.; Shahriar, K. Roadheaders glean valuable tips for istanbul metro. Tunn. Tunn. Int. 1990, 22, 29–32. [Google Scholar]
- Ebrahimabadi, A.; Goshtasbi, K.; Shahriar, K.; Cheraghi Seifabad, M. A model to predict the performance of roadheaders based on the rock mass brittleness index. J. S. Afr. Inst. Min. Metall. 2011, 111, 355–364. [Google Scholar]
- Abdolreza, Y.C.; Siamak, H.Y. A new model to predict roadheader performance using rock mass properties. J. Coal Sci. Eng. 2019, 19, 51–56. [Google Scholar] [CrossRef]
- Dibavar, B.; Kahraman, S.; Rostami, M.; Fener, M. A new rock mass cuttability classification for roadheaders used in coal mining. Min. Metall. Explor. 2023, 40, 1141–1152. [Google Scholar] [CrossRef]
- Zhu, X.; Liu, W.; Lv, L. The investigation of rock cutting simulation based on discrete element method. Geomech. Eng. 2017, 13, 977–995. [Google Scholar]
- Wang, M. Study conical pick cutting performance and fatigue life in breaking rock plate process with numerical simulation. Sci. Rep. 2024, 14, 857. [Google Scholar] [CrossRef]
- ASTM D7012-14; Standard Test Methods for Compressive Strength and Elastic Moduli of Intact Rock Core Specimens Under Varying States of Stress and Temperatures. ASTM International: West Conshohocken, PA, USA, 2014.
- ASTM D3967-08; Standard Test Method for Splitting Tensile Strength of Intact Rock Core Specimens with Flat Loading Platens. ASTM International: West Conshohocken, PA, USA, 2008.
- ASTM C97/C97M-15; Standard Test Methods for Absorption and Bulk Specific Gravity of Dimension Stone. ASTM International: West Conshohocken, PA, USA, 2015.
- Kim, H.E.; Kim, M.S.; Yoo, W.K.; Kim, C.Y. Experimental investigation on the effects of cutting direction and joint spacing on the cuttability behaviour of a conical pick in jointed rock mass. Appl. Sci. 2025, 15, 4347. [Google Scholar] [CrossRef]
- Yasar, S.; Yilmaz, A.O. Drag pick cutting tests: A comparison between experimental and theoretical results. J. Rock Mech. Geotech. Eng. 2018, 10, 893–906. [Google Scholar] [CrossRef]
- Bilgin, N.; Demircin, M.A.; Copur, H.; Balci, C.; Tuncdemir, H.; Akcin, N. Dominant rock properties affecting the performance of conical picks and the comparison of some experimental and theoretical results. Int. J. Rock Mech. Min. Sci. 2006, 43, 139–156. [Google Scholar] [CrossRef]
- Evans, I. Theory of the cutting force for point-attack picks. Int. J. Min. Eng. 1984, 2, 63–71. [Google Scholar] [CrossRef]
- Liu, J.; Cao, P.; Du, C.; Jiang, Z.; Liu, J. Effects of discontinuities on penetration of TBM cutters. J. Cent. South Univ. 2015, 22, 3624–3632. [Google Scholar] [CrossRef]
Disclaimer/Publisher’s Note: The statements, opinions and data contained in all publications are solely those of the individual author(s) and contributor(s) and not of MDPI and/or the editor(s). MDPI and/or the editor(s) disclaim responsibility for any injury to people or property resulting from any ideas, methods, instructions or products referred to in the content. |
© 2025 by the authors. Licensee MDPI, Basel, Switzerland. This article is an open access article distributed under the terms and conditions of the Creative Commons Attribution (CC BY) license (https://creativecommons.org/licenses/by/4.0/).