
Dynamic Response Analysis of Parallel Twin Tunnels Under Different Train Loads


Abstract
Featured Application
Abstract
1. Introduction
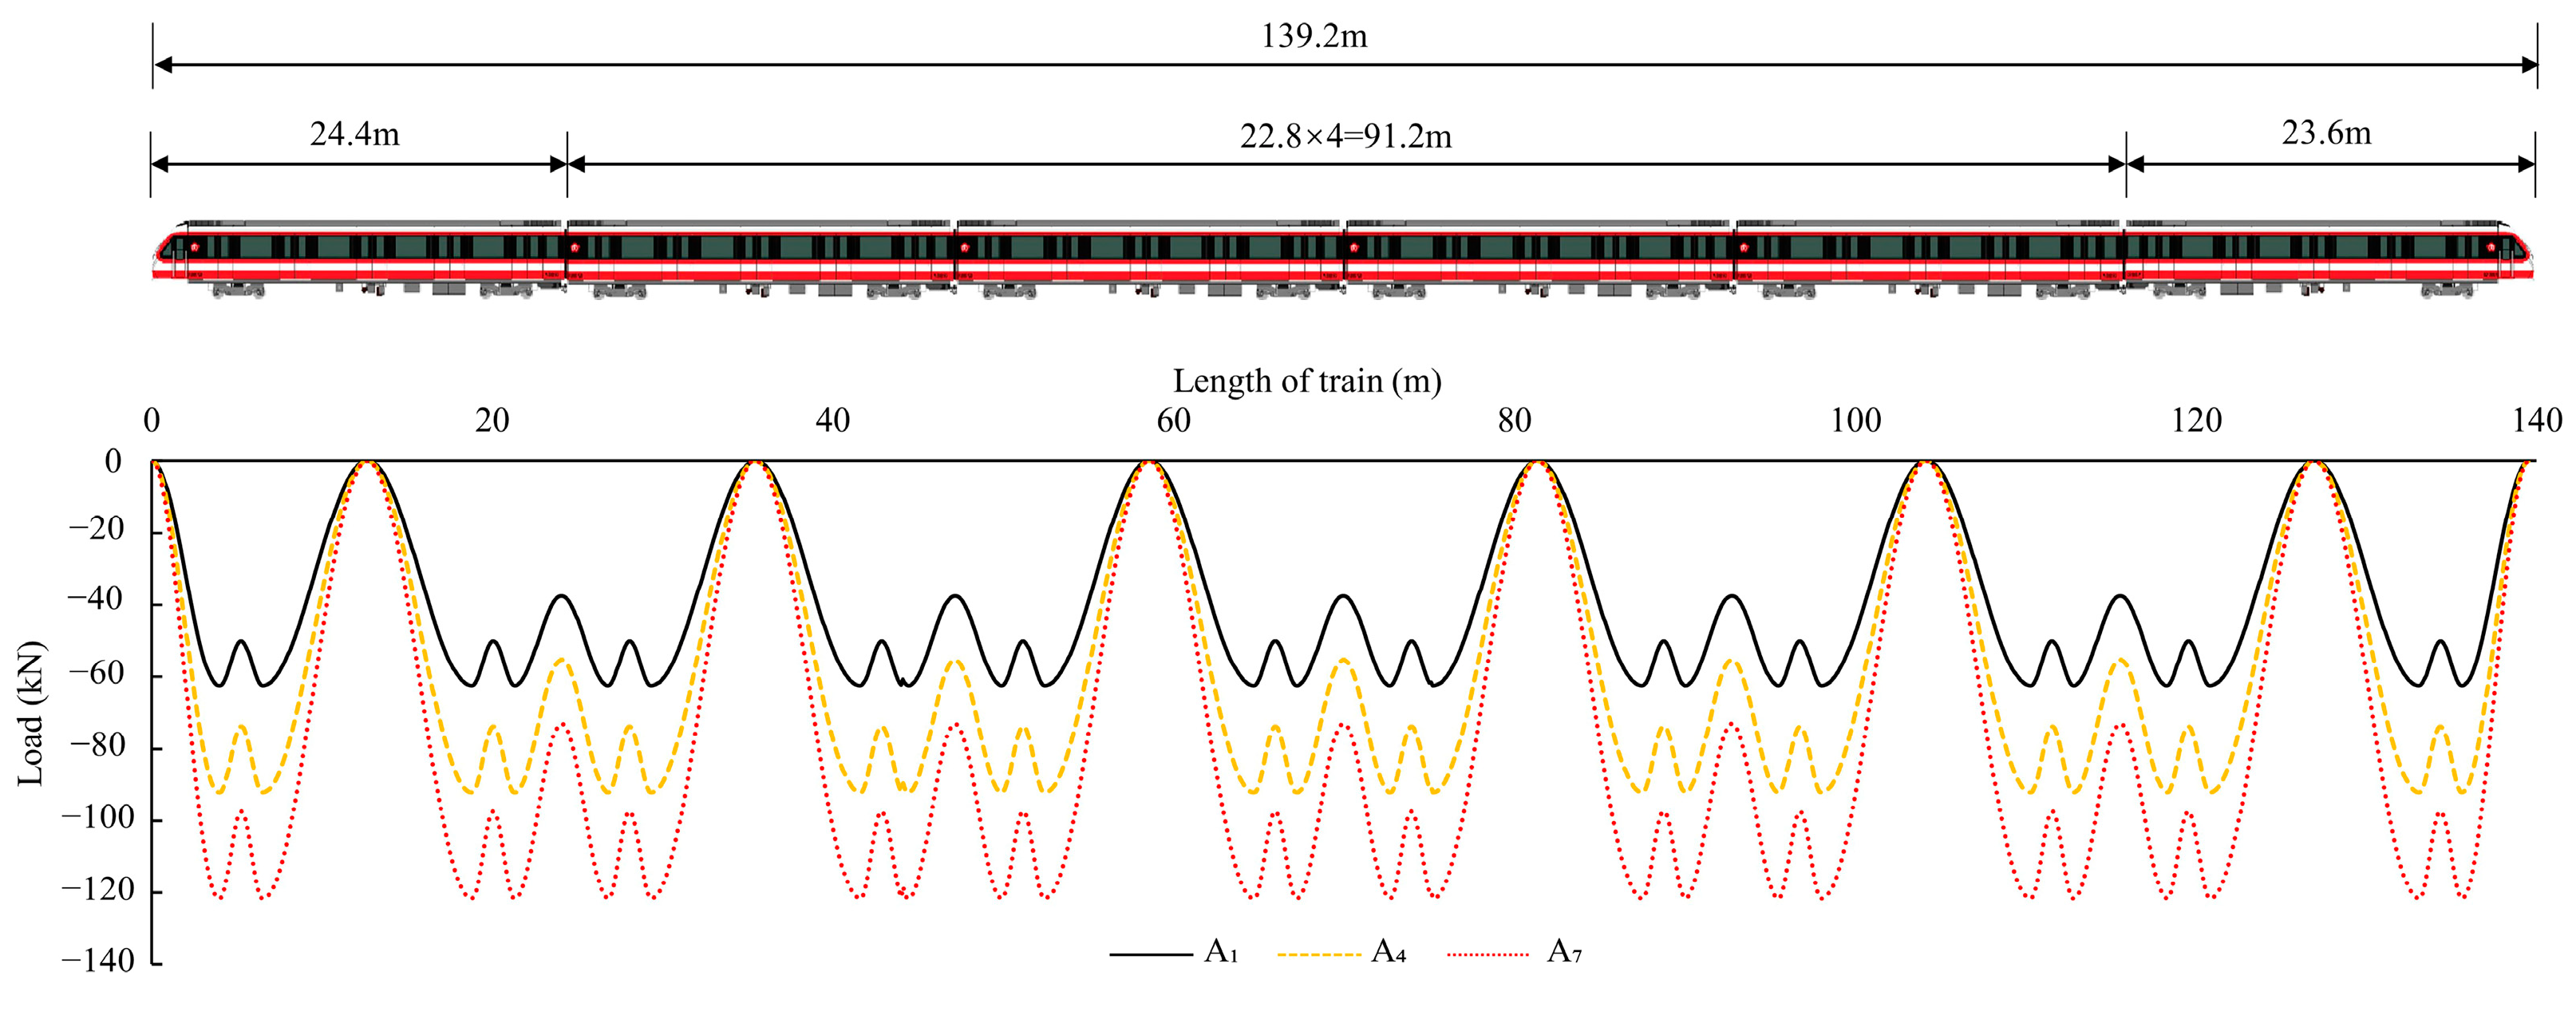
2. Background Project and Vibration of Train Type A
3. DEM Model
- (1)
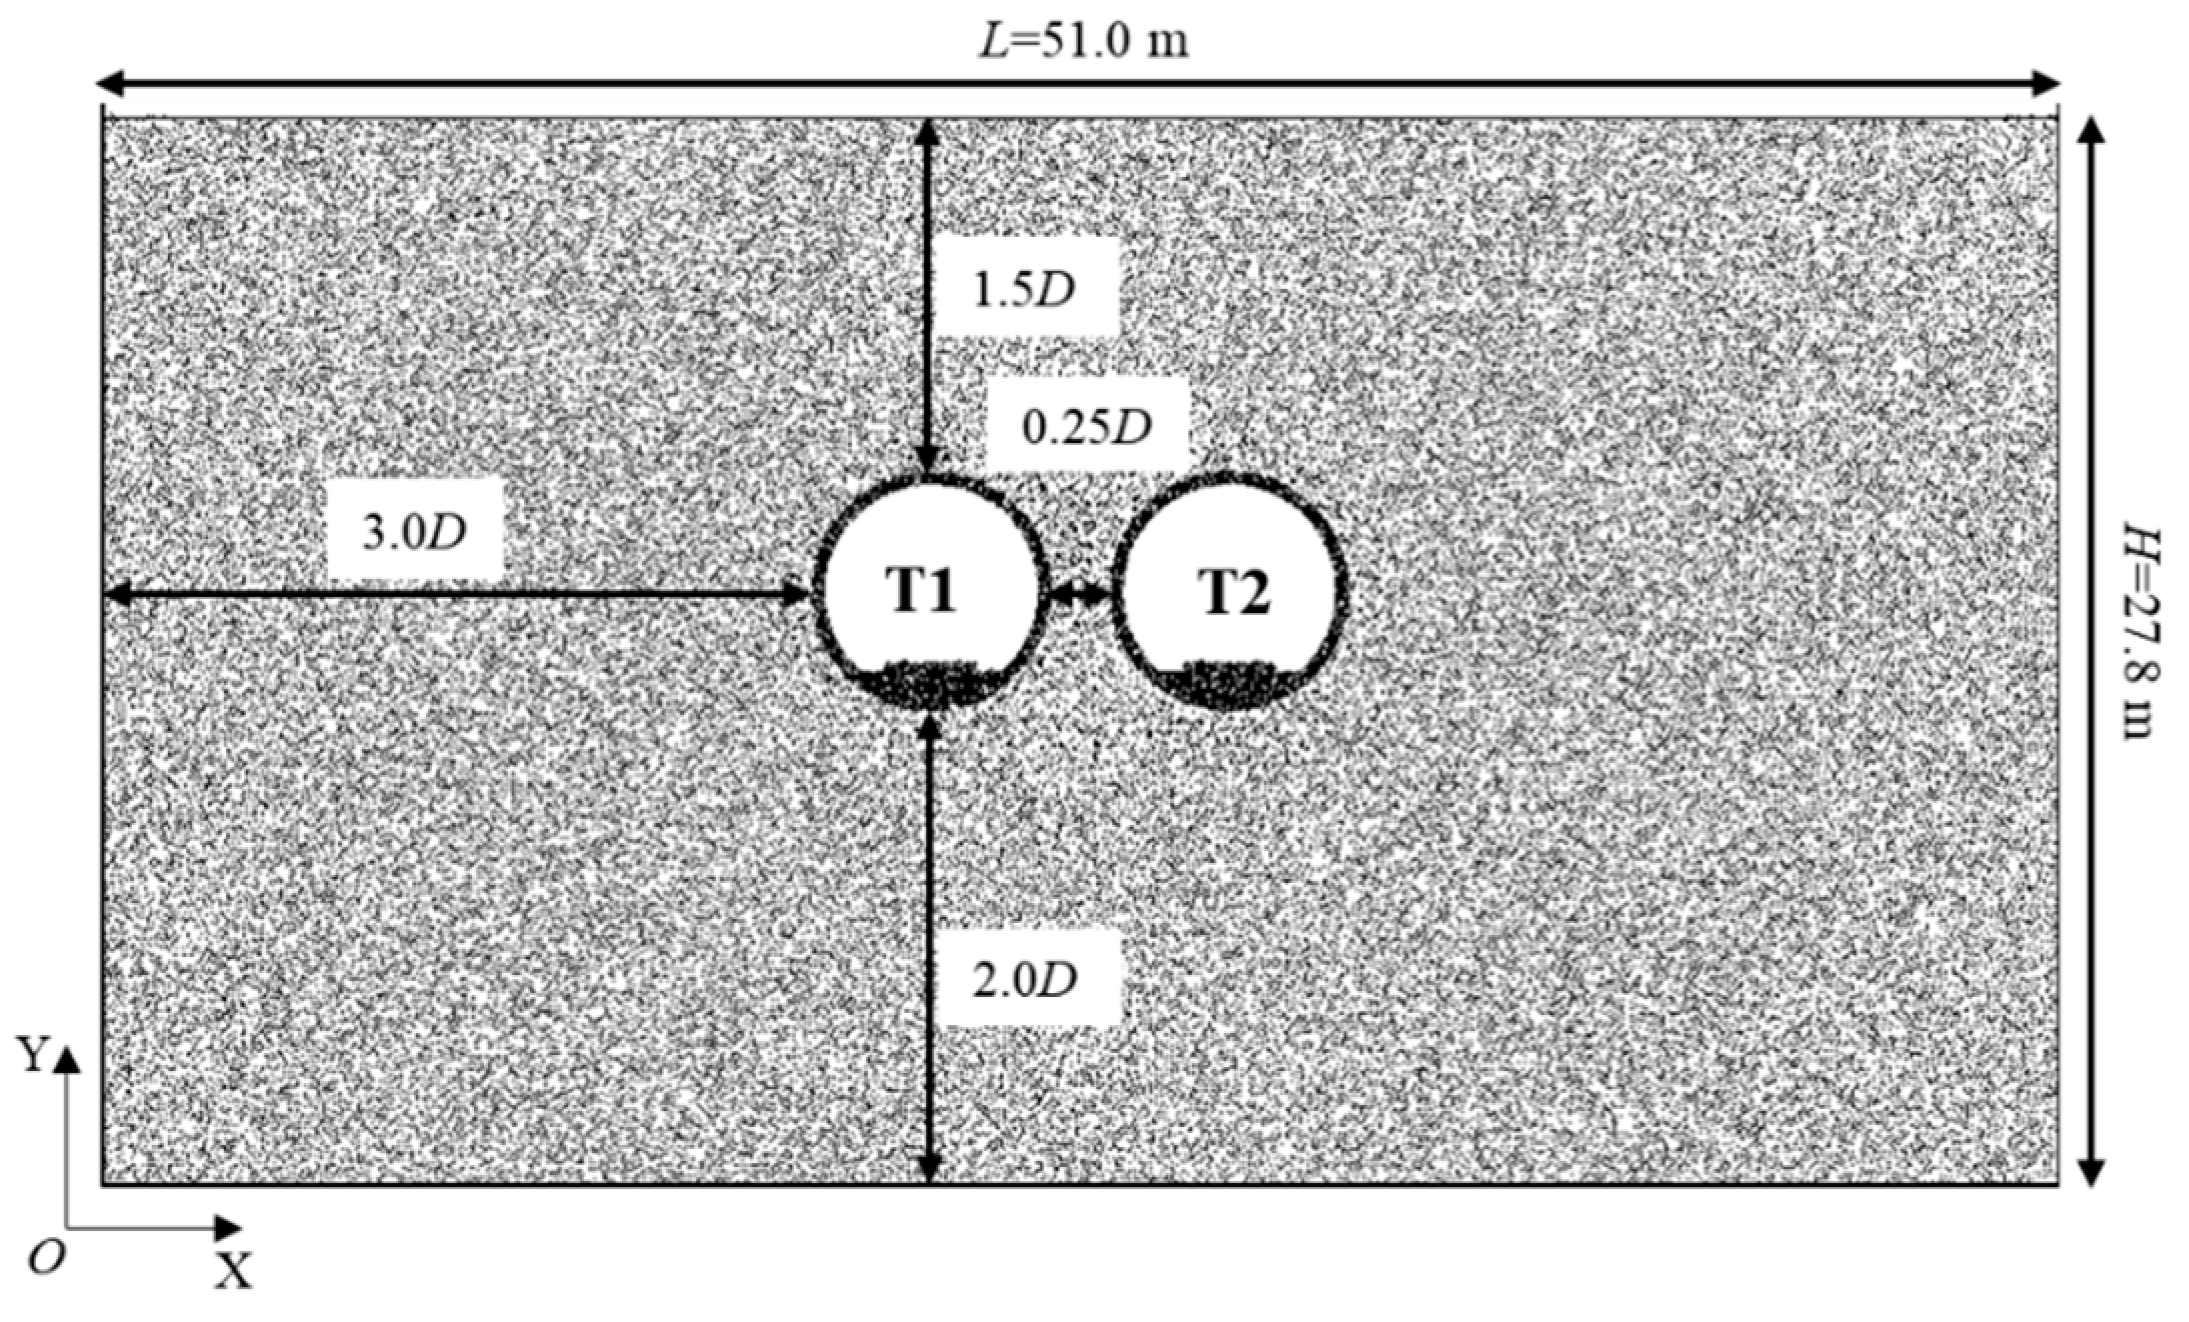
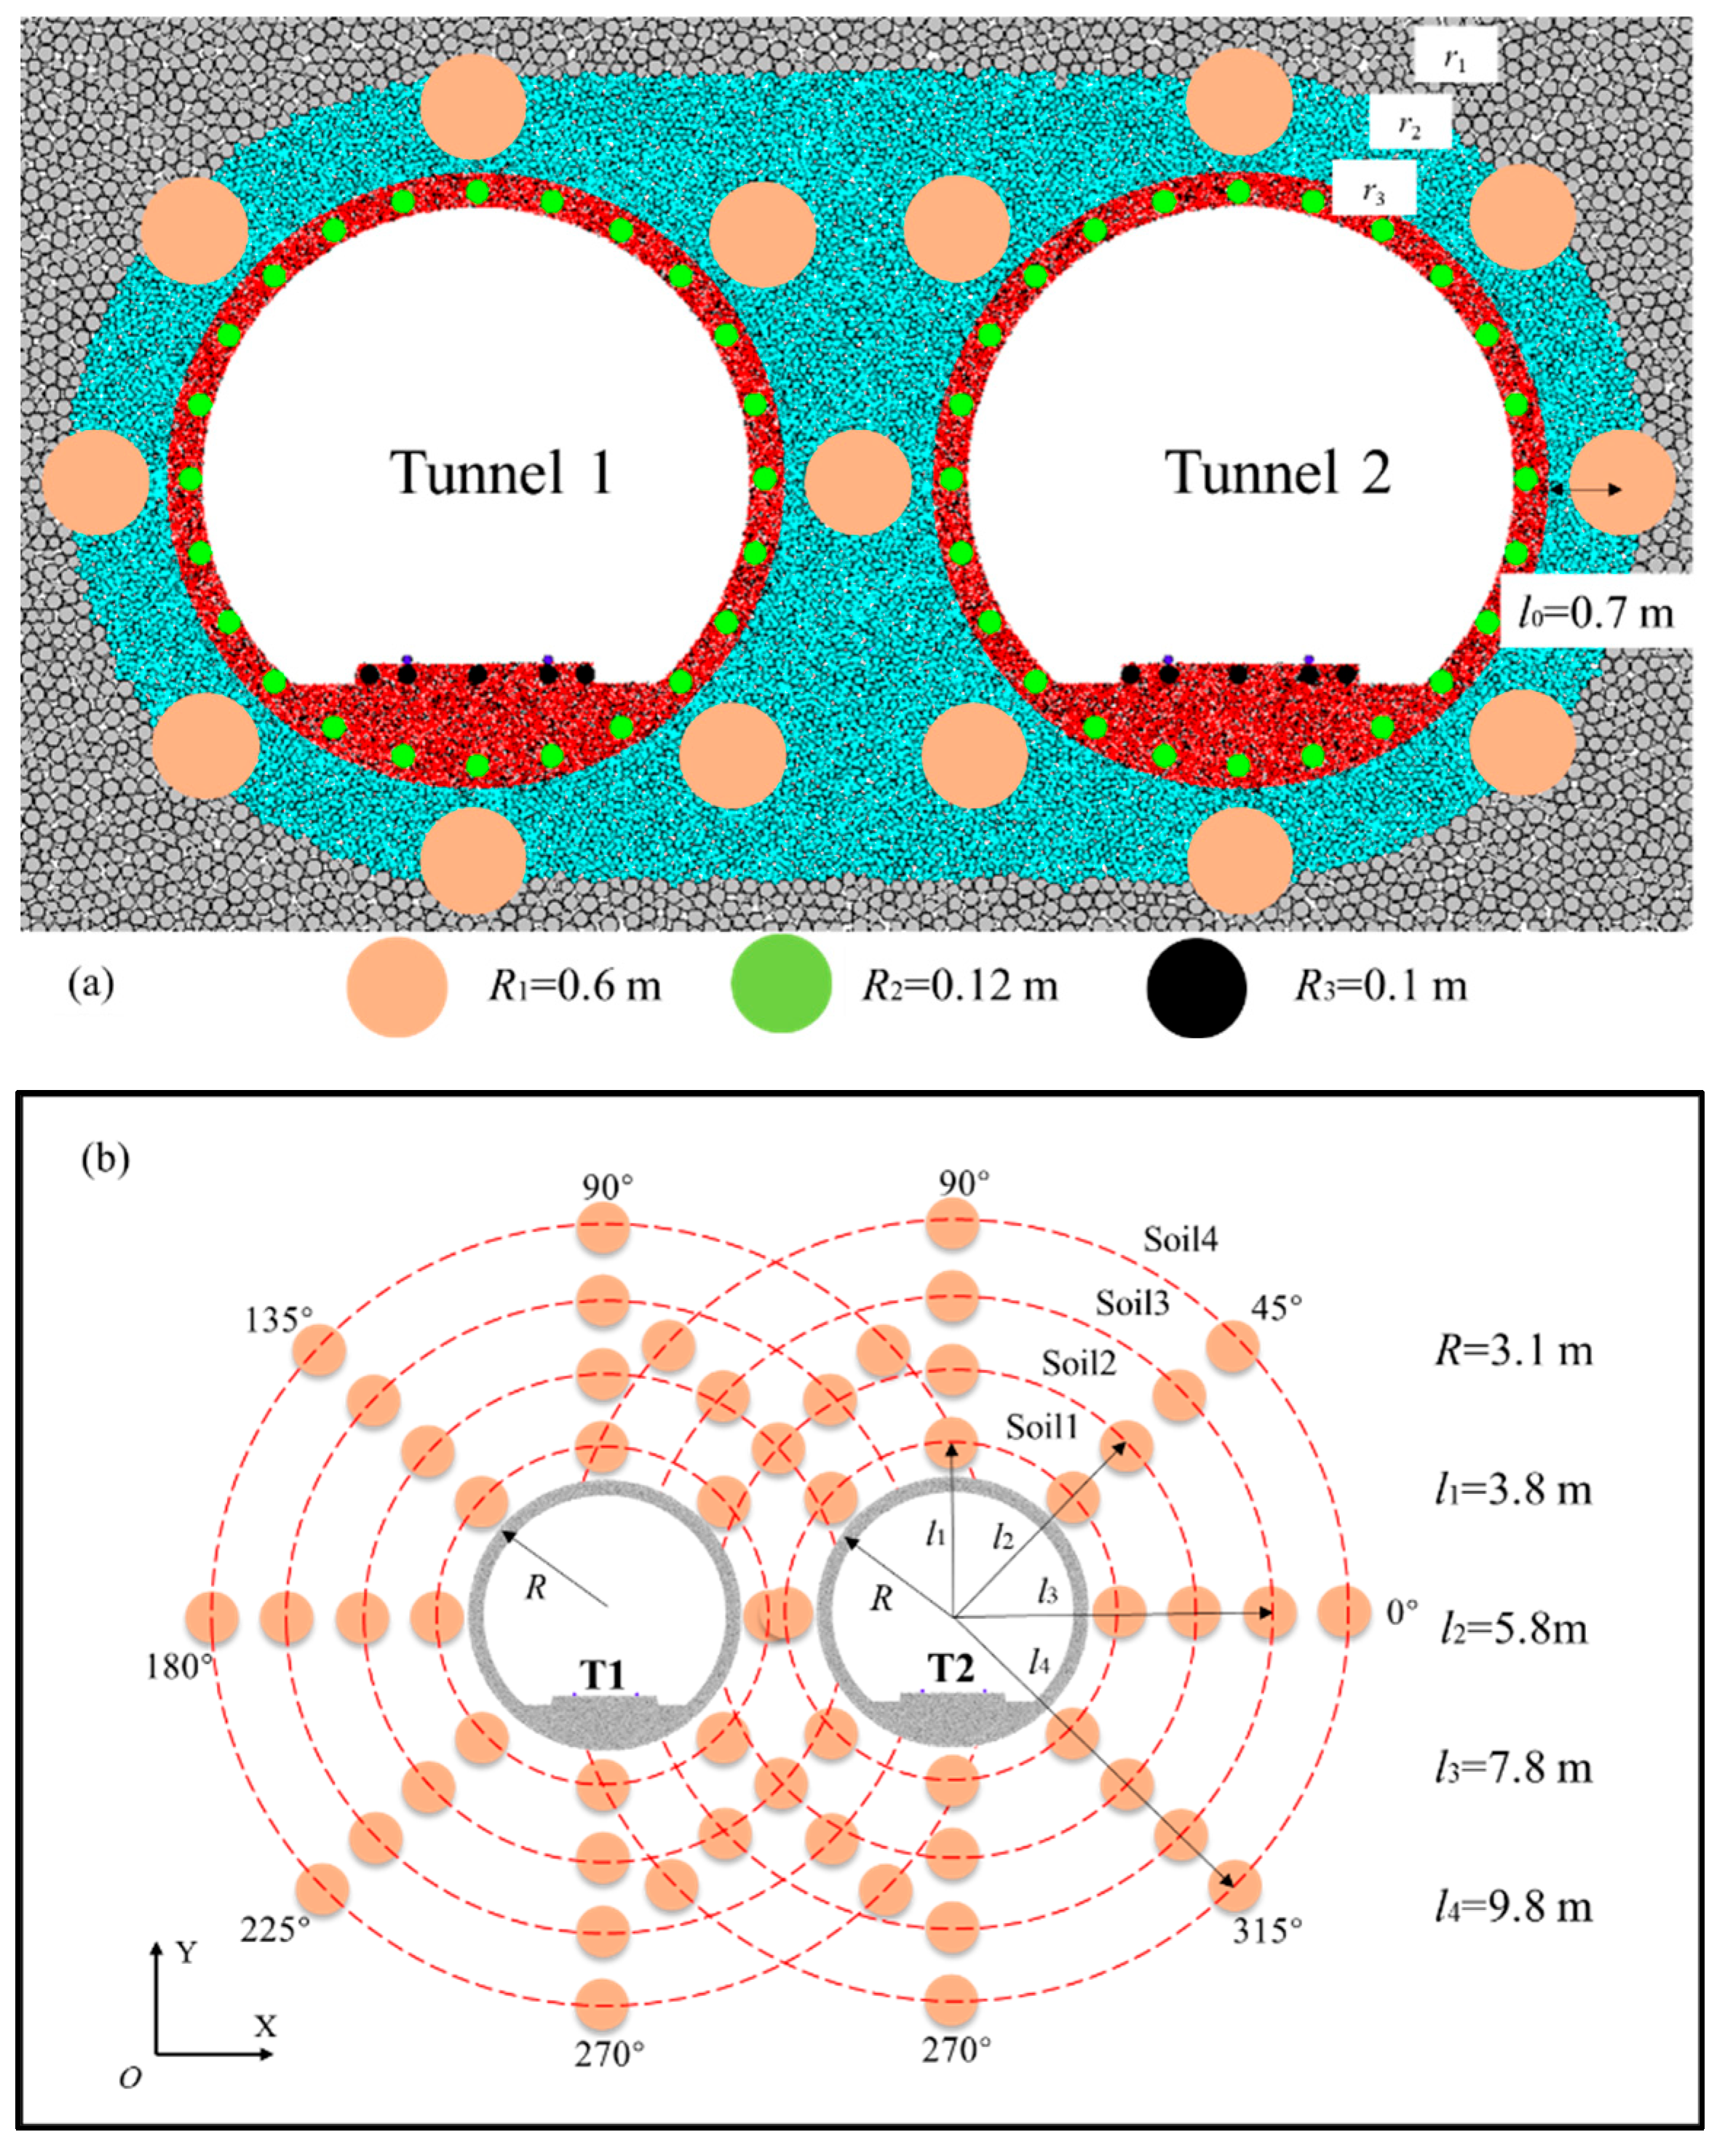
- Generate walls and particles. Specifically, particles with r1 = 0.06–0.1 m are placed far from the tunnel area, particles with r2 = 0.03–0.05 m are positioned closer to the tunnel area, and particles with r3 = 0.009–0.012 m are set near the tunnel area. The overall model is shown in Figure 3.
- (2)
- The gravity is set to g = 9.81 m/s2, and the damping is set to 0.7 during the model equilibrium phase and 0.1 during the subway train operation phase.
- (3)
- Set up monitoring points. The monitoring points are arranged in the twin-tunnel structure and its surroundings, with surface monitoring points established at intervals of 0.5 m. The detailed layout of the monitoring points within the tunnel structure and its surroundings is illustrated in Figure 4. Due to the proximity of T1 and T2, a single monitoring point is placed at 0° of T1 and 180° of T2.
- (4)
- Apply train loads. The train load is applied to the steel rails of Tunnel 1 under eight different conditions at a running speed of 120 km/h. The time required for a train to pass through the tunnel’s cross-section is calculated to be 4.18 s. The static and dynamic characteristics of the tunnel structure and its surroundings during train operation are monitored through the established observation points.
4. Results and Discussion
4.1. Twin-Tunnel Structure Response
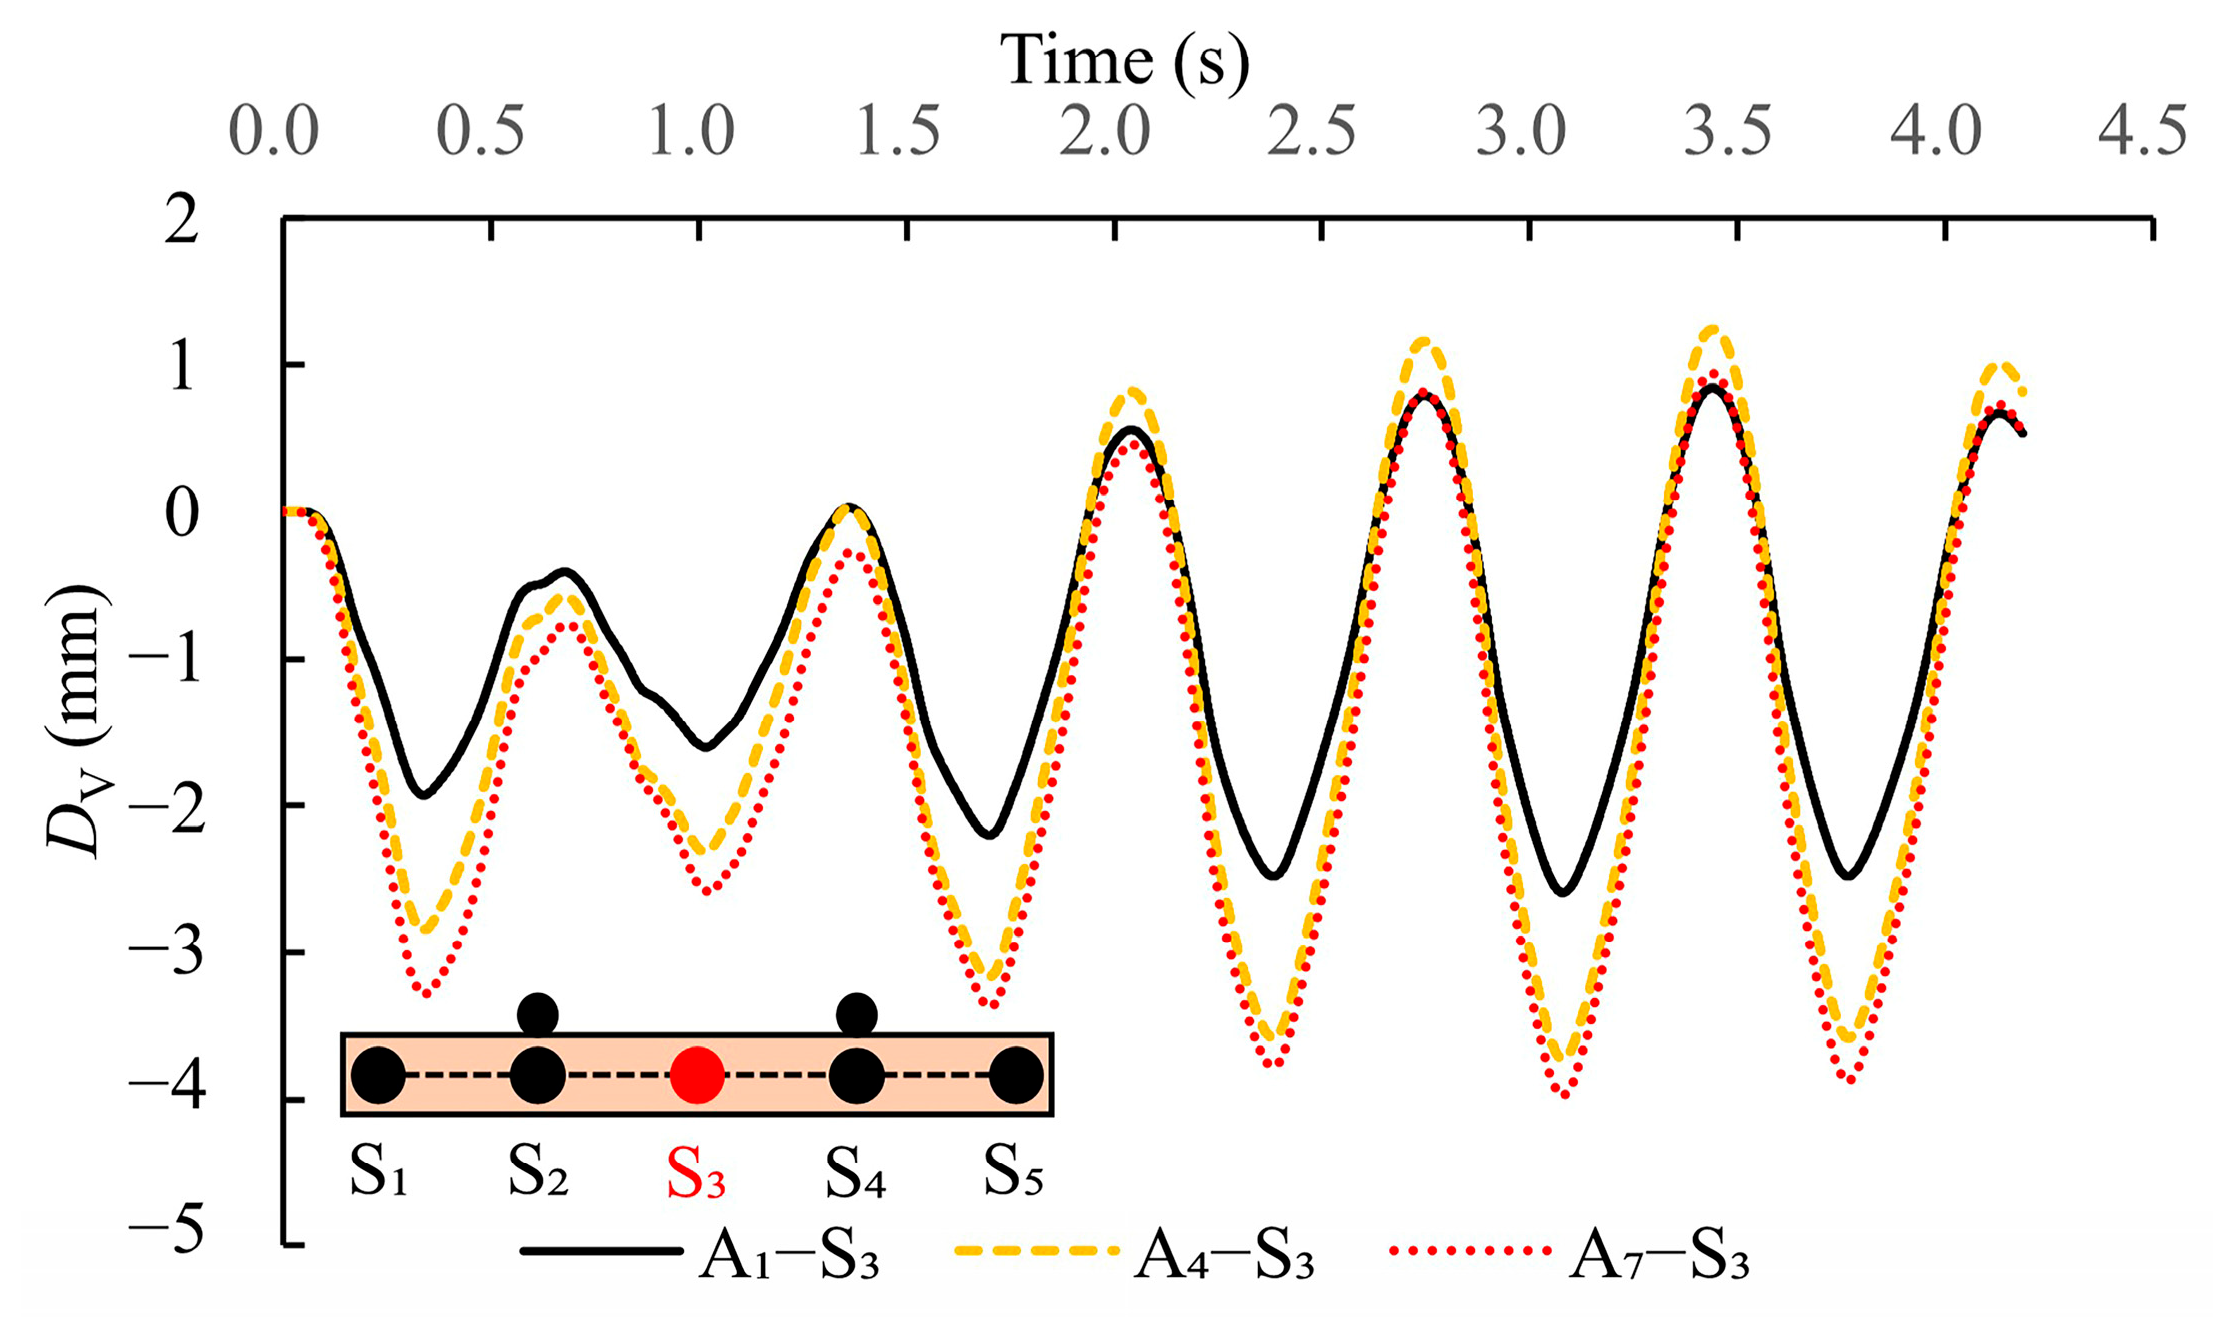
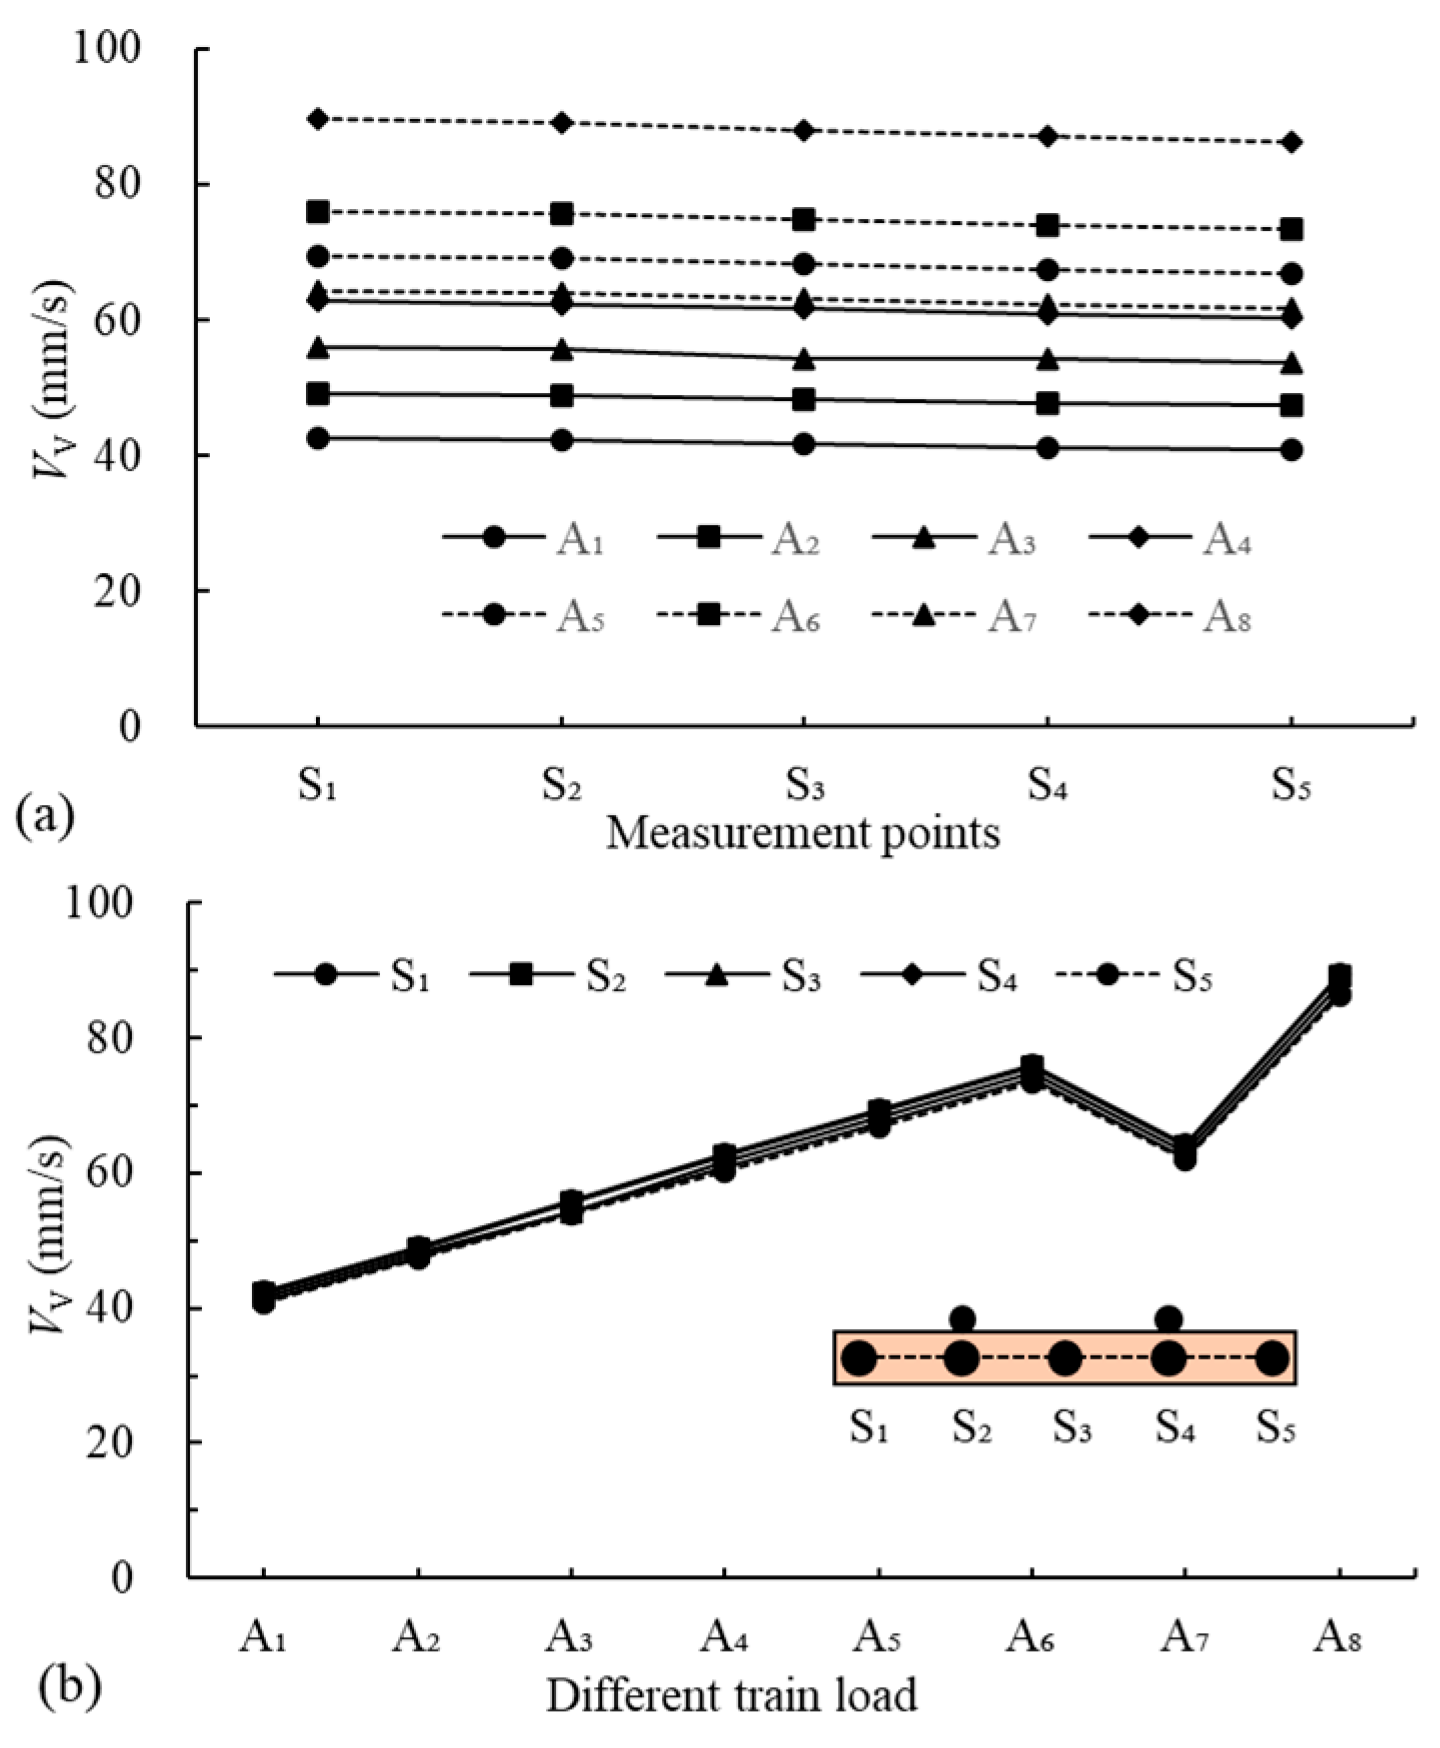
4.1.1. Sleepers
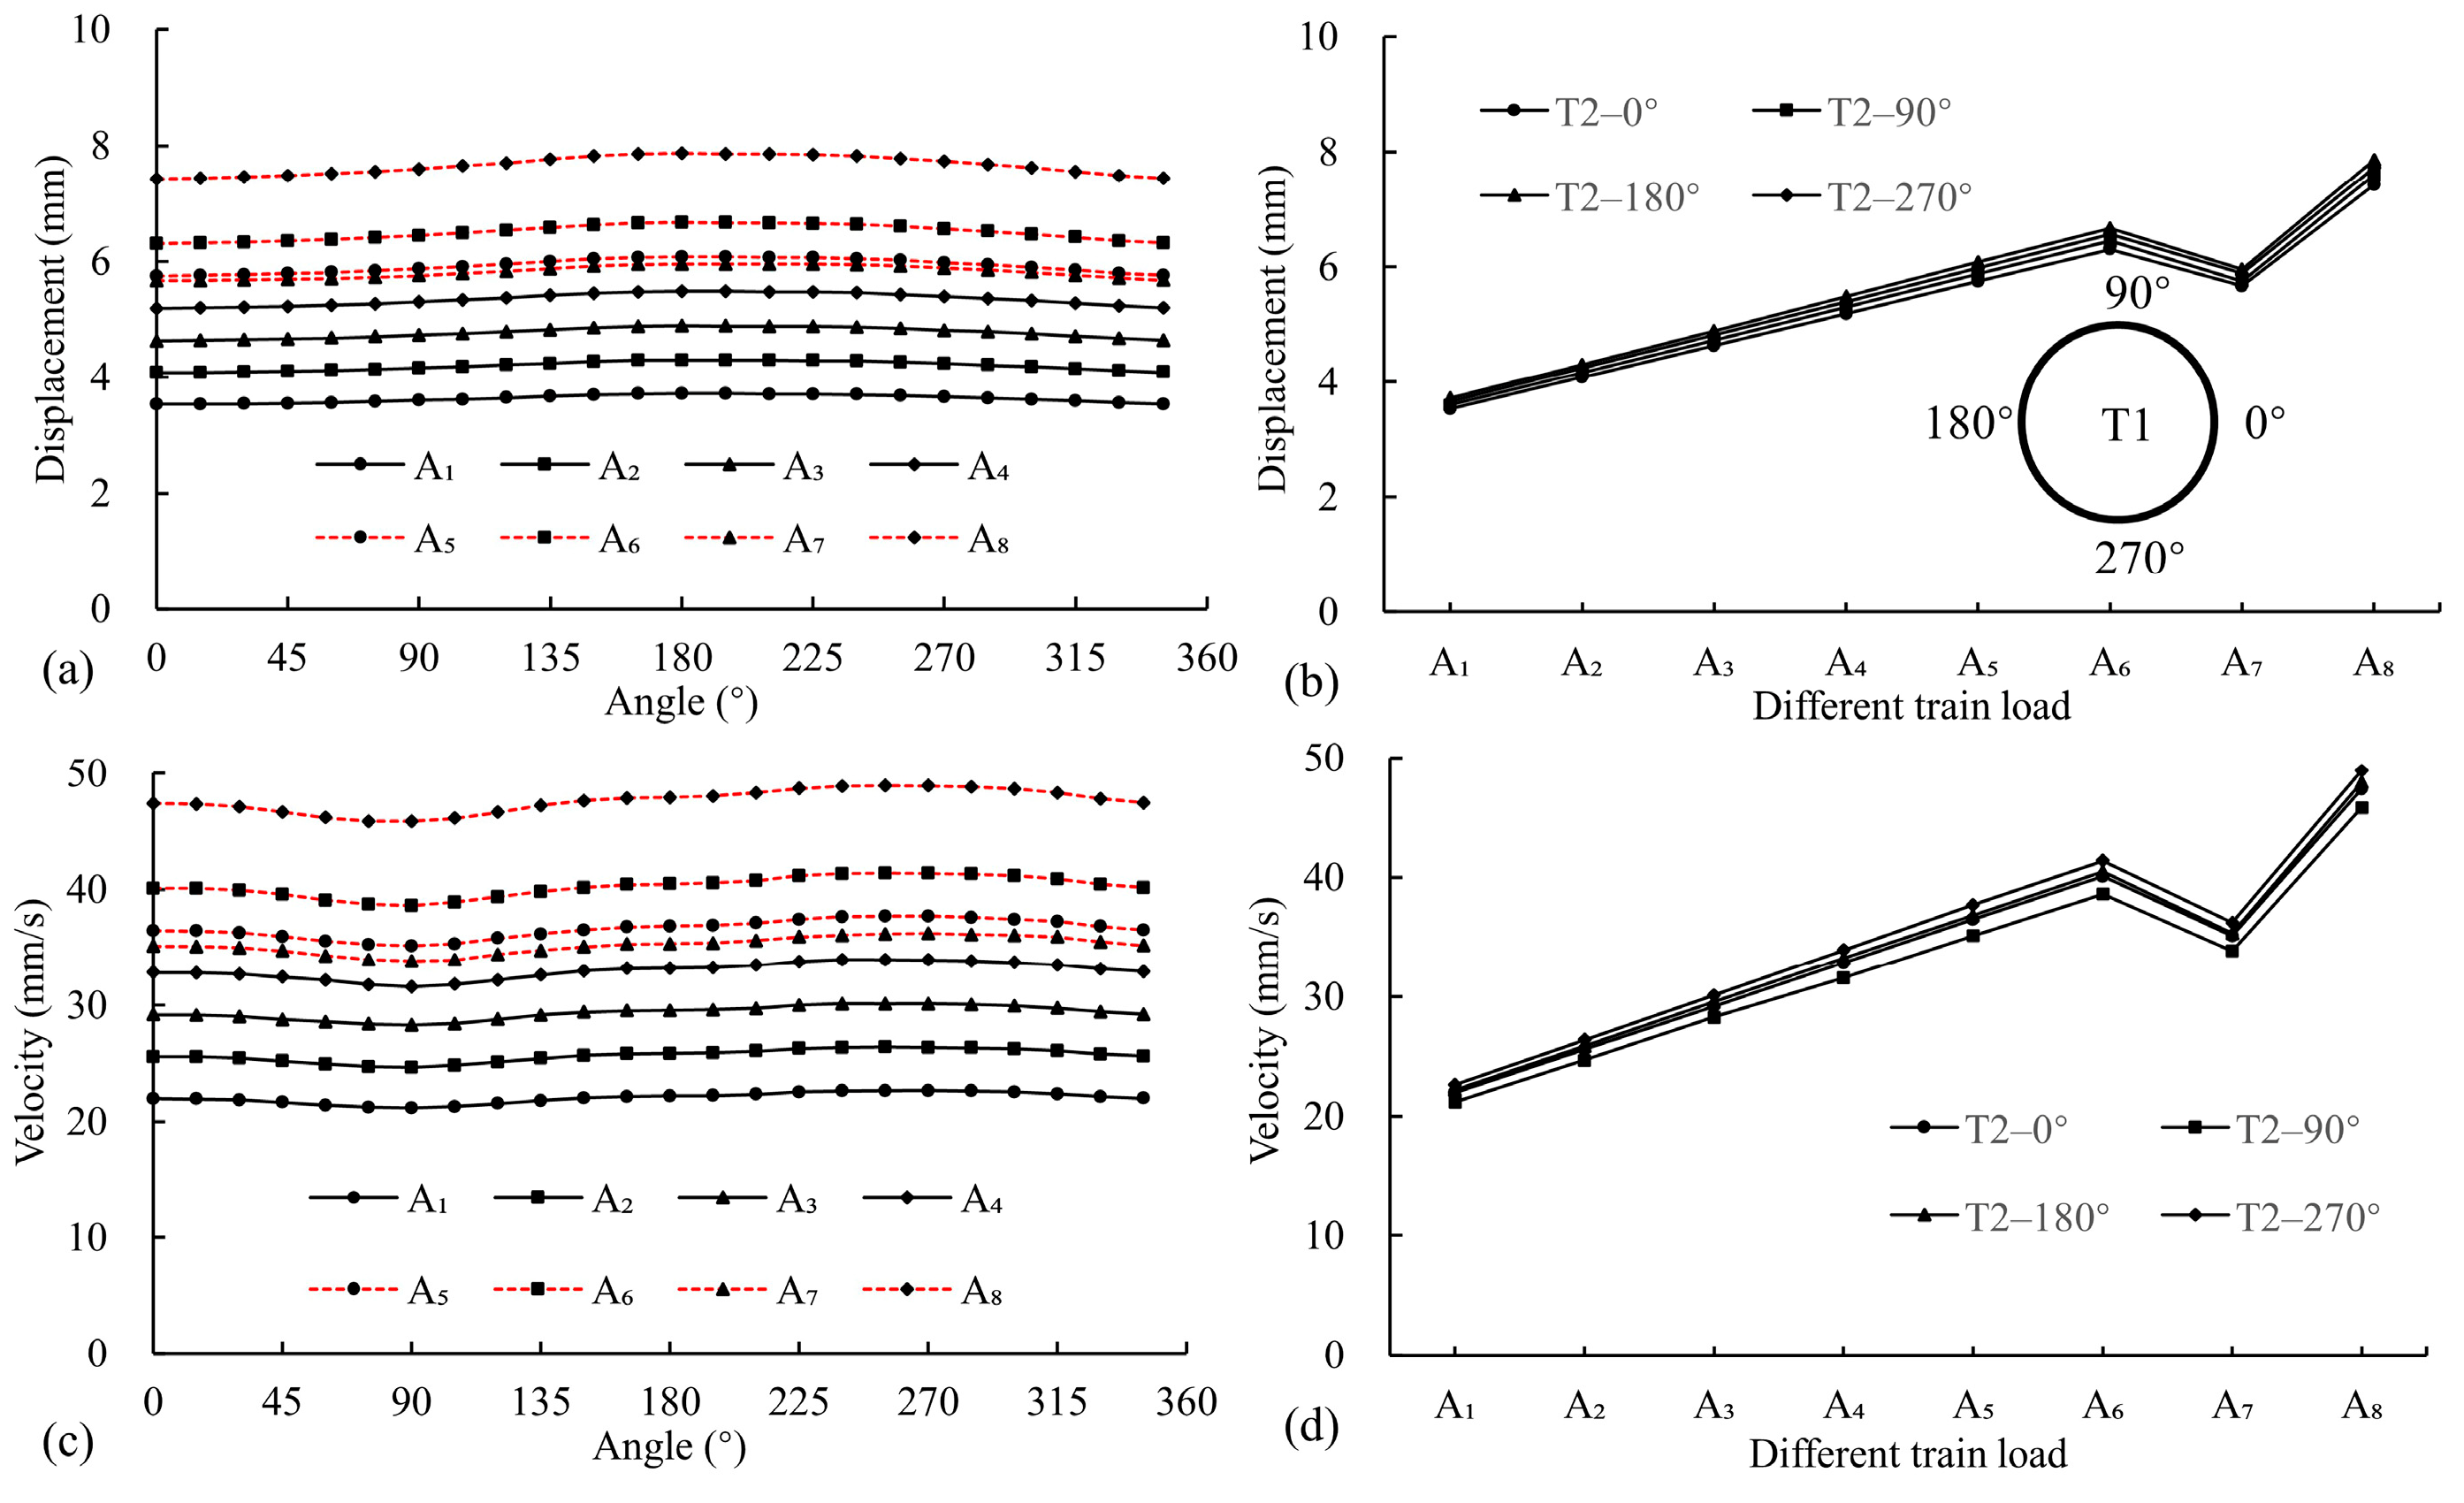
4.1.2. Liners
- (1)
- It does not reach the value under the A7 condition (121.6 kN).
- (2)
- (3)
- The load setting spacing between conditions is too large, for example, Heidary et al. [14] studied the load response to the surface when the axle loads were 10 t, 14 t, and 18 t.
4.2. Surrounding Soil Response
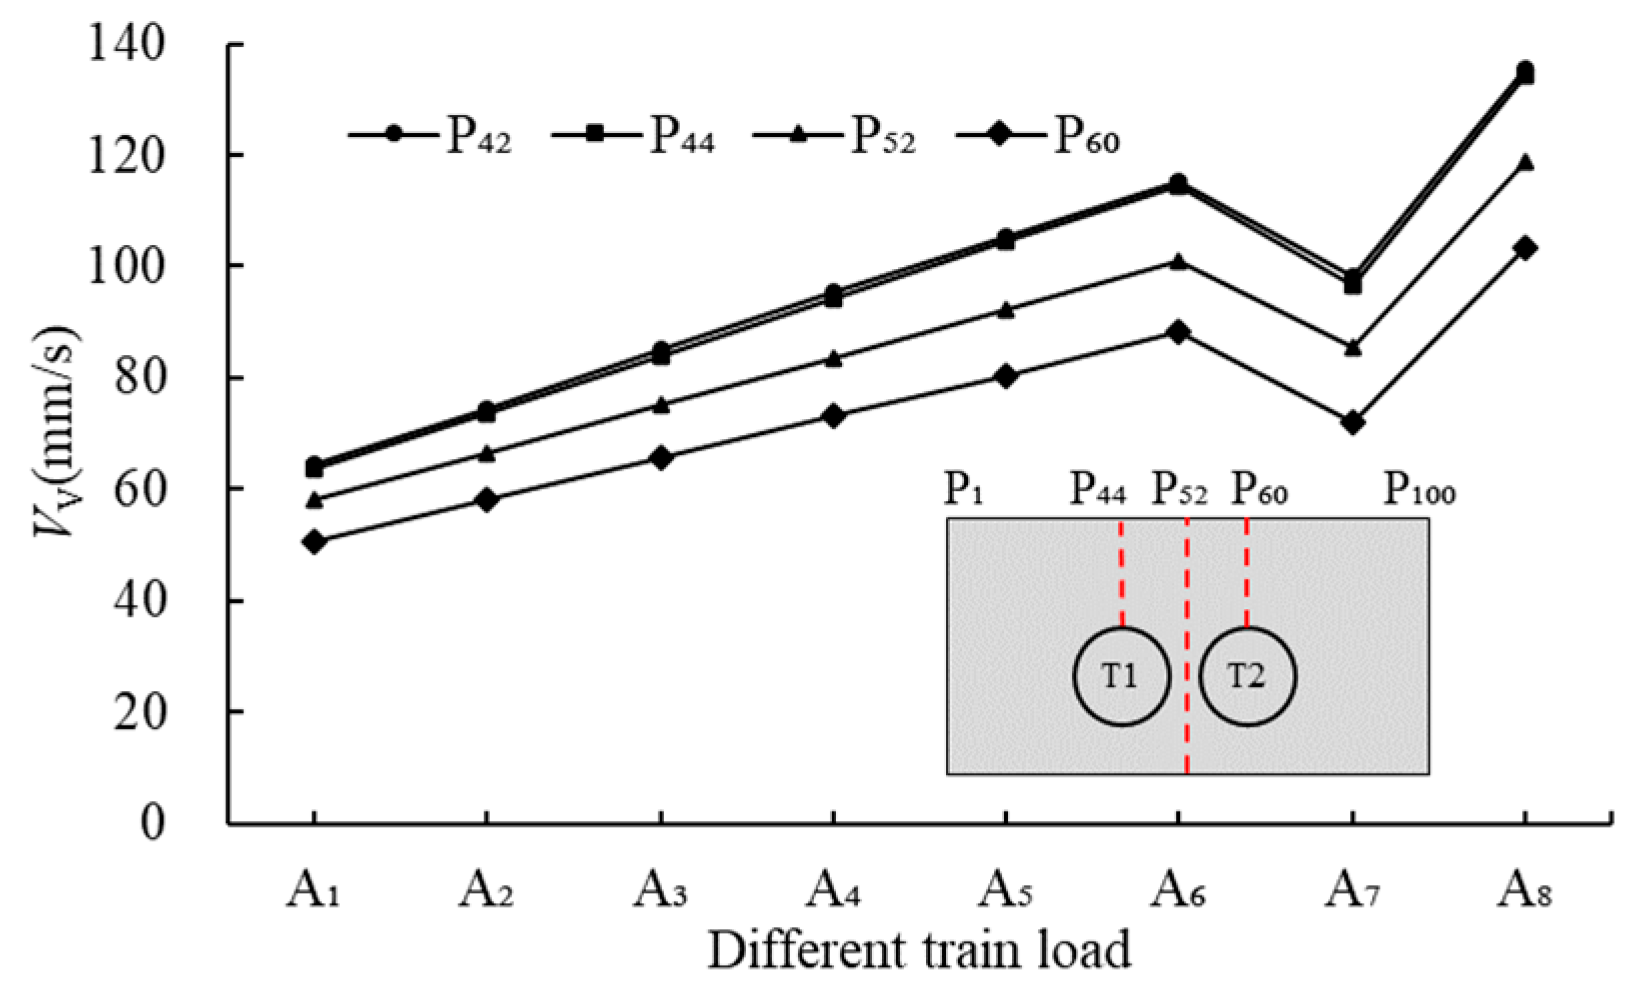
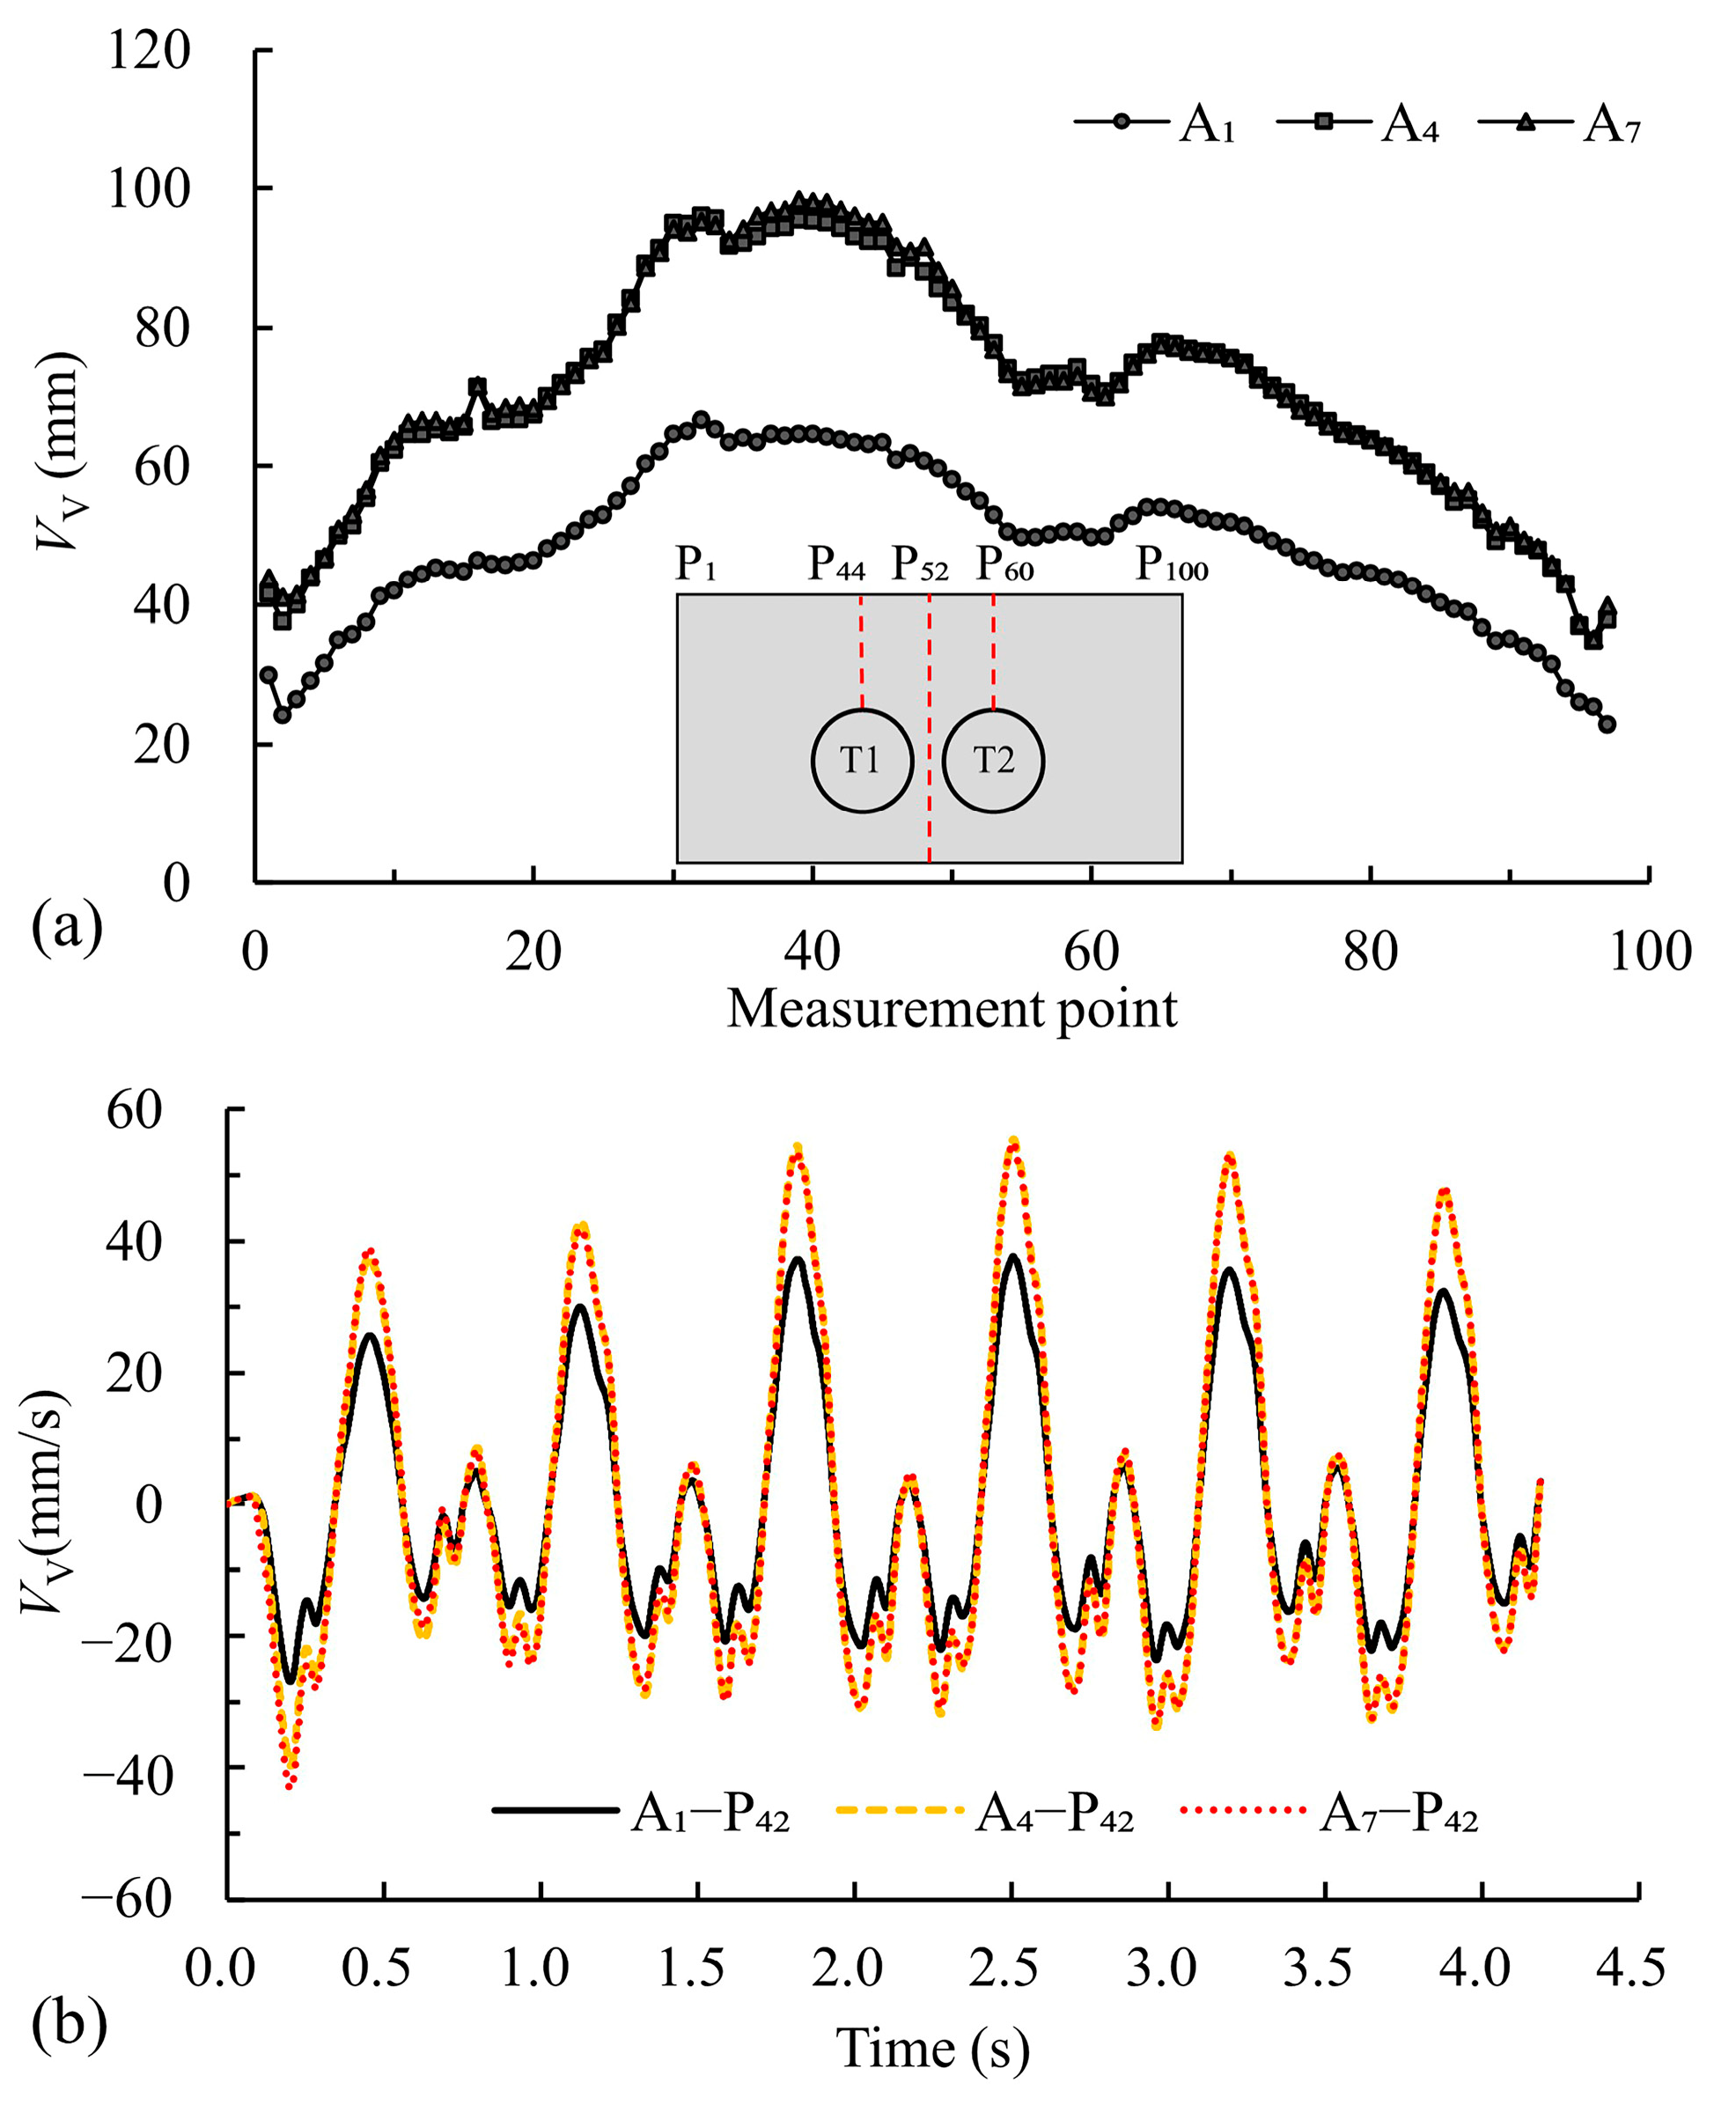
4.2.1. Surface
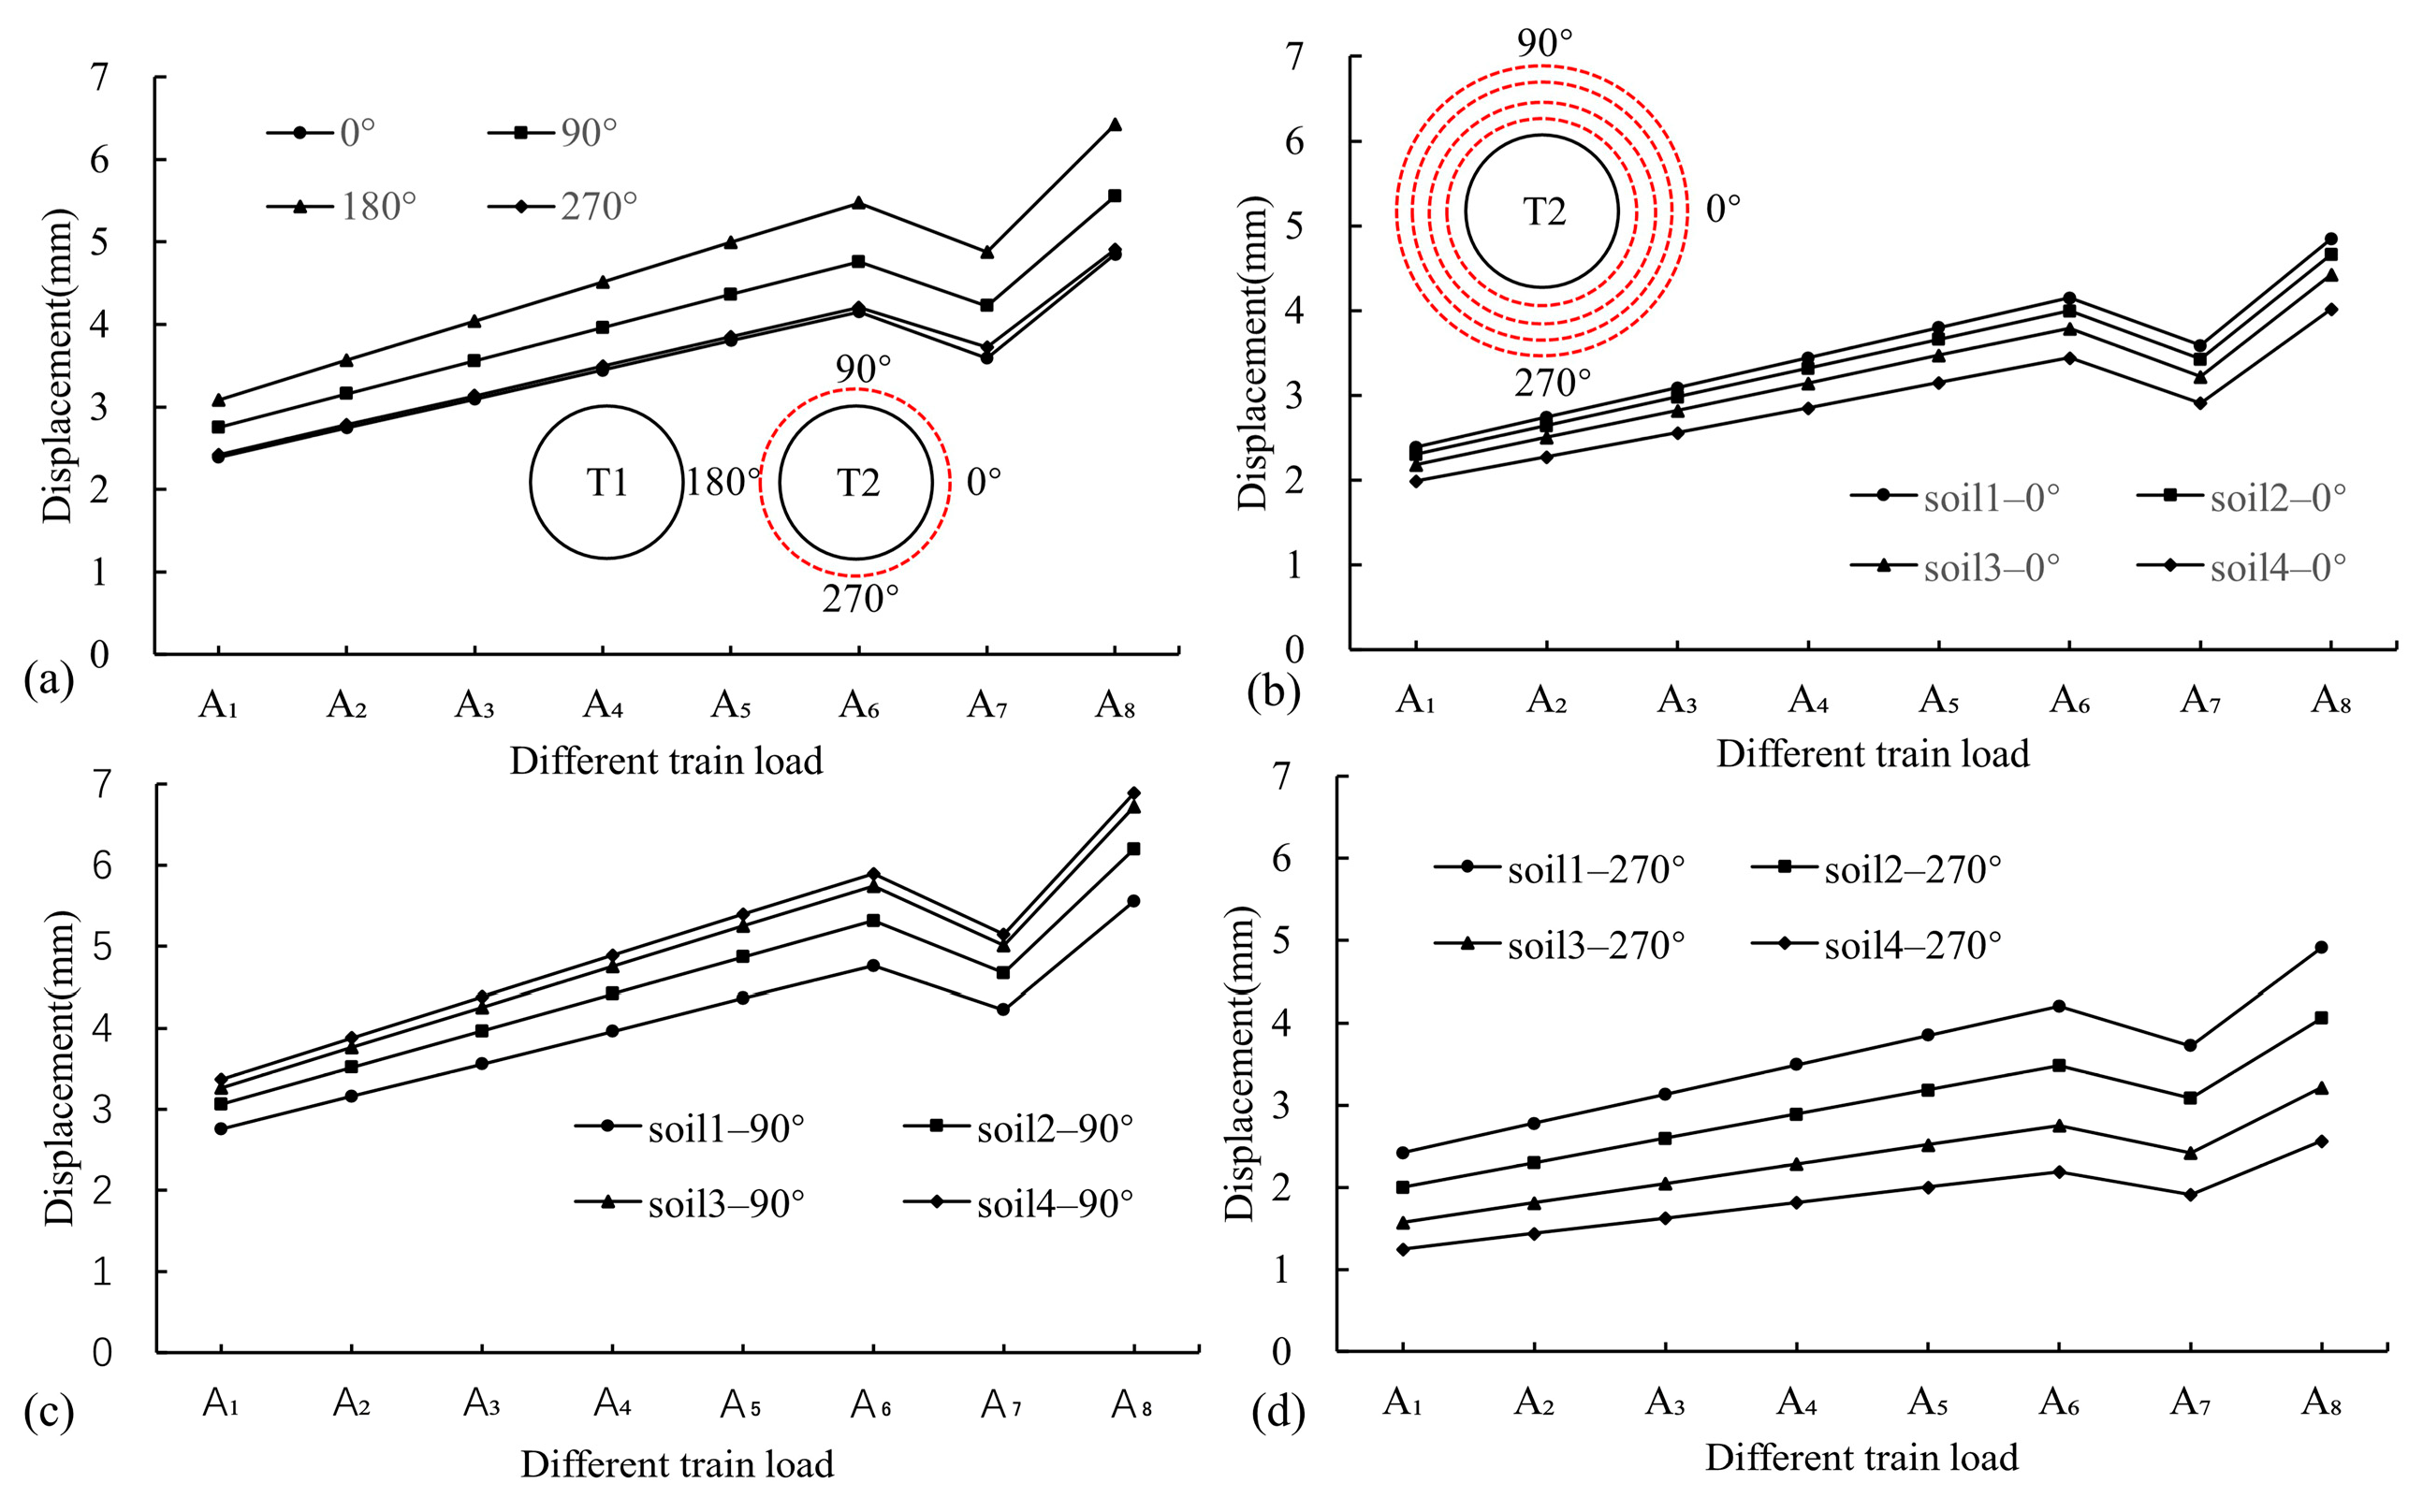
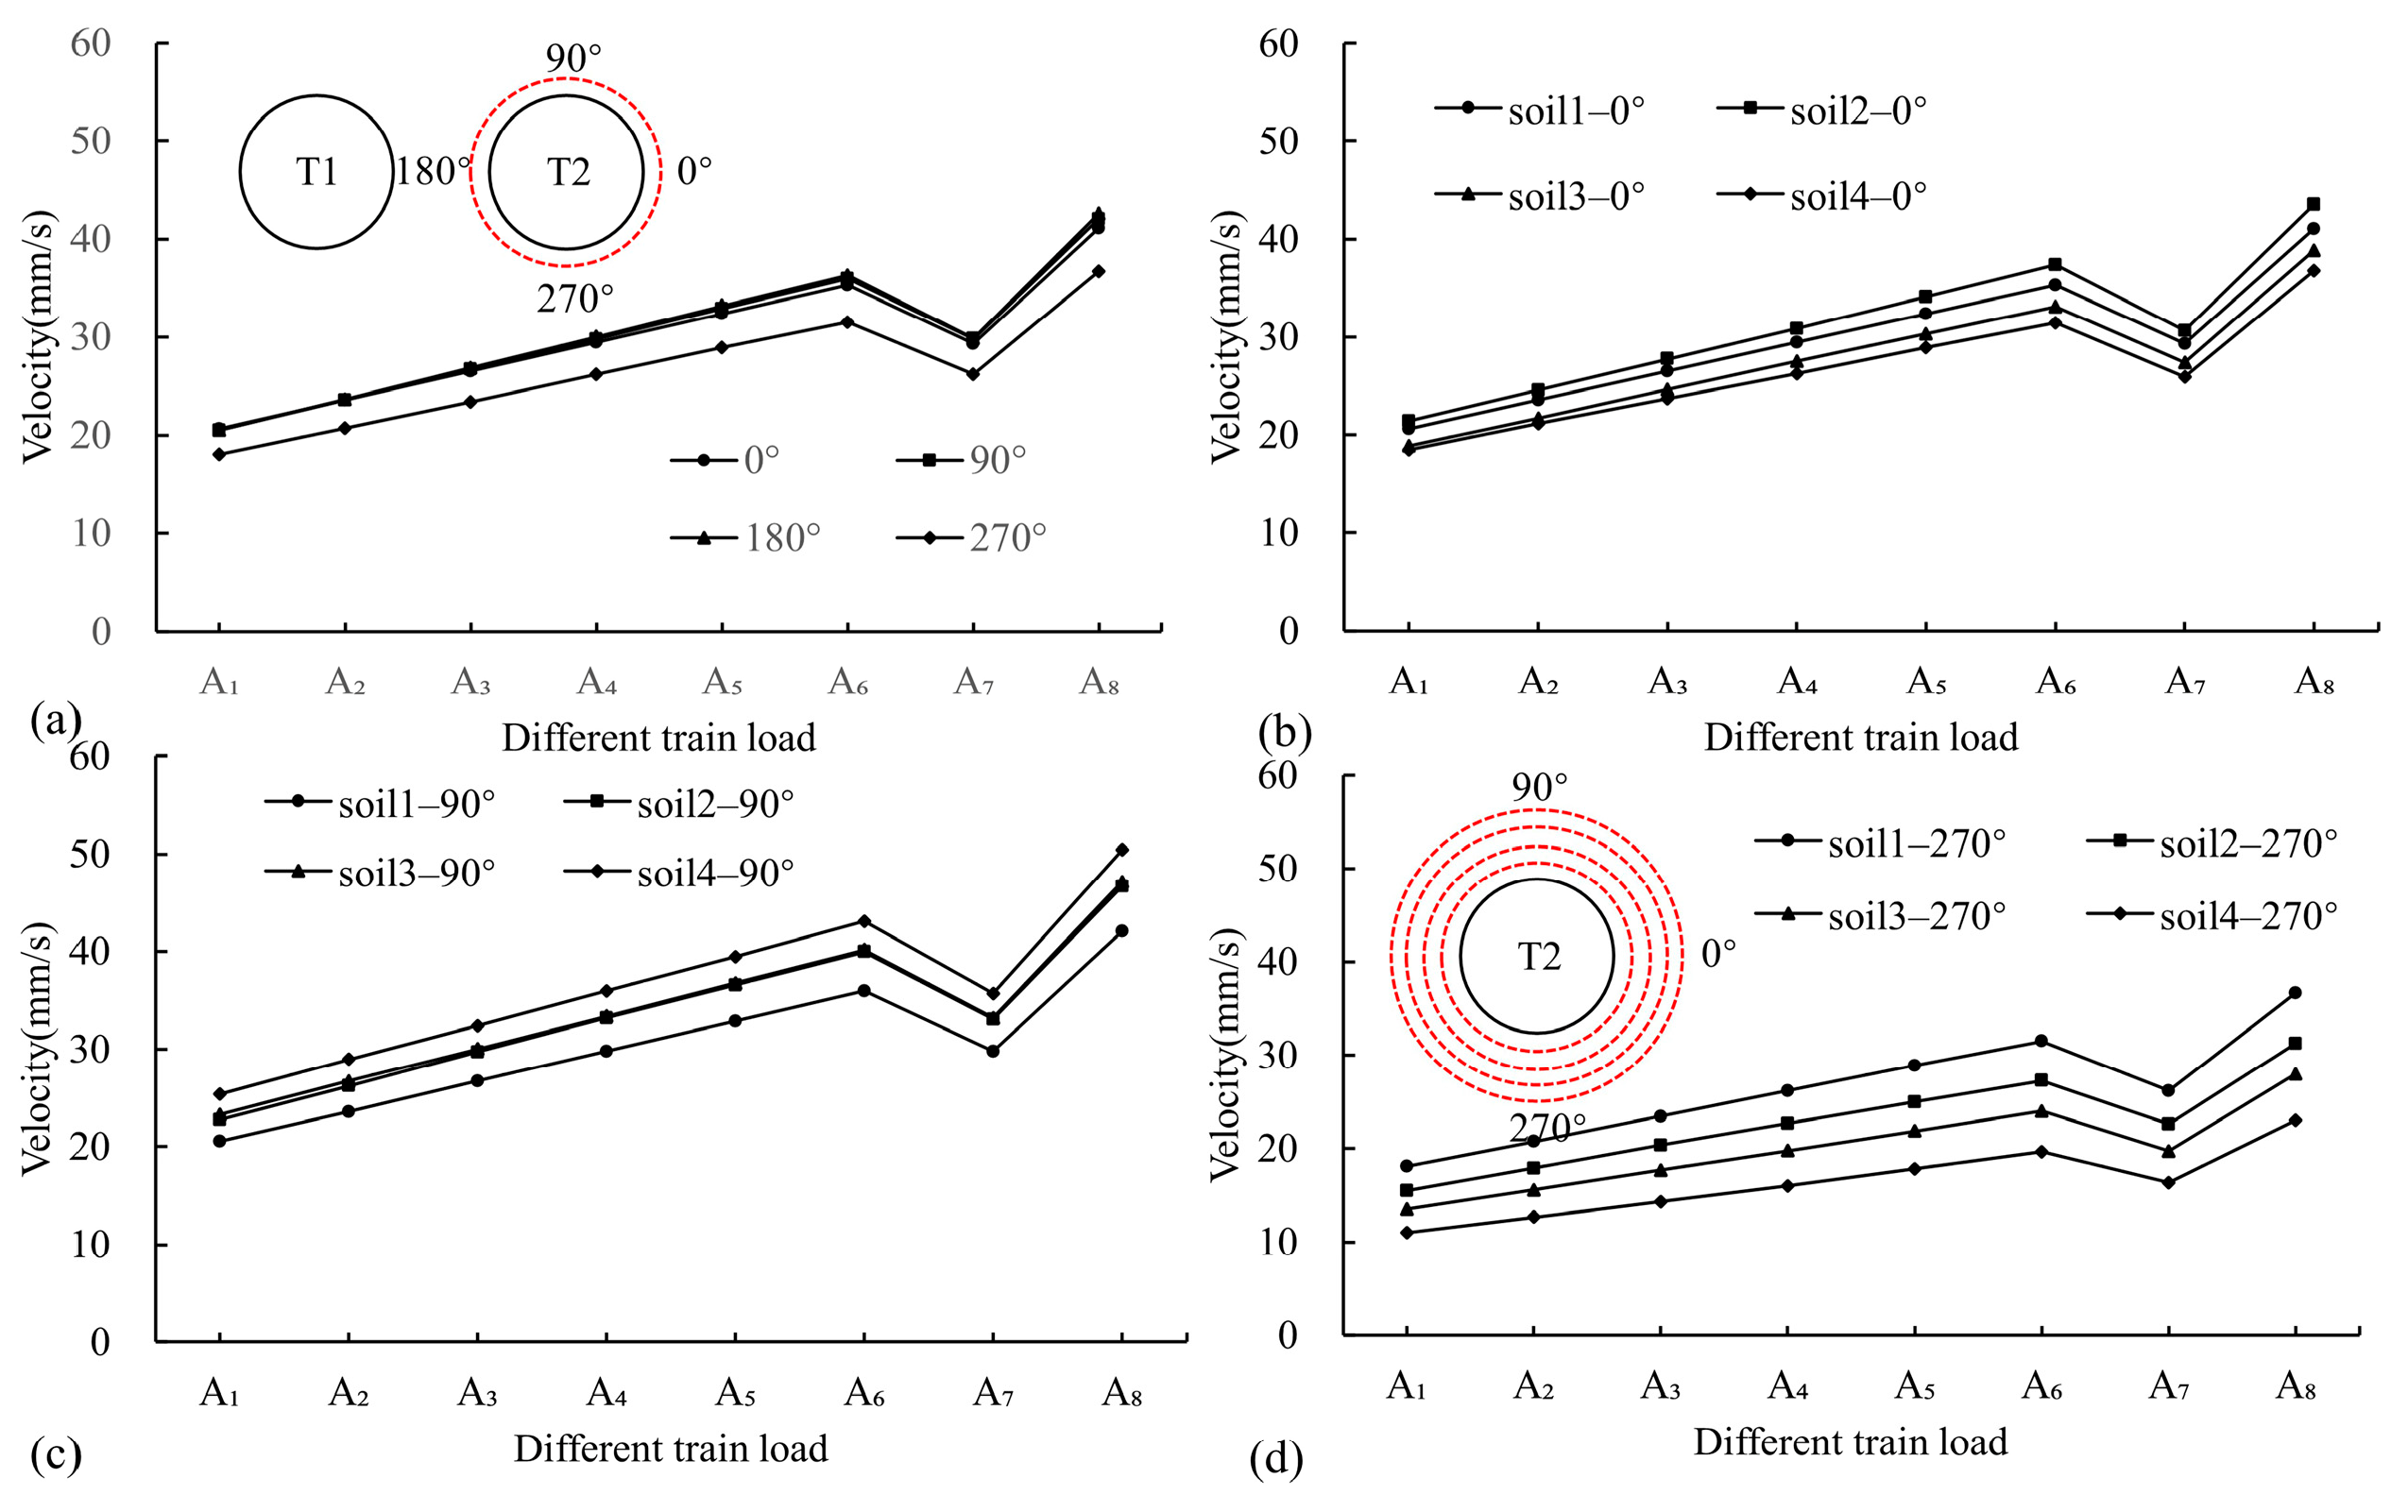
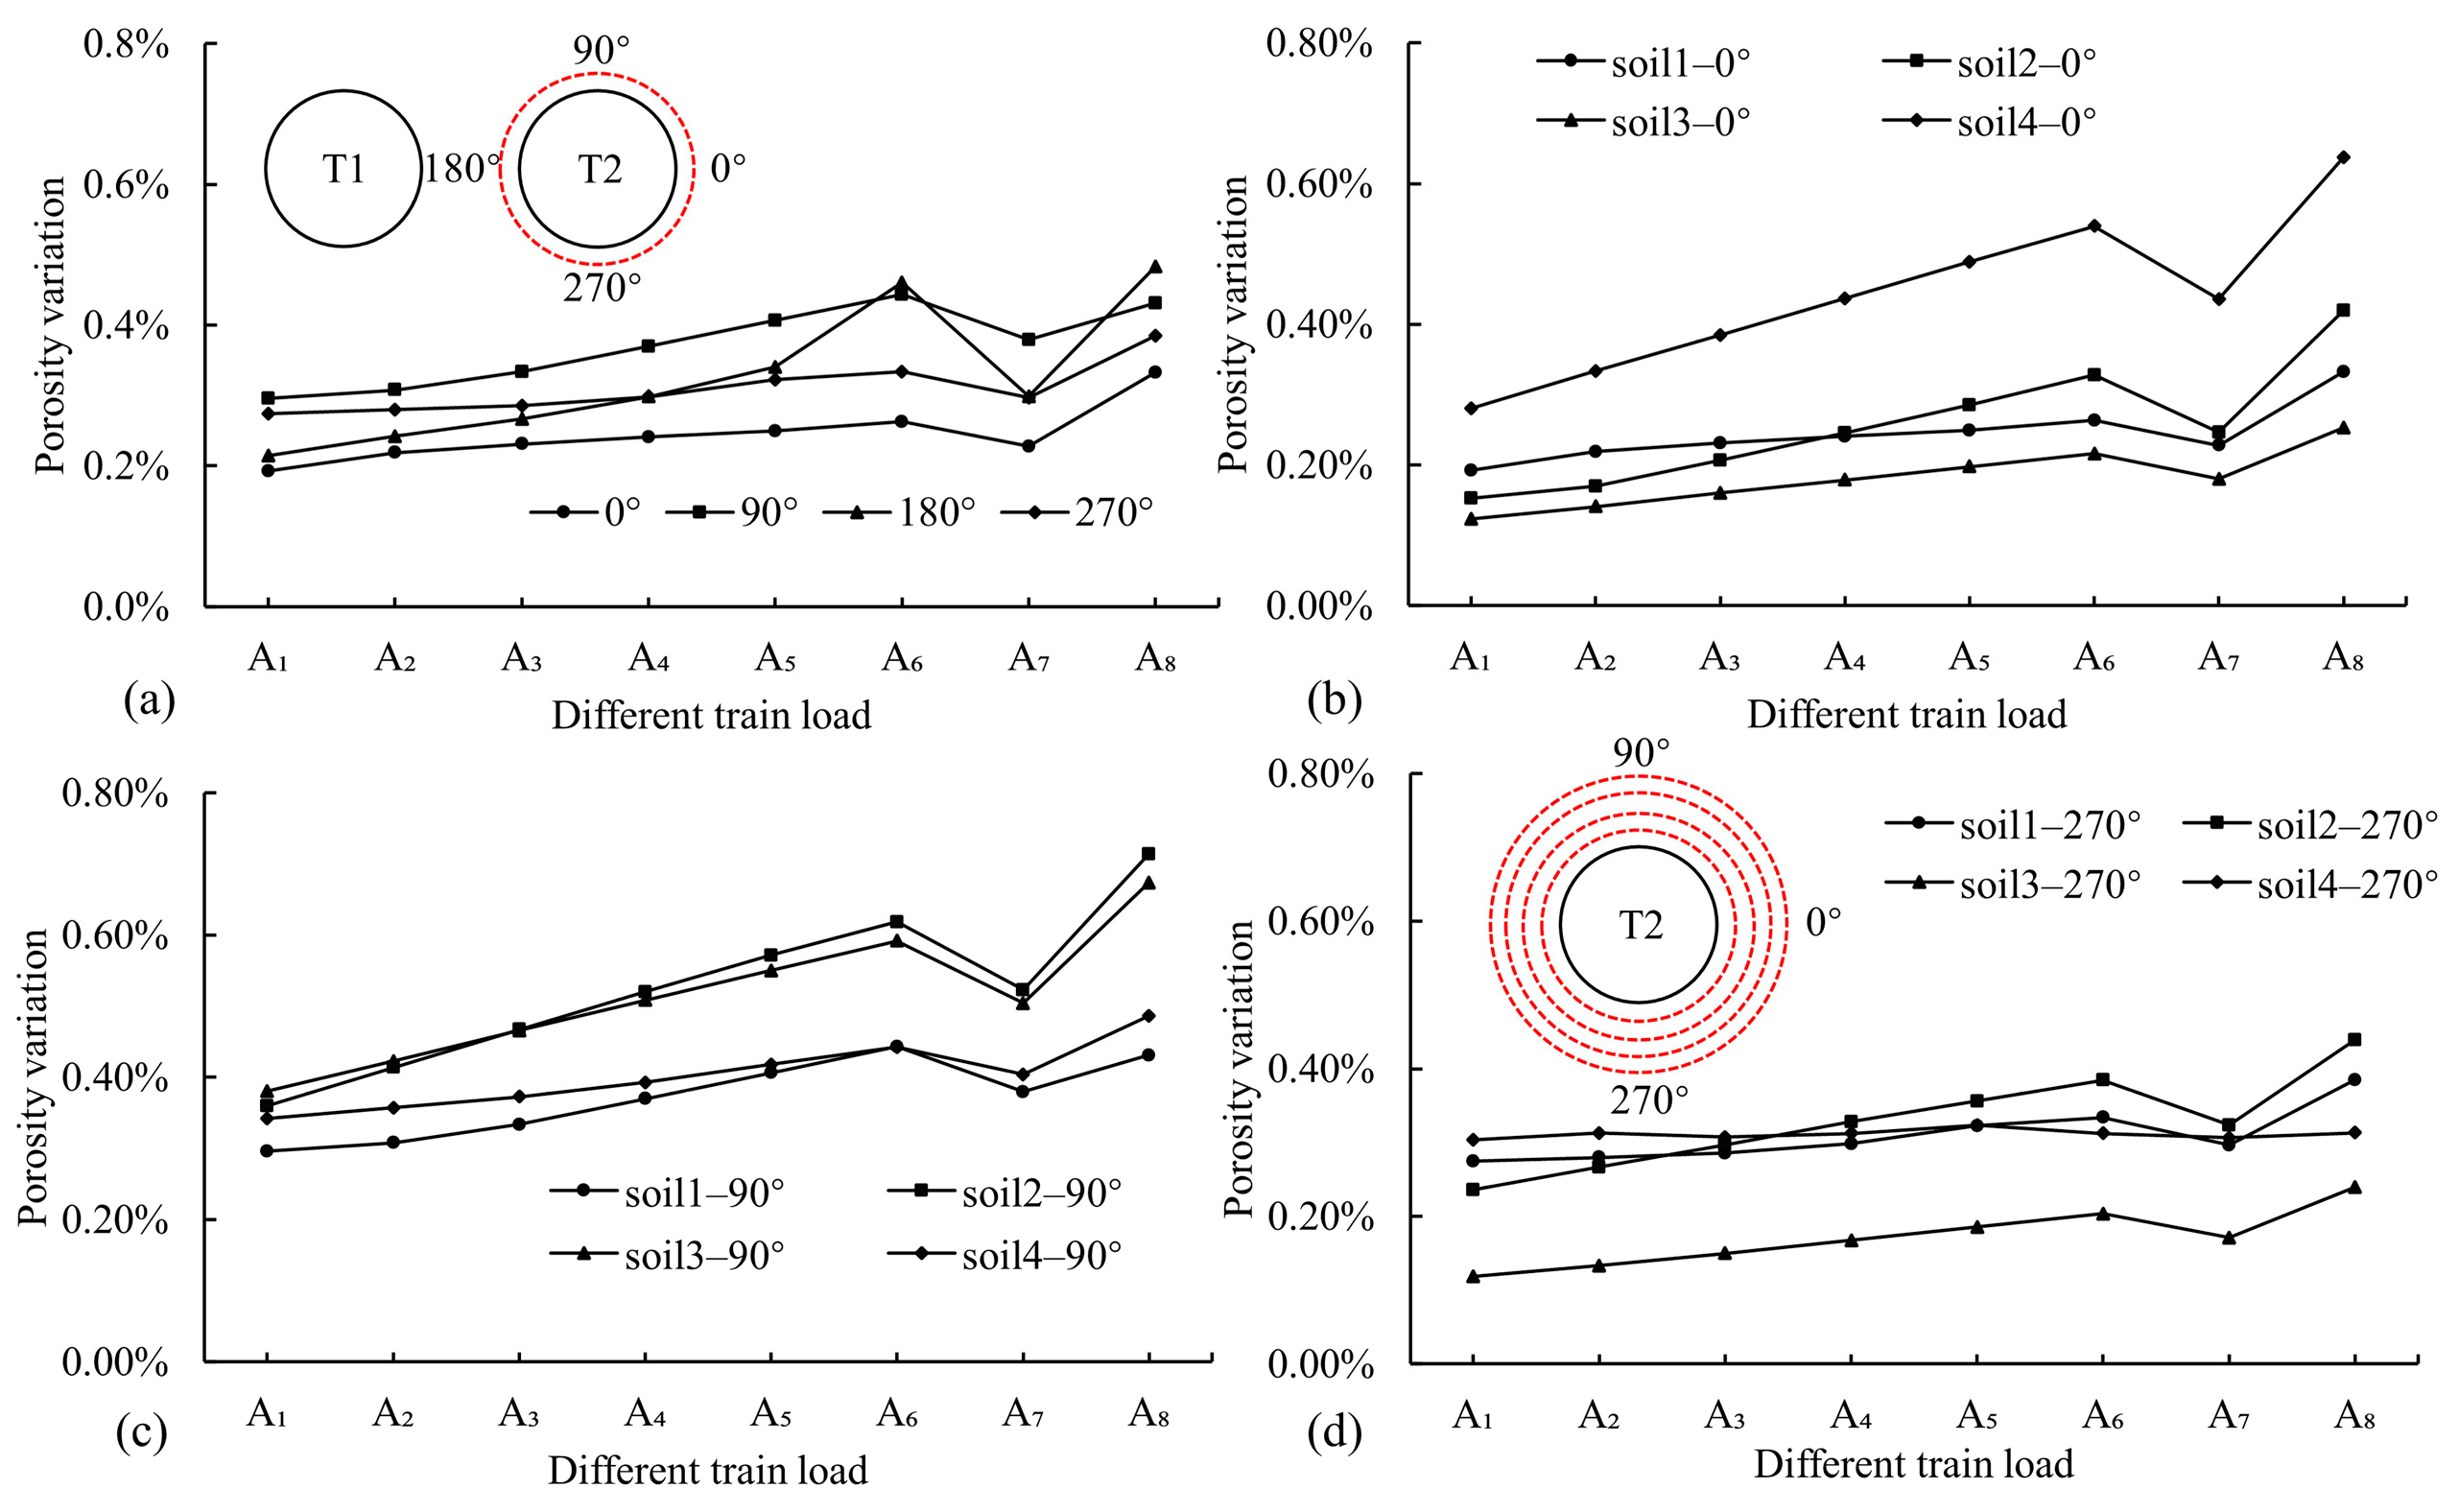
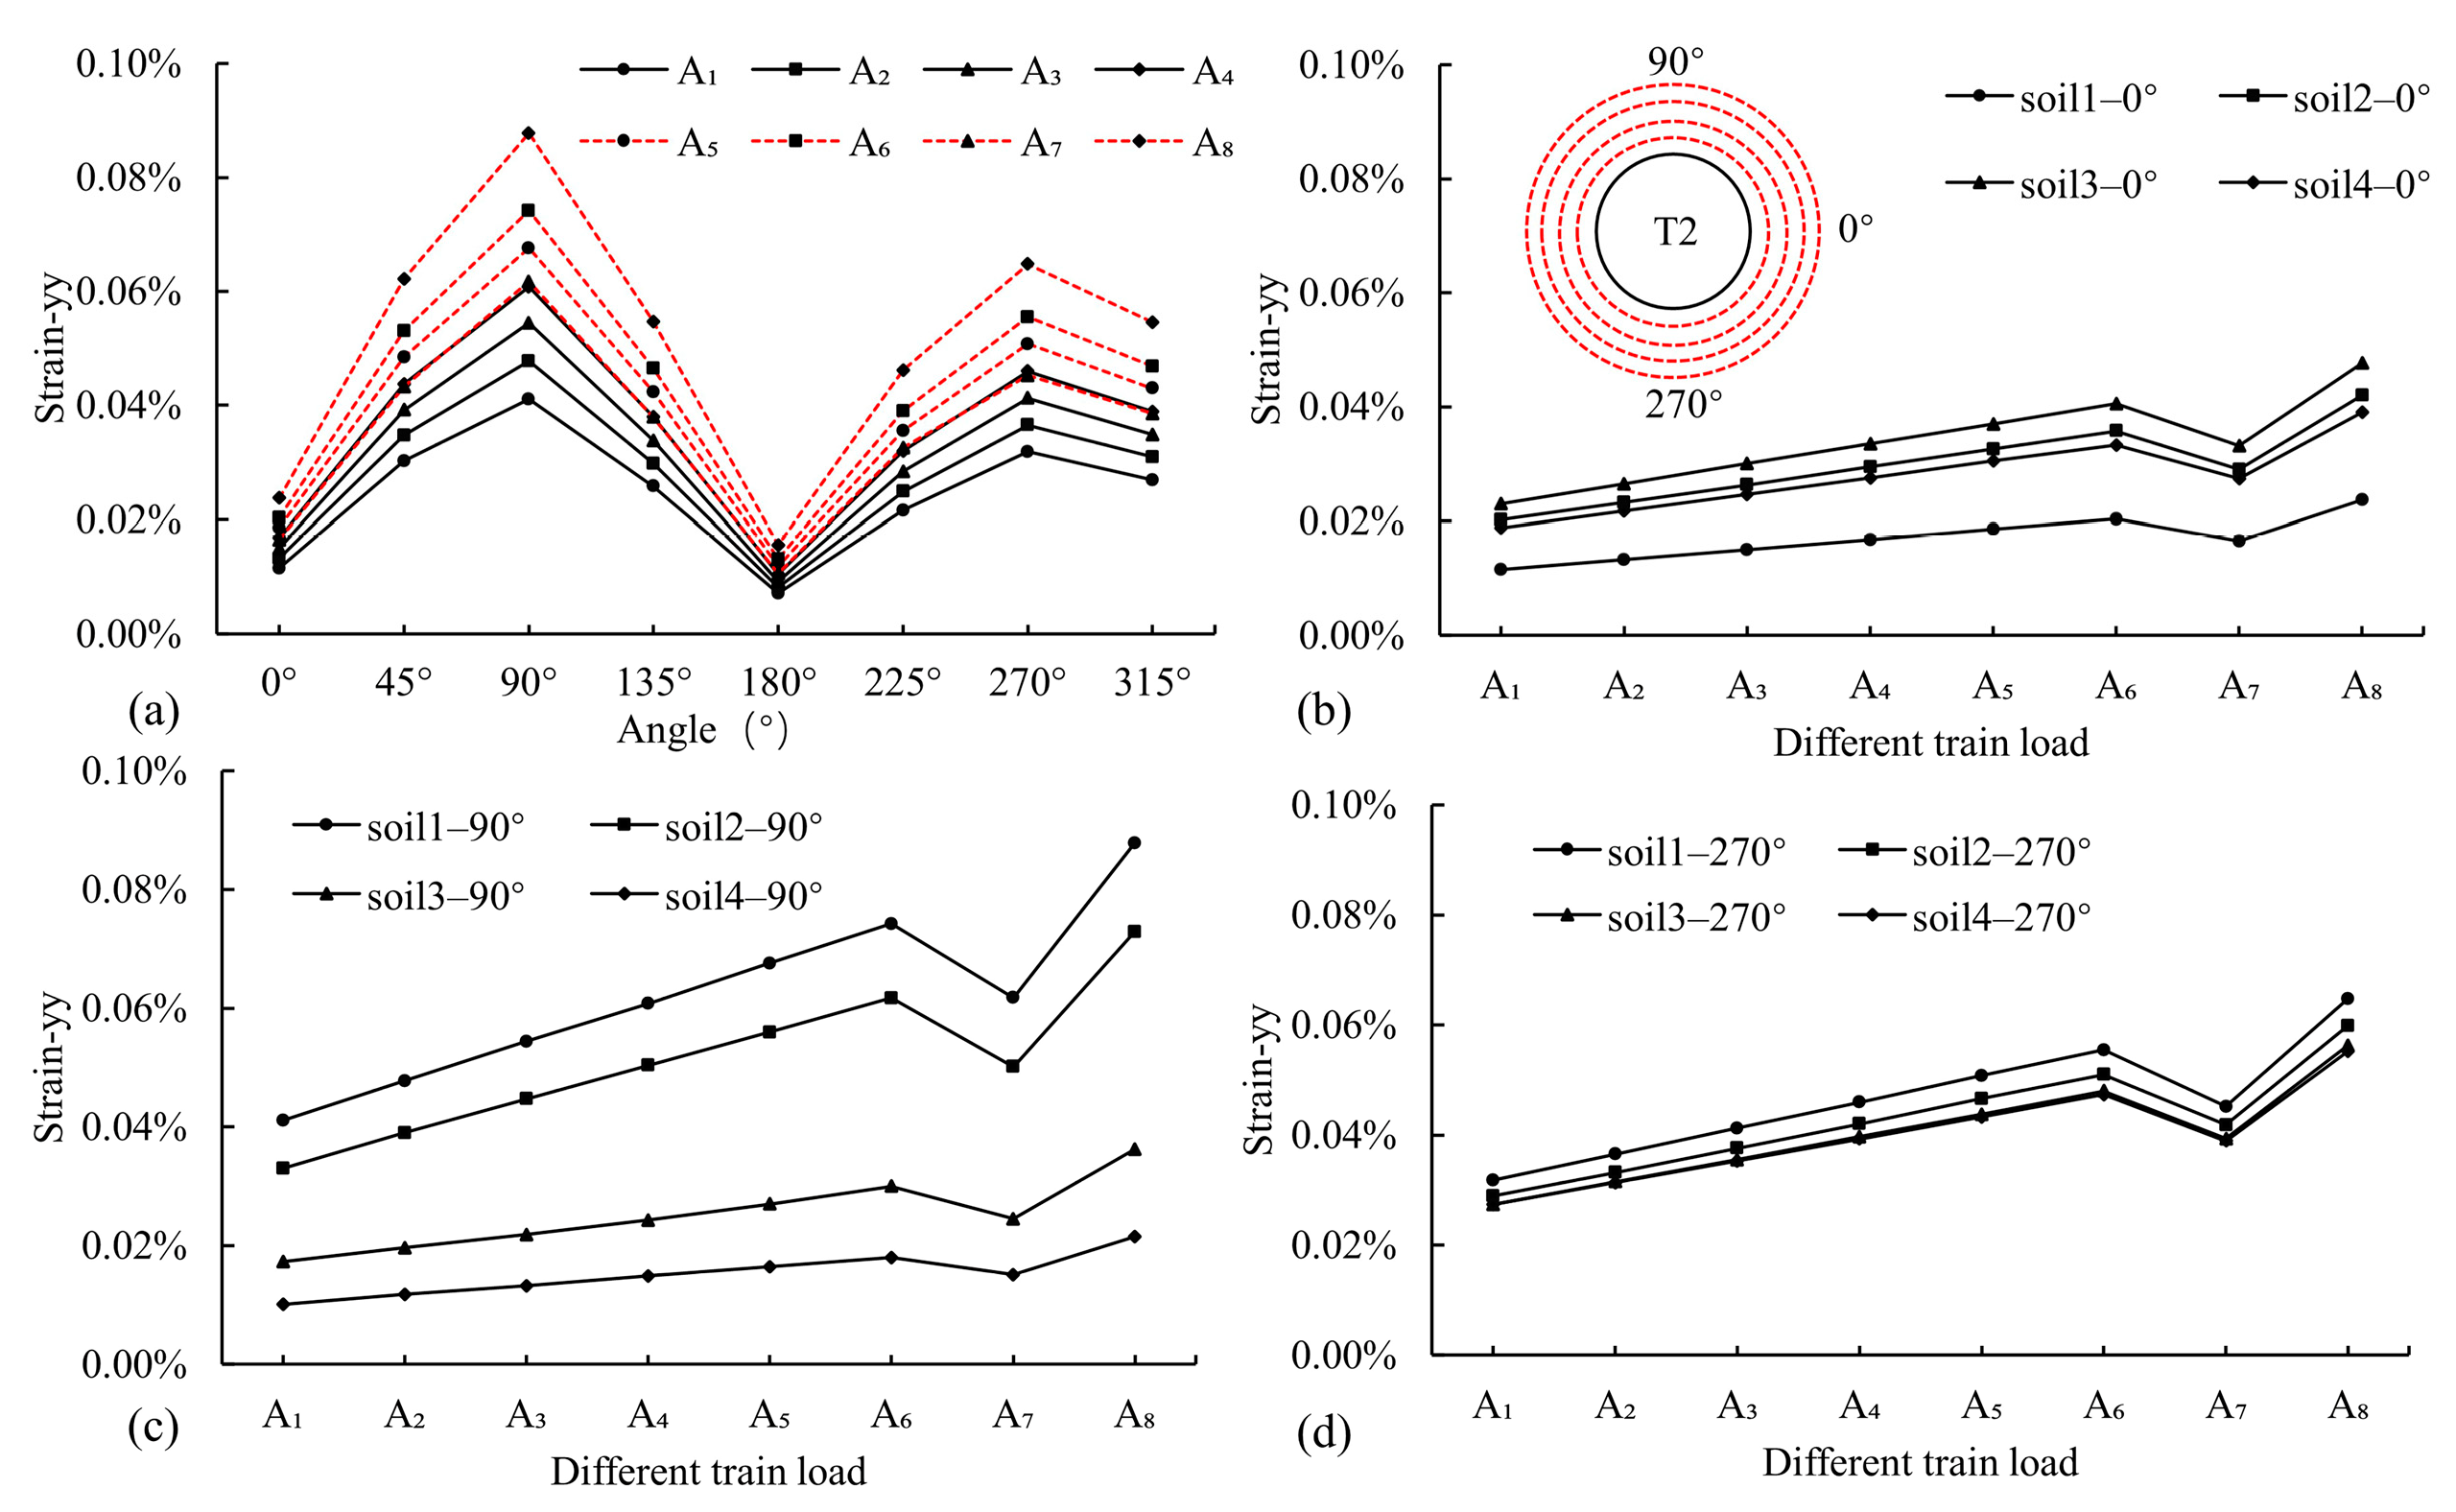
4.2.2. Surroundings
5. Conclusions
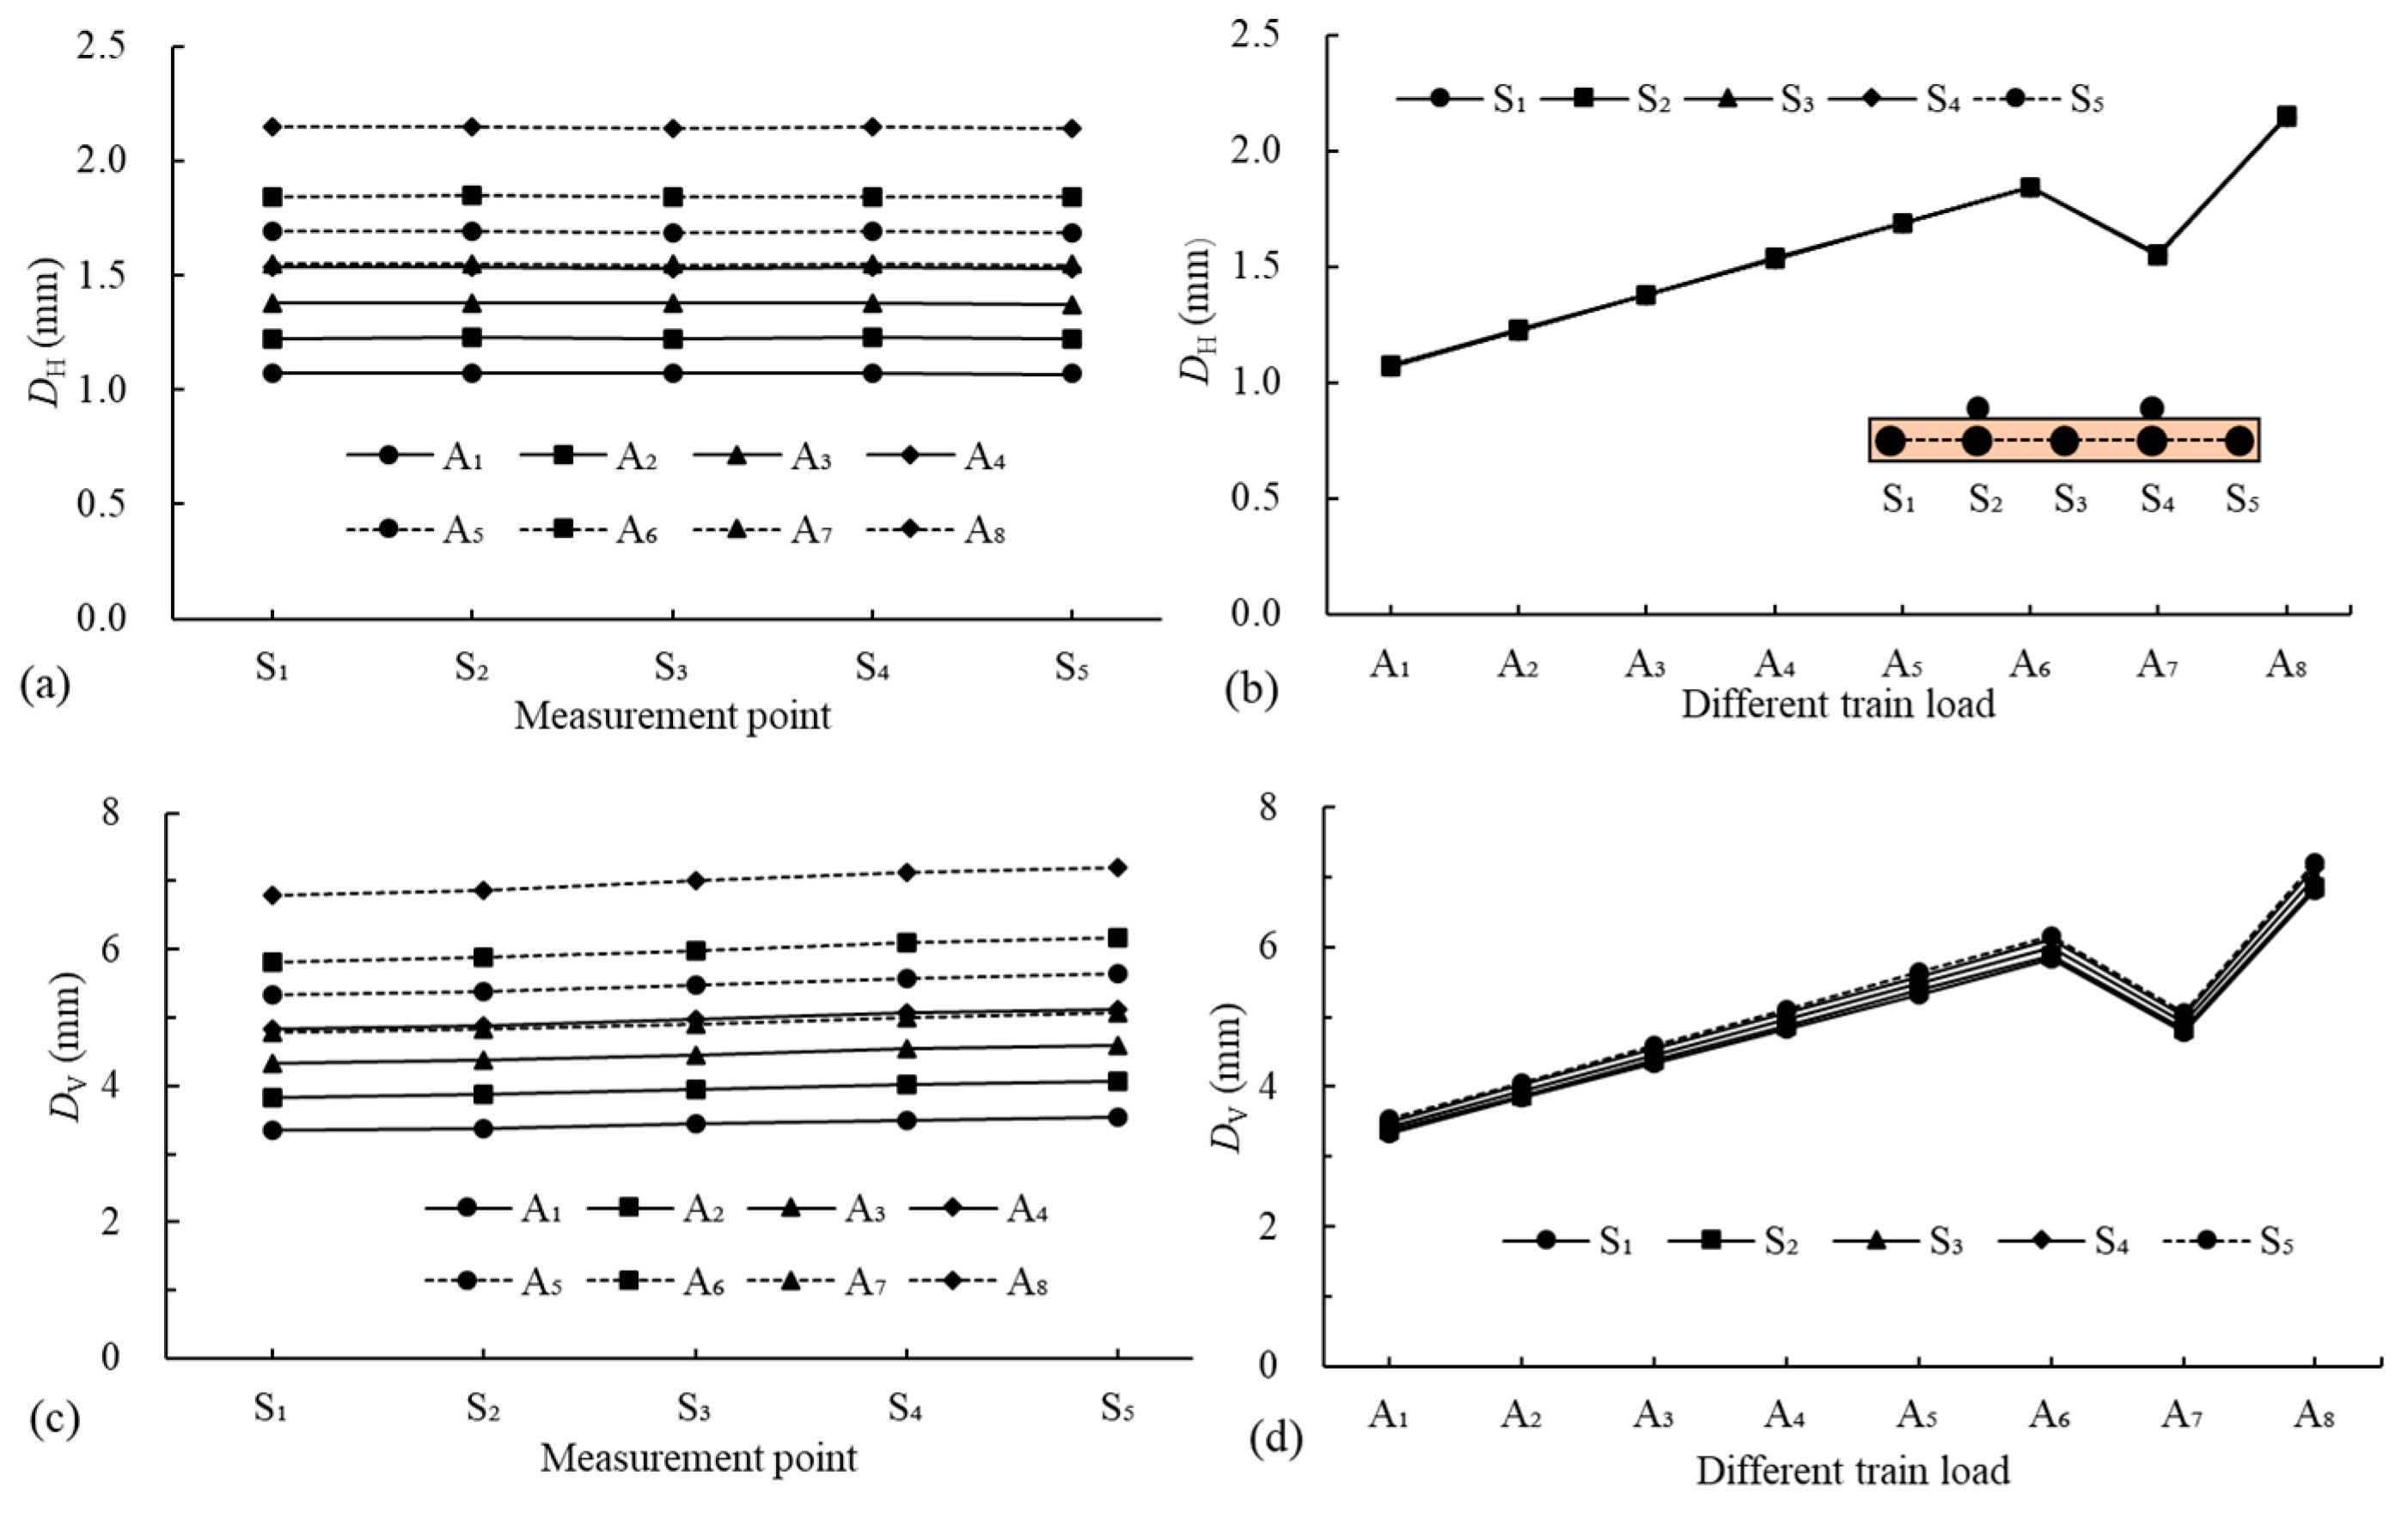
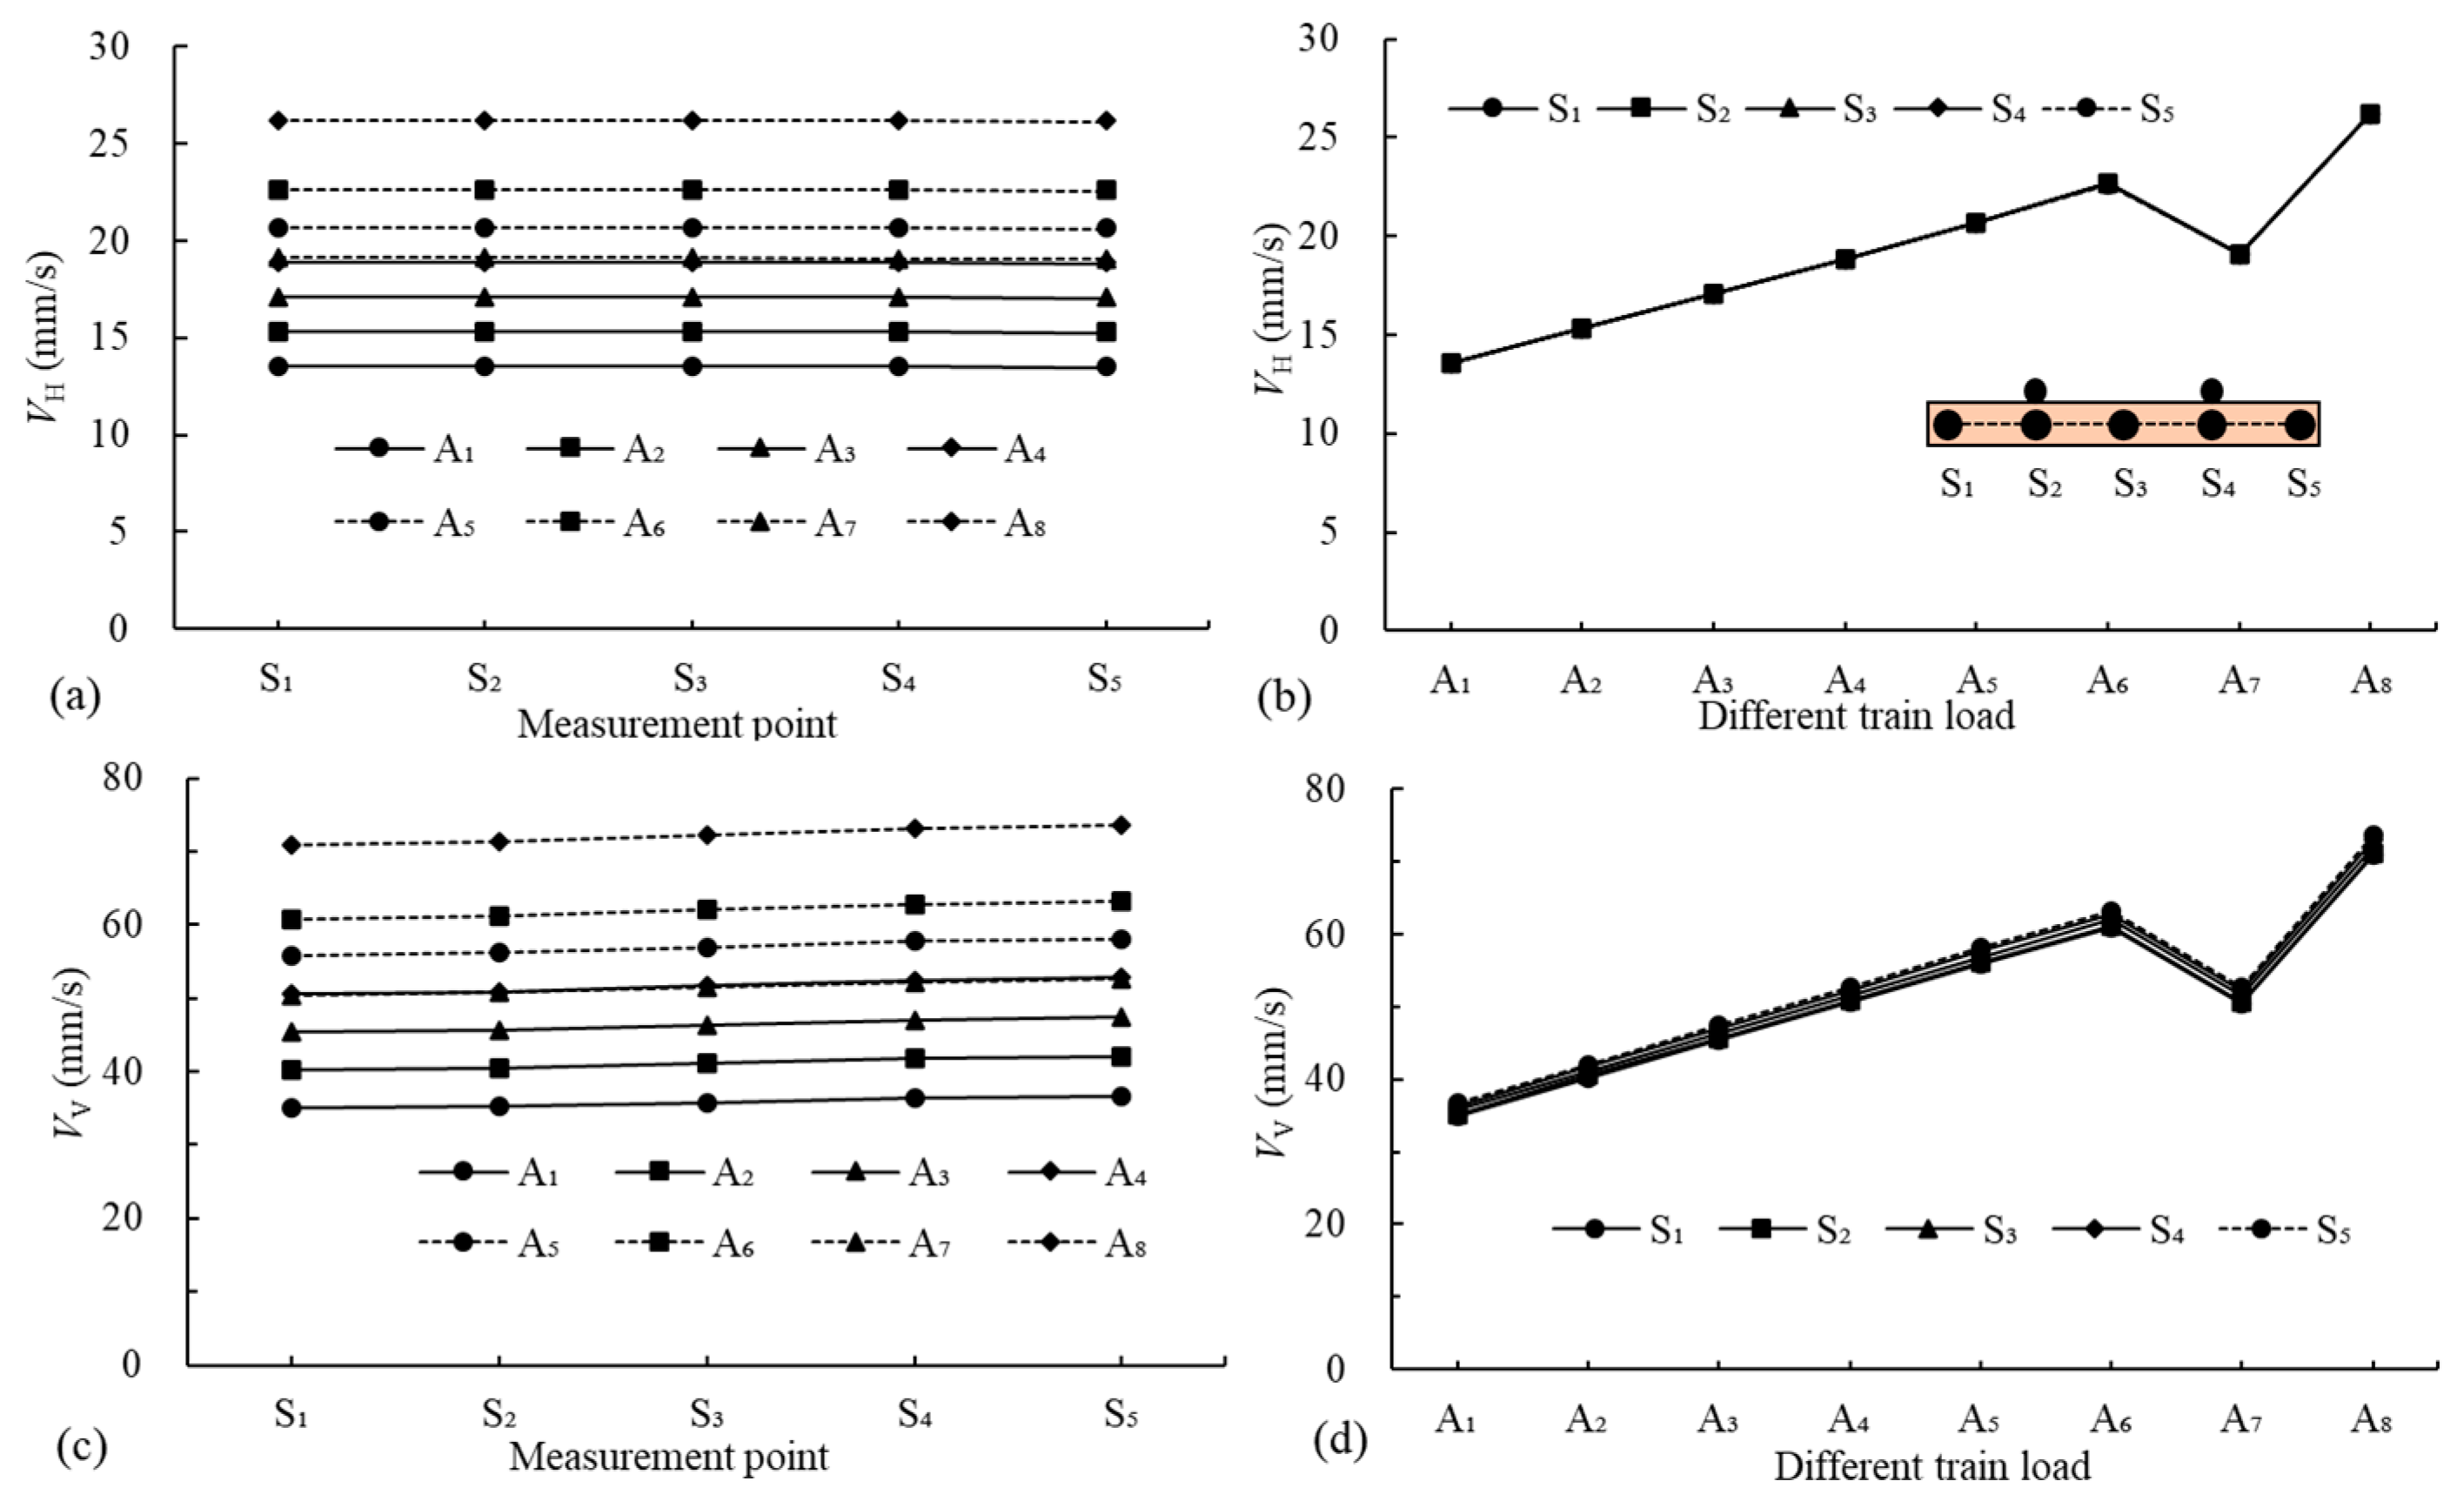
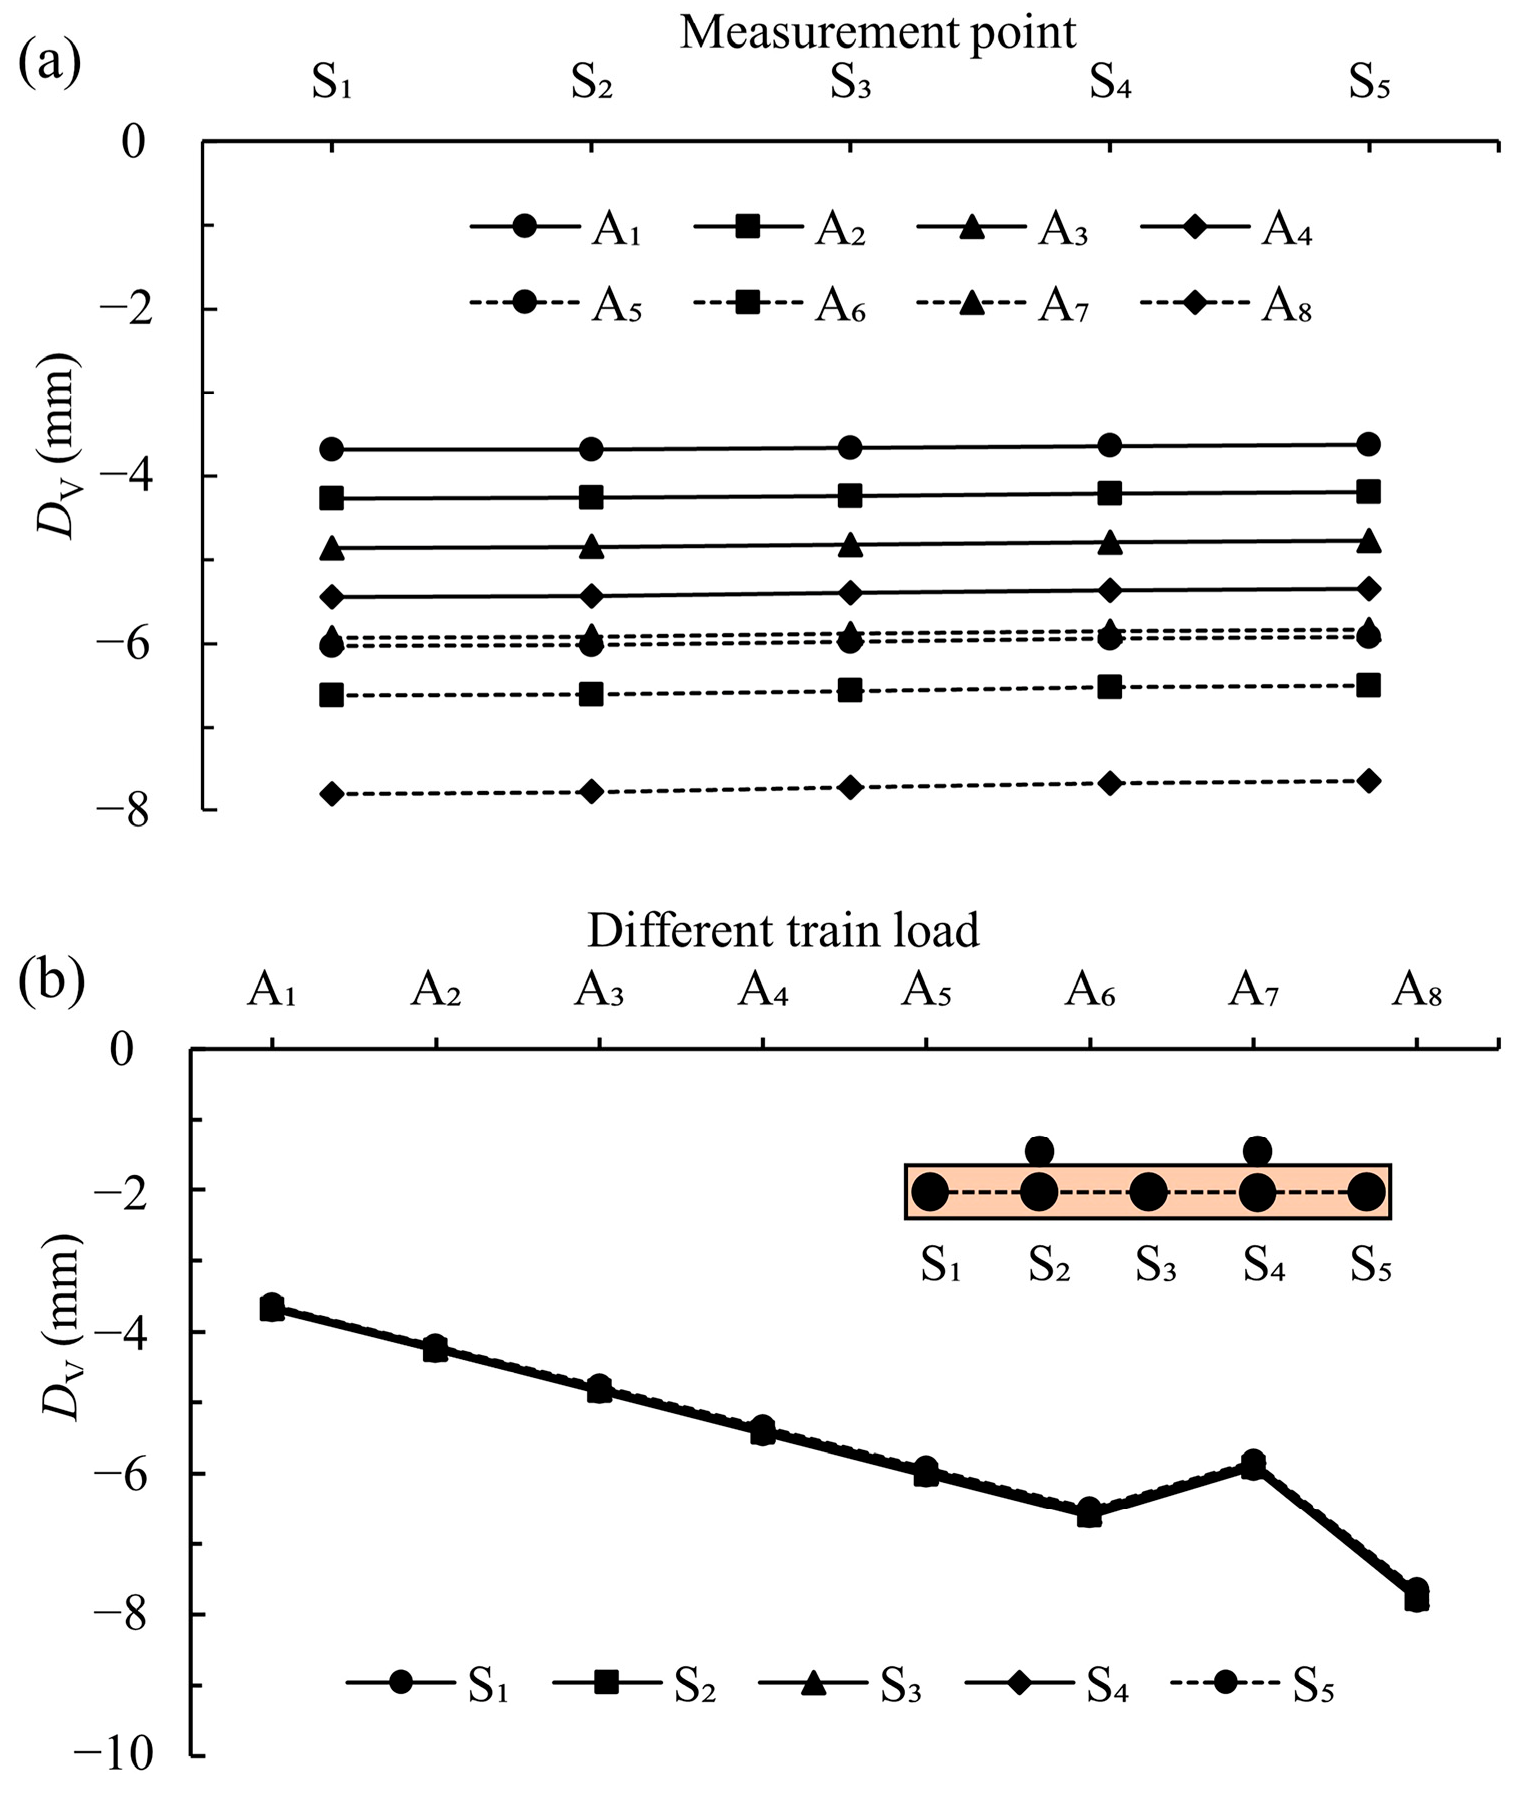
- The DV of T2 sleepers is approximately three times the DH, while the VV is roughly twice the VH, highlighting the predominance of vertical responses over horizontal ones as a critical focus. The reinforcement characteristics inherent in the twin-tunnel structure enhance the stability of the intermediate region between the tunnels, resulting in relatively small responses in the T2 sleeper region closer to the vibration source. Overloading of trains may cause uneven displacements in T2 liners, potentially leading to microcracks or even structural failure.
- The maximum DV and VV points on the surface are located slightly to the left above T1, surpassing those of the tunnel sleepers under the same conditions. The dynamic response of the surroundings under train loads is significantly influenced by the burial depth and tunnel structure, causing uneven compressive forces in the lower-right and upper-left regions of the T2 surroundings. Consequently, it causes elliptical deformation and potential liner–rock separation. When the train vibration load exceeds 92.0 kN (A4), the RP above the tunnel becomes significantly pronounced, emphasizing the significant impact of overload on the tunnel’s surroundings, particularly near the surface.
- The train vibration load in T1 significantly amplifies both the static and dynamic responses of T2 and its surroundings. However, a sudden decrease is observed under the A7 condition. This reduction can be attributed to the dynamic amplification effect dominating the pressure effect under A1 to A6 conditions, leading to a progressive increase in the dynamic response of T2. Under the A7 condition, the pressure effect surpasses dynamic amplification, leading to a sharp decline in T2’s dynamic characteristics. When the load reaches the A8 condition, the dynamic amplification effect far exceeds the pressure effect, resulting in a dramatic increase in T2’s dynamic response.
- In practical engineering applications, it is crucial to monitor the static and dynamic responses of overloaded trains on adjacent tunnel structures, with particular emphasis on the static and dynamic responses of the liners and surrounding areas on the T2 side proximate to T1. During construction, critical zones within the T2 structure must be closely monitored when T1 experiences train overloading to ensure the safety and integrity of the tunnel throughout its operational life. It is recommended that the operational load of the tunnel be maintained within the threshold of the A4 condition (92.0 kN) to mitigate potential risks.
Author Contributions
Funding
Institutional Review Board Statement
Informed Consent Statement
Data Availability Statement
Conflicts of Interest
Nomenclature
| D | Diameter of the twin tunnels (D = 6.2 m) |
| T1 | First tunnel |
| T2 | Second tunnel |
| DH | Horizontal displacement |
| DV | Vertical displacement |
| DR | Resultant displacement |
| VH | Horizontal velocity |
| VV | Vertical velocity |
| VR | Resultant velocity |
| RP | The rate of porosity variation |
References
- Li, Z.; Li, Z.; Huang, W.; Zhang, H.; Zhang, H. Fatigue Damage Analysis of Ballastless Slab Track in Heavy-haul Railway Tunnels. Undergr. Space 2022, 7, 440–452. [Google Scholar] [CrossRef]
- Holmes, H.; Paraskevopoulou, C.; Hildyard, M.; Neaupane, K.; Connolly, D.P. Jointed Rock Masses as Metamaterials—Implications for Railway Tunnel Vibrations. Transp. Geotech. 2023, 41, 101033. [Google Scholar] [CrossRef]
- Liu, C.; Tang, Q.; Wu, B.; Wan, Q.; Ye, Y. Dynamic Response of a Heavy-Haul Railway Tunnel’s Bottom Structures in Hard Rock. Appl. Sci. 2022, 12, 5721. [Google Scholar] [CrossRef]
- Sekiya, H.; Masuda, K.; Nagakura, S.; Inuzuka, S. Determination of Shield Tunnel Deformation under Train Load Using MEMS Accelerometers. Tunn. Undergr. Space Technol. Inc. Trenchless Technol. Res. 2022, 126, 104535. [Google Scholar] [CrossRef]
- Faizan, A.A.; Kırtel, O.; Çelebi, E.; Zülfikar, A.C.; Goktepe, F. Experimental Validation of a Simplified Numerical Model to Predict train-induced Ground Vibrations. Comput. Geotech. 2022, 141, 104547. [Google Scholar] [CrossRef]
- Yuan, Z.; Boström, A.; Cai, Y.; Cao, Z. Analytical Solution for Calculating Vibrations from Twin circular Tunnels. Soil Dyn. Earthq. Eng. 2019, 117, 312–327. [Google Scholar] [CrossRef]
- Zhou, S.; He, C.; Guo, P.; Di, H.; Zhang, X. Modeling of Vehicle-Track-Tunnel-Soil System Considering the Dynamic Interaction between Twin Tunnels in a Poroelastic Half-Space. Int. J. Geomech. 2020, 20, 04019144. [Google Scholar] [CrossRef]
- Deng, Z.; Zhou, L.; Zhu, Z.; Ma, L.; Chen, J.; Dai, F.; Peng, T. Study of the Fracture Properties of Twin Tunnel Surrounds Subjected to the Coupling of Dynamic and Static Loads. Theor. Appl. Fract. Mech. 2024, 130, 104308. [Google Scholar] [CrossRef]
- Li, S.; Chen, Y.; Huang, L.; Guo, E. Study on Response and Influencing Factors of Shield Single/Twin Tunnel under Seismic Loading using FLAC 3D. Shock Vib. 2022, 2022, 2224198. [Google Scholar] [CrossRef]
- Zhao, Y.; Shi, Y.; Yang, J. Study of the Influence of Train Vibration Loading on Adjacent Damaged Tunnel. Shock Vib. 2019, 2019, 3417598. [Google Scholar] [CrossRef]
- Zhou, Y.; Yang, W.; Yao, C.; Xu, Z. Centrifuge Modelling of the Dynamic Response of Twin Tunnels under Train-Induced Vibration Load. Soil Dyn. Earthq. Eng. 2024, 185, 108908. [Google Scholar] [CrossRef]
- Hu, Y.; Tang, H.; Xu, Y.; Lei, H.; Lu, J. Effect of Moving Train Load on Ground Movement and Tunnel Deformation due to Stacked Shield Tunnelling. Soil Dyn. Earthq. Eng. 2024, 187, 108992. [Google Scholar] [CrossRef]
- Lei, H.; Liu, Y.; Zhang, Y.; Hu, Y. Ground Deformation Behaviour Induced by Overlapped Shield Tunnelling Considering Vibration Loads of Subway Train in Sand. Acta Geotech. 2022, 18, 519–533. [Google Scholar] [CrossRef]
- Heidary, R.; Esmaeili, M.; Gharouni Nik, M. Effects of Train Operational Parameters on Ground-Borne Vibrations Induced by Twin metro Tunnels. Int. J. Rail Transp. 2021, 9, 144–156. [Google Scholar] [CrossRef]
- He, C.; Zhou, S.; Di, H.; Yang, X. Effect of Dynamic Interaction of Two Neighboring Tunnels on Vibrations from Underground Railways in the Saturated Soil. KSCE J. Civ. Eng. 2019, 23, 4651–4661. [Google Scholar] [CrossRef]
- Zhang, H.; Zhang, G.; Pan, Y.; Hao, Z.; Chen, S.; Cheng, F. Experimental Study on the Mechanical Behavior and Deformation Characteristics of Lining Structure of Super-large Section Tunnels with A Small Clearance. Eng. Fail. Anal. 2022, 136, 106186. [Google Scholar] [CrossRef]
- Wu, L.; Zhang, X.; Kuang, F. Dynamic Characteristics of Adjacent Tunnel and Surroundings Under the Vibration of Trains in the First Tunnel with Different Buried Depths. Arab. J. Sci. Eng. 2021, 46, 5105–5119. [Google Scholar] [CrossRef]
- Zhang, Z.; Zhang, X.; Tang, Y.; Cui, Y. Discrete Element Analysis of a Cross-river Tunnel under Random Vibration Levels Induced by Trains Operating during the Flood Season. J. Zhejiang Univ.-Sci. A 2018, 19, 346–366. [Google Scholar] [CrossRef]
- Yang, J.; Zhang, J.; Wu, G.; Zhang, H.; Ni, P. Analysis of Instability and Failure Mechanisms in A Soil-bag-lope Protection Structures Under Rainfall Infiltration: Field Test and DEM Simulation. Constr. Build. Mater. 2025, 477, 141337. [Google Scholar] [CrossRef]
- Zhang, Q.; Yu, S.; Yu, J.; Li, Y.; Zhu, Z. Investigations on the Failure Processes of Tunnel Models Containing Weak Layers Based on A Novel Tunnel-layer 3D Printing Technology and DEM. Theor. Appl. Fract. Mech. 2025, 138, 104968. [Google Scholar] [CrossRef]
- Yang, Z.; Cai, H.; Dai, M.; Wang, T.; Li, M. Mechanical Behavior and Rock Breaking Mechanism of Shield Hob Based on Particle Flow Code (PFC) Method. Geotech. Geol. Eng. 2022, 41, 353–370. [Google Scholar] [CrossRef]
- Ding, H.; Jiang, X.; Li, K.; Guo, H.; Li, W. Intelligent Classification Method for Tunnel Lining Cracks Based on PFC-BP Neural Network. Math. Probl. Eng. 2022, 2022, 8838216. [Google Scholar] [CrossRef]
- Wu, L.; Zhang, X.; Bian, X.; Liu, G. Effects of Concrete Materials on the Vibration of the Adjacent Tunnel and Surroundings by DEM and Experiment. Constr. Build. Mater. 2022, 335, 127477. [Google Scholar] [CrossRef]
- Wu, L.; Zhang, X.; Wang, W.; Meng, X.; Guo, H. Comparison of Dynamic Characteristics between Small and Super-Large Diameter Cross-River Twin Tunnels under Train Vibration. Appl. Sci. 2021, 11, 7577. [Google Scholar] [CrossRef]
- Yang, W.; Chen, Z.; Xu, Z.; Yan, Q.; He, C.; Wei, K. Dynamic Response of Shield Tunnels and Surrounding Soil Induced by Train Vibration. Rock Soil Mech. 2018, 39, 537–545. [Google Scholar] [CrossRef]
- Yuan, Z.; Boström, A.; Cai, Y.; Pan, X.; Cao, Z.; Shi, L. The Wave Function Method for Calculation of Vibrations from A Twin Tunnel in A Multi-layered Half-space. Soil Dyn. Earthq. Eng. 2019, 125, 105716. [Google Scholar] [CrossRef]
- Zhang, Z.; Zhang, X.; Cui, Y.; Qiu, H. Discrete Element Modeling of A Cross-river Tunnel under Subway Train 0peration during Peak and Off-peak Periods. Arab. J. Geosci. 2019, 12, 102. [Google Scholar] [CrossRef]
- Zhang, Z.; Zhang, X.; Sun, S.; Liang, Z. A Cross-river Tunnel Excavation Considering The Water Pressure Effect Based on DEM. Eur. J. Environ. Civ. Eng. 2019, 25, 2057–2073. [Google Scholar] [CrossRef]
- Yang, W.; Zou, T.; Tu, J.; Gu, X.; Liu, Y.; Yan, Q.; He, C. Analysis of Dynamic Response of horseshoe cross-section tunnel under vibrating load induced by high-speed train. Rock Soil Mech. 2019, 40, 3635–3644. [Google Scholar] [CrossRef]
- Yin, C.; Fu, B.; Ma, W. Analysis on Dynamic Stress of Tunnel Structure under Heavy Haul Train. China Railw. Sci. 2013, 34, 47–52. [Google Scholar]
- Wang, M.; Zhao, Y.; Yu, L.; Li, Z.; Li, Q. Research on Fatigue Damage of Heavy Haul Railway Tunnel Bottom Structure Under 30t Axle Load. J. China Railw. Soc. 2020, 42, 138–146. [Google Scholar]
- Ding, Z.; Zhang, X.; He, S.; Qi, Y.; Lin, C. Experimental and Theoretical Study on Longitudinal Deformation and Internal Force of Shield Tunnel Under Surcharge. Tunn. Undergr. Space Technol. Inc. Trenchless Technol. Res. 2024, 144, 105506. [Google Scholar] [CrossRef]
- Dong, J.; Zhong, S.; Wang, H.; Wu, Z. Dynamic Response Characteristics of Crossing Tunnels under Heavy-Haul Train Loads. Geomech. Eng. 2020, 20, 103–112. [Google Scholar] [CrossRef]


| Parameters | Silty Sand ① | Silty Sand ② | C60 Concrete |
|---|---|---|---|
| Radius of particles (m) | r1 = 0.06–0.1 | r2 = 0.03–0.05 | r3 = 0.009–0.012 |
| Density (kg/m3) | 2000 | 2000 | 2500 |
| Contact Young’s modulus (Pa) | 2.19 × 10⁷ | 2.27 × 10⁷ | 3.65 × 10¹⁰ |
| The ratio of contact normal to shear stiffness | 1.0 | 1.0 | 1.0 |
| Coefficient of friction | 0.63 | 0.63 | 0.84 |
| The normal strength of the parallel bond (Pa) | − | − | 1.0 × 10100 |
| Tangential strength of parallel bond (Pa) | − | − | 1.0 × 10100 |
| Contact Young’s modulus of parallel bond (Pa) | − | − | 3.65 × 10¹⁰ |
| The ratio of parallel bond contact normal to shear stiffness | − | − | 1.0 |
| Parallel bonding radius | − | − | 1.0 |
Disclaimer/Publisher’s Note: The statements, opinions and data contained in all publications are solely those of the individual author(s) and contributor(s) and not of MDPI and/or the editor(s). MDPI and/or the editor(s) disclaim responsibility for any injury to people or property resulting from any ideas, methods, instructions or products referred to in the content. |
© 2025 by the authors. Licensee MDPI, Basel, Switzerland. This article is an open access article distributed under the terms and conditions of the Creative Commons Attribution (CC BY) license (https://creativecommons.org/licenses/by/4.0/).
Share and Cite
Wu, L.; Wang, J.; Bian, X.; Guo, H. Dynamic Response Analysis of Parallel Twin Tunnels Under Different Train Loads. Appl. Sci. 2025, 15, 5565. https://doi.org/10.3390/app15105565
Wu L, Wang J, Bian X, Guo H. Dynamic Response Analysis of Parallel Twin Tunnels Under Different Train Loads. Applied Sciences. 2025; 15(10):5565. https://doi.org/10.3390/app15105565
Chicago/Turabian StyleWu, Lin, Jiayan Wang, Xiaoya Bian, and Hong Guo. 2025. "Dynamic Response Analysis of Parallel Twin Tunnels Under Different Train Loads" Applied Sciences 15, no. 10: 5565. https://doi.org/10.3390/app15105565
APA StyleWu, L., Wang, J., Bian, X., & Guo, H. (2025). Dynamic Response Analysis of Parallel Twin Tunnels Under Different Train Loads. Applied Sciences, 15(10), 5565. https://doi.org/10.3390/app15105565