Article

Evaluating the Seismic Fragility and Code Compliance of Turkish Reinforced Concrete Buildings After the 6 February 2023 Kahramanmaraş Earthquake

Department of Civil Engineering, Kirsehir Ahi Evran University, 40100 Kirsehir, Turkey
*
Author to whom correspondence should be addressed.
Appl. Sci. 2025, 15(10), 5554; https://doi.org/10.3390/app15105554
Submission received: 11 April 2025 / Revised: 13 May 2025 / Accepted: 13 May 2025 / Published: 15 May 2025
(This article belongs to the Special Issue Structural Analysis and Seismic Resilience in Civil Engineering)

Abstract

:
This study evaluates the seismic fragility and code compliance of reinforced concrete buildings in Turkey following the 6 February 2023 Kahramanmaraş earthquake. Sixty representative buildings were modeled in SAP2000, consisting of thirty structures designed according to TEC-1975 and thirty according to TEC-1998. These models were subjected to three-dimensional nonlinear time history analyses using ground motions scaled to match the seismic characteristics of the earthquake. Structural performance was assessed by comparing calculated displacement demands with capacity thresholds defined by modern code provisions. The results show that buildings designed under TEC-1998 generally performed better than those constructed according to TEC-1975, particularly in terms of deformation capacity and collapse resistance. Fragility curves and exceedance probabilities were developed to quantify damage likelihoods across different performance levels. When compared with post-earthquake field observations, the analytical models produced lower collapse rates, which may suggest the presence of widespread code noncompliance in the actual building stock. These findings highlight the critical importance of ensuring adherence to seismic design regulations to improve the resilience of existing structures.

1. Introduction

An extensive study was started into Turkish building stock and regulatory compliance following the earthquakes that hit the Kahramanmaraş province and surrounding areas on 6 February 2023. The studies primarily focused on whether the buildings were designed according to the provided regulations. Previous research on the 6 February 2023 Kahramanmaraş earthquake shows that a major problem with Turkish buildings is noncompliance with construction regulations. Ince [1] studied the structural damage caused to reinforced concrete buildings in Adiyaman province after a major earthquake. The study investigated compliance with Turkish earthquake regulations by focusing on the quality of materials, reinforcing details, and design. Field observations revealed common problems such as low concrete quality, insufficient transverse reinforcement, and design deficiencies, highlighting the necessity of better building practices and stricter compliance with construction codes to improve the earthquake resistance of Turkish structures. The seismic performance of different building typologies was evaluated by Avcil et al. [2], focusing on their responses 6 February 2023 Kahramanmaraş earthquakes. The authors focused on the impacts of the earthquakes on reinforced concrete structures, masonry, prefabricated and other types of structures in Kahramanmaraş province, by conducting field observations along with investigating soil structure interaction problems and code evaluations. The authors indicated that, despite advanced earthquake codes in Turkey, the occurred damage remained severe due to poor constriction practices, low material quality, and soil conditions. Mertol et al. [3] stated that the peak ground accelerations (PGAs) exceeded design values by 1.75 to 3 times in some locations. Along with this, the authors found that the majority of the damaged structures were constructed between 1975 and 2000, and their compliance with earthquake codes were minimal or non-existent. The extensive field observations of this study pointed out that the “strong column–weak beam” principle did not comply with the earthquake regulations. Also, the soft-story behavior was one of the major effects that caused the collapse of structures, which can be prevented by proper engineering services. Aydogdu et al. [4] provided a detailed analysis of the seismic vulnerability of the existing reinforced concrete building stock in Istanbul. The study focuses on structures that were constructed before the year 2000. The authors indicated that the material quality was poor and that there was insufficient reinforcement. Many structures exhibited significant structural deficiencies, such as inadequate lateral reinforcement spacing, weak columns, and low-strength concrete. Sianko et al. [5] presented a comprehensive seismic risk assessment framework using Monte Carlo simulations to predict potential earthquake losses in high-risk regions. Focusing on Adapazari, Turkey, the framework integrated seismic hazard models, vulnerability functions, and exposure models to estimate the human and economic losses for various return periods. The authors recommend incorporating site-specific factors such as liquefaction into future risk assessments, as the current model underestimates the impact of soil conditions on damage distribution. Ozturk et al. [6] investigated the damage to and structural performance of school buildings affected by the devastating earthquakes in southeast Turkey on 6 February 2023. The study analyzed the reasons behind the observed damage and emphasized the importance of adhering to seismic design principles for public buildings, particularly schools, which are critical for post-earthquake recovery. It was noted that over 12,000 school buildings were located in the affected region. The authors recommended a comprehensive reassessment of older buildings and adherence to modern codes to ensure Life Safety. Altınsu et al. [7] investigated the structural damage in the Hatay province caused by the Kahramanmaraş earthquakes on 6 February 2023. The response of buildings was evaluated, focusing on steel structures and reinforced concrete. Several issues were found, including neglected corrosion, weak shear reinforcements, poor-quality concrete, and strong beam–weak column failure. The study also pointed out design errors such as torsional response, a pounding effect, short column failure, rigidity differences, and weak stories. The study underscored that a combination of poor design, inadequate construction practices, and challenging soil conditions played a major role in the widespread damage in the Hatay province.
This literature review suggests that the widespread damage was primarily due to a lack of compliance with the Turkish Earthquake Codes (TECs), such as TEC-1975 [8], TEC-1998 [9], and TBEC-2018 [10]. This study provides a unique comparison of buildings designed under TEC-1975 and TEC-1998, examining their performance during the 6 February 2023 Kahramanmaraş earthquake. Unlike previous research, which often emphasizes field observations, this work applies nonlinear time history analysis to evaluate both older and newer buildings, with a focus on the improvements in regulations over time. The study thoroughly analyzes compliance gaps, demonstrating that, despite advances in regulations, non-adherence continues to be a significant factor in building failure. The findings offer practical insights for enhancing code enforcement and reducing earthquake-related damage, both in Turkey and in other regions facing similar challenges.
Over the decades, Turkish seismic design regulations have undergone major revisions in response to lessons learned from past earthquakes. TEC-1975 provided only basic strength-based design rules and lacked explicit requirements for ductility, confinement detailing, or the evaluation of structural irregularities. In contrast, TEC-1998 introduced critical improvements, including the definition of ductility classes, stricter detailing rules for transverse reinforcement (e.g., confinement zones and reduced stirrup spacing), and the classification of plan and elevation irregularities. TBEC-2018 further modernized seismic design by adopting performance-based assessment principles, establishing explicit damage thresholds, and incorporating nonlinear analysis methods. Despite the updating of regulations in Turkey (TEC 1975, TEC 1998, TBEC 2018), the loss of lives and property in all major earthquakes is significantly higher than in other countries, suggesting a lack of compliance with Turkish construction practices. The aim of this study is to examine buildings constructed in accordance with the 1975 and 1998 regulations and demonstrate that, regardless of the magnitude of the earthquake, the loss of more than 50,000 lives due to the damage and collapse of reinforced concrete buildings should not have occurred with our present engineering knowledge. For this purpose, 30 reinforced concrete frame buildings representing the 1975 regulations and 30 representing the 1998 regulations were empirically modeled in SAP2000 [11]. For the buildings with the 1975 regulations, C16-S220 materials were selected, whereas C25-S420 materials were used for the buildings with the 1998 regulations. The designs did not include reinforced concrete shear walls, and the buildings were considered as only frames. The lateral reinforcement spacing was set to 20 cm for the older buildings (TEC-1975) and 10 cm for more recent buildings (TEC-1998).
This study aims to evaluate the seismic performance and code compliance of reinforced concrete buildings in Turkey designed according to TEC-1975 and TEC-1998. Sixty representative buildings were modeled and analyzed using 3D nonlinear time history simulations, with ground motions scaled to the 2023 Kahramanmaraş earthquake. By comparing seismic demands with structural capacities and validating the results against field observations, the study examines the role of regulatory compliance in the observed damage. The findings provide important insights into the effectiveness of past code provisions and the current vulnerability of the Turkish building stock.
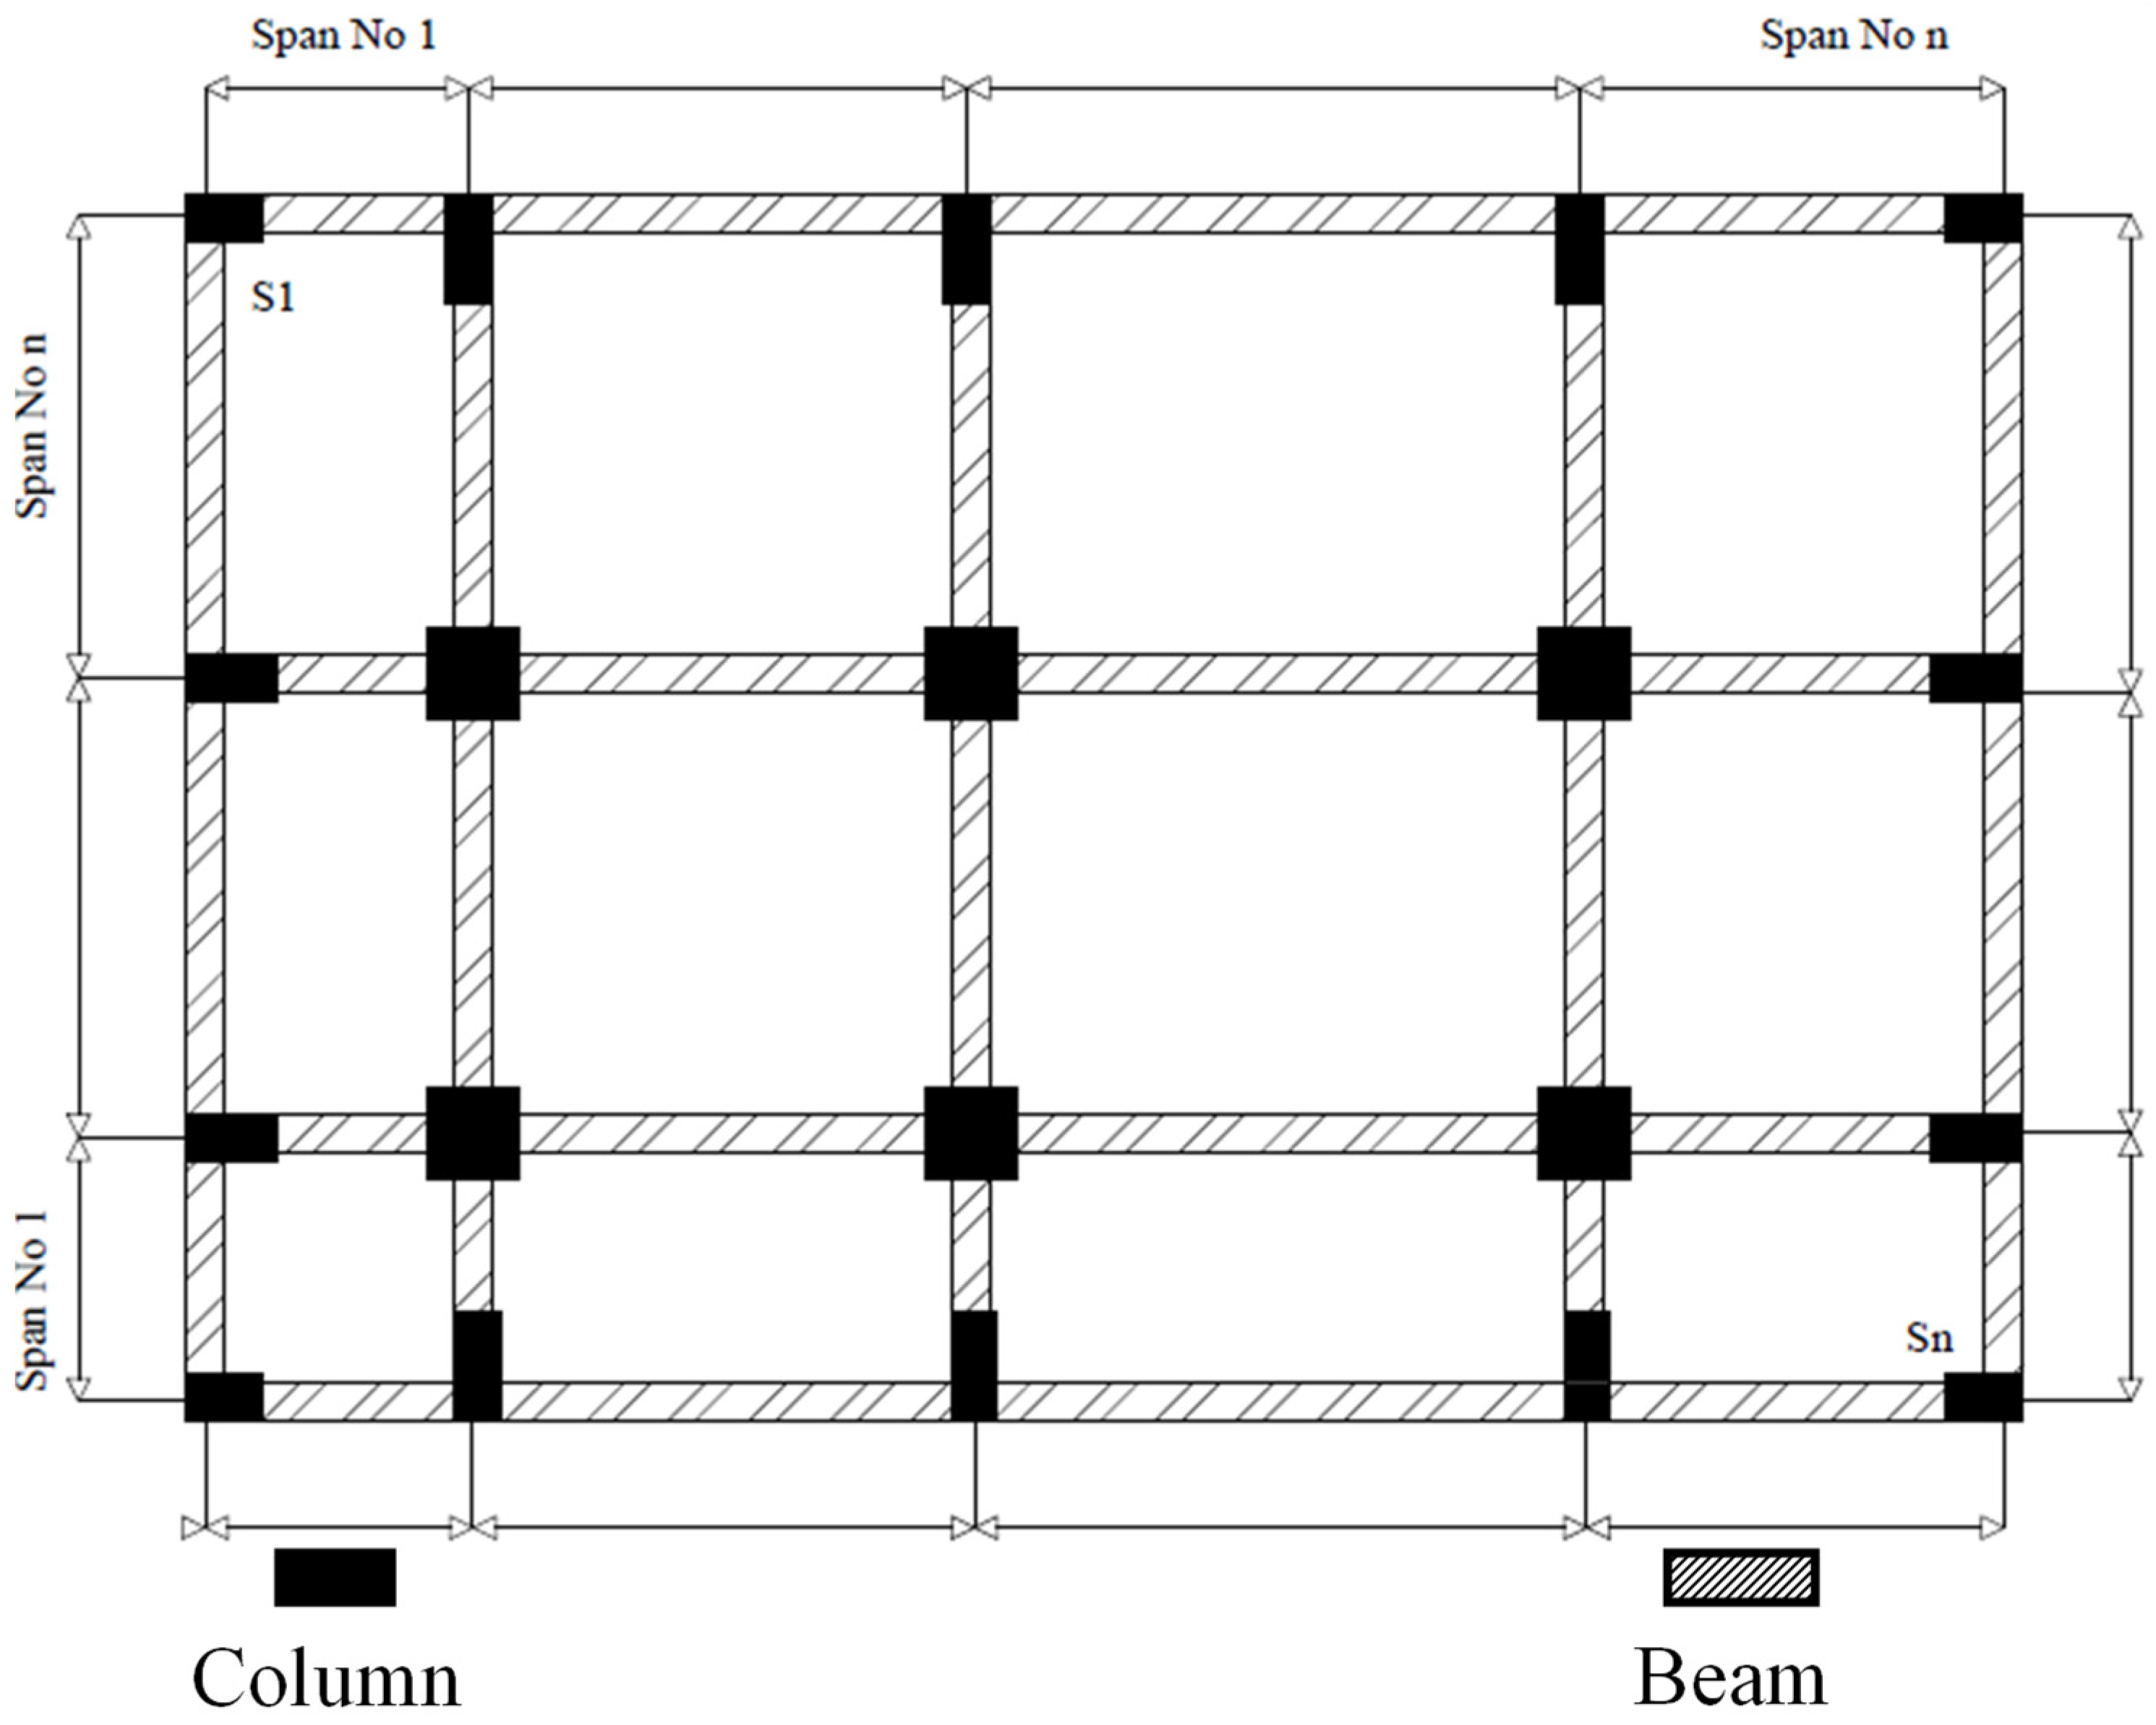
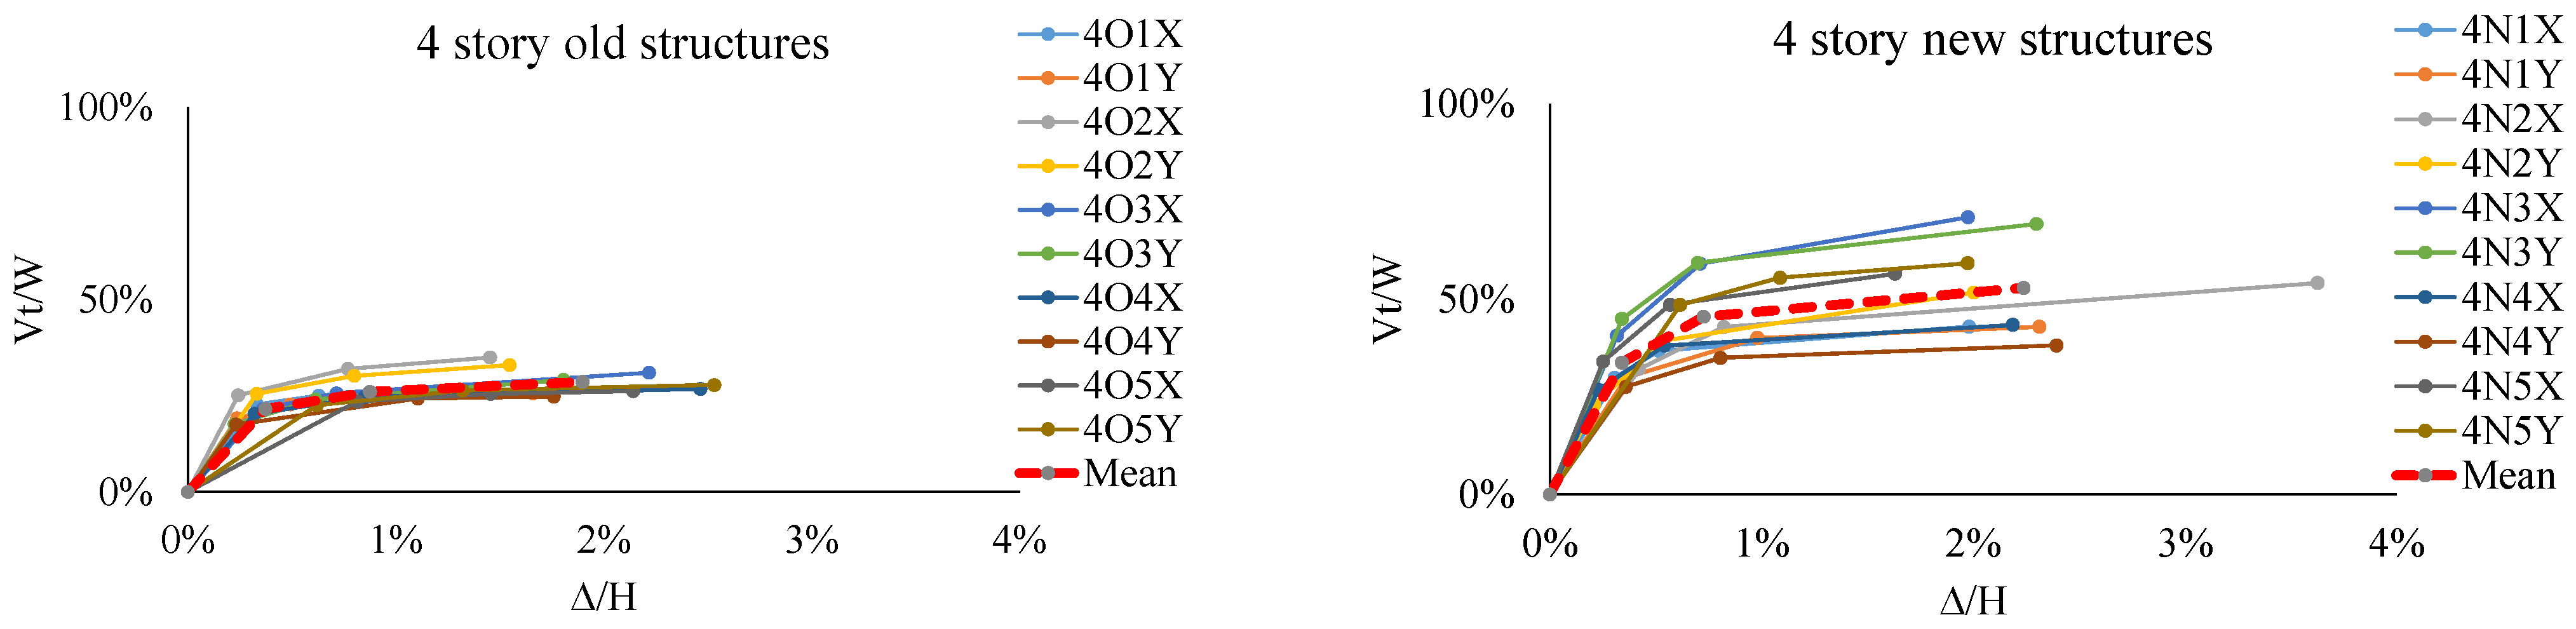
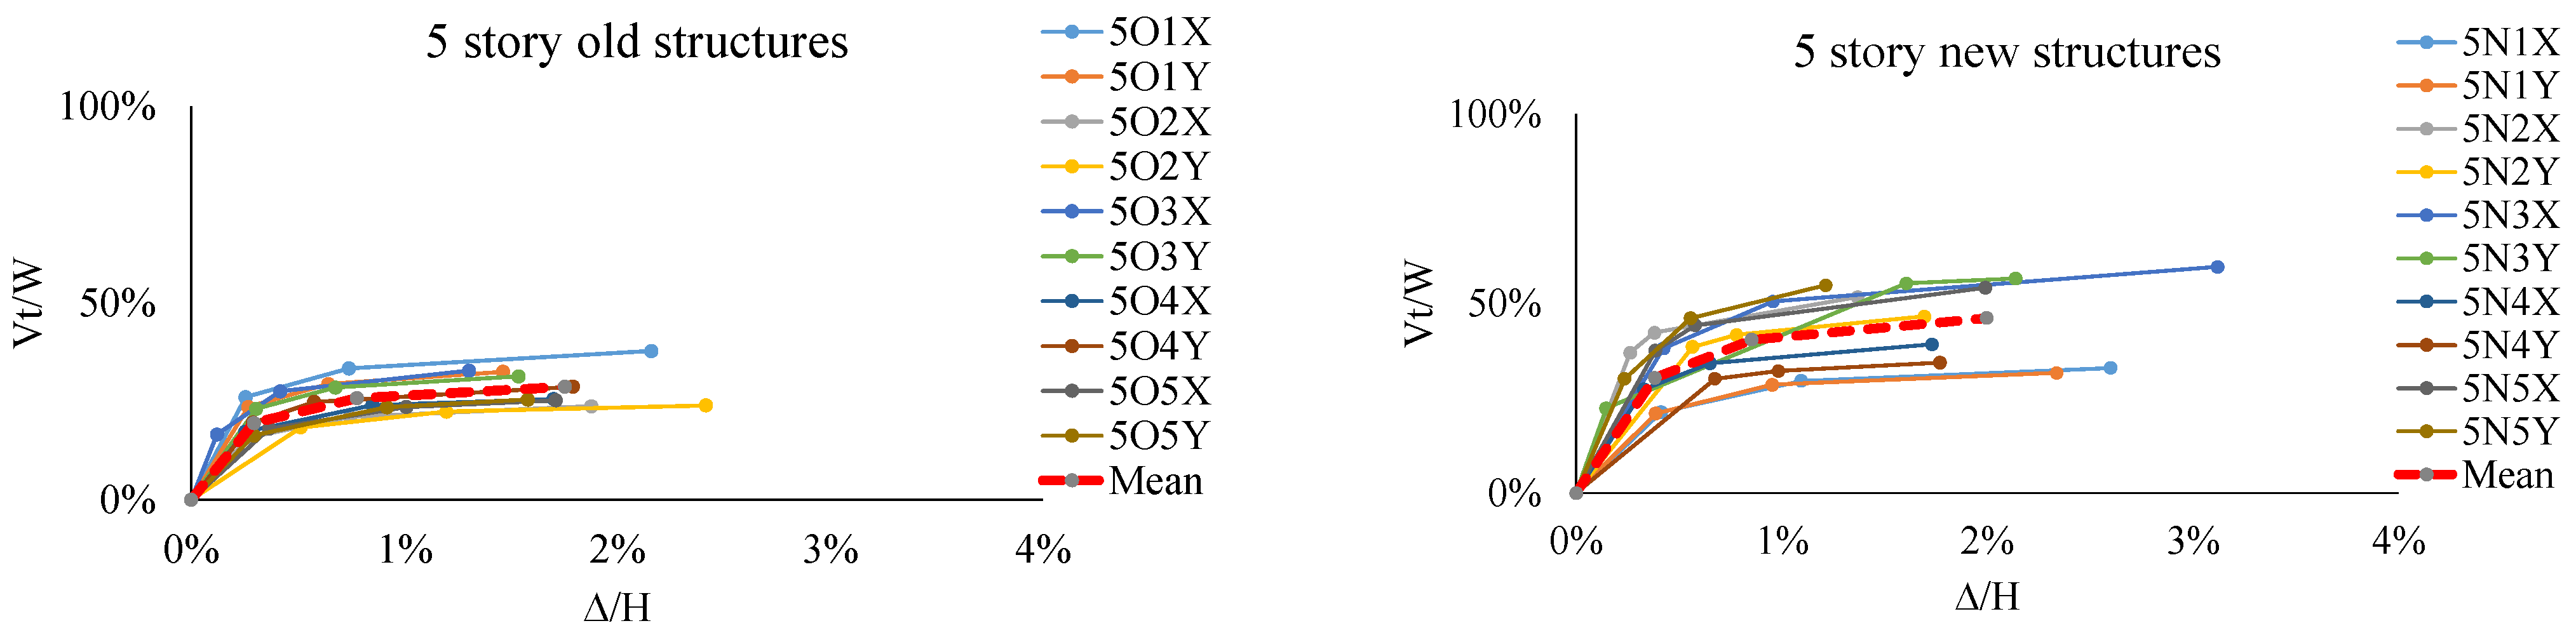
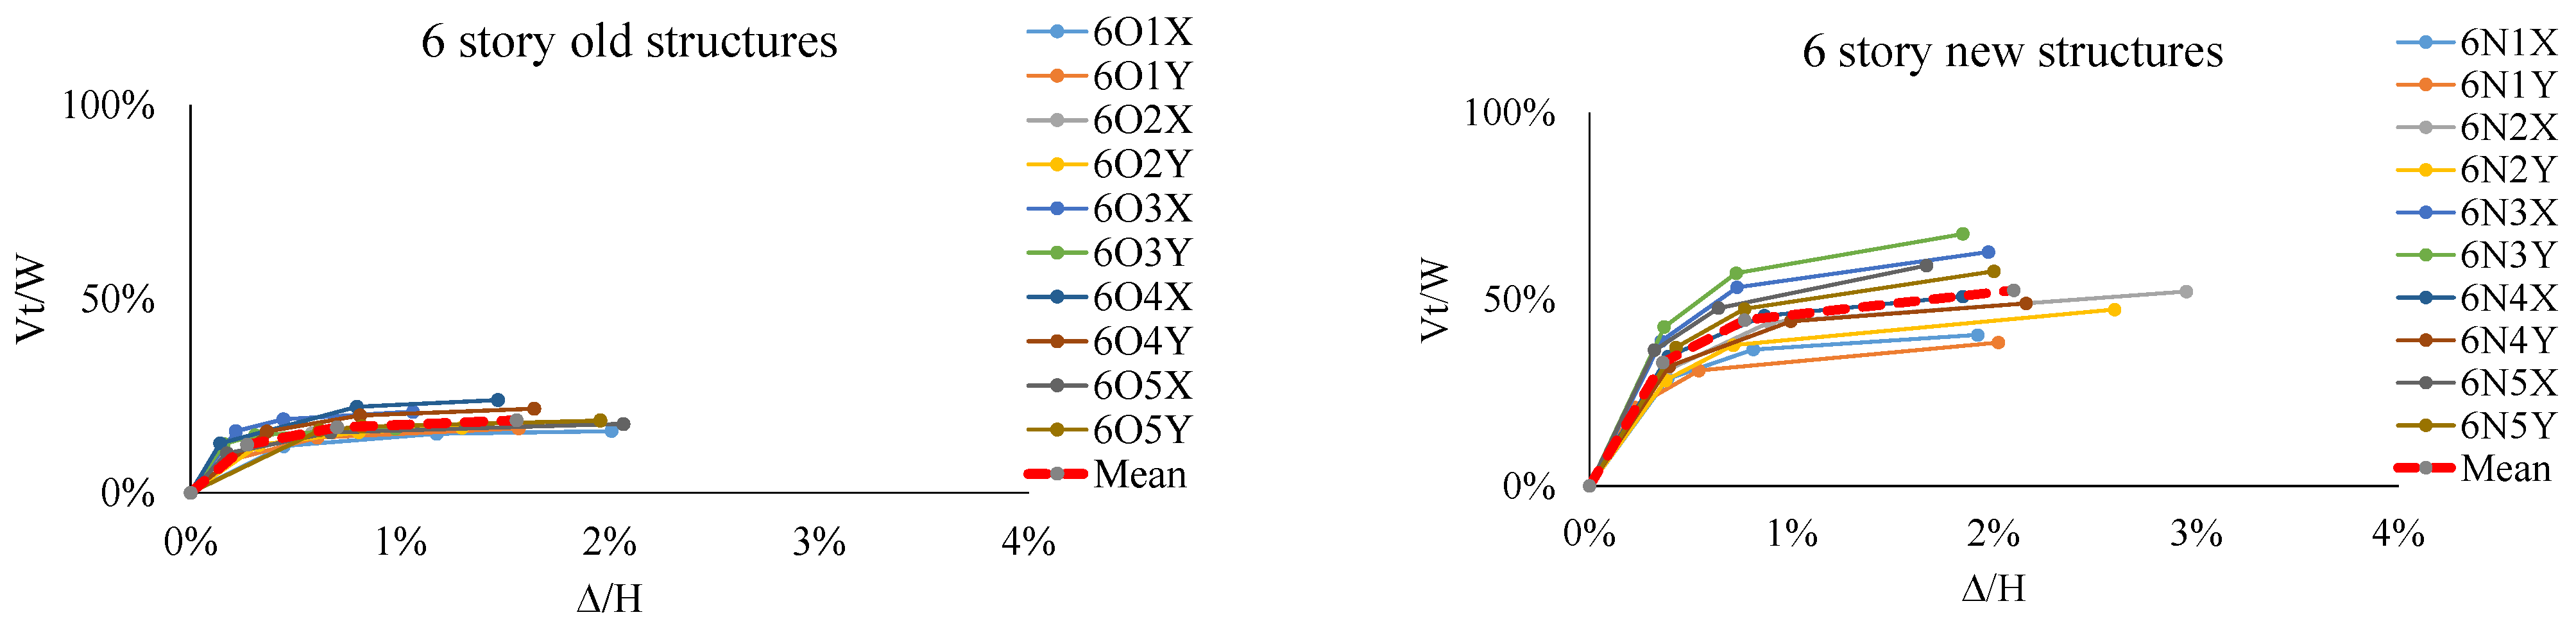
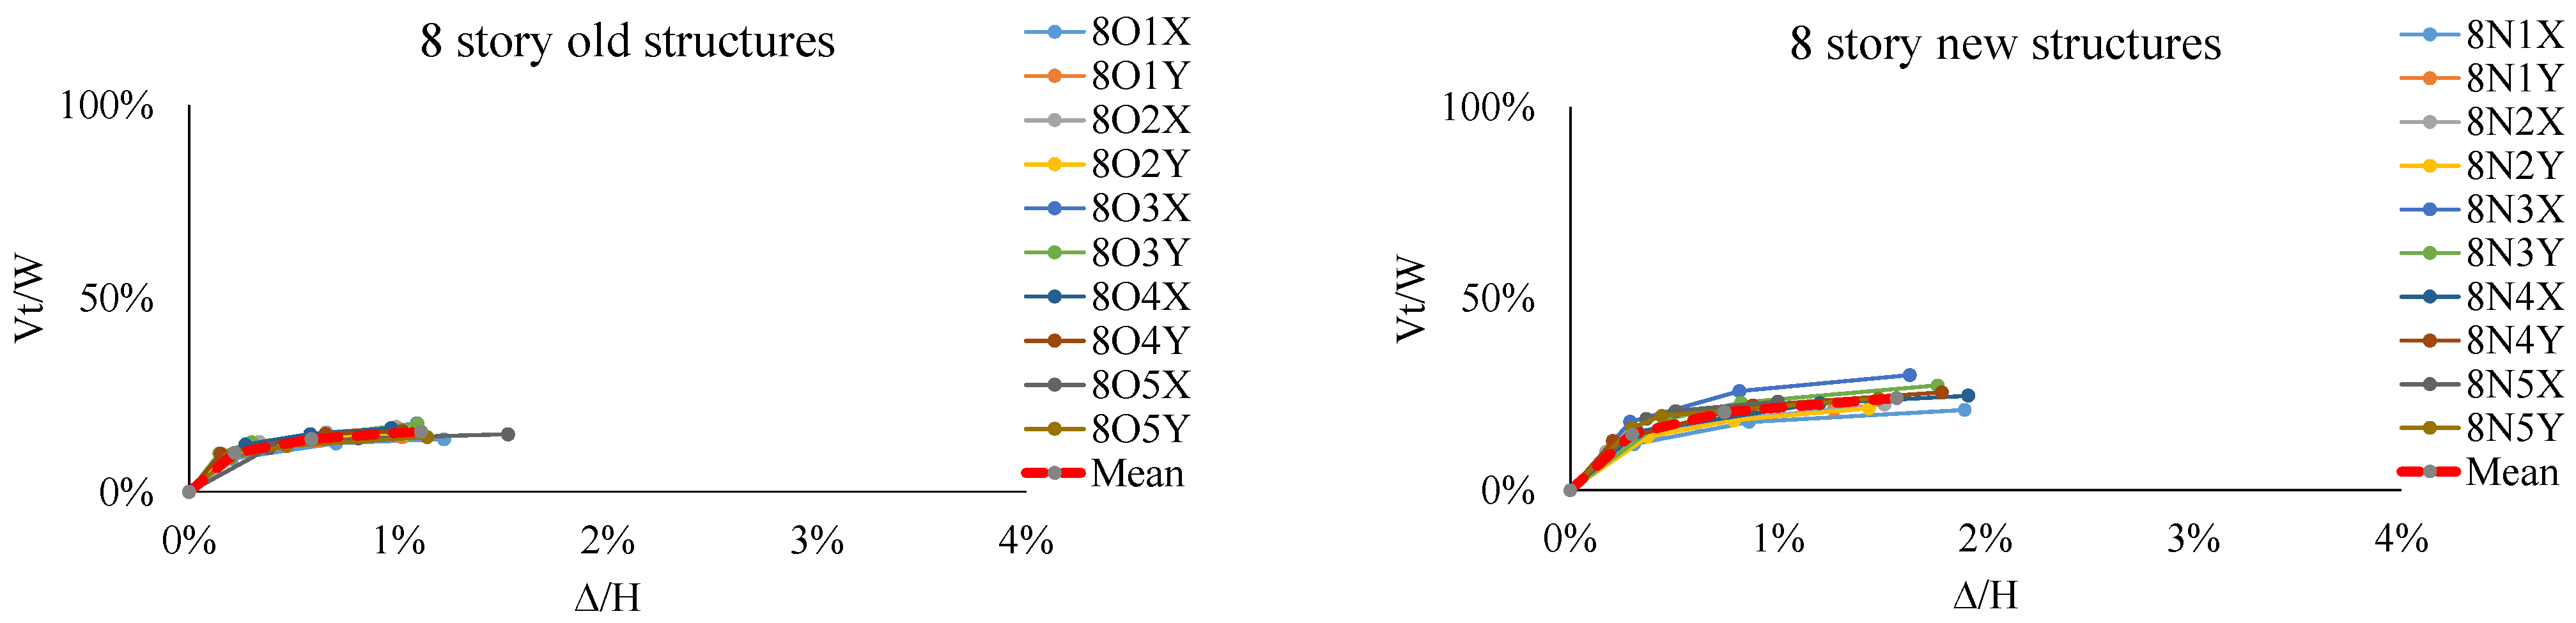
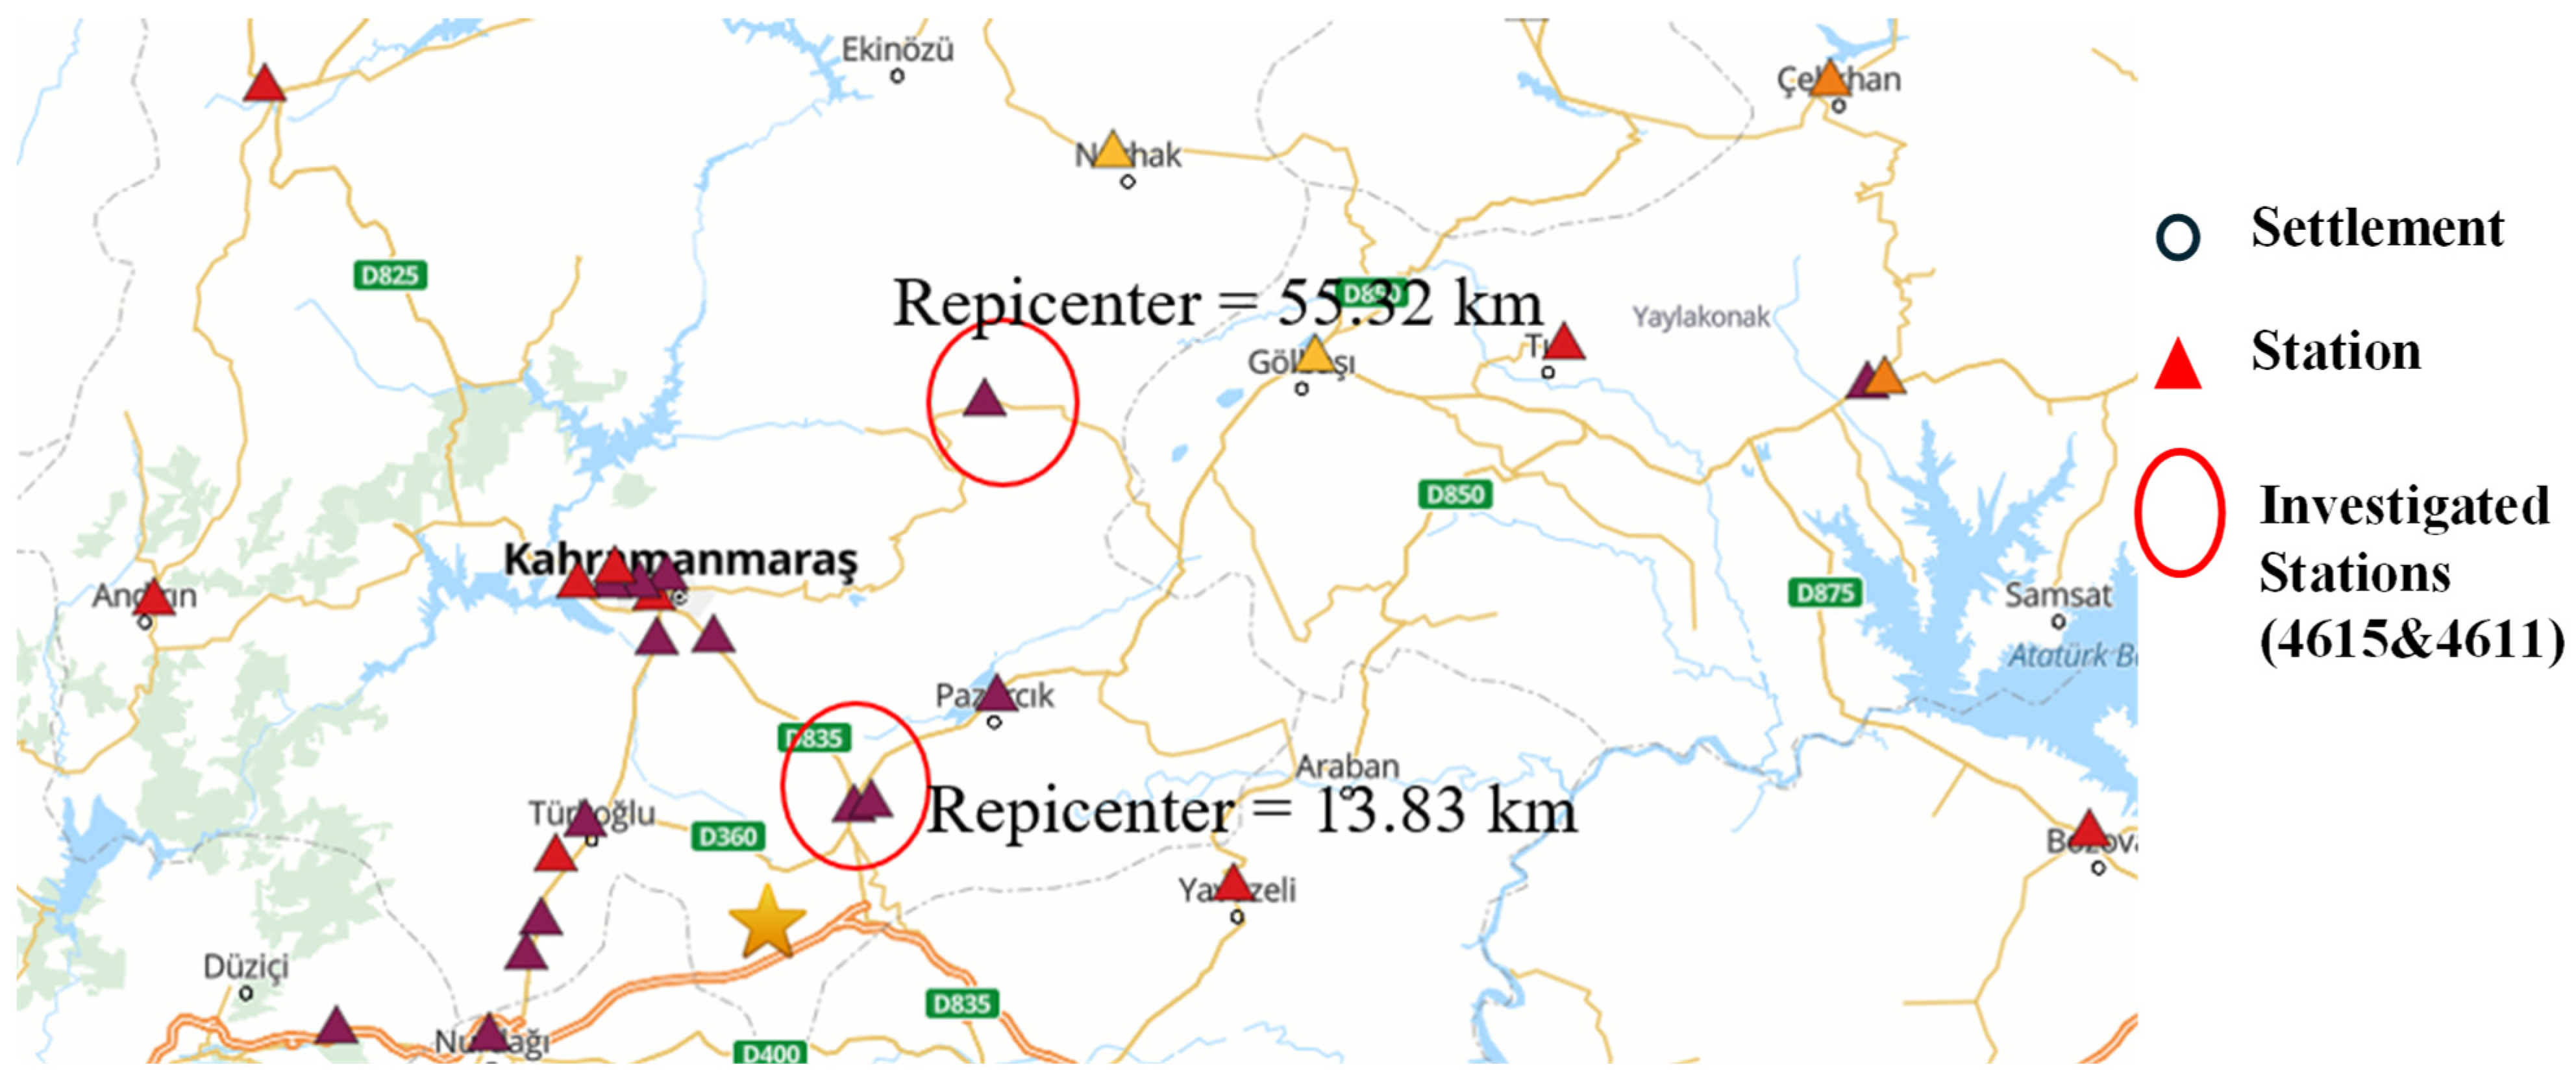
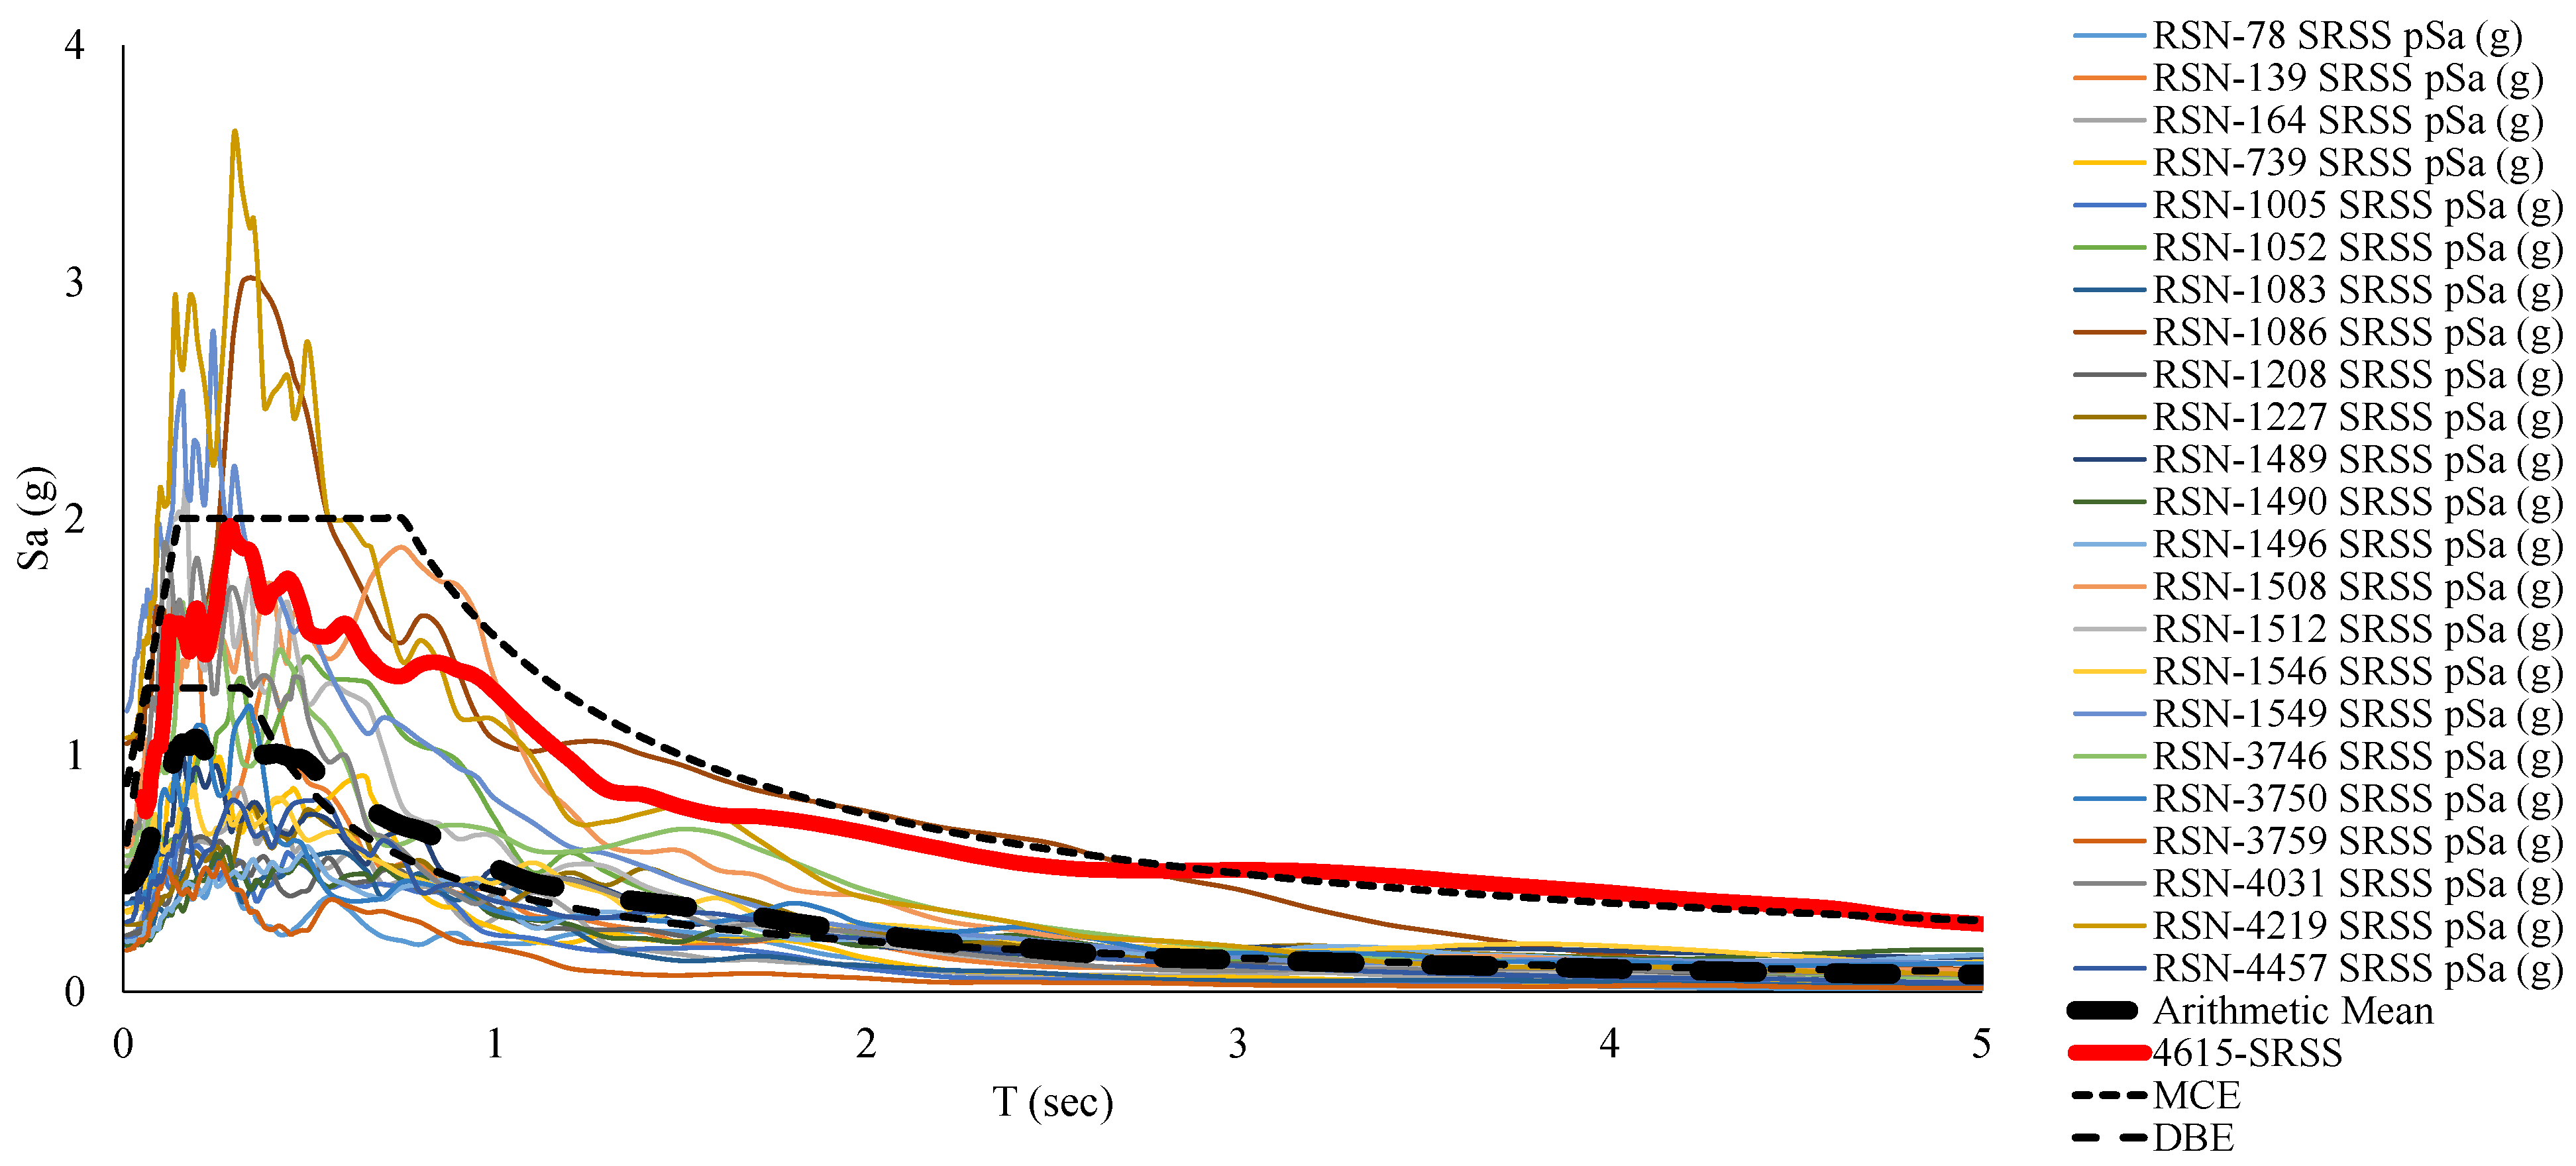
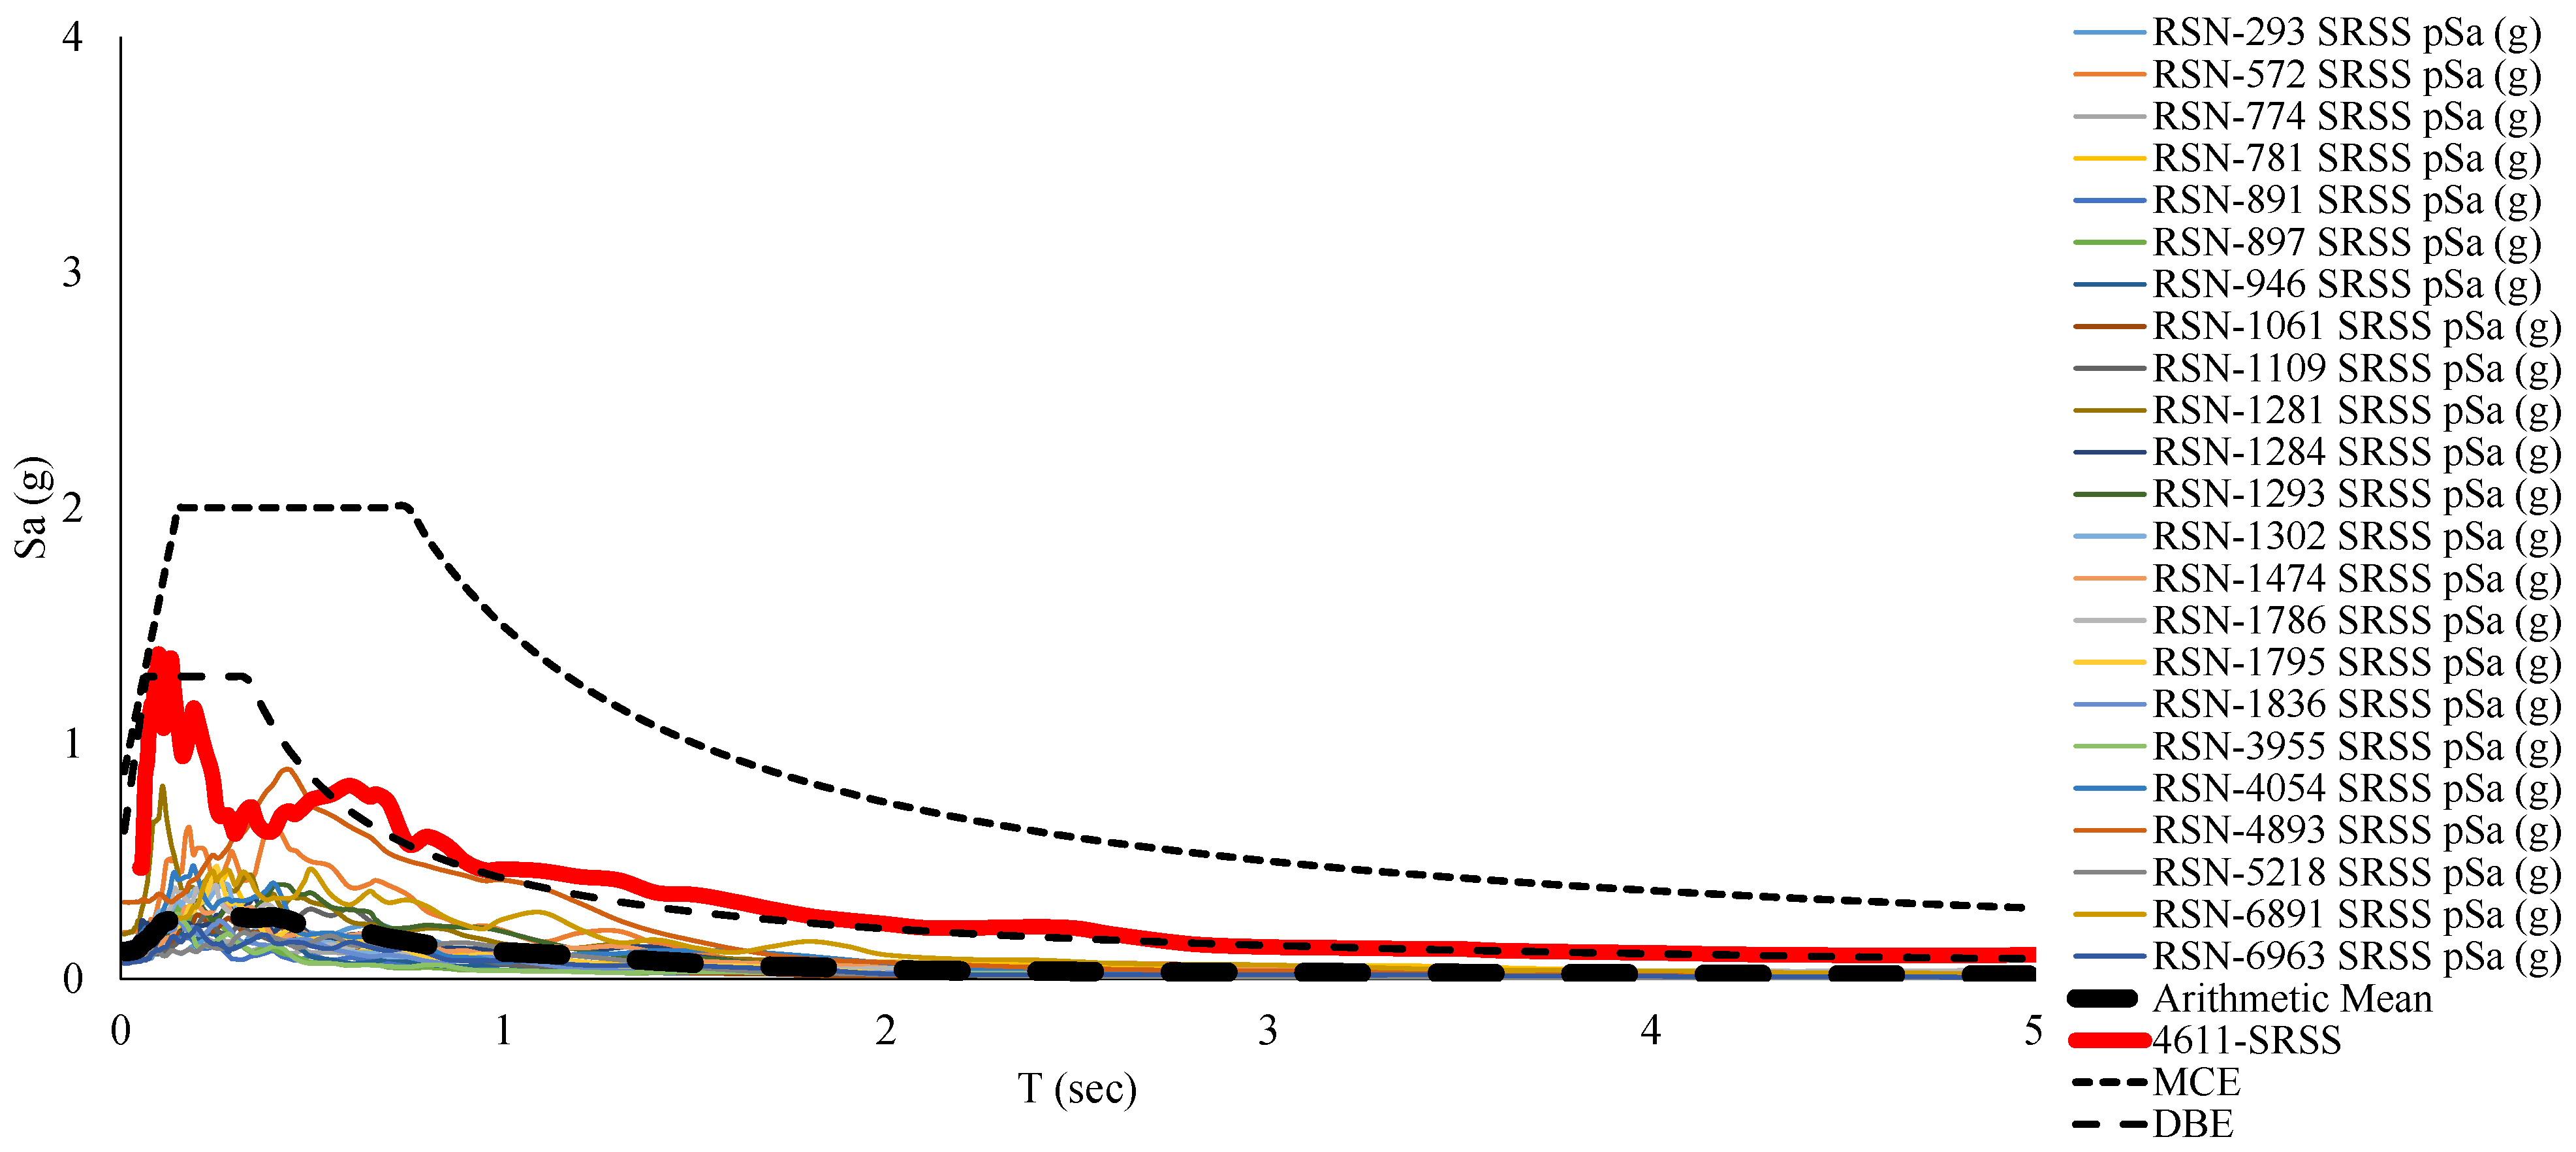
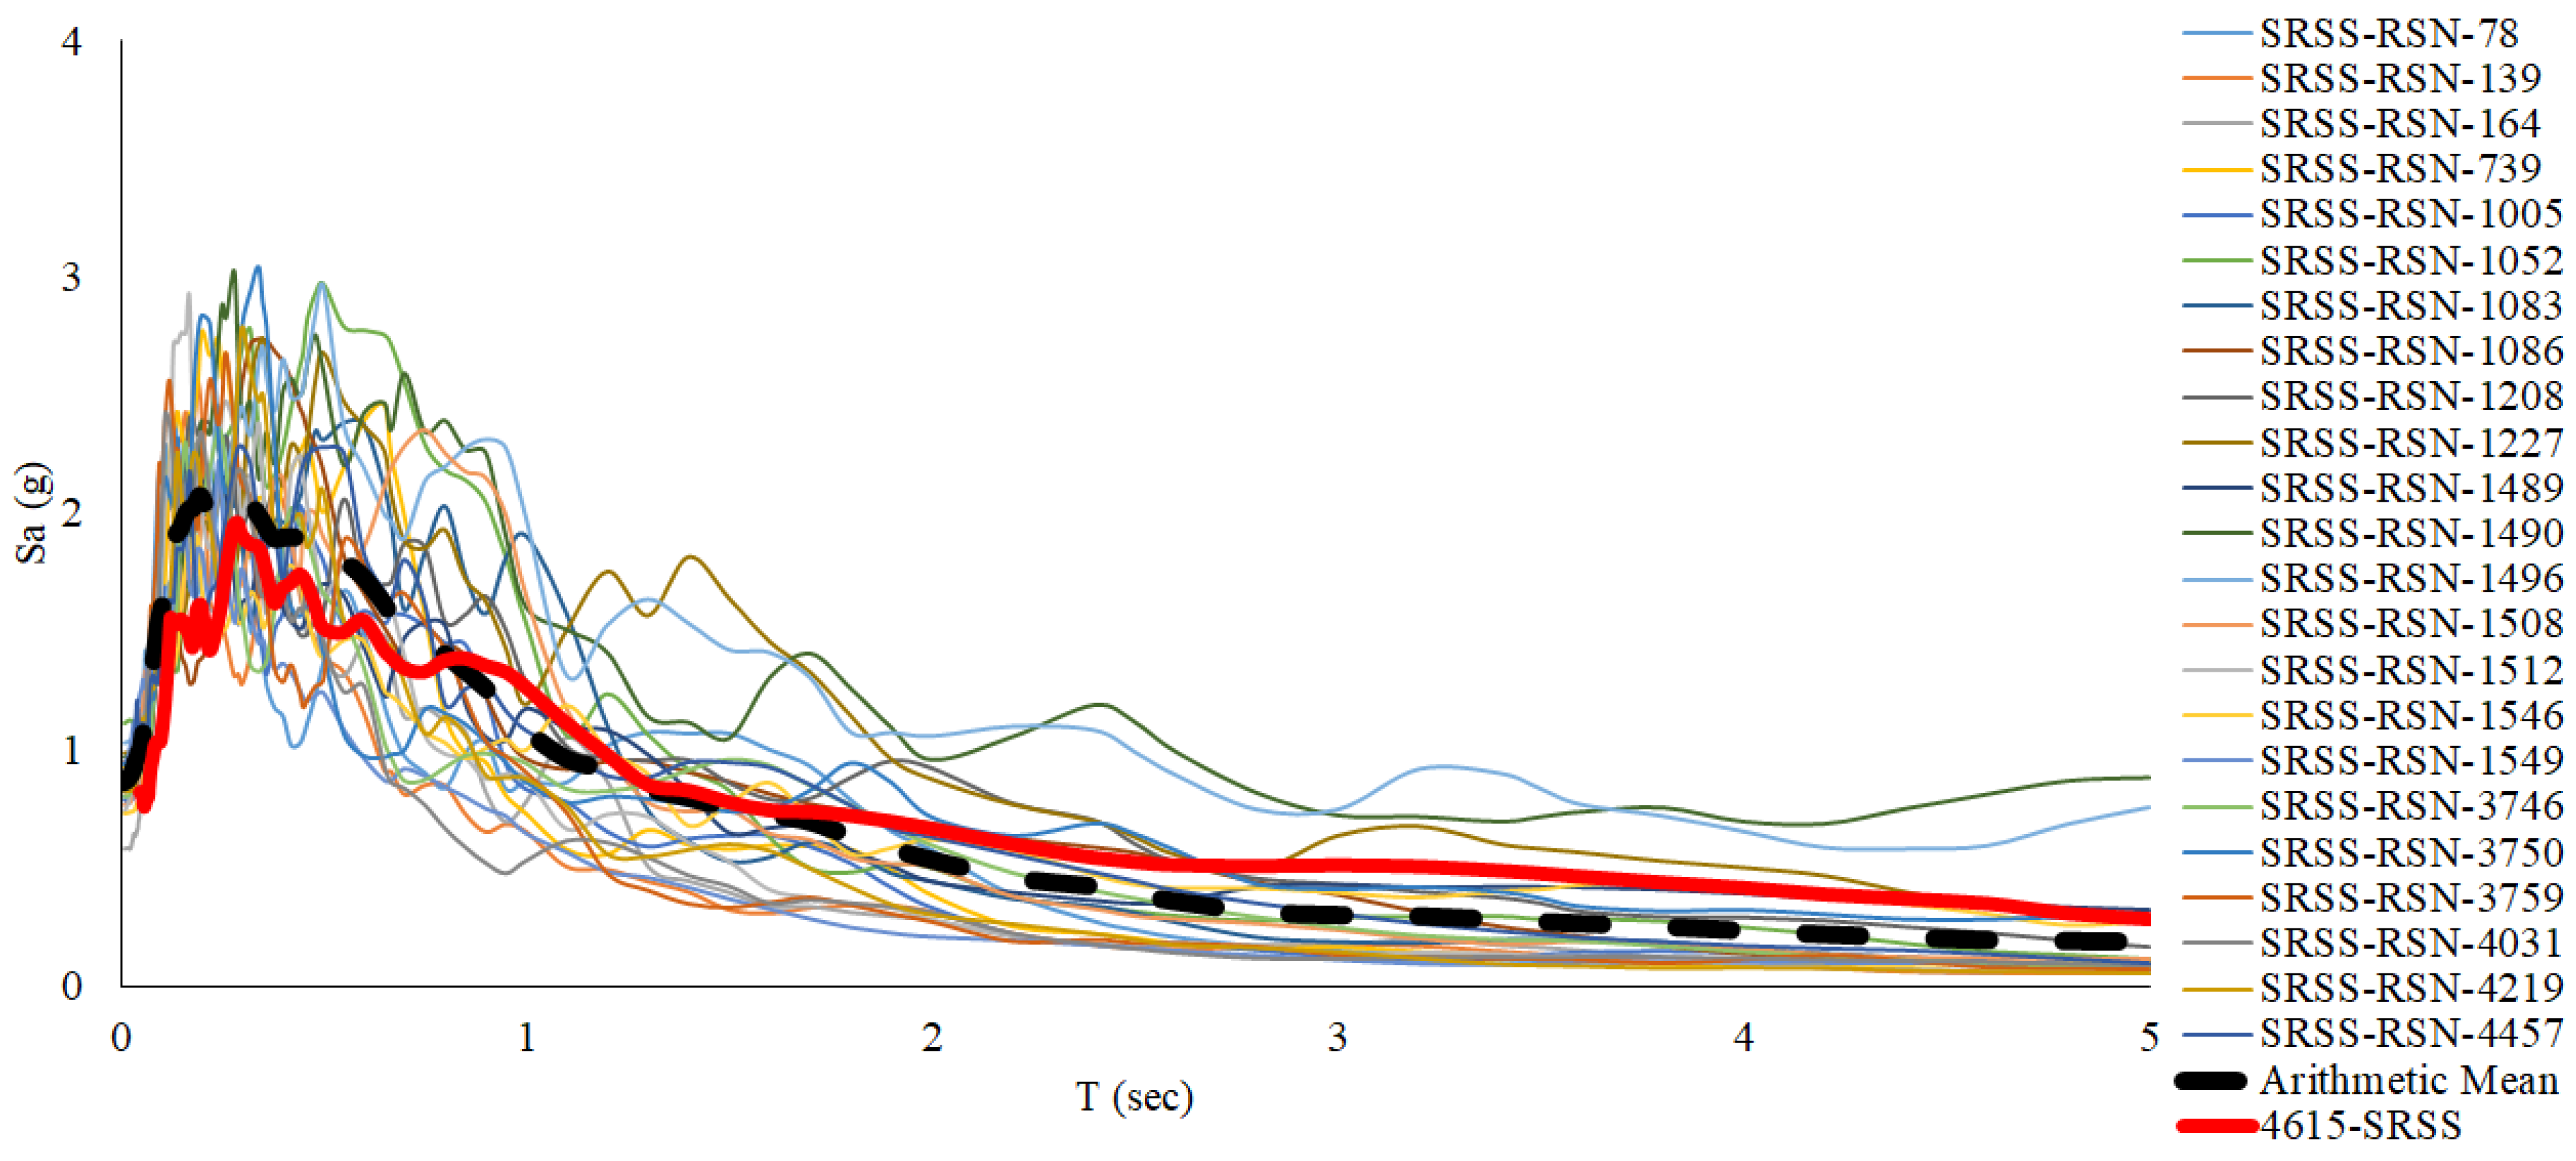
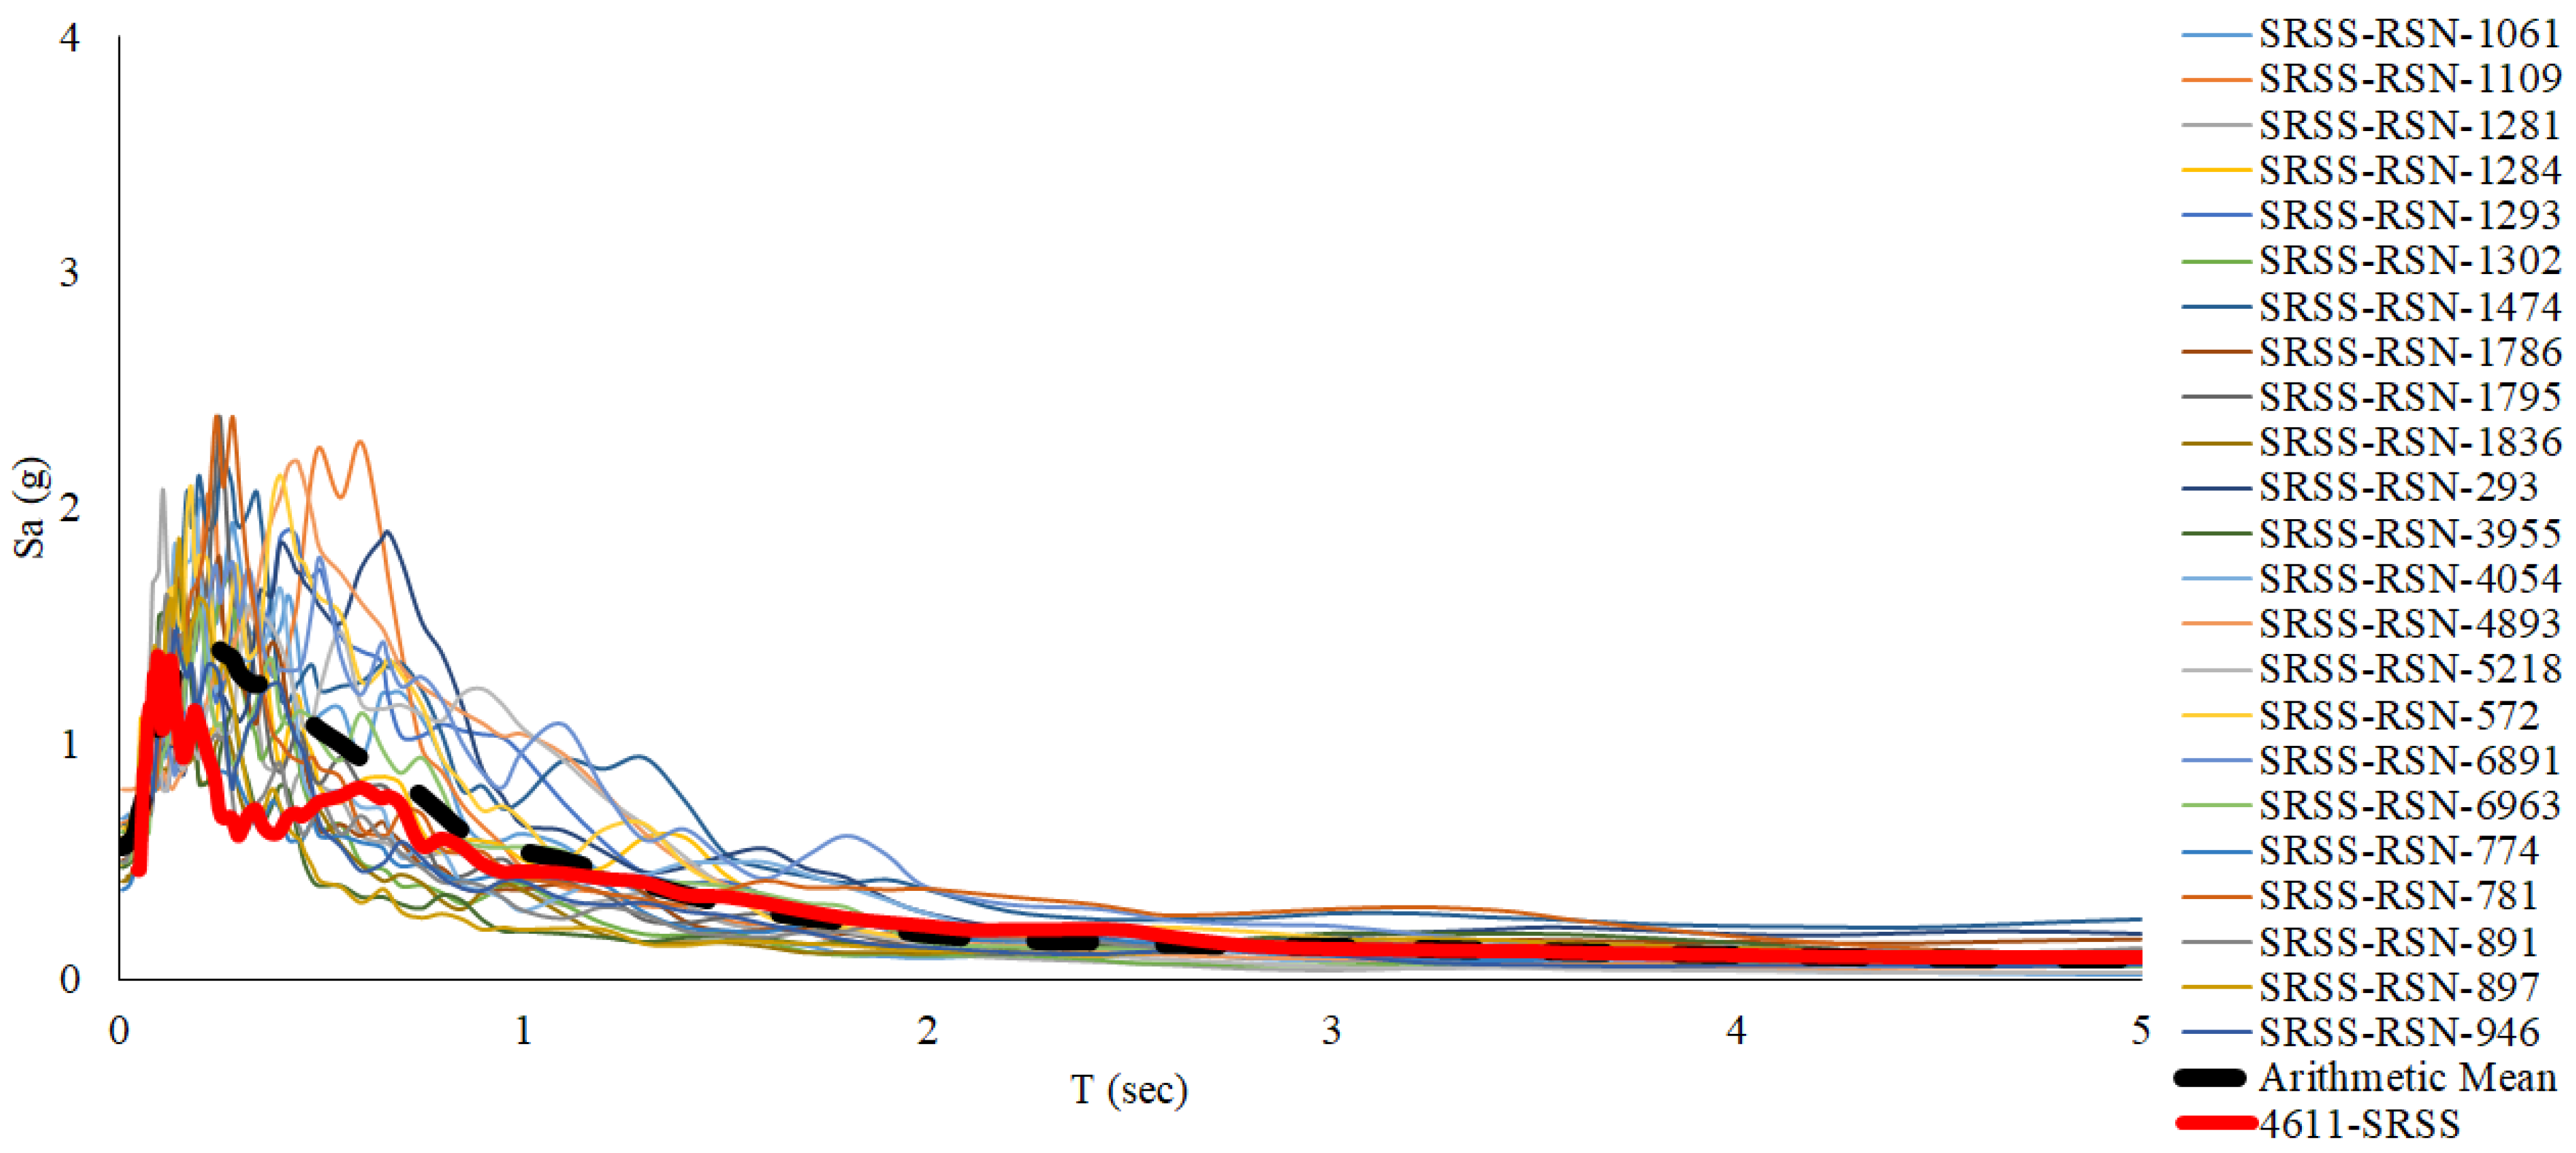
Buildings were modeled with 3, 4, 5, 6, 7, and 8 stories, reflecting the typical building heights in Turkey, to generalize the findings for the Turkish building stock. A total of 60 reinforced concrete building models were designed by producing 5 old and 5 new buildings for every building height (6 heights × 5 structural models × 2 different earthquake codes = 60 models). This study was carried out to assess the performance of Turkish buildings modeled with different story heights, different numbers of stories, different earthquake codes, and at different locations (stations 4611 Repicenter, 55.32 km, and 4615 Repicenter, 13.83 km), using a total of 46 (23 each) acceleration records. In the scope of the study, the horizontal strength and horizontal drift capacities of the buildings were assessed and compared with the obtained demands from 3D nonlinear time history analyses. The focus was mainly on the collapse conditions, representing scenarios where the occupants of the building would likely perish.
As a result of 2760 analyses, findings consistent with previous field observations regarding the Kahramanmaraş earthquake were identified. While older buildings experienced higher rates of collapse, the analysis also revealed that, although the rate was lower, some newer buildings also collapsed. Unlike other studies, this research was conducted to explain why certain buildings remained intact and to further validate field observations. The results confirm that buildings constructed according to the updated regulations (TEC1998) demonstrated significantly better performance compared to older buildings. However, the Kahramanmaraş earthquake also revealed that many buildings were noncompliant with the regulations, and these were the structures most likely to experience collapse. The Kahramanmaraş earthquake highlighted the critical need to assess whether reinforced concrete buildings, particularly those located near fault lines, comply with current regulations.

2. Materials and Methods

2.1. Building Floor Plans and Design of Buildings

In this study, 30 new and 30 old building models were analyzed under 46 acceleration records. The multi-purpose structural analysis program SAP2000 was employed to create the building models. During the modeling process, structural irregularities such as closed projections in the building, plan irregularities, and the use of the store on the first floor (soft-story case) were not considered. While creating the building models, attention was given to ensuring that the buildings exhibited different characteristics from one another. Therefore, the selected reinforced concrete element sizes, axis spans, reinforcement diameters used in columns and beams, and floor dead and live loads that determined the seismic weights of the buildings were chosen in accordance with the regulations of 1975 and 1998. The characteristics of the floor plans utilized in this study were consistent with those reported in previous studies in the literature [12]. In Table 1, the span lengths of the building models in the x and y directions are provided. A selected length represents the length of the relevant axis of the building in the specified direction. The number of axes indicates how many axes the building has in the x direction and how many it has in the y direction. Although floor heights vary between building models, they remain consistent within each building and were chosen from the values shown in Table 1. Column dimensions were also selected separately as h and b, as illustrated. The same approach was used for selecting beam dimensions. For an example building represented in these tables, the number of spans in the x direction was 4, and in the y direction was 3, with span distances ranging between 2 and 7 m for each direction. The element dimensions for the columns at each axis intersection were chosen to be between 0.3 and 0.7 m (e.g., s1 0.30 × 0.50, s2 0.60 × 0.40). Beam dimensions were selected once for each building; for instance, if the selected size in a building was 0.25 × 0.60, that dimension was maintained for the beams on every floor. An overall view of the created floor plans is shown in Figure 1.
The floor plans of the buildings were selected from the data in Table 1 and designed as theoretical models, resulting in 60 reinforced concrete frames. The buildings were modeled as frame elements with smooth floor plans, without reinforced concrete shear walls. Dead loads in the buildings were chosen to vary between 0.1 and 0.35 t/m2 (0.981–3.43 kN/m20), and live loads varied between 0.2 and 0.4 t/m2 (1.96–3.92 kN/m2). Since infill walls are expected to separate from the reinforced concrete frame system in the initial moments of an earthquake [13], they were not physically modeled. Instead, the infill walls were represented as loads on the frame systems and were categorized into interior and exterior walls.
TEC-1998 introduced detailed seismic zoning, refined design spectra, building importance factors, ductility requirements, stricter irregular building rules, and modern analysis methods, significantly improving upon the simpler, strength-based approach of TEC-1975. The slab thicknesses in the buildings were considered to be either 12 or 15 cm, and the slabs were not physically modeled like the walls but were only assigned as loads on the relevant beams. The subjected structures were designed in seismic zone 1 and the site classification of a Z3 design spectrum for both regulations. The structural behavior factor (R) was taken as 8 for newer structures since the analyzed structures included only frame elements. The P-Δ effects were considered in both the design and evaluation phases (design loads, static pushover and direct time history analyses). Floors were considered as rigid diaphragms. When modeling the column–beam connection areas, the sections where the columns and beams intersect were defined as completely rigid, with the end length offset [14]. The effective stiffness of the reinforced concrete elements (Ieff) was considered as 0.7 for the columns and 0.35 for the beams, in accordance with TBEC-2018. In the modeled buildings, longitudinal column reinforcements started from ϕ12 for the old buildings and ranged up to ϕ16. In the new buildings, this ratio was updated in the new regulations (TEC-1998), so the minimum requirement was determined as either 6ϕ14 or 4ϕ16. Taking these ratios into account in the theoretical buildings modeled in the study, the column longitudinal reinforcement for the new buildings started from ϕ14 and ranged up to ϕ18. For the beams, the longitudinal reinforcement diameters were chosen as ϕ12 and ϕ14. The transverse reinforcement diameters were determined as ϕ8 in both the old and new buildings. In the old buildings, the transverse reinforcements were not tightened and the minimum transverse reinforcement spacing was specified as 20 cm. In the new buildings, the transverse reinforcements were tightened in accordance with the regulation, and the transverse reinforcement spacing in the confinement areas was taken into account as 10 cm. Post-yield hardening behavior was considered in the reinforcement used. The theoretical buildings, for which frame models were created, were subjected to modal analysis. The calculated fundamental periods were compared with the empirical relationships based on building height (H) as specified in EC-8 [15] and TBEC-2018 [10]. The corresponding expressions for the empirical building period in EC-8 and TBEC-2018 are presented in Equations (1) and (2), respectively, and the comparison results are illustrated in Figure 2.
TEC-8 = 0.075 × H0.75
TTBEC-2018 = 0.1 × H0.75

2.2. Nonlinear Modeling and Determining Collapse Points of Structures

As previously mentioned, the reinforcement designs for the reinforced concrete elements of the buildings were carried out in accordance with the TEC-1975 earthquake regulations for the older buildings and the TEC-1998 earthquake regulations for the newer buildings. However, the section damage limits outlined in TBEC-2018 were utilized to assess the seismic performance of the buildings. Although TBEC-2018 also includes building performance limits for beams, this study only considered column elements when determining building performance limits. In other words, when the buildings were evaluated in the study, the performance of the beams, whether Limited Damage (LD) or Collapse Prevention (CP), did not affect the overall building performance. The rationale behind this is that the failure of a column significantly increases the probability of loss of life in a building. Table 2 presents the threshold values corresponding to the damage limits.
To capture the nonlinear behavior of the structural members, lumped fiber-hinge elements were employed, where the hinges were directly characterized by material nonlinearity. In this approach, each hinge is described by fiber models, with stiffness evaluated directly from the material’s nonlinearity. According to [16], a single hinge at each end is sufficient to model biaxial bending. The hinge length was applied as 0.5 of the section height, as recommended by [16]. The compressive strength of the concrete was assumed to be 25 MPa for the new buildings and 16 MPa for the old buildings, and the yield strength of both the longitudinal and transverse reinforcements was assumed to be 420 MPa for the new buildings and 220 MPa for the old buildings. The calculations also accounted for the post-yield strengthening of the reinforcement. The longitudinal reinforcement ratios varied between 1.1% and 1.65% for the reinforced concrete columns. No cross-sectional or reinforcement reduction was employed for either the old or new structures, which are widely used in buildings designed under TEC-1975 [8]. After the nonlinear definitions of the buildings were made, the structure models were subjected to static pushover analysis and the building performance limits were determined according to TBEC-2018. Both the x and y capacities of the buildings were determined, and the collapse status of the buildings was assessed separately in both directions. The performance points were determined based on the rotations of the relevant structural elements, and the corresponding section damage limits were used to define overall building performance levels, taking into account the distribution of these damages throughout the structure. Within this framework, only column damage was considered in defining total building collapse, excluding beam damage from the collapse criteria. Figure 3 illustrates the capacity curves (in dimensionless form) and associated damage states for two 6-story new building models (6N1X and 6N1Y).
The obtained capacity curves and the means of the subjected categories are shown in Figure 3, Figure 4, Figure 5, Figure 6, Figure 7, Figure 8 and Figure 9, with the relevant damage limits indicated by dots along two lines. The averages of the relevant damage limits are shown as immediate occupancy (IO) to ultimate capacity (C) in Table 3. This table shows that the empirical buildings examined represent Turkish buildings in terms of both horizontal strength ratios and horizontal drift capacities, and are consistent with building models in past studies [12,17,18,19].
In their 2008 study, Inel et al. [17] modeled representative buildings (referred to as REF buildings) based on structural characteristics observed in the Turkish building stock, including both 4- and 7-story reinforced concrete buildings. In their context, for the 7-story new buildings, they identified the immediate occupancy (IO) threshold as 0.43% and the Collapse Prevention (CP) threshold as 1.40%. For the older 7-story buildings, these values were calculated as 0.38% and 0.83%, respectively. For the 4-story models, the IO and CP thresholds were found to be 0.54% and 1.48% for the new buildings and 0.51% and 1.17% for older buildings.
In the present study, the mean IO threshold for the new 4-story reinforced concrete buildings was calculated as 0.3%, while the CP threshold was found to be 1.7%. For the older 4-story buildings, the corresponding values were 0.4% for IO and 1.4% for CP. Regarding the 7-story buildings, the IO threshold was determined as 0.3% for the older buildings and 0.4% for the new buildings, whereas the CP thresholds were calculated as 1.1% for the older and 1.9% for the new buildings (Table 3). However, it is important to note that this study defined collapse based on the ultimate state—representing a pancake-type failure scenario in which one of the columns completely loses its load-bearing capacity. As readers may appreciate, this definition was adopted to avoid conflicts with the provision in the ref [9,10] stating that “the ratio of beams beyond the CP region shall not exceed 20% in any story”. Therefore, the collapse drift limits (Δu) defined in this study corresponded to more severe damage states than the CP thresholds reported in [17].
In this study, the Newmark-Beta method [20] was employed for time history analysis. To ensure unconditional stability, the Gamma (γ) and Beta (β) coefficients were set to 0.5 and 0.25, respectively. Rayleigh damping was used to formulate the damping, with the damping ratio assumed to be 5%. The mass and stiffness proportional coefficients were determined based on different period values and considered for the viscous proportional damping. When determining the number of modes considered in this study, it was ensured that the mass participation rate of the modes exceeded 95%, which corresponded to the first 8 modes in this study.

2.3. Selection and Scaling of Ground Motion Records

The Kahramanmaraş earthquake, with a magnitude of 7.7 and centered in Pazarcık, occurred at 04:17 in the morning. Consequently, the majority of the over 50,000 fatalities were among citizens who were sleeping at home. Although the second earthquake also caused significant destruction, the loss of life was considerably lower because people were reluctant to re-enter their homes at that time. Therefore, in this study, the term Kahramanmaraş earthquake specifically refers to the first earthquake.
For this reason, the spectra of the first earthquake were determined as the target spectra in this study. Almost all major earthquakes in Turkey result in a significant loss of life. This situation either indicates that the regulations are insufficient or shows that the buildings constructed are not built in accordance with the regulations, regardless of whether they are new or old. Two scenarios were considered in this study. Firstly, the impact of the earthquake on buildings in the region very close to the epicenter (Repi = 13.83 km) was investigated, including the validity of the regulations and the extent to which old and new buildings collapsed. Secondly, the study examined how buildings in a settlement relatively far from the epicenter (Repi = 55.32 km) were affected by the earthquake and assessed the earthquake behavior of buildings constructed in compliance with the regulations in this region. The locations of these stations are marked on the map presented in Figure 10.
The purpose of this study was to calculate the extent of destruction in both the near and distant regions, compare the findings with the situation observed in the Kahramanmaraş earthquake, and determine whether the loss of life was due to the inadequacy of the regulations or the failure to construct buildings in accordance with the regulations. The properties of the selected accelerations are presented in Table 4 for the 4615 station and Table 5 for the 4611 station. The unscaled spectra and target spectra according to TBEC-2018’s selected ground motions are given in Figure 11 and Figure 12.
In the study, both a region close to the earthquake and the region far from the earthquake were examined. For this reason, the acceleration records to be used for the near and far regions were selected in accordance with the characteristics of these regions. For station 4615, the selection criteria included earthquakes with a magnitude (Mw) greater than 6.5, an epicentral distance between 0 and 30 km, and shear wave velocities (Vs30s) between 400 and 560 m/s. For station 4611, the criteria included earthquakes with a magnitude (Mw) greater than 6.5, an epicentral distance between 40 and 70 km, and shear wave velocities (Vs30s) between 560 and 760 m/s. The relevant earthquakes were selected based on the PEER [22] strong ground motion database. Simple amplitude scaling was performed to align the averages of the selected earthquakes more closely with those of the Kahramanmaraş earthquake. The scale factors of the subjected ground motions are given in Table 6, and the scaled spectra are shown in Figure 13 and Figure 14.

3. Analyze Results and Discussion

The buildings were analyzed under 23 strong ground motions scaled according to the 4611 station and 23 scaled according to the 4615 station, and the roof displacement demands were compared with the performance points of the buildings. Within the scope of the study, 60 reinforced concrete buildings were examined and analyzed under a total of 46 strong ground motions. Nonlinear direct time history analyses were performed in a total of 2760 3D time domains (x and y simultaneously). When determining the earthquake performance of a building, those that were undamaged in both directions were evaluated as suitable for immediate occupancy overall. If the damage was greater in one direction than the other, the greater damage was used to determine the performance state of the building. For example, if a building is rated as IO in the X direction and LS in the Y direction, the performance of that building is evaluated as LS. Table 7 shows the percentage of each level of performance evaluated in the total of the investigated structures.
In the nonlinear time history analyses, the results were not limited to the evaluation of performance levels alone; instead, this study incorporated additional statistical assessments. In this context, the seismic demands obtained from the analytical models of reinforced concrete buildings were further examined through detailed statistical analyses, and the adequacy of these building models for such evaluations is discussed. As part of this assessment, the first analysis focuses on the discussion of fragility curves representing the vulnerability of the Turkish reinforced concrete building stock.
To determine the cumulative probability of exceedance curves [23] for each damage state, drift ratios were obtained and sorted in ascending order to represent the range of structural responses. The lowest and highest drift ratios in each dataset correspond to exceedance probabilities of 100% and 0%, respectively [24], and are presented in Figure 15 and Figure 16.
Exceedance probabilities for the identified damage levels were determined by plotting the data obtained from Equation (2). The y-axes of these graphs represent the probabilities, while the 
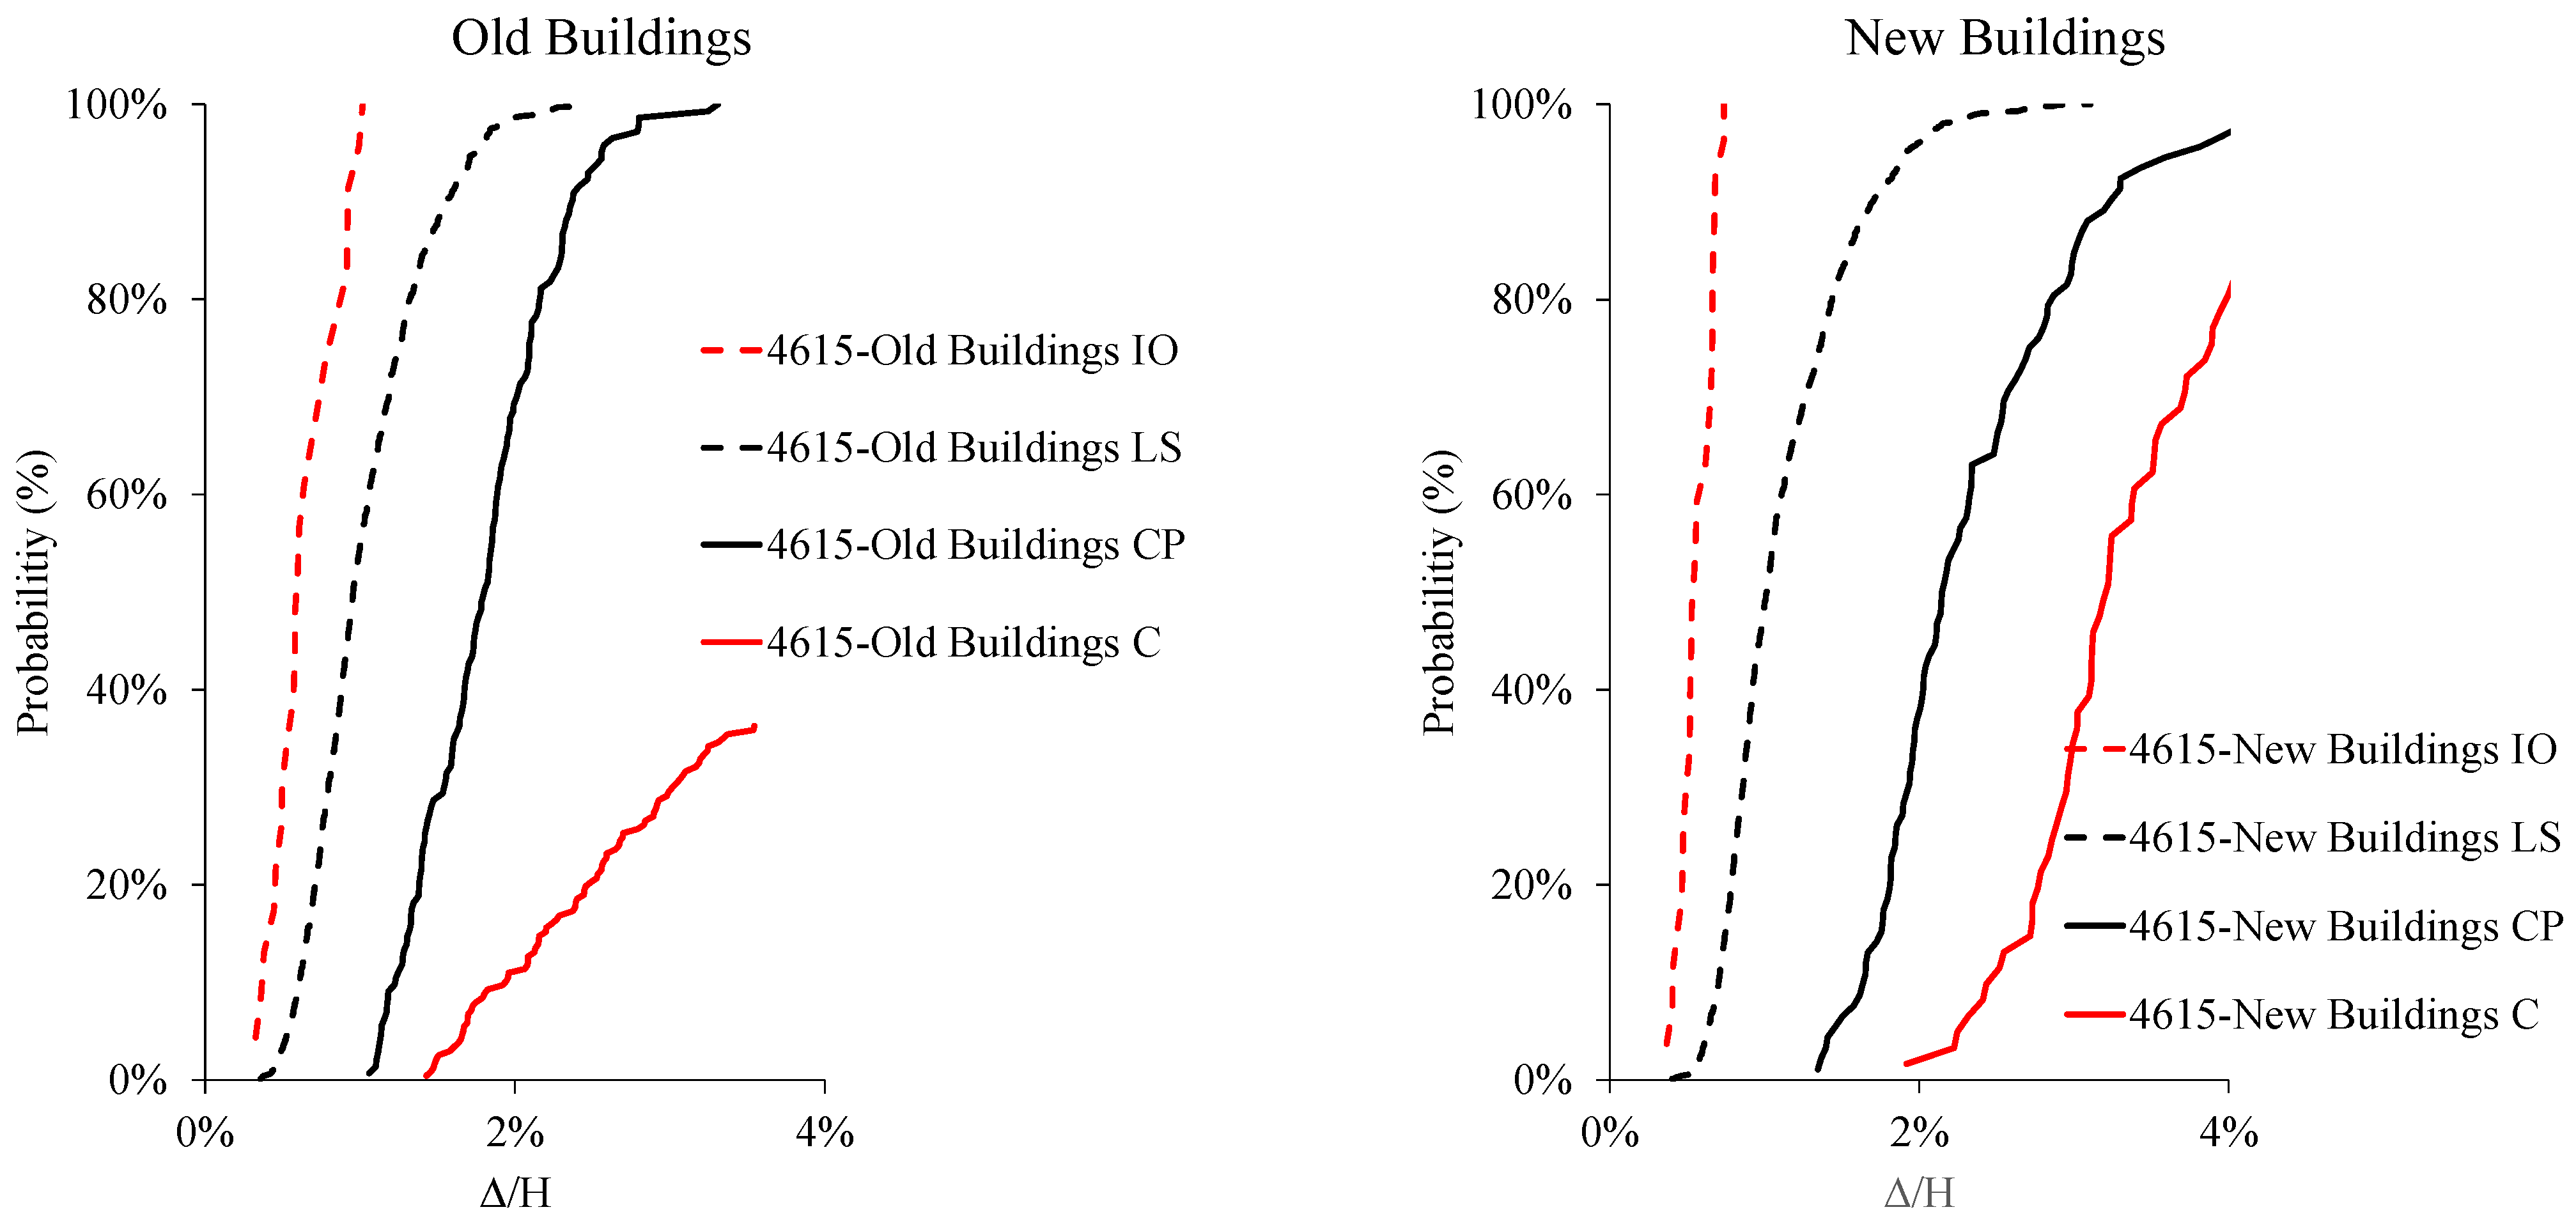
x-axes show the ratios of the obtained displacement demands to the heights of the subjected structures. The procedure followed here involved obtaining displacements at specific damage levels from the examined building groups. These displacements were then plotted in ascending order based on the corresponding exceedance probabilities. In this context, the older buildings and the 4615 station are represented on the left side of Figure 15. The immediate occupancy threshold for these older buildings is observed to be 0.75% at this station. In other words, for the examined empirical reinforced concrete structures, the immediate occupancy limit corresponds to 0.75% of the total building height. Displacement values exceeding this threshold will result in increased damage levels. In the TEC-1975 buildings and at station 4615 the thresholds of these limits are 0.75% for immediate occupancy (IO), 1.75% for Life Safety (LS), 2.5% for Collapse Prevention (CP), and 3.5% for total collapse (C). Although these limits show similar values for station 4615 in the case of new buildings, the new buildings demonstrate superior performance compared to older buildings. Even when subjected to larger deformations (Δ/H), they exhibit lower probabilities of damage and higher levels of durability. In contrast, older buildings reach higher probabilities of damage more rapidly, particularly at lower deformation levels. This highlights a significant improvement in the seismic performance of newer structures.
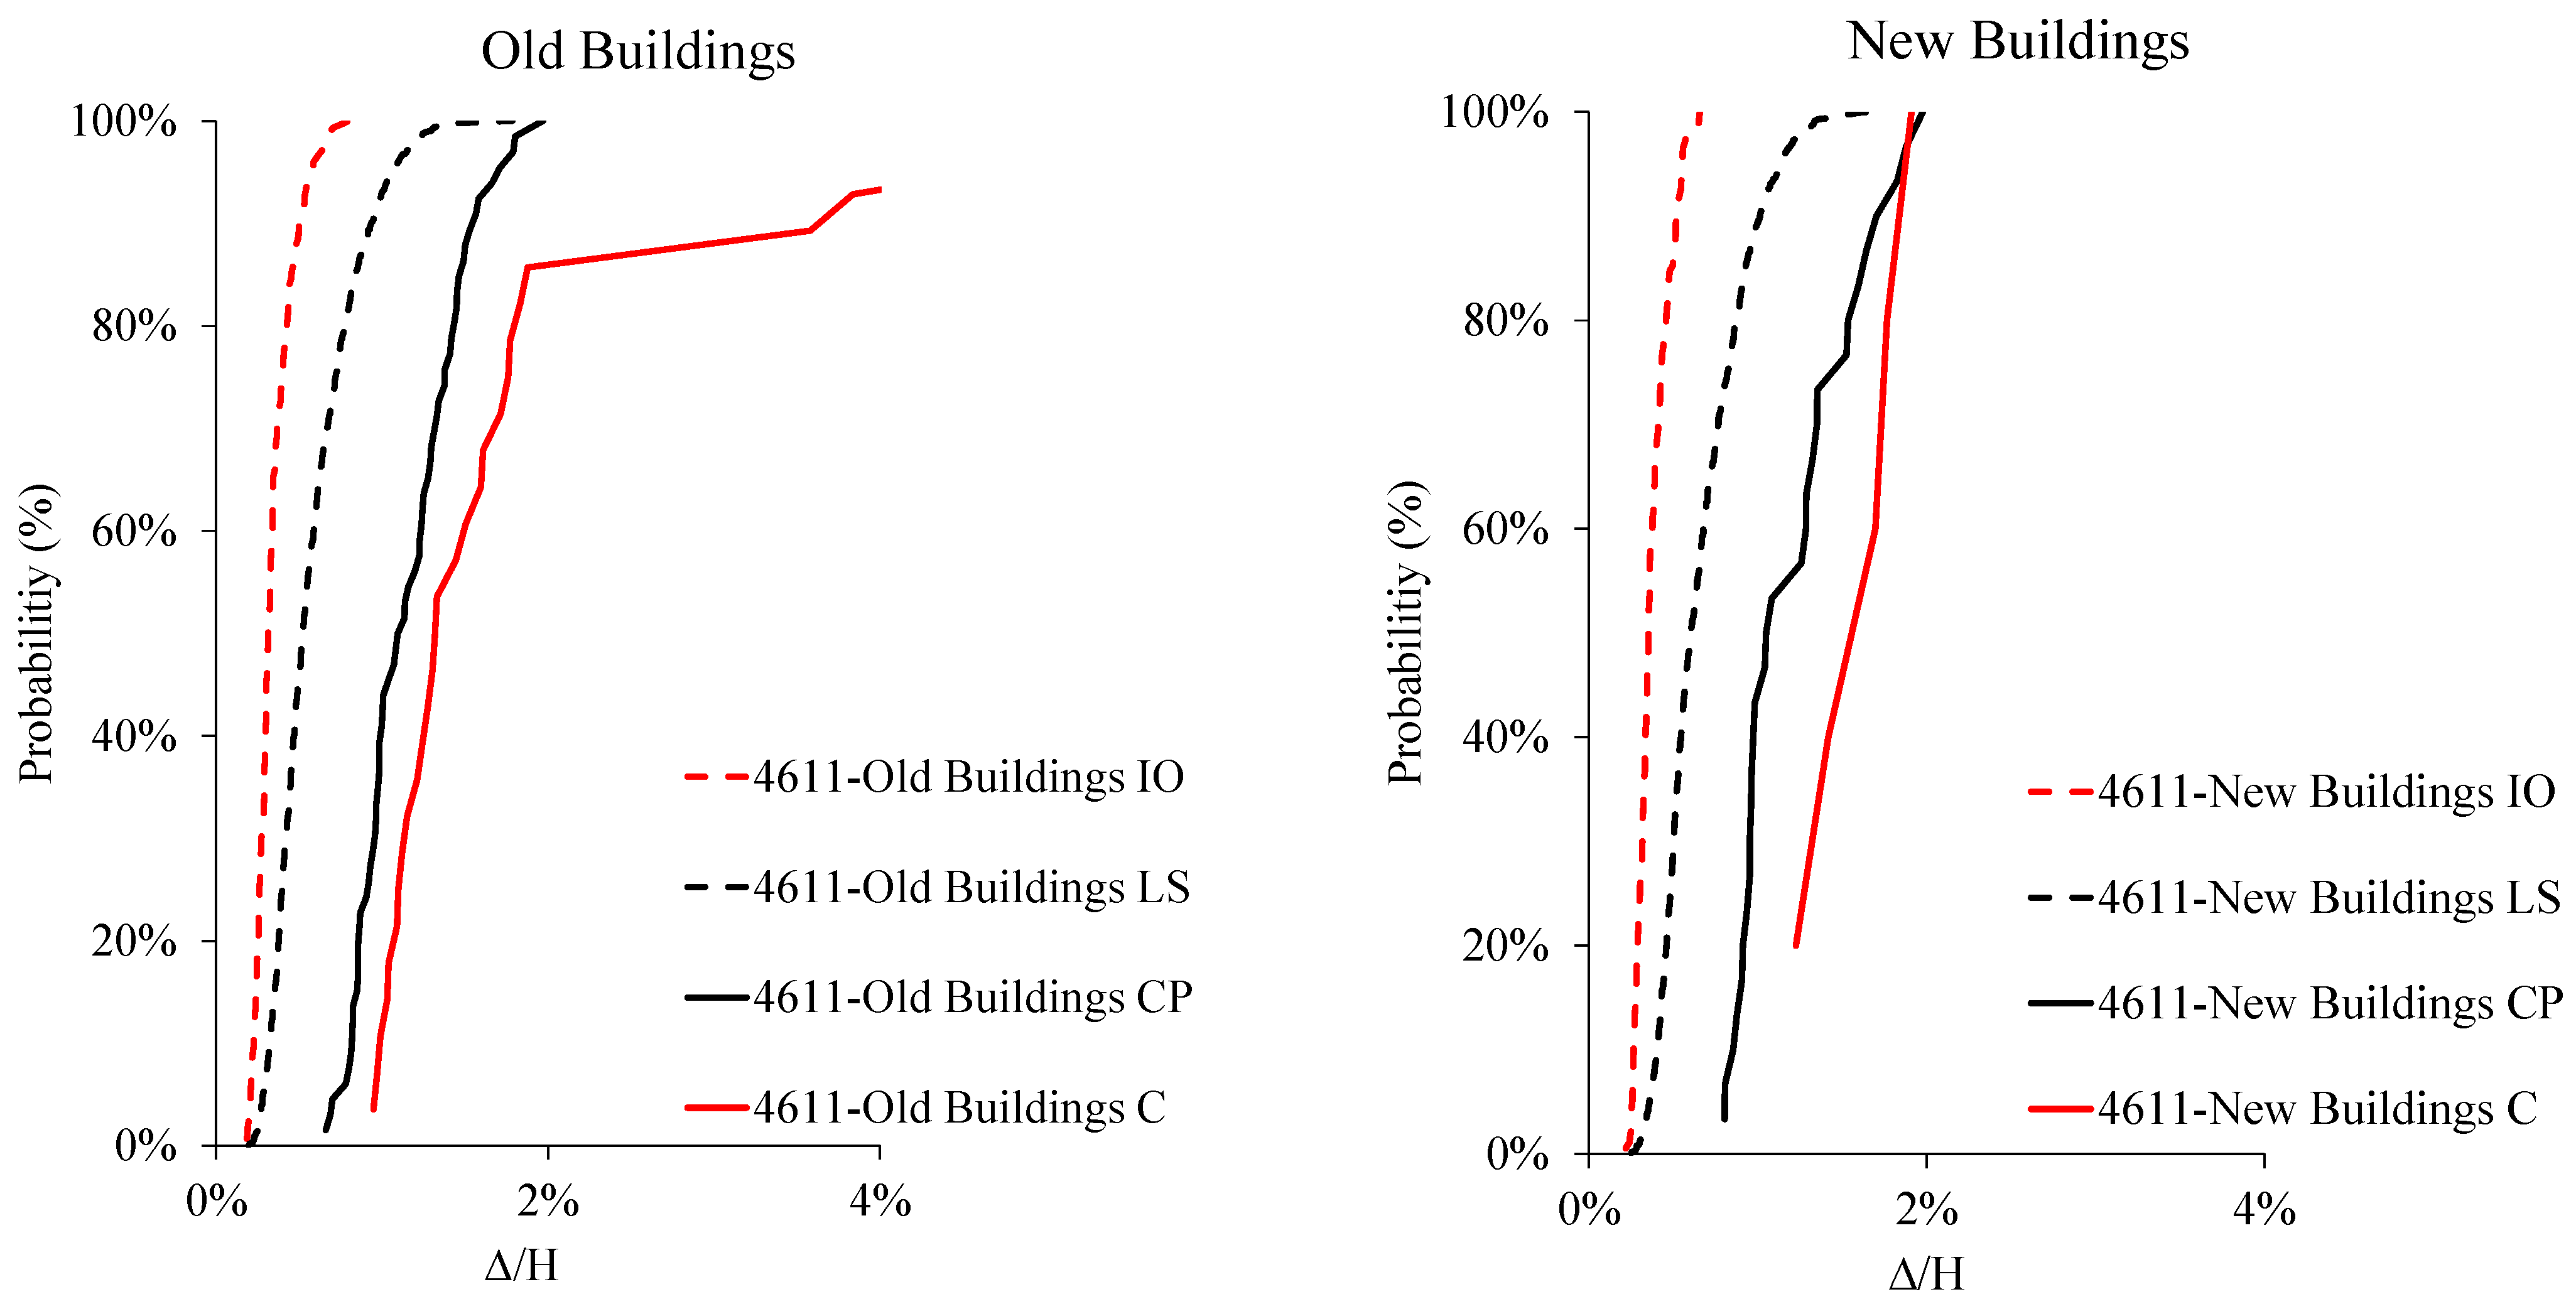
Figure 16 compares the performance levels of old and new buildings for the 4611 station, with older buildings represented on the left and newer buildings on the right. In both graphs, probability distributions are presented based on various performance levels along (Δ/H) and probability. For older buildings, the probability of damage at the immediate occupancy (IO) level rapidly reaches 100% at very small Δ/H values (0.2–0.3%). In contrast, new buildings achieve this probability at larger Δ/H values. At the Life Safety (LS) level, older buildings reach 100% probability at smaller deformation levels, whereas new buildings can withstand greater deformations before reaching this threshold. At the Collapse Prevention (CP) level, older buildings reach a 100% probability of exceedance at approximately 1% of Δ/H, whereas newer buildings reach this threshold at a higher drift ratio of around 1.5% of Δ/H. At the collapse (C) level, older buildings exhibit a higher probability of collapse at lower drift demands, while newer buildings demonstrate greater deformation capacity, with drift ratios exceeding 2% of Δ/H. In summary, new buildings demonstrate significantly greater resistance to both small and large deformations compared to older buildings, clearly illustrating the effectiveness of the updated building regulations in enhancing earthquake safety.
Previous studies such as ref. [25], as well as the current study, indicate that the destructiveness of earthquakes increases in regions closer to the earthquake’s focal point. Therefore, evaluating this earthquake solely based on data from either station 4615 or station 4611 would result in inaccurate data interpretation. To properly assess the province of Kahramanmaraş, this study selected two stations: station 4615, which was closer to the earthquake’s focal point than Kahramanmaraş, and another station that was farther away. The average performance of the buildings at these two stations was used to determine the overall building performance in the region. Kahramanmaraş province was approximately 40 km away from the epicenter of the earthquake. This distance can be considered an average of the two selected stations (13.83 km/2 + 55.32 km/2 = 34.575 km, for station 4615 and station 4611, respectively). In this way, it was believed that the destruction in the province of Kahramanmaraş would be represented more realistically. The evaluated performance levels of the investigated structures are given in Table 8 and presented in Figure 17.
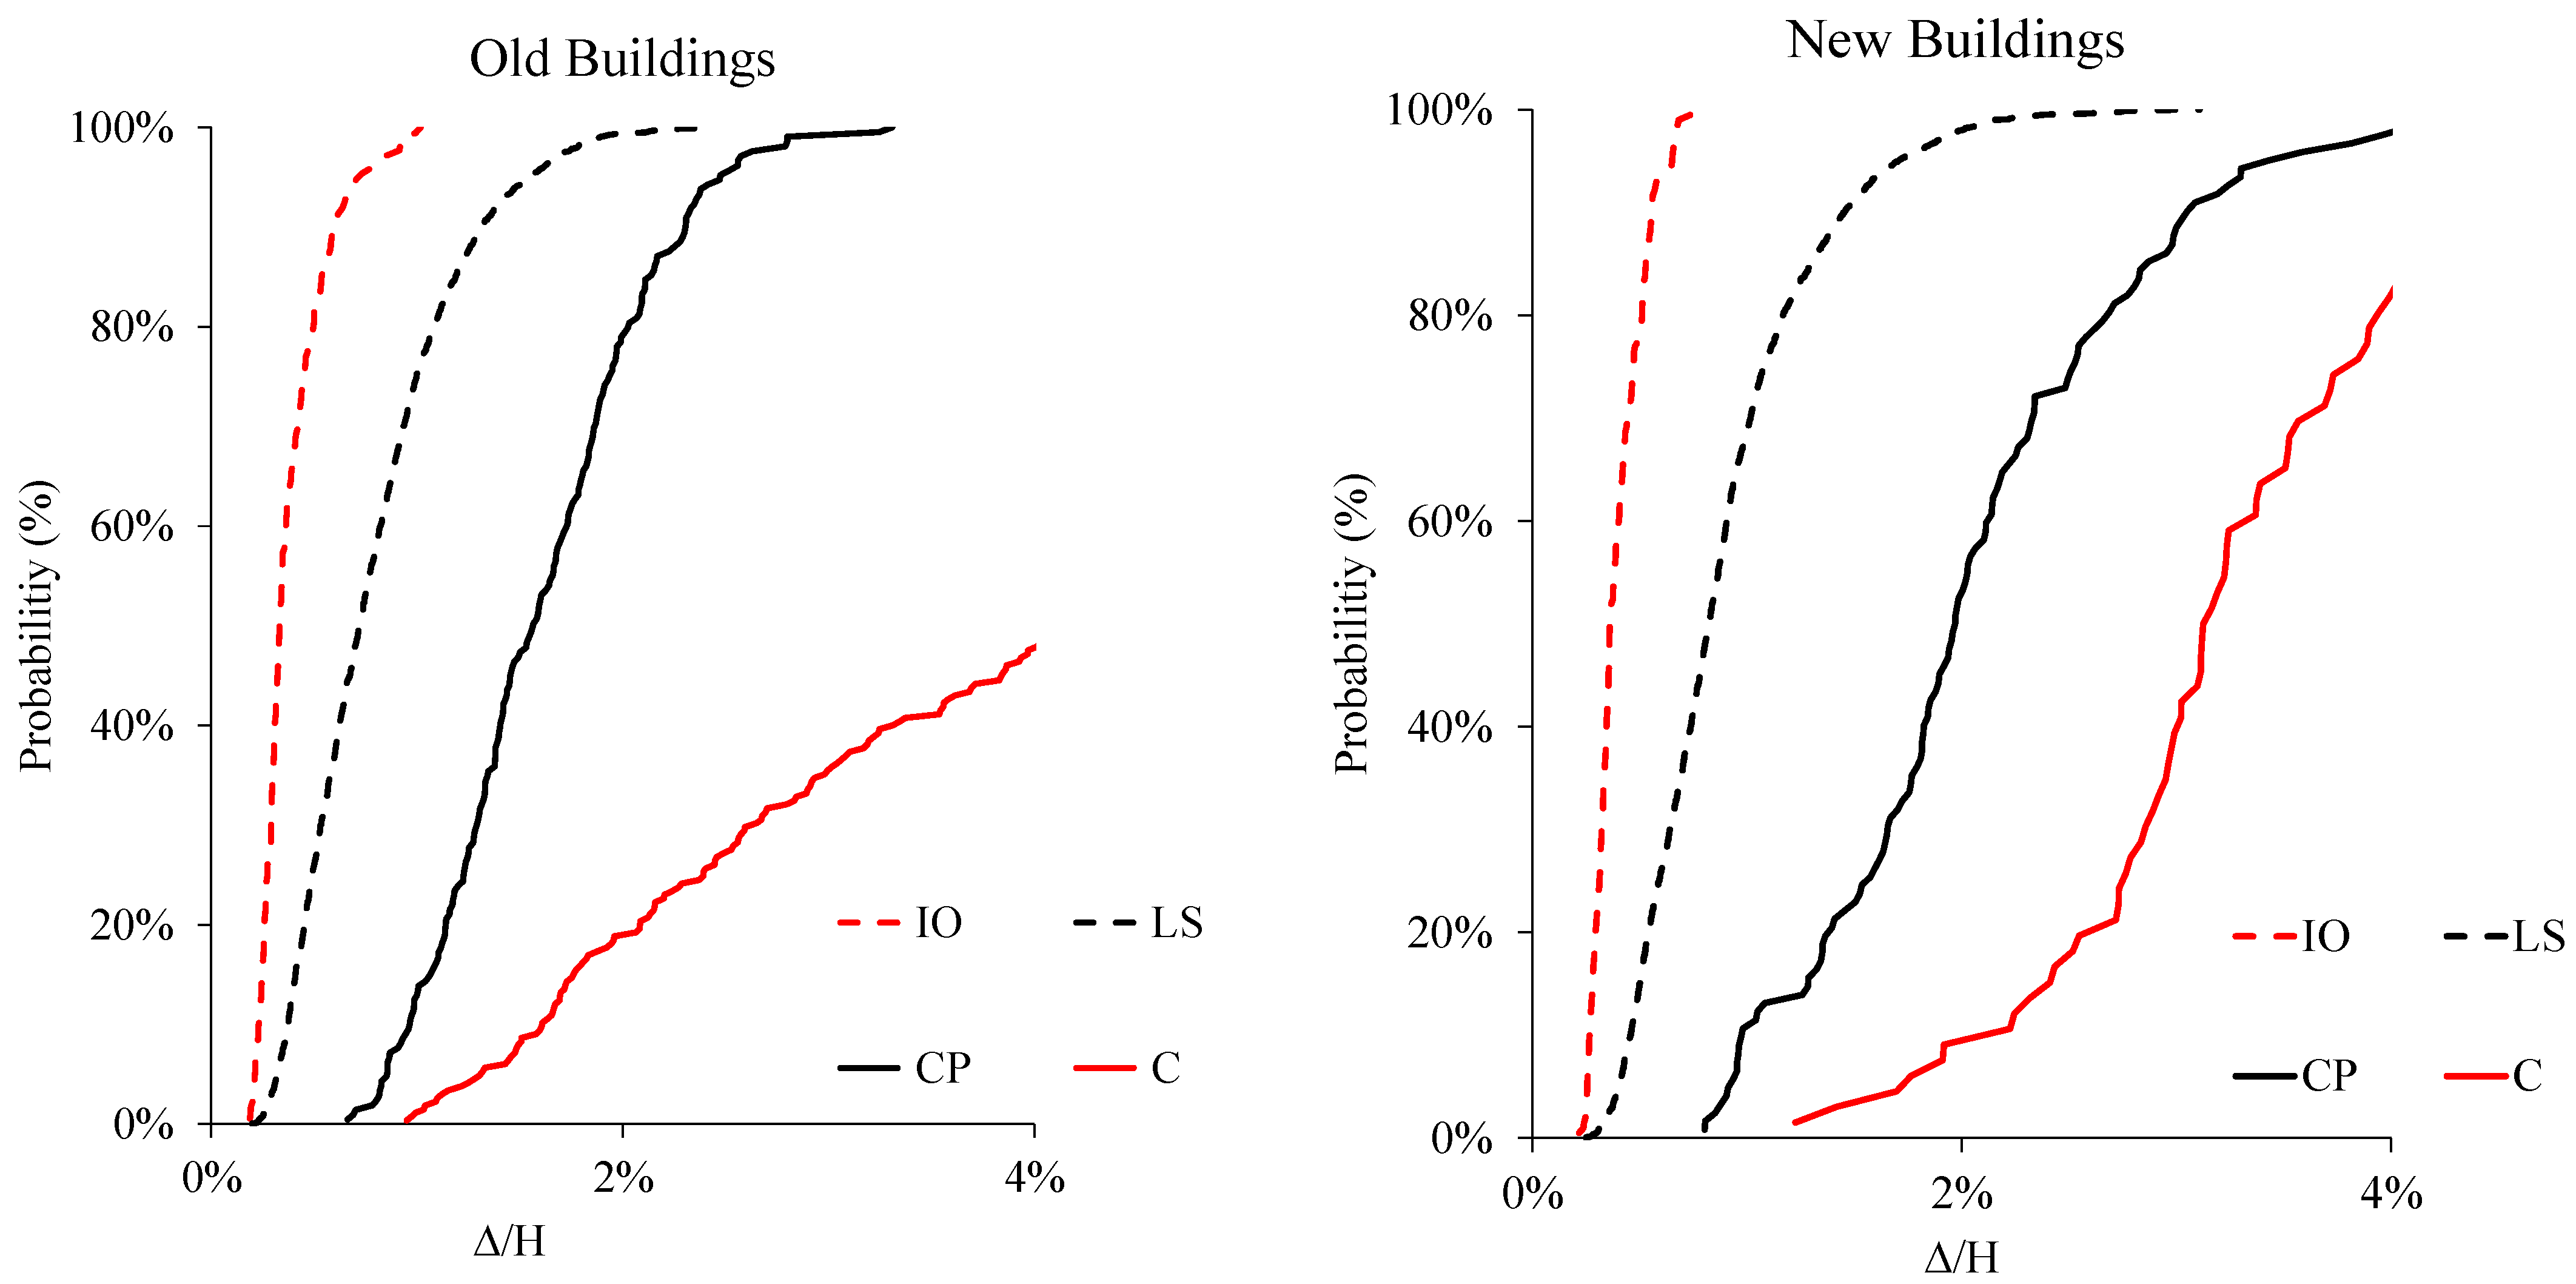
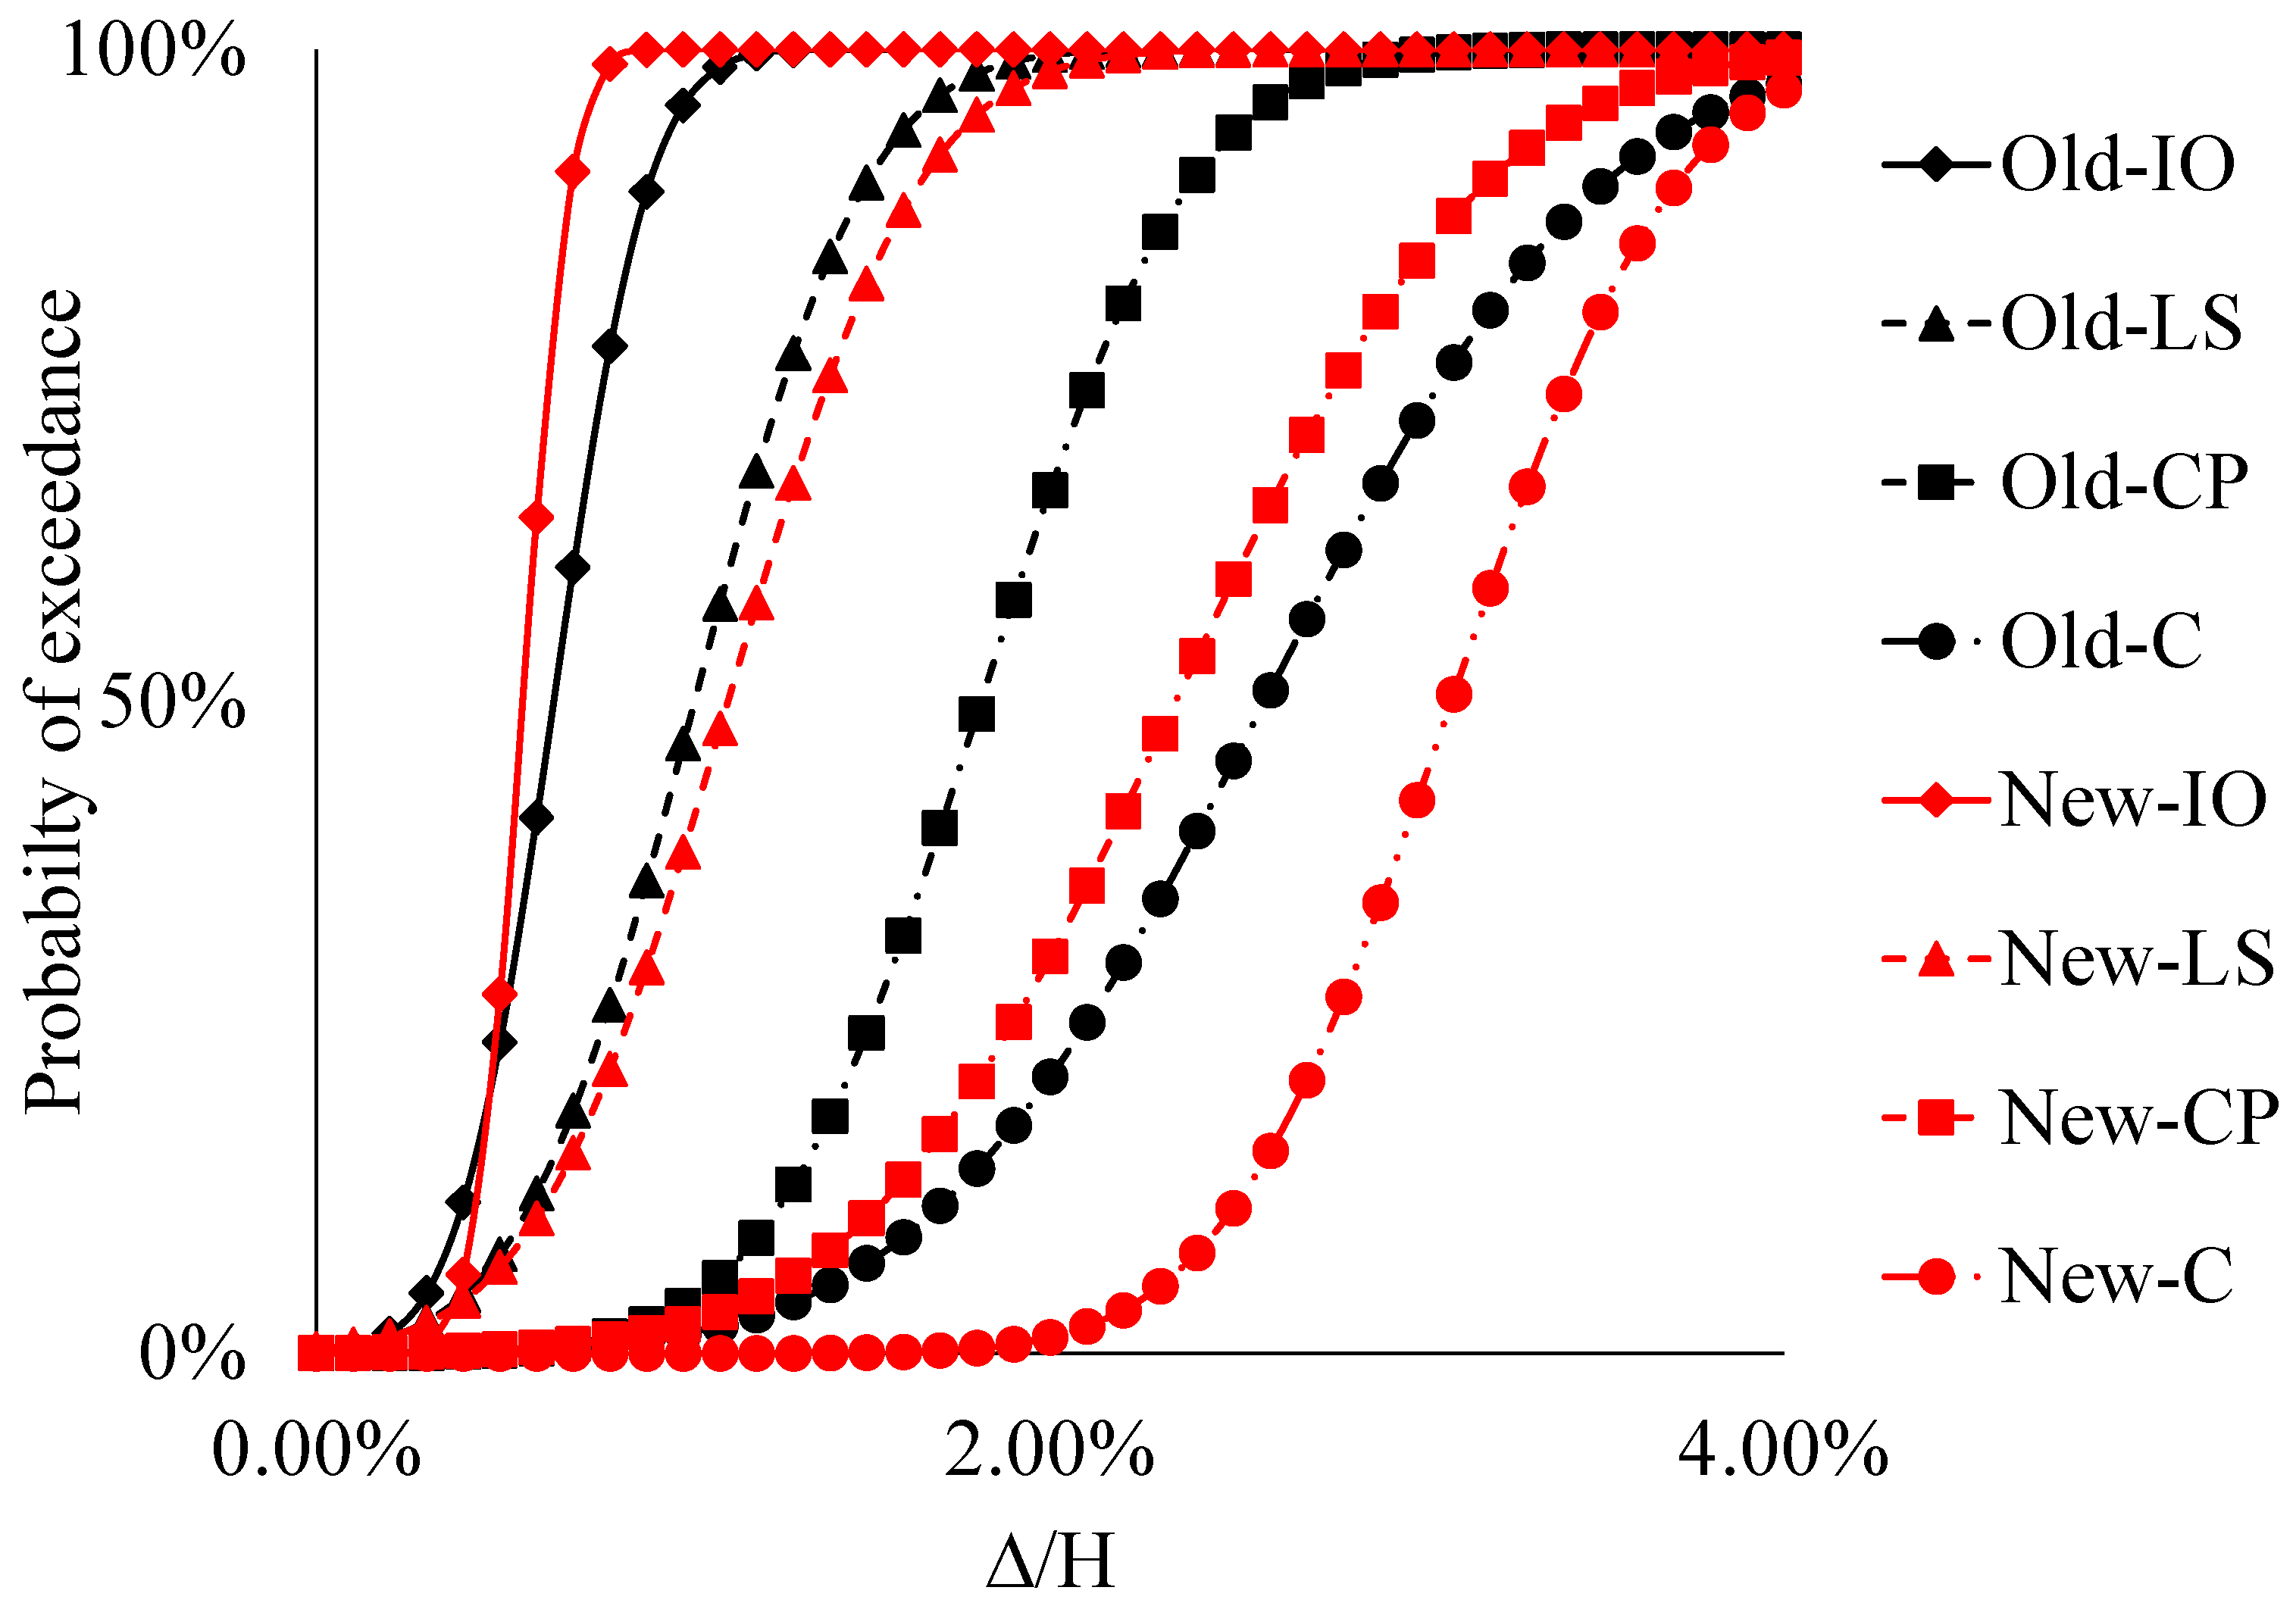
Figure 18 compares the probability distributions of the old and new buildings across different performance levels. The graph on the left represents older buildings, while the graph on the right represents newer buildings. For older buildings, the immediate occupancy (IO) level quickly reaches 100% probability at small Δ/H values (below 0.5%), whereas in newer buildings, this level is attained at slightly larger Δ/H values (around 0.7%). At the Life Safety (LS) level, older buildings reach a 100% probability at approximately 1% Δ/H, while newer buildings can withstand deformations up to 1.5%. Similarly, at the Collapse Prevention (CP) level, older buildings quickly reach 100% probability with smaller deformations, while newer buildings reach this level at higher Δ/H values (2–2.5%). A comparable trend is observed at the collapse (C) level, as older buildings reach 100% probability at around 3% Δ/H, whereas newer buildings can tolerate deformations up to 4%. Overall, newer buildings demonstrate greater durability than older buildings across all performance levels and provide enhanced safety against larger deformations.
The fragility curves [26,27,28] presented in Figure 17 were developed using a lognormal cumulative distribution function (CDF) to estimate the probability of exceeding specific damage states, with the normalized roof drift demand (Δ/H) used as the engineering demand parameter (EDP) [29]. The fragility function is formulated based on Equation (3) and shown in Figure 17.
P ( D > S i I M ) = Φ ln ( I M ) ln ( µ ) σ
In this context, P represents the probability of structural damage (D) exceeding a given damage state (Si); Φ denotes the standard normal cumulative distribution function; IM is the selected intensity measure value; σ is the lognormal standard deviation; and µ is the mean of the natural logarithm of the seismic intensity measure.
Based on the nonlinear time history analyses conducted, a demand-to-capacity comparison was carried out for each building evaluated within the scope of the study, and the percentage distribution of building performance levels is presented in Table 7. Following this, the results were compared with findings from field studies reported in the literature on the 6 February 2023 Kahramanmaraş earthquakes, and the outcomes were discussed accordingly.

3.1. Comparison of Analytical Results with Field Observations Reported by Yılmaz et al. [30]

Yilmaz et al. [30] conducted a comprehensive field investigation across the 11 most affected provinces, documenting the distribution of damage levels observed in residual reinforced concrete buildings. The analytical results obtained from the current study are com-pared with the findings of Ref. [30] in Table 9. When the damage classifications reported in their study are grouped into two main categories—(1) collapsed, heavily damaged, and moderately damaged, and (2) no damage and slightly damaged—and compared with the analytical results obtained in the presented study, it becomes evident that the Turkish building stock did not meet the expected seismic performance levels during this earthquake, especially for buildings up to six stories. In fact, a performance gap of nearly 100% is observed in some cases.
For three-story buildings, the analytical model estimated 94.24% of buildings to experience no or slight damage, compared to the 90.73% observed in the field. For four- to six-story buildings, the calculated rate of no or slight damage was 89.02%, while field observations indicated a rate of 81.17%. For moderately to heavily damaged structures, the calculated damage ratio was 5.76% for three-story buildings and 10.98% for 4–5–6-story buildings. In contrast, the observed field study reported significantly higher values, with rates of 9.27% for 1–2–3-story structures and 18.83% for 4–5–6-story structures. The comparison between the analytically calculated moderate-to-collapse damage ratios and those observed in the field for these buildings raises serious concerns regarding their code compliance and structural adequacy.
However, for buildings with seven or more stories, a reverse trend is noted. While the analytical model predicted a higher level of damage (16.63% moderate to complete damage), field observations reported only 14.85%. This discrepancy is likely due to the exclusion of shear walls from the analytical models used in this study, previously discussed as a limitation for this group of structures. The omission of shear walls, which are known to significantly enhance lateral strength and deformation capacity in taller RC buildings, likely resulted in more conservative (i.e., worse) analytical outcomes compared to real-world observations.

3.2. Comparison of Analytical Results with Field Observations Reported by Mertol et al. [3]

Mertol et al. [3] explicitly reported the number of collapsed buildings in the province of Kahramanmaraş based on their field observations conducted after the earthquake. According to their sources [3] and the Kahramanmaraş and Hatay Earthquake Reports [31], the total number of residual buildings in the province of Maras is understood to be 243,153 [32]. The percentage of reinforced concrete buildings in Turkey is 86.7% of the total building stock according to the Kahramanmaraş and Hatay Earthquake Reports, totaling of 210,814 reinforced concrete structures. Among these, buildings constructed between 1981 and 2000 constitute 26.9% of the total (amounting to 56,709 old buildings), while buildings constructed after 2001 account for 58.1% of the total (amounting to 122,483 new buildings). The present study was conducted with the aim of analytically demonstrating that these observed collapse ratios are not consistent with current code requirements, thereby providing evidence of significant code noncompliance within the existing building stock. To fulfill this purpose, the number of 48,756 collapsed or severely damaged buildings in the official data (which is not divided into old and new) was compared with the analytically calculated rates. The results obtained from this analysis indicate that 17.17% (7.57% + 9.60%) of the old buildings and 6.82% (4.86% + 1.96%) of the new buildings were heavily damaged or destroyed. When these percentages are applied to the 56,709 old buildings and 122,483 new buildings in the province of Kahramanmaraş, it is found that approximately 9737 old buildings and 8353 new buildings were heavily damaged or destroyed, totaling 18,090 buildings. Unfortunately, this figure does not come close to the actual situation of 48,756 buildings being severely damaged or destroyed. Although the second earthquake also contributed to the higher number of collapsed buildings in reality, this alone does not fully explain the difference. Although the calculation itself is straightforward, this comparison was conducted to emphasize the destructive implications of the ratios presented in Section 3.1, which were calculated to be nearly twice as high.

3.3. Key Findings of This Study

In this study, analytical building models were developed to represent the Turkish reinforced concrete building stock, and their lateral displacement capacities were compared with those reported in prior research focused on typical Turkish buildings [27]. These models were then subjected to three-dimensional nonlinear time history analyses in both principal directions to obtain realistic displacement demands. For each building, demand-to-capacity comparisons were conducted to determine seismic performance levels, with the overarching goal of addressing the following question: how would these residual RC buildings have performed if they had been designed in accordance with current seismic codes?
When the analytical findings were compared to post-earthquake field observations, notable discrepancies were identified. In particular, the calculated performance levels and the estimated number of collapsed or heavily damaged buildings were significantly lower, by nearly a factor of two, than those observed in the field. This consistent underestimation underscores the conclusion that the existing building stock does not meet the performance expectations set by modern design codes. Accordingly, this study was undertaken to provide analytical support for the field-based evidence pointing to widespread code noncompliance within the Turkish building stock.

4. Conclusions

Sixty residential buildings, representing the Turkish building stock, including old and new three-, four-, five-, six-, seven-, and eight-story buildings designed according to TEC-1975 and TEC-1998, were evaluated according to the TEC-2018 regulations under 23 acceleration records from both near and far regions, with a focus on records closely matching the average conditions of the Kahramanmaraş earthquake. The obtained results are summarized below. In this study, no structural irregularities were designed, but it was assumed that such calculations could be performed with proper engineering.
Our analytical results revealed that buildings designed according to TEC-1998 demonstrated significantly better seismic performance than those designed under TEC-1975. These newer buildings reached damage thresholds at higher drift ratios and exhibited lower collapse probabilities overall.
The overall collapse rate across all motions and both stations was 9.6% for old buildings and 1.96% for new buildings. This difference underscores the significant role of code improvements in enhancing structural performance.
When compared to field observations [26], the analytical collapse and heavy damage rate for three-story buildings was calculated as 5.76%, whereas field data reported a higher value of 9.27%, indicating a noticeable underestimation in the numerical model. Similarly, for mid-rise buildings (4–6 stories), the analytical damage ratio (10.98%) was nearly half of the observed rate (18.83%), suggesting that real-world factors such as noncompliance with seismic codes, poor construction practices, or unmodeled irregularities likely contributed to the more severe outcomes. In contrast, for 7–8-story buildings, the analytical collapse ratio (16.63%) slightly exceeded the observed collapse ratio of 14.85%, which may be attributed to the exclusion of shear walls in the analytical models, elements that typically enhance the lateral stiffness and capacity of taller reinforced concrete buildings. A similar conclusion can be drawn from the findings of Ref. [3], who reported that, out of 210,814 reinforced concrete buildings in the province of Kahramanmaraş, approximately 48,756 structures either collapsed or were severely damaged, corresponding to a damage rate of around 23%. This value is significantly higher than the analytical estimates of this study, reinforcing the argument that widespread code violations and construction deficiencies played a critical role in the observed destruction.
This study was conducted to demonstrate that the devastating consequences of the first mainshock of the Kahramanmaraş (Pazarcık-centered) earthquake, which resulted in over 50,000 fatalities, could have been significantly reduced if the existing buildings had been constructed in full compliance with the relevant seismic codes. Although structural irregularities, soil–structure interaction (SSI), and other complex factors were not explicitly modeled, these findings are still sufficient to underscore the seriousness of the current vulnerability in the building stock. These additional aspects should be addressed in future studies to further refine the accuracy and applicability of seismic performance assessments.
In summary, this study supports the conclusion that, although Turkish seismic codes have evolved to be more robust, widespread noncompliance, especially in older structures, remains a critical issue. Moreover, empirical fragility models such as those developed here can play a key role in understanding and mitigating seismic risk across varying structural types and regions.

Author Contributions

Conceptualization, I.O.; methodology, I.O.; software, I.O.; validation, I.O.; formal analysis, I.O.; investigation, I.O.; writing, I.O. and M.O.; supervision, I.O. All authors have read and agreed to the published version of the manuscript.

Funding

This research received no external funding.

Institutional Review Board Statement

Not applicable.

Informed Consent Statement

Not applicable.

Data Availability Statement

The original contributions presented in this study are included in the article. Further inquiries can be directed to the corresponding author.

Conflicts of Interest

The authors declare no conflict of interest.

References

  1. İnce, O. Structural damage assessment of reinforced concrete buildings in Adıyaman after Kahramanmaraş (Türkiye) Earthquakes on 6 February 2023. Eng. Fail. Anal. 2024, 156, 107. [Google Scholar] [CrossRef]
  2. Avcil, F.; Işık, E.; İzol, R.; Büyüksaraç, A.; Arkan, E.; Arslan, M.H.; Aksoylu, C.; Eyisüren, O.; Harirchian, E. Effects of the February 6, 2023, Kahramanmaraş earthquake on structures in Kahramanmaraş city. Nat. Hazards. 2024, 120, 2953–2991. [Google Scholar] [CrossRef]
  3. Mertol, H.C.; Tunç, G.; Akış, T.; Kantekin, Y.; Aydın, İ.C. Investigation of RC buildings after 6 February 2023, Kahramanmaraş, Türkiye earthquakes. Buildings 2023, 13, 1789. [Google Scholar] [CrossRef]
  4. Aydogdu, H.H.; Demir, C.; Comert, M.; Kahraman, T.; Ilki, A. Structural Characteristics of the Earthquake-Prone Building Stock in Istanbul and Prioritization of Existing Buildings in Terms of Seismic Risk-A Pilot Project Conducted in Istanbul. J. Earthq. Eng. 2024, 28, 1660–1684. [Google Scholar] [CrossRef]
  5. Sianko, I.; Ozdemir, Z.; Hajirasouliha, I.; Pilakoutas, K. Probabilistic seismic risk assessment framework: Case study Adapazari, Turkey. Bull. Earthq. Eng. 2023, 21, 3133–3162. [Google Scholar] [CrossRef]
  6. Ozturk, M.; Arslan, M.H.; Dogan, G.; Ecemis, A.S.; Arslan, H.D. School buildings performance in 7.7 Mw and 7.6 Mw catastrophic earthquakes in southeast of Turkey. J. Build. Eng. 2023, 79, 107810. [Google Scholar] [CrossRef]
  7. Altunsu, E.; Güneş, O.; Öztürk, S.; Sorosh, S.; Sarı, A.; Beeson, S.T. Investigating the structural damage in Hatay province after Kahramanmaraş-Türkiye earthquake sequences. Eng. Fail. Anal. 2024, 157, 107857. [Google Scholar] [CrossRef]
  8. Turkish Earthquake Code. Specifications for Buildings to Be Built in Seismic Areas; Ministry of Public Works and Settlement: Ankara, Turkey, 1975. (In Turkish) [Google Scholar]
  9. TEC. Turkish Earthquake Code; Ministry of Public Works and Settlement: Ankara, Turkey, 1998. (In Turkish) [Google Scholar]
  10. TBEC. Turkish Building Earthquake Code; Ministry of Environment and Urban Planning: Ankara, Turkey, 2018. (In Turkish) [Google Scholar]
  11. SAP2000, v23.3.1 Ultimate; Computers and Structures, Inc.: Berkeley, CA, USA, 2021.
  12. Bal, İ.E.; Crowley, H.; Pinho, R.; Gülay, F.G. Detailed assessment of structural characteristics of Turkish RC building stock for loss assessment models. Soil. Dyn. Earthq. Eng. 2008, 28, 914–932. [Google Scholar] [CrossRef]
  13. Kamal, M.; Inel, M. Simplified approaches for estimation of required seismic separation distance between adjacent reinforced concrete buildings. Eng. Struct. 2022, 252, 113610. [Google Scholar] [CrossRef]
  14. Abdel Raheem, S.E.; Ahmed, M.M.M.; Ahmed, M.M.; Abdel-Shafy, A.G.A. Evaluation of plan configuration irregularity effects on seismic response demands of L-shaped MRF buildings. Bull Earthq. Eng. 2018, 16, 3845–3869. [Google Scholar] [CrossRef]
  15. Code, P. Eurocode 8: Design of structures for earthquake resistance. Part 1: General Rules, seismic actions and rules for buildings. Bruss. Eur. Comm. Stand. 2005, 10. [Google Scholar]
  16. Carvalho, G.; Bento, R.; Bhatt, C. Nonlinear static and dynamic analyses of reinforced concrete buildings-comparison of different modelling approaches. Earthq. Struct. 2013, 4, 451–470. [Google Scholar] [CrossRef]
  17. Inel, M.; Ozmen, H.B.; Bilgin, H. Re-evaluation of building damage during recent earthquakes in Turkey. Eng. Struct. 2008, 30, 412–427. [Google Scholar] [CrossRef]
  18. Meral, E.; İnel, M. Evaluation of structural parameters properties of low and mid-rise reinforced concrete buildings. Pamukkale Univ. J. Eng. Sci. 2016, 22, 468–477. [Google Scholar] [CrossRef]
  19. Ozmen, H.B.; Inel, M.; Senel, S.M.; Kayhan, A.H. Load carrying system characteristics of existing Turkish RC building stock. Int. J. Civ. Eng. 2015, 13, 76–91. [Google Scholar] [CrossRef]
  20. Newmark, N.M. A method of computation for structural dynamics. J. Eng. Mech. Div. 1959, 85, 67–94. [Google Scholar] [CrossRef]
  21. AFAD. Available online: https://tadas.afad.gov.tr/list-station (accessed on 18 January 2024).
  22. PEER (Pacific Earthquake Engineering Research Center). Strong Ground Motion Database. 2021. Available online: http://peer.berkeley.edu (accessed on 12 November 2023).
  23. Ruiz-Garcia, J.; Miranda, E. Probabilistic estimation of residual drift demands for seismic assessment of multi-story framed buildings. Eng. Struct. 2010, 32, 11–20. [Google Scholar] [CrossRef]
  24. Oz, I.; Senel, S.M.; Palanci, M.; Kalkan, A. Effect of soil-structure interaction on the seismic response of existing low and mid-rise RC buildings. Appl. Sci. 2020, 10, 8357. [Google Scholar] [CrossRef]
  25. Tani, S.; Nakashima, M. Earthquake damage to earth dams in Japan—Maximum epicentral distance to cause damage as a function of magnitude. Soil. Dyn. Earthq. Eng. 1999, 18, 593–602. [Google Scholar] [CrossRef]
  26. Ali, A.; Zhang, C.; Bibi, T.; Sun, L. Experimental investigation of sliding-based isolation system with re-centering functions for seismic protection of masonry structures. Structures 2024, 60, 105871. [Google Scholar] [CrossRef]
  27. Long, X.; Iyela, P.M.; Su, Y.; Atlaw, M.M.; Kang, S.B. Numerical predictions of progressive collapse in reinforced concrete beam-column sub-assemblages: A focus on 3D multiscale modeling. Eng. Struct. 2024, 315, 118485. [Google Scholar] [CrossRef]
  28. Huang, H.; Guo, M.; Zhang, W.; Huang, M. Seismic behavior of strengthened RC columns under combined loadings. J. Bridge Eng. 2022, 27, 05022005. [Google Scholar] [CrossRef]
  29. Forcellini, D. Analytical fragility curves of shallow-founded structures subjected to Soil-Structure Interaction (SSI) effects. Soil. Dyn. Earthq. Eng. 2021, 141, 106487. [Google Scholar] [CrossRef]
  30. Yilmaz, Z.; Can Altunişik, A.; Taciroglu, E.; Günaydin, M.; Okur, F.Y.; Sunca, F.; Şişman, R.; Aslan, B.; Sezdirmez, T. Regional Building Damage Survey Data on the 2023 Kahramanmaraş, Türkiye, Earthquakes. ASCE OPEN Multidiscip. J. Civ. Eng. 2024, 2, 04024009. [Google Scholar] [CrossRef]
  31. Kahramanmaras and Hatay Earthquake Reports; Turkey Presidency of Strategy and Budget: Ankara, Turkey, 2023. Available online: https://www.sbb.gov.tr/2023-Kahramanmaras-ve-hatay-depremleri-raporu/ (accessed on 5 June 2024).
  32. Building and Housing Survey. 2021. Available online: https://data.tuik.gov.tr (accessed on 12 June 2024).
Figure 1. Sample floor plan of theoretical building created in study.
Applsci 15 05554 g001
Figure 2. Calculated natural vibration periods of buildings.
Applsci 15 05554 g002
Figure 3. Capacity curves and associated damage states for 6N3 model in X (right) and Y (left) directions.
Applsci 15 05554 g003
Figure 4. Capacity information (immediate occupancy and ultimate capacity) of 3-story buildings.
Applsci 15 05554 g004
Figure 5. Capacity information (immediate occupancy and ultimate capacity) of 4-story buildings.
Applsci 15 05554 g005
Figure 6. Capacity information (immediate occupancy and ultimate capacity) of 5-story buildings.
Applsci 15 05554 g006
Figure 7. Capacity information (immediate occupancy and ultimate capacity) of 6-story buildings.
Applsci 15 05554 g007
Figure 8. Capacity information (immediate occupancy and ultimate capacity) of 7-story buildings.
Applsci 15 05554 g008
Figure 9. Capacity information (immediate occupancy and ultimate capacity) of 8-story buildings.
Applsci 15 05554 g009
Figure 10. A map [21] showing the epicenter of the earthquake, the stations, and the province of Kahramanmaraş.
Applsci 15 05554 g010
Figure 11. Unscaled spectra and target spectrum of 4615 according to TBEC-2018.
Applsci 15 05554 g011
Figure 12. Unscaled spectra and target spectrum of 4611 according to TBEC-2018.
Applsci 15 05554 g012
Figure 13. Scaled spectra and Kahramanmaraş record of 4615 station.
Applsci 15 05554 g013
Figure 14. Scaled spectra and Kahramanmaraş record of 4611 station.
Applsci 15 05554 g014
Figure 15. Cumulative exceedance curves for new and old buildings (station 4615).
Applsci 15 05554 g015
Figure 16. Cumulative exceedance curves for new and old buildings (station 4611).
Applsci 15 05554 g016
Figure 17. Cumulative exceedance curves for new and old buildings.
Applsci 15 05554 g017
Figure 18. Fragility curves for new and old buildings.
Applsci 15 05554 g018
Table 1. Information considered when creating floor plans.
Span (m)Number of Spans in X and Y DirectionsStory Height (m)Column Dimensions (b) (m)Column Dimensions (h) (m)Beam Dimensions (b) (m)Beam Dimensions (h) (m)
2.0022.750.300.300.250.50
2.2533.000.350.350.300.60
2.5043.250.400.40
2.755 0.450.45
3.006 0.500.50
3.257 0.550.55
3.50 0.600.60
3.75 0.650.65
4.00 0.700.70
4.25 0.750.75
4.50
4.75
5.00
5.25
5.50
5.75
6.00
6.25
6.50
6.75
7.00
Table 2. The damage limits specified in TBEC-2018.
Damage LevelConcrete Limit StateSteel Limit State
Limited DamageεcLD = 0.0025 aεs = 0.0075
Significant DamageεcSD = 0.75 εcCP aεsSD = 0.75 εsCP
Collapse Prevention ε cCP = 0.0025 + 0.04 w w e ≤ 0.018 aεs = 0.4 εsu b
a Confined concrete compressive limit. b εsu = 0.12 if smooth longitudinal bars used; else, 0.08.
Table 3. Average capacity data for buildings.
Model MeanΔIO (%)ΔLS (%)ΔCP (%)Δu (%)
3sO0.30.71.52
3sN0.30.61.52
4sO0.40.91.41.9
4sN0.30.71.72.2
5sO0.30.81.41.8
5sN0.40.91.52
6sO0.30.71.21.6
6sN0.40.81.62.1
7sO0.30.61.11.4
7sN0.41.01.92.5
8sO0.20.60.81.1
8sN0.30.71.21.6
Table 4. Selected ground motion records for 4615 station.
Record Sequence NumberEarthquake NameYearStation NameMagnitudeRjb (km)Vs30 (m/s)
78San Fernando1971Palmdale Fire Station6.6124.16452.86
139Tabas, Iran1978Dayhook7.350.00471.53
164Imperial Valley061979Cerro Prieto6.5315.19471.53
739Loma Prieta1989Anderson Dam (Downstream)6.9319.90488.77
1005Northridge011994LA—Temple and Hope6.6928.82452.15
1052Northridge011994Pacoima Kagel Canyon6.695.26508.08
1083Northridge011994Sunland—Mt Gleason Ave6.6912.38402.16
1086Northridge011994Sylmar—Olive View Med FF6.691.74440.54
1208ChiChi, Taiwan1999CHY0467.6224.10442.15
1227ChiChi, Taiwan1999CHY0747.620.70553.43
1489ChiChi, Taiwan1999TCU0497.623.76487.27
1490ChiChi, Taiwan1999TCU0507.629.49542.41
1496ChiChi, Taiwan1999TCU0567.6210.48403.2
1508ChiChi, Taiwan1999TCU0727.620.00468.14
1512ChiChi, Taiwan1999TCU0787.620.00443.04
1546ChiChi, Taiwan1999TCU1227.629.34475.46
1549ChiChi, Taiwan1999TCU1297.621.83511.18
3746Cape Mendocino1992Centerville Beach Naval Fac7.0116.44459.04
3750Cape Mendocino1992Loleta Fire Station7.0123.46515.65
3759Landers1992Whitewater Trout Farm7.2827.05425.02
4031San Simeon, CA2003Templeton—1-story Hospital6.525.07410.66
4219Niigata, Japan2004NIGH016.630.49480.4
4457Montenegro, Yugoslavia1979Ulcinj—Hotel Albatros7.11.52410.35
Means7.1410.48465.87
Table 5. Selected ground motion records for 4611 station.
Record Sequence NumberEarthquake NameYearStation NameMagnitudeRjb (km)Vs30 (m/s)
293Irpinia Italy011980Torre Del Greco6.9059.63593.35
572Taiwan SMART1(45)1986SMART1 E027.3051.35671.52
774Loma Prieta1989Hayward City Hall North6.9354.97735.44
781Loma Prieta1989Lower Crystal Springs Dam dwnst6.9348.24586.08
891Landers1992Silent Valley Poppet Flat7.2850.85659.09
897Landers1992Twentynine Palms7.2841.43635.01
946Northridge011994Antelope Buttes6.6946.65572.57
1061Northridge011994Rancho Palos Verdes Hawth6.6948.02580.03
1109Kobe, Japan1995MZH6.9069.04609.00
1281ChiChi, Taiwan1999HWA0327.6242.87573.04
1284ChiChi, Taiwan1999HWA0357.6244.02677.49
1293ChiChi, Taiwan1999HWA0467.6247.79617.52
1302ChiChi, Taiwan1999HWA0577.6246.48671.52
1474ChiChi, Taiwan1999TCU0257.6252.18665.2
1786Hector Mine1999Heart Bar State Park7.1361.21624.94
1795Hector Mine1999Joshua Tree N.M. Keys View7.1350.42686.12
1836Hector Mine1999Twentynine Palms7.1342.06635.01
3955Tottori, Japan2000SMNH116.6140.07670.73
4054Bam, Iran2003Mohammad Abade Madkoon6.6046.20574.88
4893Chuetsuoki, Japan2007Toyotsu Nakano6.8061.16561.59
5218Chuetsuoki, Japan2007NGNH076.8062.96562.18
6891Darfield, New Zealand2010CSHS7.0043.60638.39
6963Darfield, New Zealand2010RPZ7.0057.37638.39
Means7.0950.80627.78
Table 6. Scale factors of subjected ground motions.
Record Sequence Number
(4615)
Scale FactorsRecord Sequence Number
(4611)
Scale Factors
SRSS-RSN-784.206SRSS-RSN-10617.538
SRSS-RSN-1391.578SRSS-RSN-11097.616
SRSS-RSN-1642.519SRSS-RSN-12812.539
SRSS-RSN-7392.704SRSS-RSN-12844.496
SRSS-RSN-10053.470SRSS-RSN-12934.761
SRSS-RSN-10522.101SRSS-RSN-13024.270
SRSS-RSN-10834.065SRSS-RSN-14746.830
SRSS-RSN-10860.907SRSS-RSN-17864.510
SRSS-RSN-12083.651SRSS-RSN-17954.989
SRSS-RSN-12273.491SRSS-RSN-18364.382
SRSS-RSN-14892.271SRSS-RSN-2938.058
SRSS-RSN-14904.966SRSS-RSN-39555.974
SRSS-RSN-14964.853SRSS-RSN-40544.081
SRSS-RSN-15081.257SRSS-RSN-48932.475
SRSS-RSN-15121.364SRSS-RSN-52188.080
SRSS-RSN-15462.173SRSS-RSN-5723.256
SRSS-RSN-15490.796SRSS-RSN-68913.852
SRSS-RSN-37461.403SRSS-RSN-69637.276
SRSS-RSN-37502.520SRSS-RSN-7745.434
SRSS-RSN-37594.905SRSS-RSN-7815.264
SRSS-RSN-40311.283SRSS-RSN-8917.734
SRSS-RSN-42190.767SRSS-RSN-8975.927
SRSS-RSN-44572.827SRSS-RSN-9466.941
Table 7. Evaluated performance levels of investigated structures (provided separately according to stations and story numbers).
StationIO (%)LS (%)CP (%)C (%)
3-story
Old46150.8788.264.356.52
New46152.1790.875.221.74
Old46116.5291.741.300.43
New46118.2688.263.040.43
4-story
Old46155.2274.788.2611.74
New46150.4392.614.352.61
Old461120.8775.652.171.30
New461110.0088.261.740.00
5-story
Old46150.8773.4811.7413.91
New46152.1782.179.136.52
Old46116.5285.657.390.43
New461114.7879.135.650.43
6-story
Old46152.6166.969.5720.87
New46152.1790.874.782.17
Old461113.9179.575.221.30
New461115.6583.910.430.00
7-story
Old46150.4358.7012.6128.26
New46153.9186.528.261.30
Old46119.5777.396.966.09
New461119.1380.870.000.00
8-story
Old46150.0062.6115.6521.74
New46150.8778.7012.617.83
Old46117.8383.915.652.61
New46119.1387.393.040.43
Table 8. Percentage of each evaluated performance level of investigated structures.
IO (%)LS (%)CP (%)C(%)
All Buildings and Both Stations
Old6.2776.567.579.60
New7.3985.804.861.96
Table 9. Comparison of this analytical study and field observations by Ref. [30].
This Analytical Study Yilmaz et al. (2024)’s Field Observations
No Damage + Slight
Calculated Rate (%) Observed Rate (%)
3 stories94.241–2–3 stories90.73
4–5–6 stories89.024–5–6 stories81.17
7–8 stories83.377 + stories85.15
Moderate + Heavily Damaged + Collapsed
Calculated Rate (%) Observed Rate (%)
3 stories5.761–2–3 stories9.27
4–5–6 stories10.984–5–6 stories18.83
7–8 stories16.637 + stories14.85
Disclaimer/Publisher’s Note: The statements, opinions and data contained in all publications are solely those of the individual author(s) and contributor(s) and not of MDPI and/or the editor(s). MDPI and/or the editor(s) disclaim responsibility for any injury to people or property resulting from any ideas, methods, instructions or products referred to in the content.

