Article

Vortex-Induced Micro-Cantilever Vibrations with Small and Large Amplitudes in Rarefied Gas Flow

1
Institute of Mechanics, Bulgarian Academy of Sciences, 1113 Sofia, Bulgaria
2
Centre of Excellence in Informatics and Information and Communication Technologies, 1113 Sofia, Bulgaria
*
Author to whom correspondence should be addressed.
Appl. Sci. 2025, 15(10), 5547; https://doi.org/10.3390/app15105547
Submission received: 12 April 2025 / Revised: 13 May 2025 / Accepted: 13 May 2025 / Published: 15 May 2025
(This article belongs to the Special Issue Nonlinear Dynamics in Mechanical Engineering and Thermal Engineering)

Abstract

:
This study employs a fully coupled fluid–structure interaction (FSI) to investigate the vibrations of an elastic micro-cantilever induced by a rarefied gas flow. Two distinct models are employed to characterize the beam vibrations: the small deflection Euler–Bernoulli beam theory and the large deflection beam theory. The cantilever is oriented normally to the free stream, creating a regular Kármán vortex street behind the beam, resulting in vortex-induced vibrations (VIV) in the micro-cantilever. The Direct Simulation Monte Carlo (DSMC) method is used to model the rarefied gas flow to capture non-continuum effects. A hybrid numerical approach couples the beam dynamics and gas flow, enabling a fully coupled FSI simulation. A substantial number of numerical computations indicate that the range of vibration amplitudes expands when the natural frequency of the beam approaches the vortex shedding frequency. Notably, the large deflection beam theory predicts that the peak amplitude occurs at a slightly lower frequency than the vortex frequency. In this frequency range, as well as for thinner beams, the amplitude ranges predicted by the large deflection beam theory exceed those obtained from the small deflection beam theory. This finding implies that for more complex behaviours involving nonlinear effects, the large deflection theory may yield more accurate predictions.

1. Introduction

The interaction of rarefied gas flow with micro-cantilevers is an area of growing interest in the fields of microtechnology and fluid dynamics. The study of interactions between fluid and mechanical fields is crucial for advancing applications such as sensors, actuators, and energy-harvesting devices where the performance can be significantly influenced by the surrounding gas flow characteristics [1,2]. Theoretical models have been developed to analyse the dynamic behaviour of micro-cantilevers taking into account factors such as particle attachment and the influence of external forces. In [2], the rectangular micro-cantilever is regarded as a point mass in the dynamic model of forced and damped harmonic oscillators. The authors use single- and bimodal-frequency excitation schemes for actuation of the micro-cantilever in the presence of dynamic acoustic forces.
Traditionally, fluid–structure interactions have been examined using continuum models like the Navier–Stokes equations. However, these can lose accuracy when the character size of the object is comparable to the mean free path of molecules, leading to important non-equilibrium effects, especially when the boundary layer plays an important role. For instance, it was proved by Mohammadzadeh et al. [3] that in cavity flow simulations, the difference between Navier–Stokes and Direct Simulation Monte Carlo (DSMC) solutions becomes more notable near the cavity’s corner tips, where local non-equilibrium effects in the boundary layer become dominant even at Kn = 0.005, a value nearing the continuum regime. Their research has shown that the validity of Navier–Stokes equations can depend significantly on the specific problem, challenging general assumptions about the range of their applicability.
To address this, the authors of this study have applied the DSMC to model the rarefied gas flow, which is especially reliable in the slip-flow and transition regimes [4,5,6]. DSMC, initially developed by Bird in the 1960s [7], is a molecular-based benchmark method that takes place between molecular dynamics—whose computational requirements for these sizes are often impossible and continuum models, which miss important non-equilibrium effects.
The understanding of how rarefied gas flow interacts with micro-cantilevers is further enhanced by experimental investigations that reveal the effects of varying flow rates and gas properties on the vibration characteristics of these structures. Such studies are essential for optimizing the design and functionality of micro-cantilevers in real-world applications, particularly in environments where gas flow is not well approximated by classical fluid dynamics [8,9].
Moreover, the phenomenon of vortex shedding can also play a significant role in the dynamics of micro-cantilevers.
Vortex-induced vibration (VIV) is a phenomenon that arises when fluid flow interacts with structures, leading to oscillations that can have significant implications for engineering applications. This phenomenon is characterized by the periodic detachment of vortices from the surface of a body, which generates fluctuating forces that can induce vibrations in structures such as bridges, pipelines, and offshore platforms. Understanding VIV is essential for the design and maintenance of these structures, as it can lead to fatigue failure and catastrophic failures if not properly managed [10,11,12]. The mechanisms behind VIV are complex, involving fluid–structure interactions (FSI) that can result in both self-excited and forced vibrations. When the frequency of vortex shedding aligns closely with the natural frequency of a structure, a condition known as “lock-in” occurs, amplifying the vibrations and potentially leading to severe structural damage [13,14]. This phenomenon is particularly relevant in the context of marine engineering, where structures such as risers and cables are subjected to dynamic loading from ocean currents [11,15,16]. The implications of VIV are profound, as they not only affect structural integrity but also pose risks to safety and environmental sustainability, particularly in offshore oil and gas operations [11,17]. Recent advancements in numerical simulations and experimental studies have enhanced the understanding of VIV, enabling engineers to develop effective suppression strategies or to use this phenomenon. Techniques such as the use of vortex generators and dynamic vibration absorbers have shown promise in mitigating the adverse effects of VIV on structures [18,19]. Furthermore, ongoing research continues to explore the influence of various parameters, including flow conditions and structural characteristics, on the vibration response, thereby contributing to the development of more resilient designs [20,21]. As the field progresses, the integration of these findings into engineering practices will be crucial for ensuring the safety and longevity of structures exposed to vortex-induced vibrations.
More specifically, this is the case when VIVs are connected with micro-structures.
When a micro-cantilever is placed in a flow field where vortex shedding occurs, the resulting oscillations can be harnessed for energy-harvesting applications. Studies have shown that piezoelectric materials integrated into cantilever structures can convert the mechanical energy from VIV into electrical energy, demonstrating the potential for practical applications in energy harvesting from ambient flows [22,23].
Overall, the interaction of rarefied gas flow with micro-cantilevers presents significant challenges spanning theoretical modelling, experimental validation, and practical implementation. An important part of our approach is using the DSMC method to model the rarefied gas flow around the micro-elastic beam. Our group was the first to adopt the DSMC method for accurately capturing non-equilibrium phenomena in micro-cantilever fluid–structure interactions, as first demonstrated in our works [4,5,6]. More recently, Huff et al. [24] applied DSMC-based FSI to atmospheric ice particles in post-shock hypersonic conditions, where dynamic, brittle fracture necessitates modelling beyond the continuum regime. They specifically emphasized the importance of DSMC in capturing non-continuum effects that current continuum-based FSI approaches cannot reproduce. These recent innovative studies highlight DSMC’s critical role in bridging the gap where conventional continuum methods fail, such as Navier–Stokes equations, and continued progress in this domain promises further micro-cantilever design and performance innovations.
Our previous study [6] investigated a rarefied gas flowing past a cantilever beam oriented normally to the free stream, forming a Kármán vortex street. Using a linear beam model, we found that if the vortex-shedding frequency is close to the natural frequency of the cantilever, large body motions are observed, and the structure undergoes near-resonance vibration resonance. These findings suggest opportunities to develop micro-devices, especially in scenarios where measuring or experimenting with extremely small, fast processes is challenging.
In this new paper, we expand that work by comparing linear and nonlinear cantilever models in the same resonance zone. The aim is to investigate the sensitive region where differences between linear and nonlinear models are expected to become more notable. This work will provide deeper insight into nonlinear and non-equilibrium phenomena and models at the micro-scale, thus advancing the development of precise vibrational dynamics in micro-devices operating under rarefied gas flows.

2. Statement of the Problem

The flow regime parameters and material properties were selected to ensure the formation of a stable and regular Kármán vortex street behind the cantilever with the vortex shedding frequency close to the cantilever’s first natural frequency.
As in our previous study, a rarefied gas flow passes a cantilever beam oriented normally to the free stream, thus forming a von Kármán vortex street—Figure 1. The parameters of the gas flows are as follows: Knudsen number is 0.014, free-stream velocity (uginlet) is 0.4 times Mach (148.4 m/s), reference temperature (Tgreference) is 288 K, reference pressure (pgreference) is 53.4 kPa, the length of the beam (L) is 8.886 μm, h is the thickness of the beam, which is varied in our study and its values are described further in the paper, and the temperature of the beam is constant and equal to the reference temperature. The superscript g indicates variables associated with the gas. The micro-cantilever is made of tungsten carbide (WC), Young’s modulus (E) is 5.5 MPa, density (ρ) is 1.58 kg/m3, and Poisson’s ratio (ν) is 0.2445.

3. The Mathematical Model of the Elastic Obstacle

The elastic element inserted in the channel was modelled as an elastic cantilever beam. The geometrically nonlinear version of the Euler–Bernoulli beam theory and the Timoshenko beam theory were checked and compared to analyse the beam vibration.
The equations of motion of the beam, according to the Euler beam theory, which considers large displacements, are [25]:
N y + c d u t + ρ A 2 u t 2 = 0 2 M y 2 + c d w t + N 2 w y 2 + ρ A 2 w t 2 = p ( y , t )                       0 < y < L
and the equations
N y c 1 u t ρ F 2 u t 2 = 0 ,                                                   h / 2     z     h / 2 M y + Q c 2 ψ t ρ I 2 ψ t 2 = 0                                   0   <   y   <   L ,   t   >   0       Q y + N 2 w y 2 + N y w y c 1 w y ρ A 2 w t 2 = p ( y , t )
according to the Timoshenko beam theory.
In (1) and (2), N, M and Q are the generalized stresses
N = b h / 2 h / 2 σ y d z ,   M = b h / 2 h / 2 σ y z d z ,   Q = k b h / 2 h / 2 τ y z d z
u is the displacement along y-axis (longitudinal displacement), w is the displacement along x-axis (transverse beam displacement), p(y,t) is the transverse loading of the beam, A = bh is the area of the beam cross-section, and b is the width of the beam, t is the time and by c1, c2 and cd the material damping coefficient are denoted. The shear force Q is considered only in the case of Timoshenko beam theory, introducing the so-called shear correction factor k.
A reduced model of the beam was used to describe the beam motion. By using the Galerkin procedure, the solutions of the equations of motion were sought by series
w ( y , t ) = n = 1 N f w n ( y ) q n ( t )
for the Euler–Bernoulli beam and
w ( y , t ) = i = 1 N f W i ( y ) q i ( t ) , ψ ( y , t ) = i = 1 N f Ψ i ( y ) q i ( t )
for Timoshenko beam, where wn(y) are space functions representing vibration modes according to the Euler–Bernoulli beam theory, Wn are the normal forms of vibrations according to the Timoshenko beam theory and Ψi(y) are angular rotations according to the Timoshenko beam theory. These functions satisfy the geometrical boundary conditions. qn(t) are time functions, and Nf is the number of modes in the expansion.
The Timoshenko beam theory usually gives closer results to the ones obtained by 3D beam theory than the Euler–Bernoulli beam theory, especially in the case of thicker beams and when high frequencies are involved in the response. The case considered by us is with fixed beam length and parameter of the rarefied gas flow. For the selected geometrical parameters of the beam, we calculated the natural frequencies and some forced responses of the beam obtained by both theories.
The verification of the cantilever’s models was performed for a beam with the same material and geometrical properties, which are used in all computations (see section Statement of the problem), with thickness h = L/20. The results are written in Table 1.
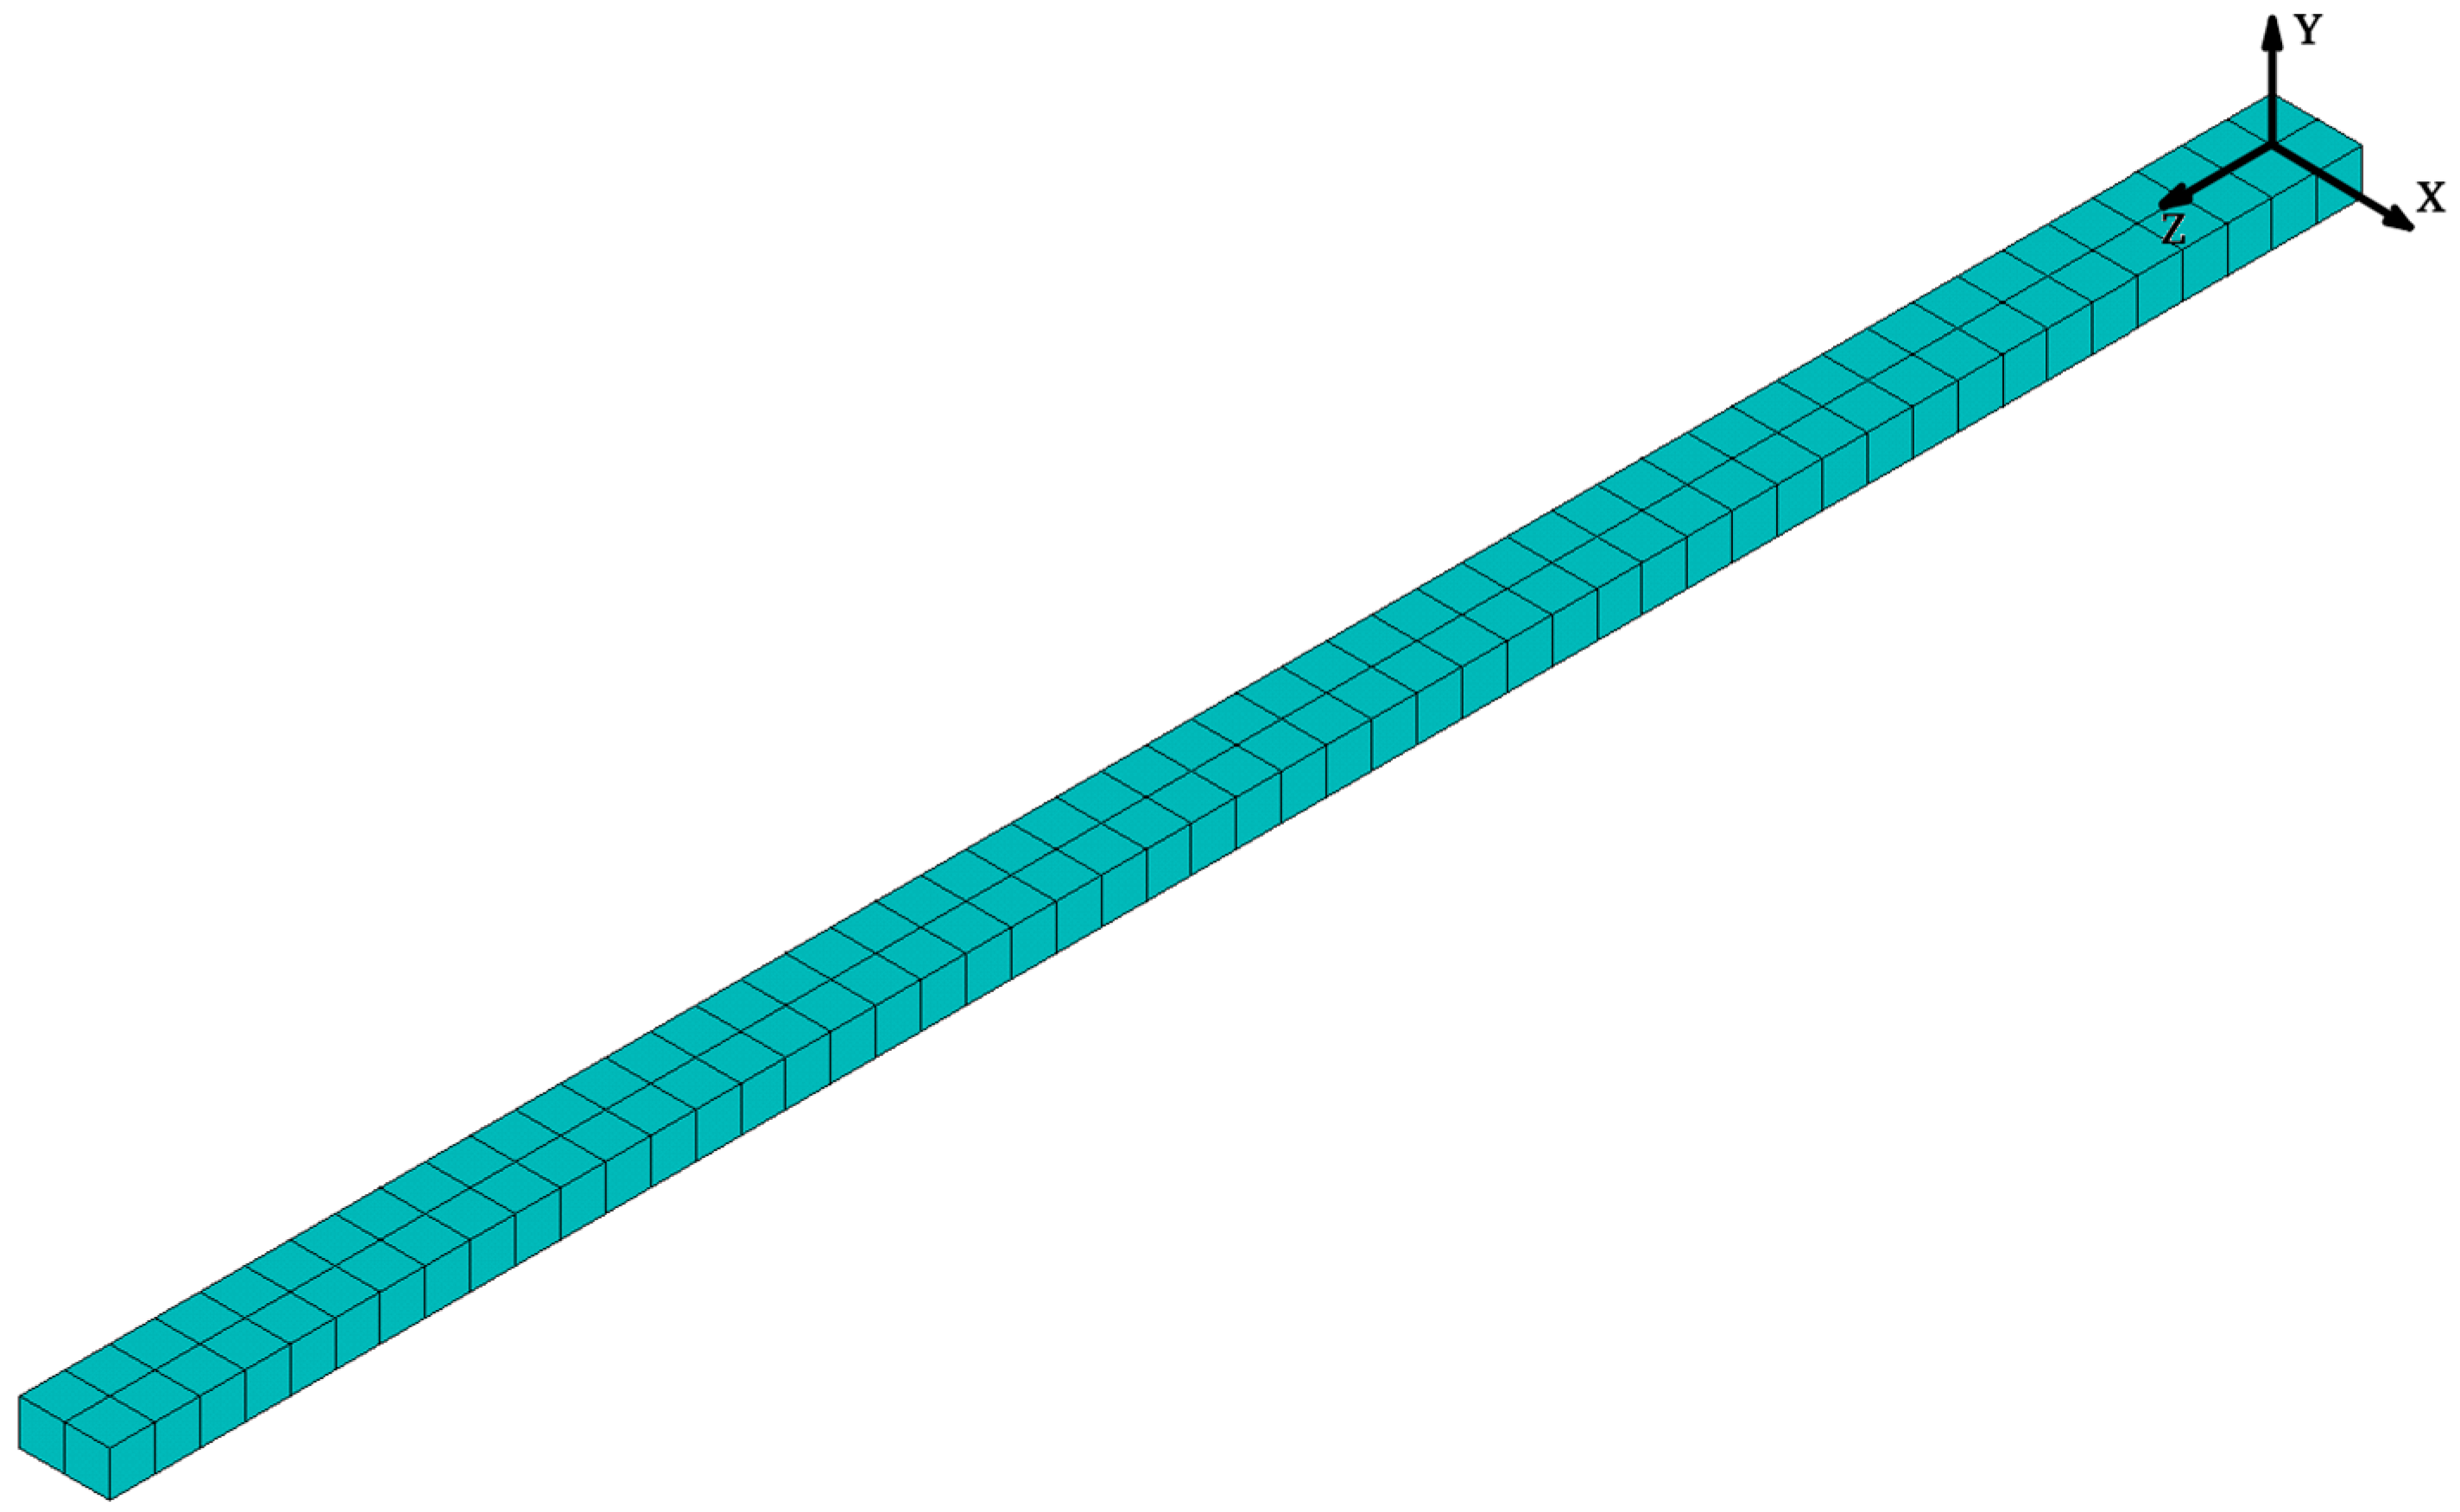
For the same beam, a 3D finite element model was created with ANSYS 2022R2 software (see Figure 2). The beam was discretized by one hundred 20-node brick SOLID186 finite elements and 963 nodes.
As one can see, the differences between the frequencies obtained by the three different approaches are much less than 1%.
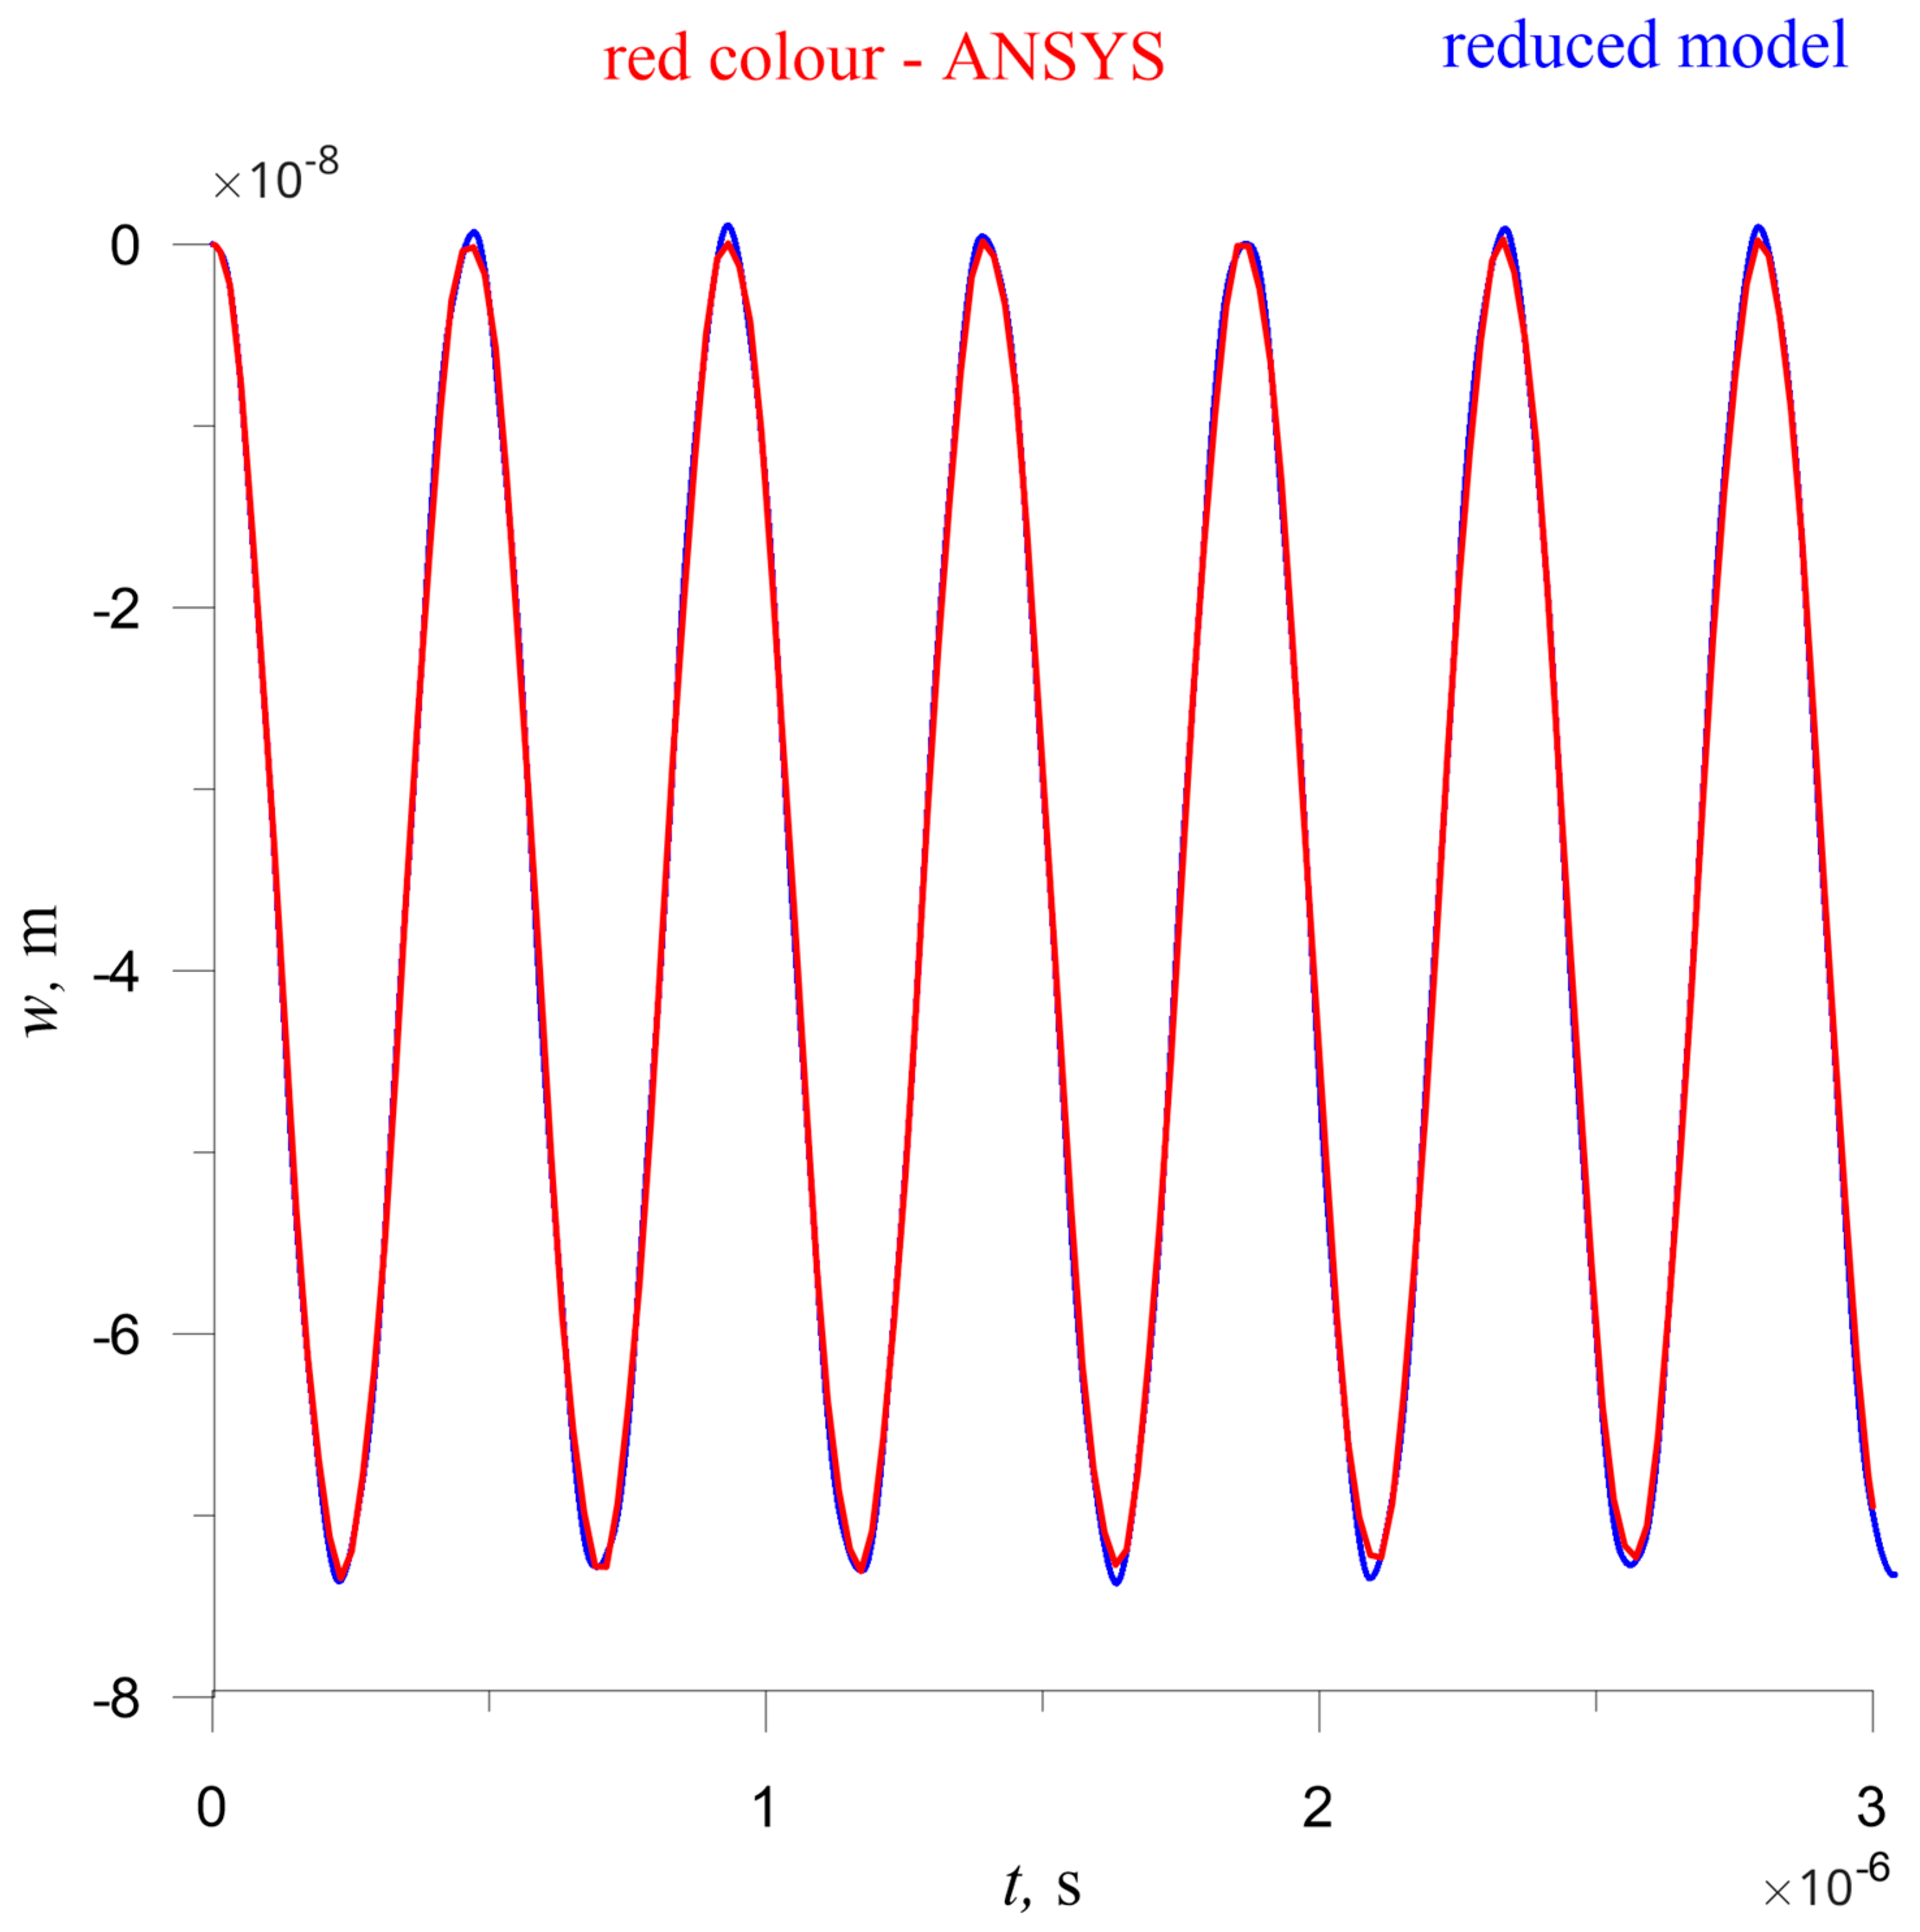
Thus, we decided to continue with the geometrically nonlinear version of the Euler–Bernoulli mode. The last check was to compare the time history diagram obtained by the 3D finite element model and the reduced three degrees of freedom model. The beams modelled by both models were loaded with step loading equal to 12,000 Pa, which is approximately the value of the loading caused by fluid flow on the beam. The comparison can be seen in Figure 3.
As can be seen, the agreement between the results is excellent, and the differences are negligible. Similar results were obtained using the Timoshenko beam theory instead of the Euler–Bernoulli beam theory.
Due to all these reasons and the fact that the equations of motion for the Euler–Bernoulli beam are a little simpler than the ones for the Timoshenko beam, we decided to continue the computations using the geometrically nonlinear version of the Euler–Bernoulli beam theory.
The equations of the beam motion of the beam, according to this theory, are [5,25]
E I 4 w x 4 + c d w t + ρ A 2 w t 2 = p ( y , t ) + G l ( y , t )
Here, the longitudinal inertia is neglected, and by GL, the nonlinear term due to large deflection is denoted as
G l ( y , t ) = E I L 6 h 2 0 L w y 2 d y 2 w y 2
and cd is a term connected with internal damping.
In (5) and (6), I is the geometrical moment of inertia of the beam cross-section. In the case of a rectangular cross-section of the beam, it is I = bh3/12
The boundary conditions for the elastic obstacle are for a cantilever (clamped at one end and free at the tip) [22]
For   y = 0   :   w ( 0 , t ) = 0 ,   w ( 0 , t ) y = 0 , For   y = L   : 2 w ( 0 , t ) y 2 = 0 ,   3 w ( 0 , t ) y 3 = 0
Dimensionless variables:
As far as the considered case is concerned, the micro-objects and the dimensions of the channel and the beam are very small; therefore, it is necessary to use dimensionless variables in the numerical computations.
The following dimensionless variables are introduced
y ¯ = y / L ,   w ¯ = w / L ,   t ¯ = t c / L ,   c = E / ρ
Then, Equations (5) and (6) are transformed into:
4 w ¯ y ¯ 4 + c v w ¯ t ¯ + α 1 2 w ¯ t ¯ 2 = p 1 + G ¯ l ( y , t ) ,   p 1 = p ( y ¯ , t ) L 3 E I ,   G ¯ L = 1 2 α 0 1 w ¯ ξ 2 d ξ 2 w ¯ y ¯ 2 ,   c v = c d E I
In the following equations, for convenience, the bars over the dimensionless variables will be omitted.
Equation (9) has to be coupled with the gas flow solution. For this purpose, a reduced model of the beam was developed here.
According to the Galerkin procedure, the solution is sought by series Equation (3).
The natural modes of vibrations, wn which satisfy the boundary conditions, have the expression
w n ( y ) = A n sin β n y sinh β n y B n ( cos β n y + cosh β n y )
where the following notations are used
β n 4 = ω n 2 α ,           α = 12 L h 2           B n = sin β n + sinh β n cos β n + cosh β n
and ωn are the dimensionless natural frequencies of the linear Euler–Bernoulli beam obtained from the frequency equation
cos β cosh β = 1
Substituting Equation (3) into a partial differential Equation (5), multiplying it by the modal functions, integrating through the beam length, invoking the orthogonality condition
0 1 w n w m d y = 1     for       n = m 0     for       n m
and assuming the proportional damping, the equation is transformed into a set of coupled ordinary differential equations of motion
q ¨ n ( t ) + 2 ξ n ω n q ˙ n + ω n 2 q n ( t ) = F n ( t ) ,
where ξn are modal damping parameters and
F n ( t ) = 0 1 w n ( y ) [ P ( y , t ) + G l ( y , t ) ] d y
In the present work, we chose the three-mode reduction (Nf = 3). The preliminary studies of the vibration behaviour of the beam subjected to step loading showed that the higher modes do not influence the response. On the other hand, using three-mode reduction leads to manageable calculations to obtain the system of ordinary differential equations, which could be solved quickly and easily by the available software.
Using the three-modes reduction, the geometrically nonlinear term has the form
G L x , t = 1 2 I 11 q 1 2 + I 22 q 2 2 + I 33 q 3 2 + 2 I 12 q 1 q 2 + 2 I 23 q 2 q 3 + 2 I 13 q 1 q 3 . ( w 1 q 1 + w 2 q 2 + w 3 q 3 ) ,
where
I i j = 0 1 w i w j d y
So, the mathematical model based on the three modes reduction takes the form:
q ¨ n ( t ) + 2 ξ n ω n q ˙ n + ω n 2 q n ( t ) + D 111 n q 1 3 + D 222 n q 2 3 + D 333 n q 3 3 + D 112 n q 1 2 q 2 + D 113 n q 1 2 q 3 + D 221 n q 1 q 2 2 + D 223 n q 2 2 q 3 + D 331 n q 1 q 3 2 + D 332 n q 2 q 3 2 + D 123 n q 1 q 2 q 3 = F n p ( t ) ,         n = 1 , 2 , 3
Here
D i j k n = 0.5 0 1 w n C i j k d y         i , j , k = 1 , 2 , 3
and
C 111 = I 11 w 1   ,     C 222 = I 22 w 2   ,     C 333 = I 33 w 3   C 112 = I 11 w 2   + 2 I 12 w 1   C 113 = I 11 w 3   + 2 I 13 w 1   C 221 = I 22 w 1   + 2 I 12 w 2   ,   C 223 = I 22 w 3   + 2 I 23 w 2   C 331 = I 33 w 1   + 2 I 13 w 3     ,   C 332 = I 33 w 2   + 2 I 23 w 3    
The nonlinear system of Equation (18) was solved using Gear’s method [26] from the IMSL library. Gear’s numerical method is generally validated for solving complicated nonlinear differential equations. This implicit method is appropriate for stiff problems that require long integration times. The integrals in Equations (15), (17), and (19) are computed using Simpson’s rule.

4. Numerical Setup

We selected the numerical parameters of our study based on our earlier work [6]. In [6] the vibration of an elastic beam modelled by linear Euler–Bernoulli theory in its resonance zone was investigated. The problem setup is defined in detail in Section 2. Figure 1 shows the geometry of a rarefied gas flow past an elastic cantilever beam oriented normally to the free stream.

4.1. DSMC Numerical Parameters and Mesh Setup

The relation between Knudsen, Mach, and Reynolds numbers can be expressed as follows (see [26]):
R e = 16 5 π γ g π 2 M a K n γ g π 2 M a K n
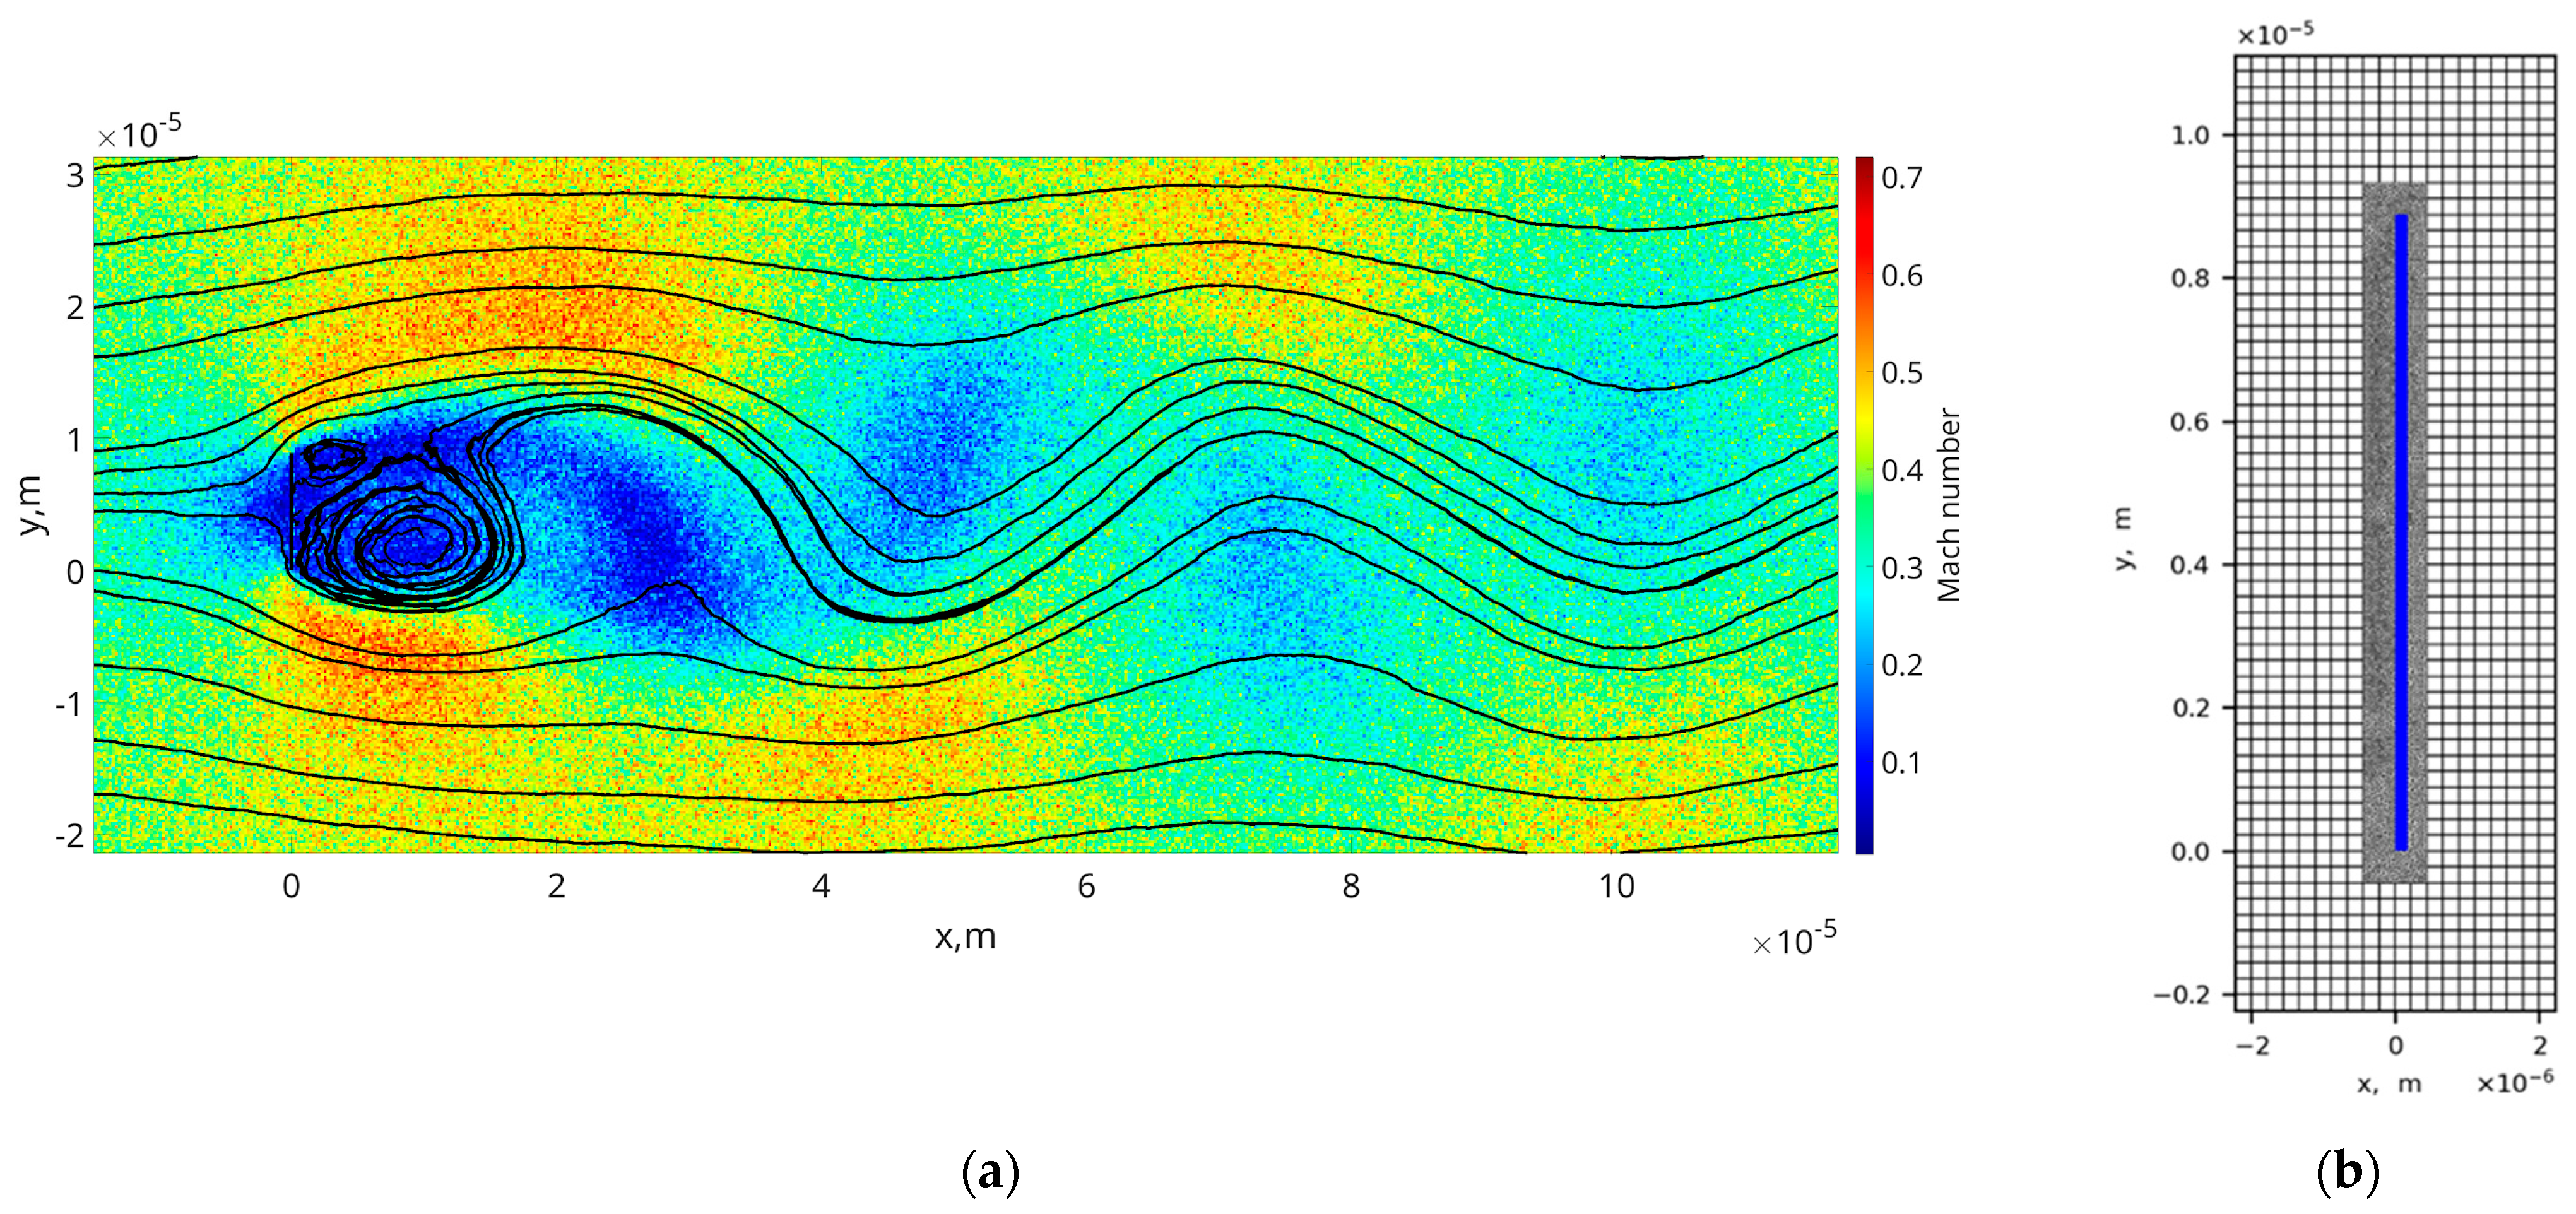
The Reynolds number is 47, which ensures the formation of a stable and regular Kármán vortex street behind the cantilever (see Figure 4a).
The initial boundary conditions are as follows: the velocities are equal to inlet velocities, the temperature equals the reference temperature, and the pressure equals the reference pressure. At the commencement of the simulation, a transitional interval precedes the full establishment of the nonstationary regime.
In this work, the DSMC method utilized a hard-sphere model for a monoatomic gas coupled with the SBT collision scheme [27], following recommendations provided in [28]. Air was represented with a reference viscosity of 18.2 × 10⁻⁶ Pa s, an average molar mass of 29 g/mol, and a corresponding particle diameter of 3.7 × 10⁻¹⁰ m. A diffuse reflection boundary condition was set at the elastic micro-cantilever walls. The DSMC simulations employed an adaptive mesh (see Figure 4b) divided into two types. A Cartesian uniform mesh is referred to as a “basic” mesh. Each “basic” cell is dynamically divided into subcells, a well known approach named Transient Adaptive Sub-cell (TAS) [29]. We used the following criteria:
l e v e l = P P C ( b a s i c ) / P P C min ,
where level is the TAS subdivision factor and represents the number of subcells in each direction. Thus, a basic cell is divided into level × level subcells in two dimensions. Here, PPC(basic) specifies the number of particles within each basic cell and PPCmin is the minimum average number of particles per subcell. This approach maintains the particle population within each cell at an approximately constant level. The collision algorithm is performed independently within each subcell, considering only the particles therein. In accordance with the validity recommendations for the SBT collision scheme [28], we used PPCmin = 3.
Additionally, an unstructured adaptive mesh was used in the region around the elastic micro-cantilever (depicted in blue in Figure 4b), generated via the Delaunay algorithm in Gmsh [30] through C++ API functions integrated into our parallel C++ DSMC code.
Properly implementing free-stream boundary conditions is essential for capturing realistic flow behaviour in DSMC simulations. The boundary cells of the computational domain were used as reservoirs, facilitating the generation of particles whose properties are partially determined by the simulation’s solution. At each time step, for each basic cell on the inlet boundary (see Figure 1), a new set of particles is generated following a Maxwellian velocity distribution and specified gas properties: uginlet = 0.4Mach = 148.4 m/s, vginlet = 0 m/s, wginlet = 0 m/s, pginlet = pgreferemce, and Tginlet = Tgreferemce. Here, ug, vg, and wg represent velocities along the x-, y-, and z-axis. In molecular simulations, each particle maintains three independent velocity components, regardless of the dimensionality of the flow problem. At the outlet, the boundary conditions are specified by ∂ug = 0, ∂vg = 0, ∂wg = 0, pgoutlet = pgreferemce, and Tgoutlet = Tgreferemce. The top boundary conditions are ugtop = 0.4Mach, ∂vg = 0, ∂wg = 0, pgtop = pgreferemce, and Tgtop = Tgreferemce. Identical conditions are imposed at the bottom boundary. Further details regarding these boundary conditions can be found in [31].
The influence of numerical parameters on the accuracy of the considered case was thoroughly investigated in our previous work [6], which addressed the same physical problem, with the distinction that the current study focuses on the modelling of a geometrically nonlinear vibrations of elastic beam. In particular, the appropriate size of the computational domain was determined to ensure that the boundaries had a negligible effect on the solution near the cantilever. In the employed DSMC approach, we used an adaptive mesh in which the cell size is based on the local number of particles, making the particle count the primary numerical parameter (see Equation (22)). The influence of particle number on solution accuracy was examined in [6] using 22, 88, and 352 million particles. The analysis showed that using 352 million particles yields sufficient accuracy, with numerical errors in the range of 2–3%. Based on these findings, we selected our numerical parameters accordingly. The size of the computational domain was length Lcomp. doman = 50 L and height Hcomp. doman = 20 L. We selected numerical parameters of DSMC used in [6]: basic mesh with 2000 × 800 cells, 352 million particles, and time steps of ΔtDSMC = 10−11 s. As the number of particles increased, the number of adaptive cells increased, and the time step decreased. The time step was sufficiently small to satisfy the Courant–Friedrichs–Lewi condition for each considered case, i.e., none of the particles in the computational domain flew over a cell without executing the collision procedure.

4.2. Elastic Micro-Beam Numerical Parameters and Mesh Setup

The beam was discretized by 21 nodes along the beam length (y-axis). Then, solving Equation (18) numerically, the displacement and the velocities of the beam in these 21 nodes are obtained by using series written in Equation (3). Equation (18) is integrated numerically with time step Δt = 4 × 10⁻¹¹ s.
The damping ratio of the elastic beam was set to ξ = 0.001.

4.3. Numerical Parameters Related to Coupling DSMC and Micro-Elastic Beam Model

We used a loosely coupled (time-lagged) scheme for the numerical simulation of a rarefied gas FSI problem. The main advantage of a loosely (explicitly) coupled approach is that existing optimized solvers can be reused and coupled [32]. We have two completely different models and codes: one is molecular (DSMC), while the other is continuum-based. Strong coupling between continuum and molecular models and solvers is a non-trivial task. Additionally, the DSMC code is parallelized for high-performance computing (HPC) and requires enormous computational resources.
In contrast, the elastic beam code can complete all calculations on a single core in minutes. Most of the time is consumed by DSMC, making the beam calculation time negligible in comparison. Therefore, code maintenance and easy model modifications are of great importance.
A novel aspect of our approach is the use of a molecular model (DSMC) for rarefied gas, which captures nonequilibrium microfluidic phenomena. The coupled FSI approach, combining DSMC and an elastic micro-element, is described in detail in [4]. DSMC is always numerically stable regardless of time step [33]. DSMC accuracy is the most important part here. In our case, DSMC accuracy was ensured by using a sufficient number of particles, adaptive meshing, a sufficiently small time step, and following recommendations in [28], as was described in the previous section.
Recording the impact of each particle on the beam surfaces leads to an accurate determination of the gas force on the beam. The beam was divided into 20 elements along its length. The forces from particles hitting each beam element from the front and the back sides are accumulated.
In DSMC, we used one trajectory and time-averaging of 20 time steps (ΔtDSMC) to obtain macroscopic properties, which is the time lag between the two models (20 × ΔtDSMC). The chosen averaged period (time lag) was sufficiently small to keep changes in macroscopic fields such as Kármán vortex street noticeable and sufficiently large to obtain smoother macroscopic fields (see Mach number field and streamlines shown in Figure 4a). The load sent to the elastic beam code is the difference between the accumulated forces on the corresponding front and back surfaces of the elements. Then, this code calculates micro-beam displacements and velocities and sends them to DSMC.

5. Results and Discussion

We examined the vibration of an elastic beam modelled by the linear and nonlinear model in its resonance zone. The resonance arises due to the frequency of VIV, caused by the Kármán vortex street in the rarefied gas, being close to the beam’s first natural frequency.
The selection of rarefied gas flow regimes and cantilever material is essential. While numerical simulations give very accurate results, parameter analysis allows the possibility of finding relations between the parameters of two interacting media: a rarefied gas flow and an elastic beam. We follow the dimensional analysis in [6], where we selected to vary cantilever thickness (h). Here is the briefly presented analysis.
Oscillating flows are described by the Strouhal number, which is defined as:
S t g = f C L g L u i n l e t g
where f C L g is the vortex detachment frequency. f C L g was determined with continuous 1D wavelet transform (CWT) with the bump wavelet of the lift force (force along the y-axis) of the cantilever at the established unsteady regime.
We focused on Mach and Knudsen numbers as the primary governing parameters because the Strouhal number can be expressed as a function of both. In the micro-gas flow regime, the Knudsen number is especially important; note that Mach, Reynolds, and Knudsen numbers are related (see Equation (21)). A detailed, dimensionless analysis of gas parameters is presented in [6], and a linear model was used to represent the beam, enabling us to derive a straightforward expression for the cantilever’s resonance zone. The derived expression (24) made it possible to identify which gas and beam parameters influence the cantilever’s resonance. To investigate the resonance between the flow and the beam, we equated the VIV frequency to the beam’s first natural frequency. By fixing the gas properties (Mach number, Knudsen number, surface temperature, and the type of gas), the material properties, and the length of the beam, the only parameter that one can vary is the dimensionless beam thickness (ch = h/L):
S t g u i n l e t g = 1.01498 2 π c h E ρ
where the left-hand side represents the flow-induced frequency (a function of Mach and Knudsen numbers), and the right-hand side depends on the beam’s elasticity (Young’s modulus E) and density ρ.
In order to investigate the oscillations of the beam in the resonance zone, 14 cases with varying beam thicknesses were studied. Each case individually requires substantial computational resources, and solving this series of problems demands significant computational effort and efficiency. All simulations were performed using our DSMC code on the supercomputer HEMUS at the Centre of Excellence in Informatics and ICT, financed by the OP SESG and co-financed by the EU through the ESIF.
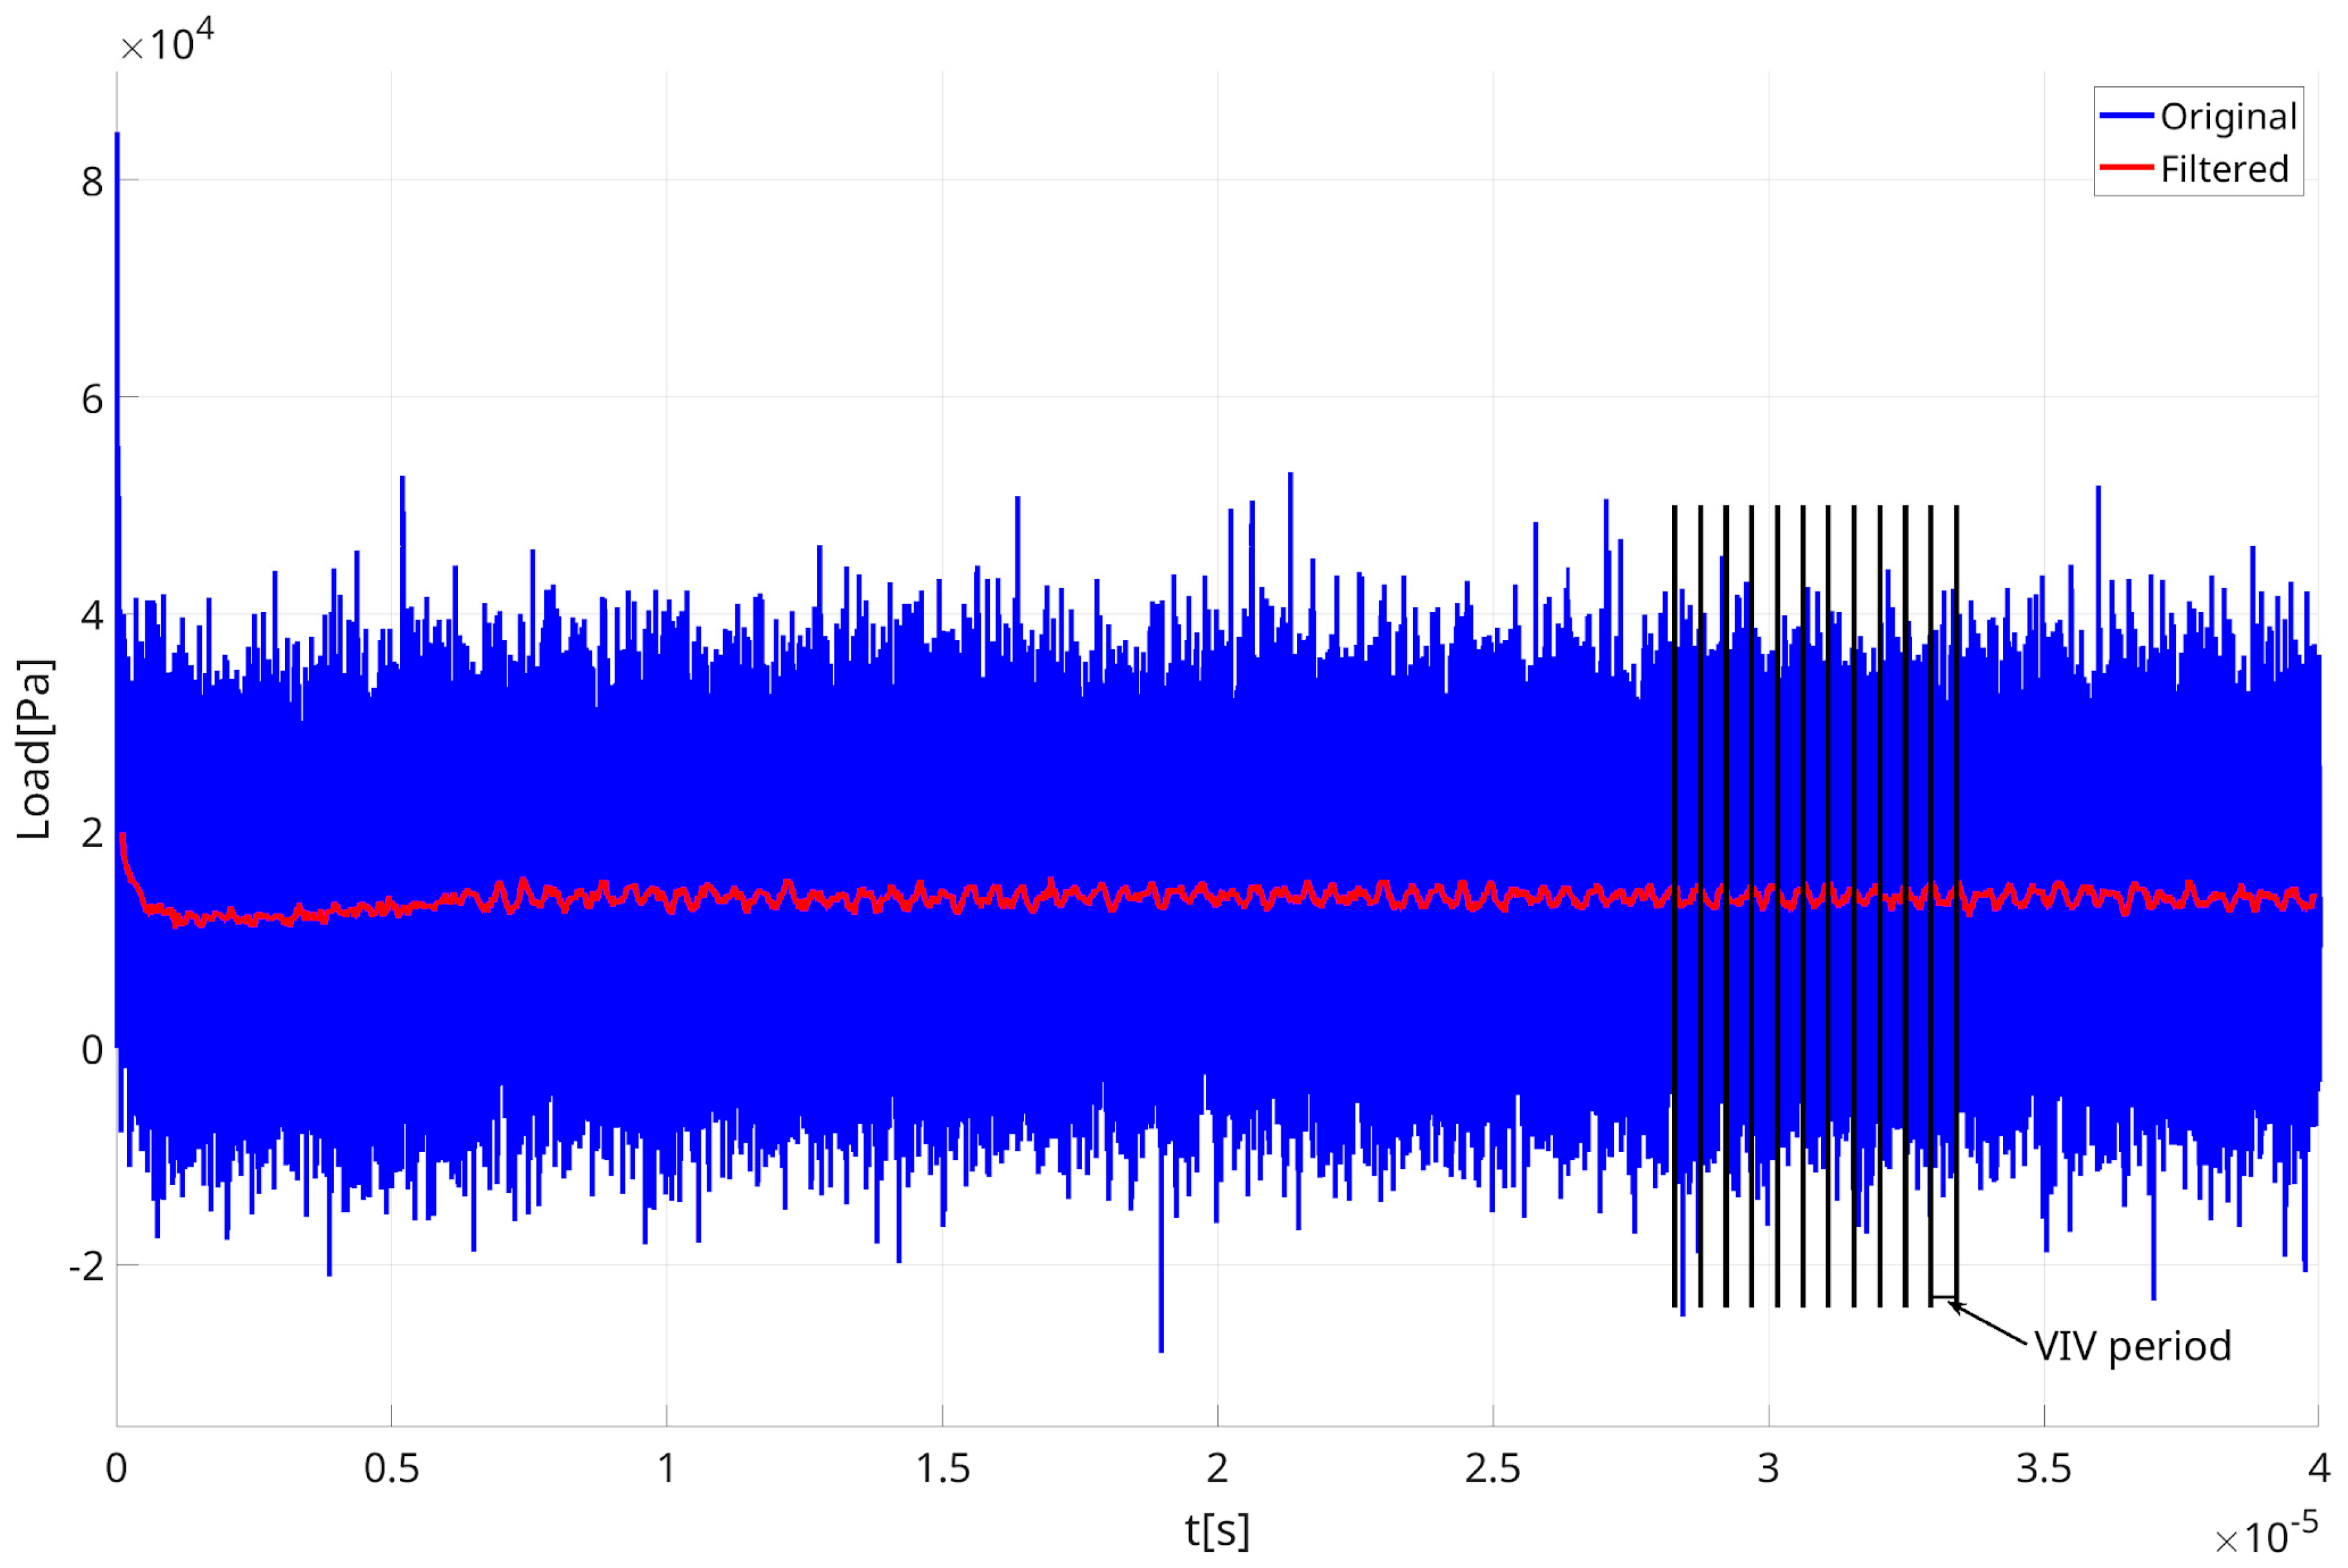
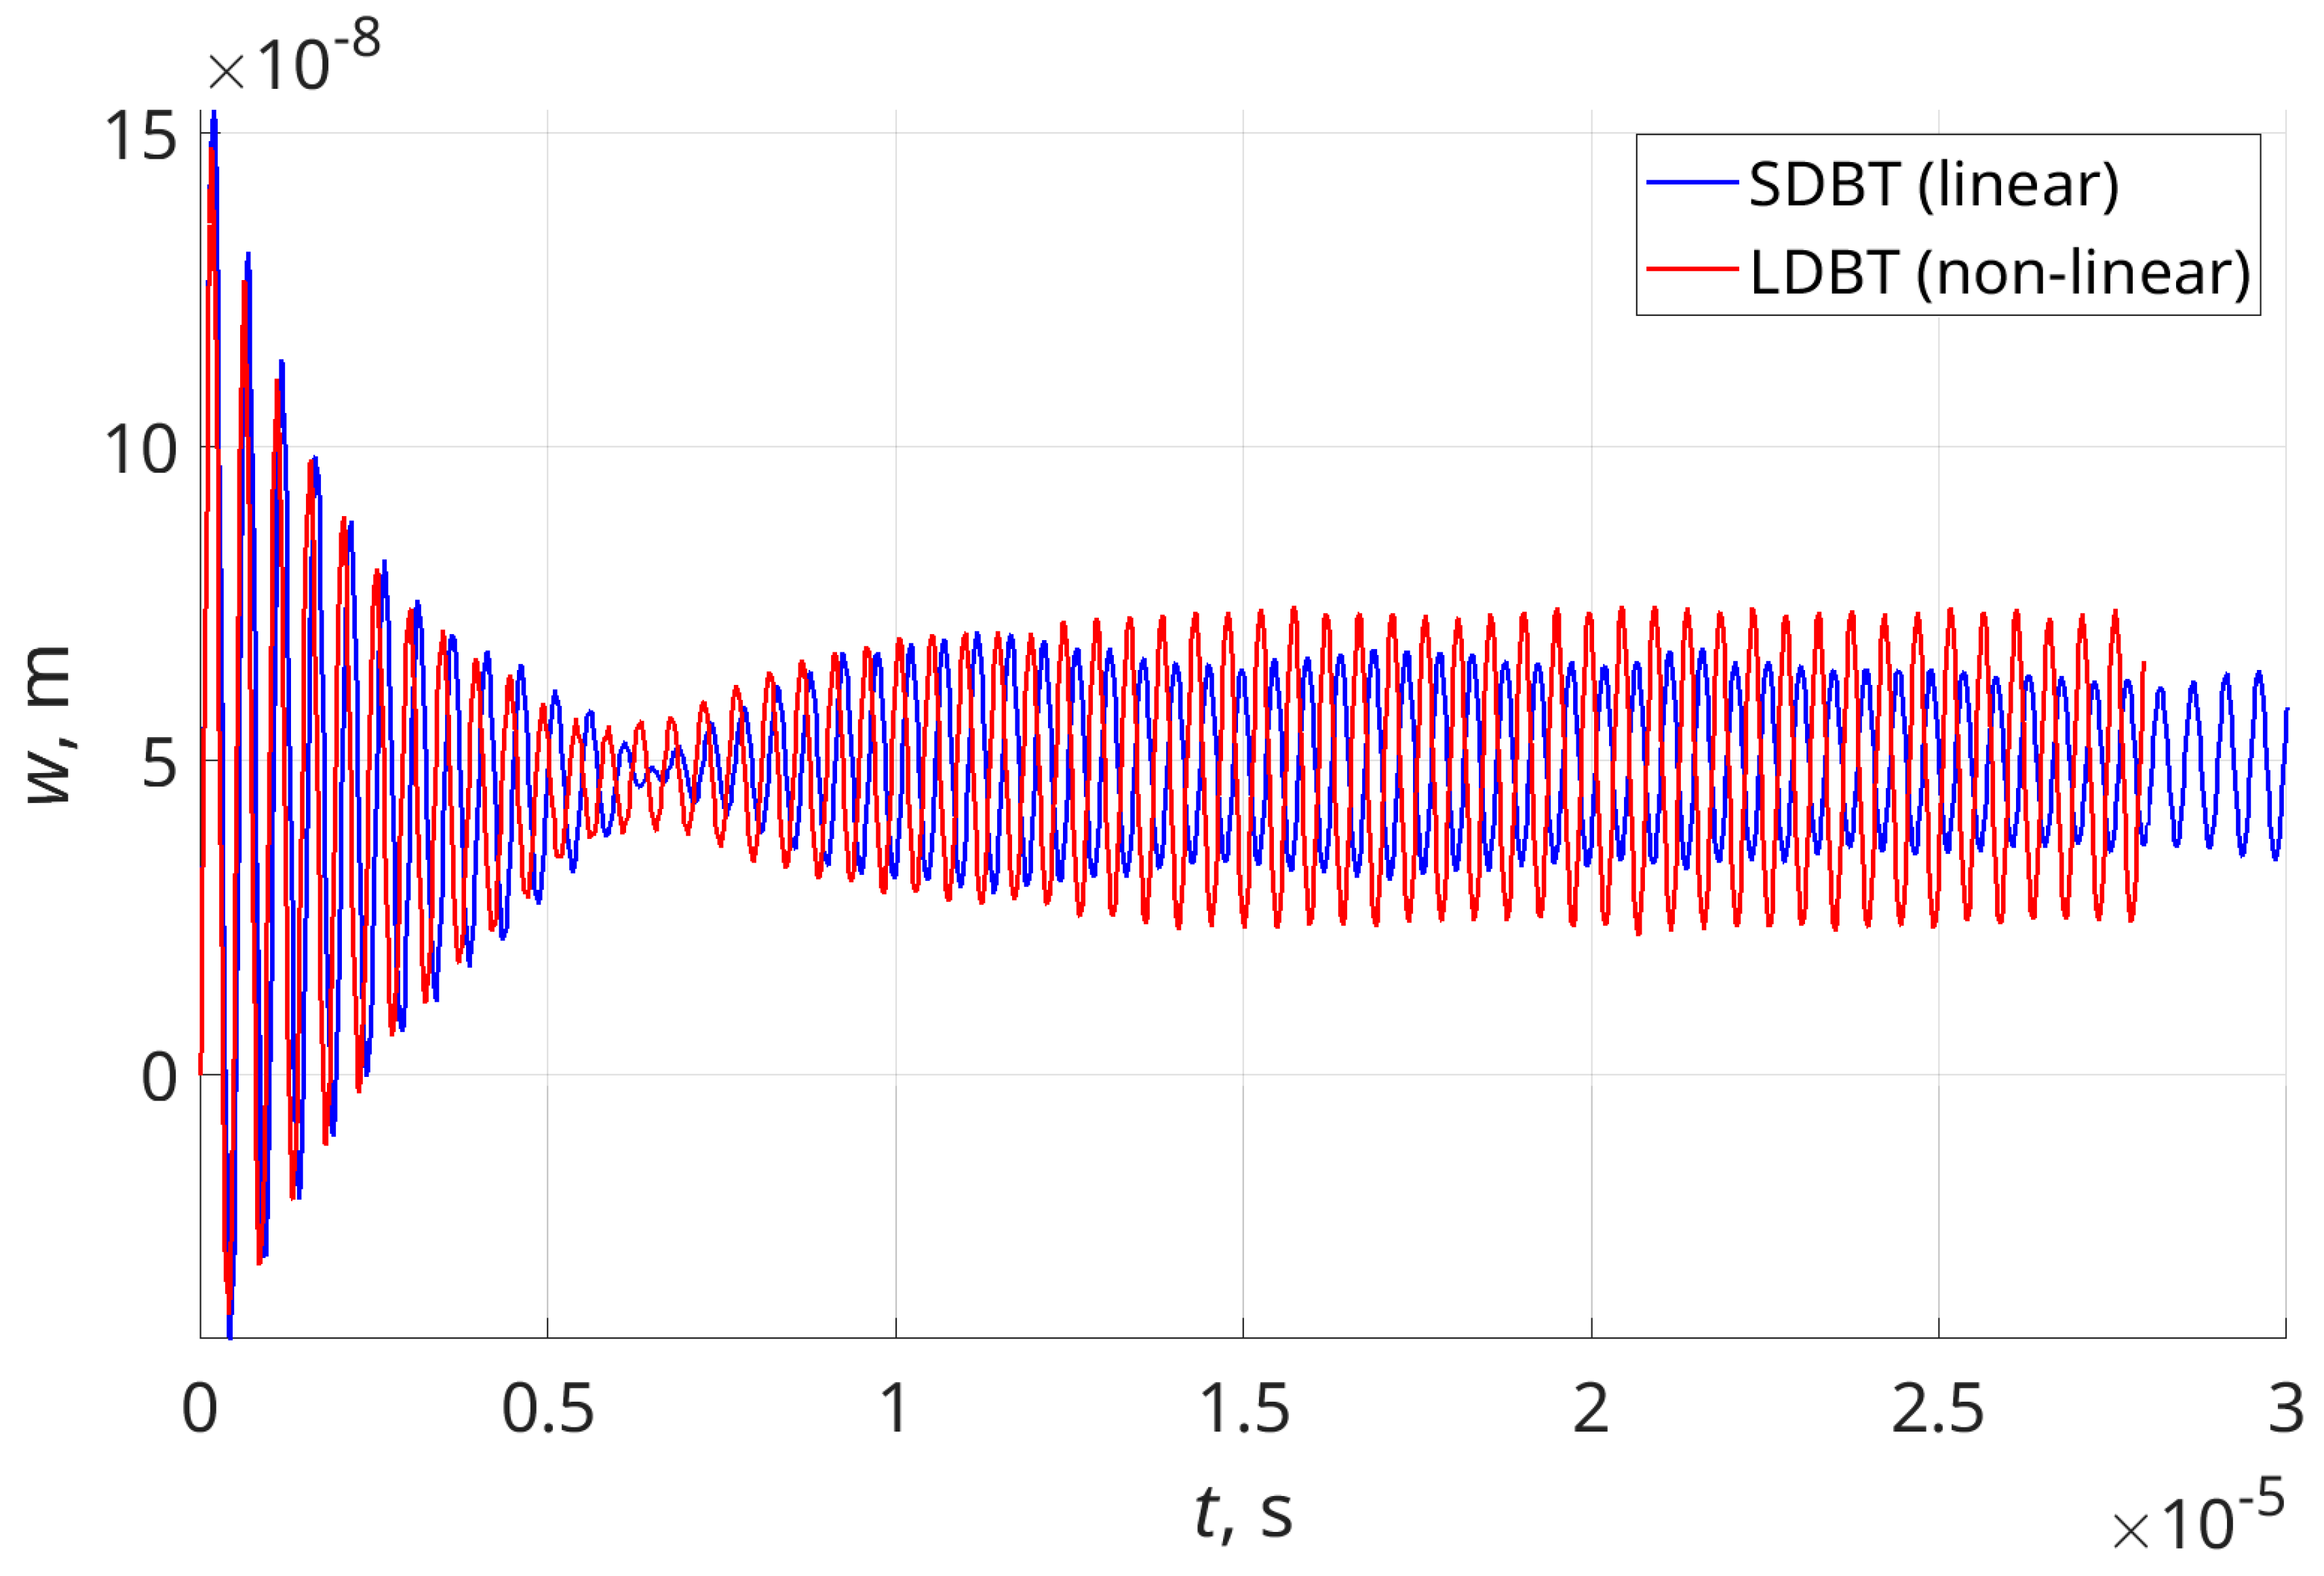
At time t = 0, the flow with an initial velocity equal to the free-stream velocity is initiated. As it interacts with the elastic beam, the beam undergoes bending. Figure 5 presents the time history of the load on the elastic micro-beam at a node near the tip from the start of the simulation. During the interval from 0 to 6 µs, the system exhibits a transitional regime. Subsequently, vortex shedding begins to develop. According to Figure 6, which shows the displacement of the beam tip, the established unsteady regime is reached after approximately 15 µs. Periodic fluctuations in the load are observed because of the vortex shedding detachment period, i.e., the VIV period. The resulting unsteady loading and vortex dynamics induce sustained vibrations in the beam. The filtered load clearly shows the period of VIV (see Figure 5). The data were filtered using a one-dimensional median filter with a window size of 500 points.
On the other hand, the original load of the flow on the beam is very irregular and looks stochastic (see Figure 5).
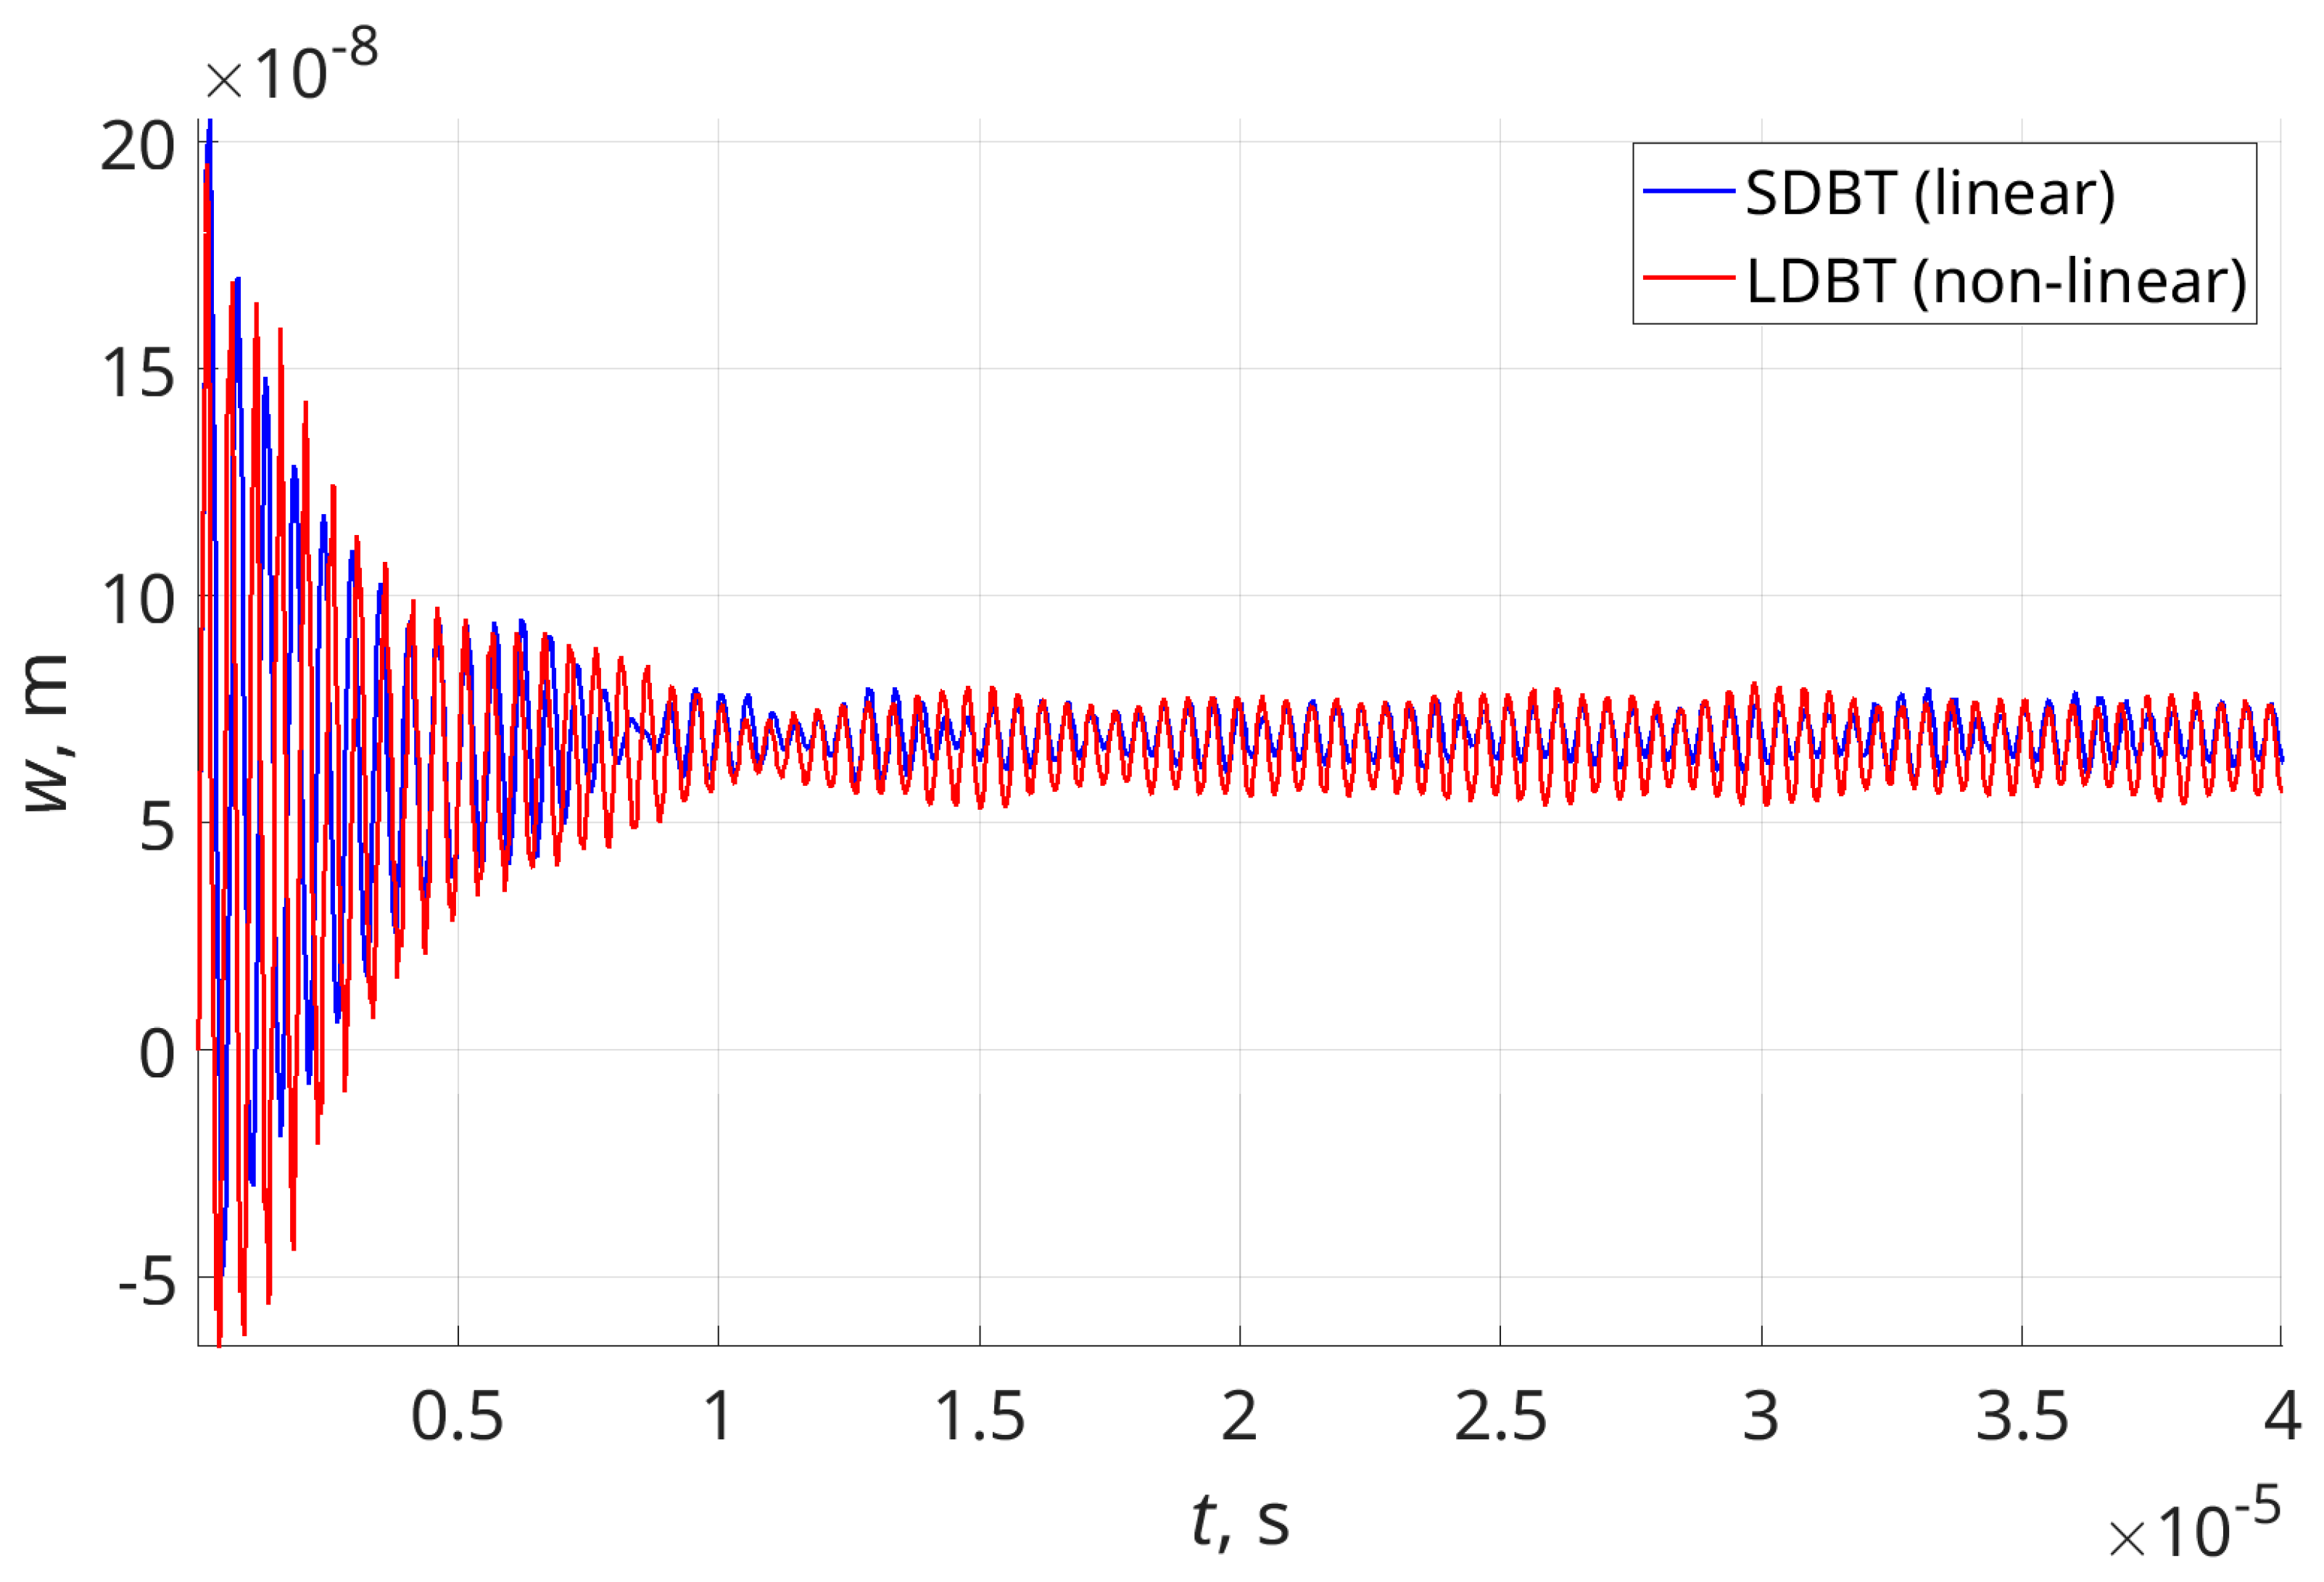
This loading leads to vibration as the ones shown in Figure 6 and Figure 7. In Figure 6, the dimensionless beam thickness ch = 0.017 and in Figure 7 ch = 0.020073. ch was varied within the interval [0.015, 0.0275].
As can be seen, at the beginning, the beam bends in the direction of the flow and oscillates with large amplitudes. After the transition period, which is usually around 12 μs, the vibrations continue in a steady-state regime around a new bent position of the beam.
In these figures are plotted the vibrations of the tip of the beam obtained by the small deflection beam theory (SDBT) in blue colour and by the large deflection beam theory (LDBT) in red colour. In the cases shown, the amplitudes of vibrations obtained by LDBT are larger than the ones obtained by SDBT, and the differences are bigger for ch = 0.019. The time history diagrams for the other cases of ch are similar to those shown in Figure 6 and Figure 7.
For the selected interval of ch, the first natural frequencies of the beams are placed in the interval ω/ωvortex ⊂ [0.75, 0.125]
Note the short time scales and small cantilever dimensions considered in this study. This suggests that such a sensor—or an array of sensors—could be capable of detecting rapid gas-phase processes in micro-electromechanical systems (MEMS), as well as those occurring in the boundary layer of high-speed vehicles such as racing cars or airplanes, under real-world conditions rather than in controlled laboratory settings.
Assuming that the transition period ends at 15 µs for all cases, the vibrations after that point are considered fully established (steady-state) (see Figure 6 and Figure 7).
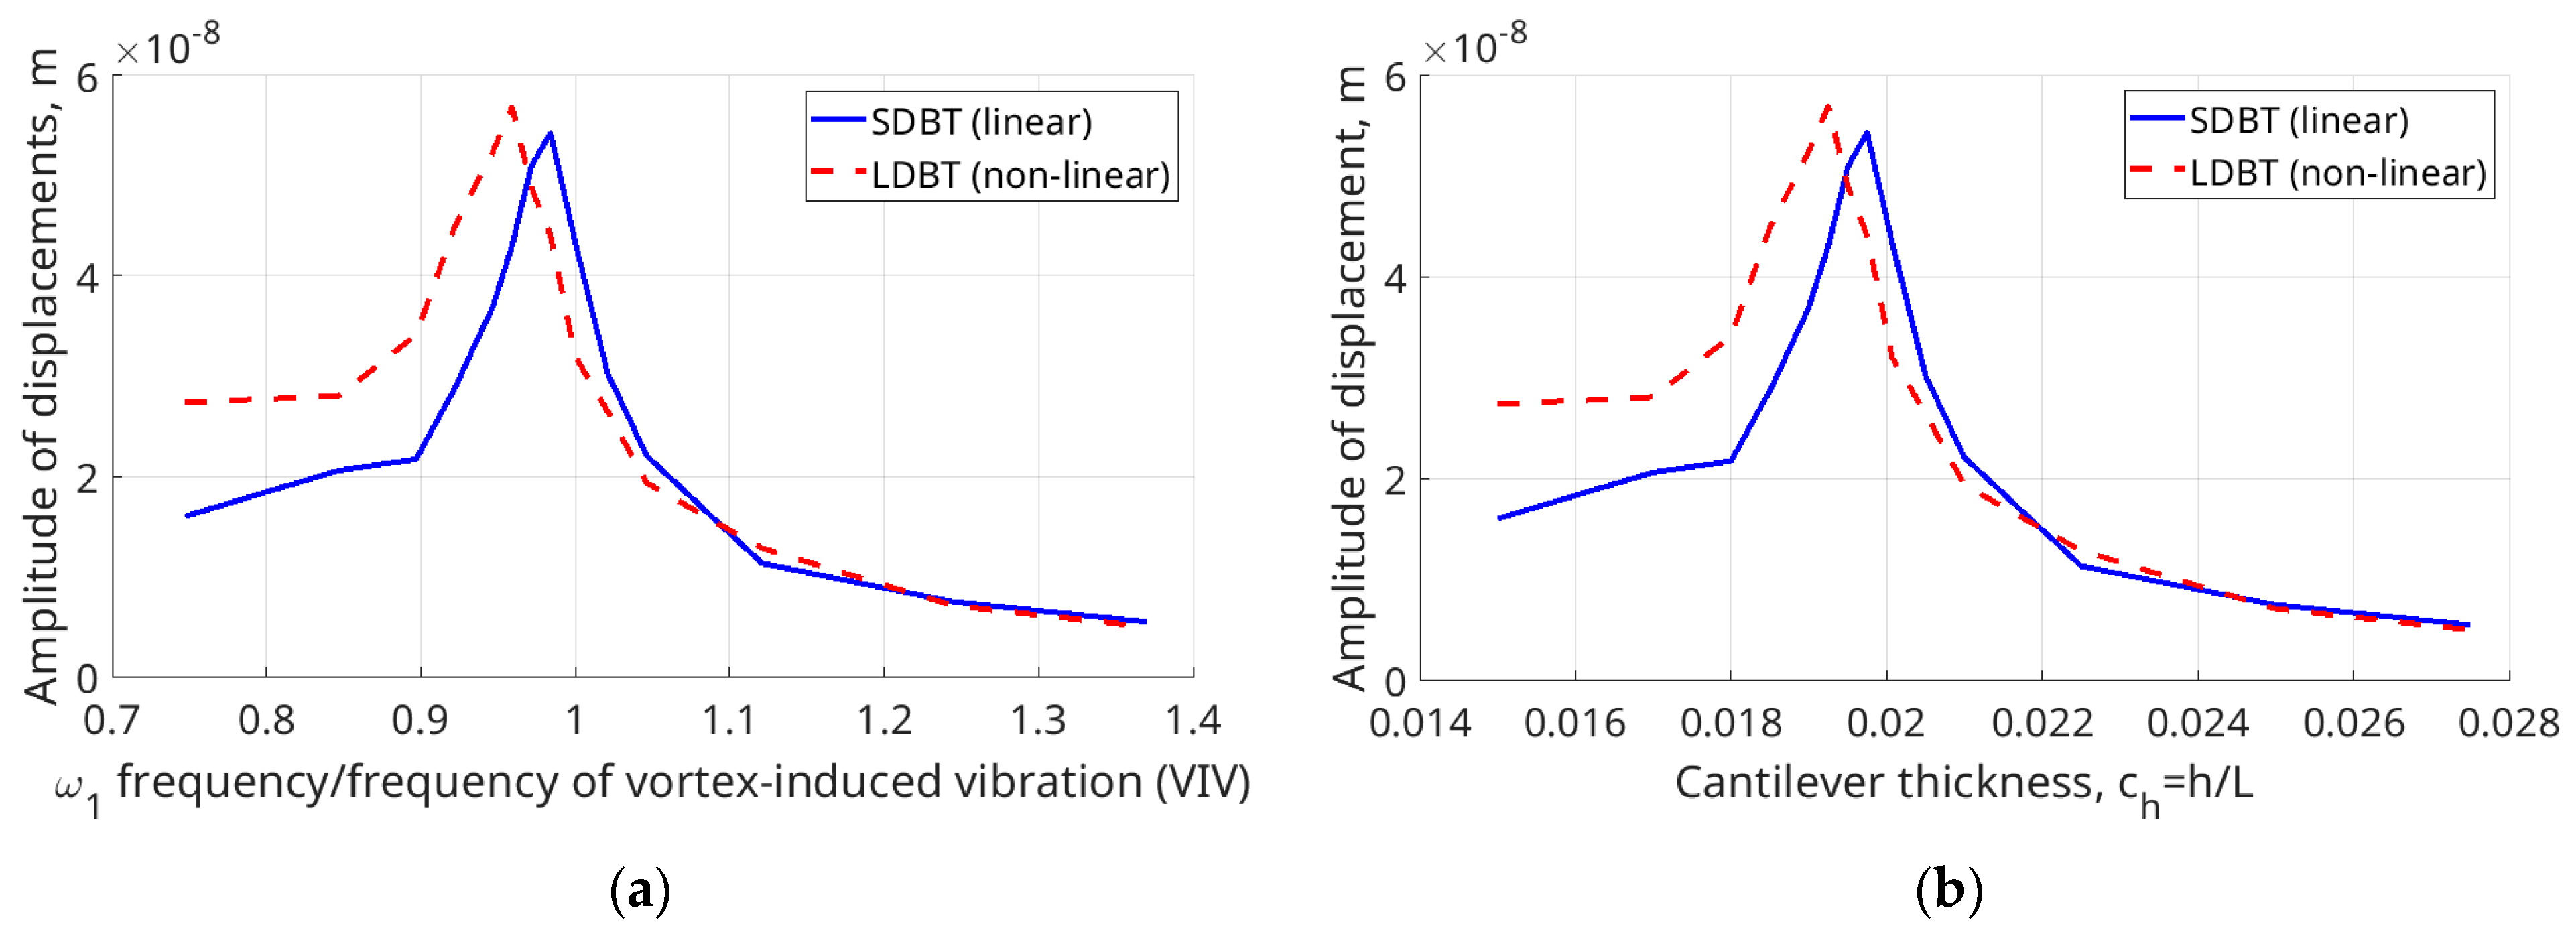
For the study-state vibration, the difference between the maximal and minimal value of the vibration amplitude, i.e., the range of oscillation, is plotted in Figure 8a,b.
It is seen that the difference between the range of the amplitudes obtained by SDBT and LDBT is larger for the thinner beams. This is because for thinner beams, the influence of the geometrically nonlinear terms, caused by large deflections, influences the response. More interesting is the fact that increasing the thickness of the beam the range of the amplitudes increases. The explanation is that for ch = 0.020073 the first natural frequency of the beam is almost equal to the frequency of the vortex shedding and a resonance-like phenomenon occurs. The maximal range of the amplitudes occurs for computations by LDBT at ch = 0.019. This means that the resonance of the beam described by LDBT occurs at ω/ωvortex ≈ 0.92. It is confirmed that LDBT, which considers the existence of longitudinal force, leads to increasing the frequency of the beam. For the linear beam theory, the maximal range of the oscillations is ω/ωvortex~1. In the beams with natural frequencies higher than the frequency of the flow, the range of oscillations quickly decreases, and the difference between the results obtained by SDBT and LDBT becomes negligible.
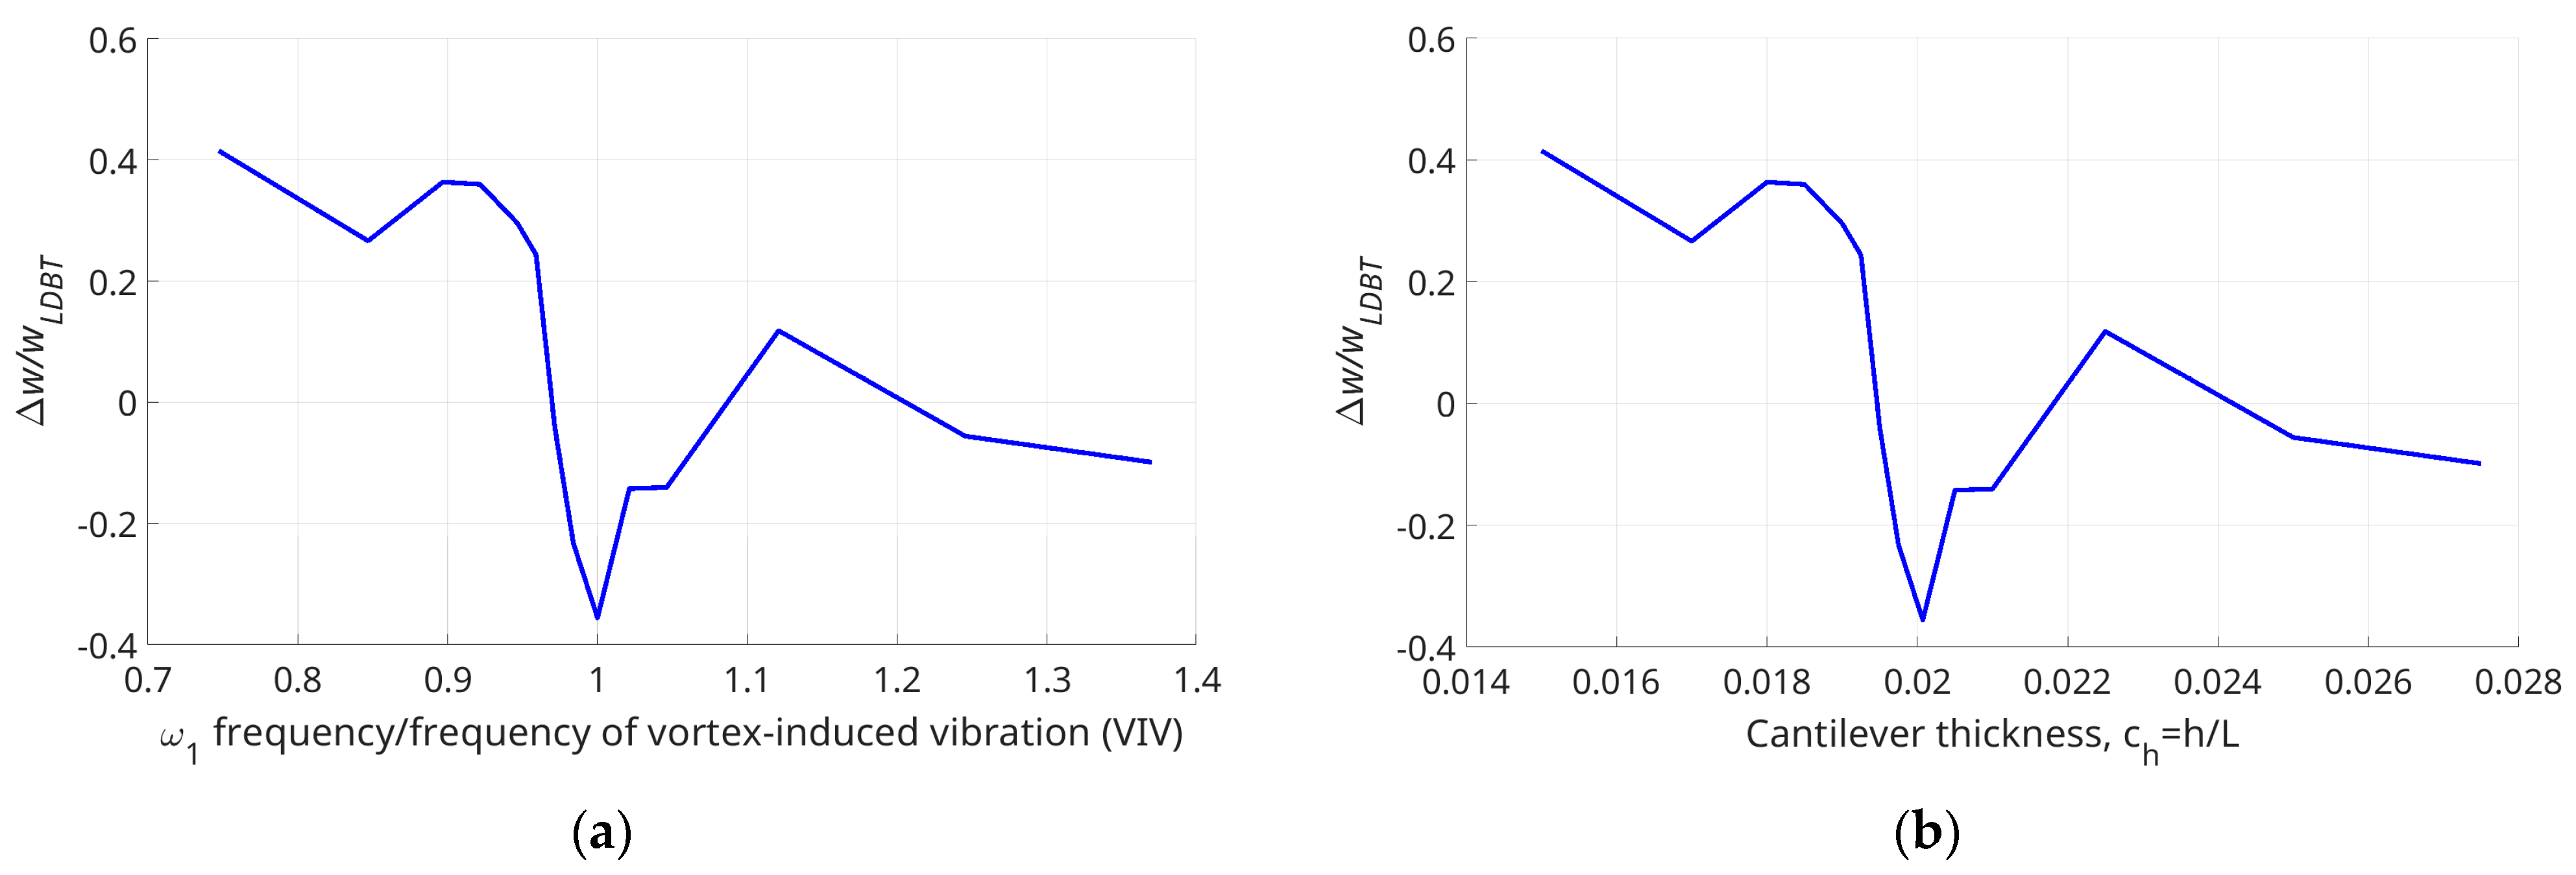
The significance of the nonlinearity on the cantilever’s response can be more clearly seen in Table 2 and Figure 9. Table 2 shows the values of the maximal amplitudes of vibration of the cantilever tip for different beam thicknesses obtained by SDBT and LDBT. The relative differences Δw/wLDBT = (wLDBTwSDBT)/wLDBT in dependence of the thickness (first natural frequency) is shown in Figure 9a,b. The maximal difference between the vibration amplitudes is in the beam with a natural frequency equal to the vortex frequency (ch = 0.02) and for the thinnest beams. The difference is about 40%. The amplitudes obtained by both theories are equal at ch = 0.0195 and then at ch ≈ 0.021 and ch ≈ 0.024. These results clearly show that in some important areas in the frequency domain, the results for the range of the vibration amplitudes could be rather wrong if the linear theory is used.
These long and complicated calculations clearly show that for the design of sensors or energy-harvesting devices based on FSI, it is important to use the proper beam theory, which considers the geometrically nonlinear effects.

6. Conclusions

In this work, theoretical and numerical modelling of the interaction between micro-cantilevers and rarefied gas flows was presented. The theoretical framework includes reduced-order modelling of the geometrically nonlinear vibrations of the beam. The rarefied gas flow is modelled using the Direct Simulation Monte Carlo (DSMC) method. A hybrid numerical approach ensures a full coupling between the mechanical and fluid dynamics, enabling comprehensive fluid–structure interaction (FSI) simulation.
Extensive computations were carried out using parallel codes executed on a supercomputer, examining both linear and geometrically nonlinear Euler–Bernoulli beam theories. A comparative analysis of the beam’s responses under these two theories was performed, with variations in beam thickness thus affecting the natural frequencies. Notably, the Kármán vortex street generated behind the elastic beam closely matches the first natural frequency of the specific beams under consideration.
The numerical studies confirmed that vibrations induced by the vortex could produce resonance-like phenomena, leading to increased vibration amplitudes in beams whose natural frequencies aligned with the vortex frequency. The results emphasize the necessity of employing geometrically nonlinear beam theory, particularly in the resonance zone, where the SDBT may yield inaccurate predictions. This insight is crucial for applications requiring resonance suppression or maximal amplitude generation, such as energy harvesting. This detailed analysis is expected to benefit designers of sensors and other microelectromechanical systems (MEMS) where the short time scales and small cantilever dimensions are important.

Author Contributions

E.M. conceptualized the work, created the mathematical model of the elastic beam, computer code for the beam vibration, and some visualization related to the beam. K.S. developed the DSMC code, numerical calculations, and visualizations related to the rarefied gas flows. S.D. performed validation of the elastic beam model and some visualizations related to the beam. All authors have read and agreed to the published version of the manuscript.

Funding

This work was accomplished with financial support from the Bulgarian research fund, grant KP-06-N72/7, 2023. All simulations were performed using our DSMC code on the supercomputer HEMUS at the Centre of Excellence in Informatics and ICT, financed by the OP SESG and co-financed by the EU through the ESIF. The work was partially supported by the Centre of Excellence in Informatics and ICT established under Grant No BG05M2OP001-1.001-0003, financed by the Science and Education for Smart Growth Operational Program and co-financed by the European Union through the European Structural and Investment funds.

Institutional Review Board Statement

Not applicable.

Informed Consent Statement

Not applicable.

Data Availability Statement

The original contributions presented in the study are included in the article, further inquiries can be directed to the corresponding author.

Conflicts of Interest

The authors declare no conflicts of interest.

References

  1. Zhao, L.; Wang, F.; Zhang, Y.; Zhao, X. Theoretical Study on the Dynamic Behavior of a Plate-Like Micro-Cantilever with Multiple Particles Attached. PLoS ONE 2016, 11, e0151821. [Google Scholar] [CrossRef] [PubMed]
  2. Yilmaz, C.; Sahin, R.; Topal, E.S. Theoretical Study on the Sensitivity of Dynamic Acoustic Force Measurement through Monomodal and Bimodal Excitations of Rectangular Micro-Cantilever. Eng. Res. Express 2021, 3, 045035. [Google Scholar] [CrossRef]
  3. Mohammadzadeh, A.; Roohi, E.; Niazmand, H.; Stefanov, S.; Myong, R.S. Thermal and Second-Law Analysis of a Micro- or Nanocavity Using Direct-Simulation Monte Carlo. Phys. Rev. E 2012, 85, 056310. [Google Scholar] [CrossRef]
  4. Shterev, K.; Manoach, E.; Stefanov, S. Hybrid Numerical Approach to Study the Interaction of the Rarefied Gas Flow in a Microchannel with a Cantilever. Int. J. Non-Linear Mech. 2019, 117, 103239. [Google Scholar] [CrossRef]
  5. Shterev, K.; Manoach, E. Geometrically Non-Linear Vibration of a Cantilever Interacting with Rarefied Gas Flow. Cybern. Inf. Technol. 2020, 20, 126–139. [Google Scholar] [CrossRef]
  6. Shterev, K.; Manoach, E.; Doneva, S. Vortex-Induced Vibrations of an Elastic Micro-Beam with Gas Modeled by DSMC. Sensors 2023, 23, 1933. [Google Scholar] [CrossRef]
  7. Bird, G.A. Molecular, Gas Dynamics and the Direct Simulation of Gas Flows; Clarendon Press: Oxford, UK, 1994. [Google Scholar]
  8. Changizi, M.A.; Stiharu, I. Nonlinear Analysis of Pull-In Voltage of Twin Micro-Cantilever Beams. Int. J. Mech. Eng. Mechatron. IJMEM 2017, 4, 11–17. [Google Scholar] [CrossRef]
  9. Changizi, M.A.; Stiharu, I. Viscosity Measurement for Picoliter Liquid Volumes Using Twin Micro-Cantilever Beams. In Proceedings of the 5th International Conference of Control, Dynamic Systems, and Robotics (CDSR’18), Niagara Falls, ON, Canada, 7–9 June 2018. [Google Scholar]
  10. Liu, M.; Zhang, B.; Guo, J.; Cheng, C. Research on the Vortex-Induced Vibration Performance and Vibration Suppression of Long-Span Suspension Bridge. In Proceedings of the Fifth International Conference on Green Energy, Environment, and Sustainable Development (GEESD 2024), Mianyang, China, 28–30 June 2024; Aghaei, M., Ren, H., Zhang, X., Eds.; SPIE: Bellingham CA, USA, 2024; p. 189. [Google Scholar]
  11. Jia, L.; Sang, S.; Shi, X.; Shen, F. Investigation on Numerical Simulation of VIV of Deep-Sea Flexible Risers. Appl. Sci. 2023, 13, 8096. [Google Scholar] [CrossRef]
  12. Han, X.; Zhang, X.; Tang, Y.; Qiu, A.; Lin, W.; Zhao, C. Dynamic Mechanism of Phase Differences in One Degree-of-Freedom Vortex-Induced Vibration of a Cylindrical Structure. Proc. Inst. Mech. Eng. Part M J. Eng. Marit. Environ. 2019, 233, 80–92. [Google Scholar] [CrossRef]
  13. Tang, C.P.; Zhang, L.L. Study on the Vortex-Induced Vibration of a Long-Span Arch Bridge. Appl. Mech. Mater. 2014, 488–489, 681–684. [Google Scholar] [CrossRef]
  14. Bukka, S.R.; Magee, A.R.; Jaiman, R.K. Stability Analysis of Passive Suppression for Vortex-Induced Vibration. J. Fluid Mech. 2020, 886, A12. [Google Scholar] [CrossRef]
  15. Chen, W.-L.; Gao, D.; Laima, S.; Li, H. A Field Investigation on Vortex-Induced Vibrations of Stay Cables in a Cable-Stayed Bridge. Appl. Sci. 2019, 9, 4556. [Google Scholar] [CrossRef]
  16. Yan, Y.F. Axial Load on the Submarine Pipeline Suspended Law of Vortex Induced Vibration. Appl. Mech. Mater. 2011, 94–96, 1511–1514. [Google Scholar] [CrossRef]
  17. Van Den Abeele, F.; Boël, F.; Hill, M. Fatigue Analysis of Free Spanning Pipelines Subjected to Vortex Induced Vibrations. In Proceedings of the Volume 7: CFD and VIV, Nantes, France, 9–14 June 2013; American Society of Mechanical Engineers: New York, NY, USA, 2013; p. V007T08A039. [Google Scholar]
  18. Tao, S.; Tang, A.; Xin, D.; Liu, K.; Zhang, H. Vortex-Induced Vibration Suppression of a Circular Cylinder with Vortex Generators. Shock Vib. 2016, 2016, 5298687. [Google Scholar] [CrossRef]
  19. Chen, J.; Chen, M.Z.Q.; Hu, Y. Vortex-Induced Vibration Suppression of Bridges by Inerter-Based Dynamic Vibration Absorbers. Shock Vib. 2021, 2021, 4431516. [Google Scholar] [CrossRef]
  20. Imaoka, K.; Kobayashi, Y.; Emaru, T.; Hoshino, Y. Vortex-Induced Vibration of an Elastically-Supported Cylinder Considering Random Flow Effects. SICE J. Control Meas. Syst. Integr. 2015, 8, 131–138. [Google Scholar] [CrossRef]
  21. Cai, Q.; Li, Z.; Chan, R.W.K.; Luo, H.; Duan, G.; Huang, B.; Wu, H. Study on the Vibration Characteristics of Marine Riser Based on Flume Experiment and Numerical Simulation. J. Mar. Sci. Eng. 2023, 11, 1316. [Google Scholar] [CrossRef]
  22. Weinstein, L.A.; Cacan, M.R.; So, P.M.; Wright, P.K. Vortex Shedding Induced Energy Harvesting from Piezoelectric Materials in Heating, Ventilation and Air Conditioning Flows. Smart Mater. Struct. 2012, 21, 045003. [Google Scholar] [CrossRef]
  23. Hu, Y.; Yang, B.; Chen, X.; Wang, X.; Liu, J. Modeling and Experimental Study of a Piezoelectric Energy Harvester from Vortex Shedding-Induced Vibration. Energy Convers. Manag. 2018, 162, 145–158. [Google Scholar] [CrossRef]
  24. Huff, E.H.; Chen, H.; Poovathingal, S.J. A Fluid-Structure Computational Framework for Atmospheric Ice in Hypersonic Environments. In Proceedings of the AIAA SCITECH 2024 Forum, Orlando, FL, USA, 8–12 January 2024; American Institute of Aeronautics and Astronautics: Reston, VA, USA, 2024. [Google Scholar]
  25. Meirovitch, L. Fundamentals of Vibrations; Mechanical Engineering Series; McGraw-Hill: Boston, MA, USA, 2008; ISBN 978-0-07-288180-6. [Google Scholar]
  26. Stefanov, S.K. Comparison between Navier-Stokes and DSMC Calculations for Low Reynolds Number Slip Flow Past a Confined Microsphere. In Proceedings of the AIP Conference Proceedings, Honolulu, HI, USA, 18–20 December 2005; AIP: Bari, Italy, 2005; Volume 762, pp. 701–706. [Google Scholar]
  27. Stefanov, S.K. On DSMC Calculations of Rarefied Gas Flows with Small Number of Particles in Cells. SIAM J. Sci. Comput. 2011, 33, 677–702. [Google Scholar] [CrossRef]
  28. Shterev, K. The Correctness of the Simplified Bernoulli Trial (SBT) Collision Scheme of Calculations of Two-Dimensional Flows. Micromachines 2021, 12, 127. [Google Scholar] [CrossRef] [PubMed]
  29. Bird, G.A. Visual DSMC Program for Two-Dimensional and Axially Symmetric Flows, The DS2V Program User’s Guide, Ver. 2.1; G.A.B. Consulting Pty Ltd.: Sydney, Australia, 2003. [Google Scholar]
  30. Geuzaine, C.; Remacle, J.-F. Gmsh: A 3-D Finite Element Mesh Generator with Built-in Pre- and Post-Processing Facilities: THE GMSH PAPER. Int. J. Numer. Meth. Engng. 2009, 79, 1309–1331. [Google Scholar] [CrossRef]
  31. Shterev, K.S. Boundary Condition at Infinity for DSMC Method. AIP Conf. Proc. 2024, 3094, 030016. [Google Scholar]
  32. Farhat, C.; Van Der Zee, K.G.; Geuzaine, P. Provably Second-Order Time-Accurate Loosely-Coupled Solution Algorithms for Transient Nonlinear Computational Aeroelasticity. Comput. Methods Appl. Mech. Eng. 2006, 195, 1973–2001. [Google Scholar] [CrossRef]
  33. Garcia, A. Direct Simulation Monte Carlo: Theory, Methods, and Open Challenges; NATO: Berkeley, CA, USA, 2011. [Google Scholar]
Figure 1. Geometry of flow past elastic cantilever beam placed normal to free stream.
Applsci 15 05547 g001
Figure 2. Finite element discretization of the beam.
Applsci 15 05547 g002
Figure 3. Response of the tip of the beam subjected to a step load p = 12,000 Pa according to the reduced model (large deflection beam theory) and ANSYS.
Applsci 15 05547 g003
Figure 4. (a) Mach number field and streamlines; (b) DSMC basic mesh is Cartesian uniform mesh with TAS and mesh near cantilever is unstructured adaptive mesh.
Applsci 15 05547 g004
Figure 5. Load at a node near the tip in time; beam thickness is ch = 0.0170, nonlinear elastic beam model.
Applsci 15 05547 g005
Figure 6. Time history diagram of the vibration of the tip of the beam in case ch = 0.0170.
Applsci 15 05547 g006
Figure 7. Time history diagram of the vibration of the tip of the beam in case ch = 0.0190.
Applsci 15 05547 g007
Figure 8. The amplitude of displacement of the beam modelled by the linear and nonlinear beam theories as a function of: (a) frequency ratio (first natural frequency over VIV frequency); and (b) cantilever thickness.
Applsci 15 05547 g008
Figure 9. The relative differences of the amplitudes of displacements obtained by the linear and nonlinear beam theories as a function of: (a) frequency ratio (first natural frequency over VIV frequency); and (b) cantilever thickness.
Applsci 15 05547 g009
Table 1. Natural frequencies of the beam, MHz.
Euler–BernoulliTimoshenkoANSYS
121.452 MHz21.225 MHz21.48 MHz
2134.44 MHz134.15 MHz134.41 MHz
3376.42 MHz374.5 MHz375.4 MHz
Table 2. Amplitudes of displacements and considered micro-beams modelled by linear and nonlinear models.
ω1/ωvortexCantilever
Thickness,
ch = h/L
Amplitude of Displacement,
SDBT (Linear), m
Amplitude of
Displacement,
LDBT (Nonlinear), m
Δw/wLDBT
0.747280.0151.60 × 10−8 2.73 × 10⁻⁸ 0.415
0.846930.0172.06 × 10−8 2.80 × 10⁻⁸ 0.266
0.896750.0182.17 × 10−8 3.41 × 10⁻⁸ 0.364
0.921660.01852.87 × 10−8 4.48 × 10⁻⁸ 0.360
0.946580.0193.69 × 10−8 5.24 × 10⁻⁸ 0.296
0.9590.019254.30 × 10−8 5.69 × 10⁻⁸ 0.244
0.971410.01955.09 × 10−8 4.89 × 10⁻⁸ −0.040
0.983910.019755.43 × 10−8 4.40 × 10⁻⁸ −0.233
10.0200734.33 × 10−8 3.19 × 10⁻⁸ −0.356
1.02120.02053.02 × 10−8 2.64 × 10⁻⁸ −0.143
1.04610.0212.20 × 10−8 1.93 × 10⁻⁸ −0.140
1.12090.02251.13 × 10−8 1.28 × 10⁻⁸ 0.118
1.24540.0257.43 × 10−9 7.04 × 10⁻⁹ −0.056
1.370.02755.43 × 10−9 4.94 × 10⁻⁹ −0.099
Disclaimer/Publisher’s Note: The statements, opinions and data contained in all publications are solely those of the individual author(s) and contributor(s) and not of MDPI and/or the editor(s). MDPI and/or the editor(s) disclaim responsibility for any injury to people or property resulting from any ideas, methods, instructions or products referred to in the content.