Abstract
To improve the performance of vehicle target detection in complex traffic environments and solve the problem that it is difficult to make a lightweight detection model, this paper proposes a lightweight vehicle detection model based on enhanced You Only Look Once v8. This method improves the feature extraction aggregation network by introducing an Adaptive Downsampling module, which can dynamically adjust the downsampling method, thereby increasing the model’s attention to key features, especially for small objects and occluded objects, while maintaining a lightweight structure, effectively reducing the model complexity while improving detection accuracy. A Lightweight Shared Convolution Detection Head was designed. By designing a shared convolution layer through group normalization, the detection head of the original model was improved, which can reduce redundant calculations and parameters and enhance the ability of global information fusion between feature maps, thereby achieving the purpose of improving computational efficiency. When tested in the KITTI 2D and UA-DETRAC datasets, the mAP of the proposed model was improved by 1.1% and 2.0%, respectively, the FPS was improved by 12% and 11%, respectively, the number of parameters was reduced by 33%, and the FLOPs were reduced by 28%.
1. Introduction
With the rapid development of the economy, transportation has become an important industry that supports the country’s economic growth. The ensuing traffic congestion and safety hazards have become increasingly prominent, seriously affecting people’s travel efficiency and quality of life. With respect to the driver, improper action usually leads to a higher risk of traffic accidents [1]. Numerous developing countries are prioritizing intelligent transportation systems to improve the efficiency of traffic management [2]. Vehicle target detection can significantly improve the convenience and comfort of public travel and improve overall quality of life, provide support for intelligent transportation systems, and contribute to the intelligent and sustainable development of urban transportation.
Traditional non-intelligent algorithms typically have the advantages of simplicity and low computational cost [3]. There are three main vehicle inspection methods. The background update method [4] relies on weighted averaging to refresh the background, but this can adversely affect the completeness of target extraction and reduce detection accuracy [5]. The frame difference technique [6] detects targets by calculating the difference between consecutive frames; however, it is highly sensitive to factors such as vehicle speed and time gap between frames [7]. The optical flow method [8], on the other hand, is a technique for estimating the density at the pixel level [9]. The detection process begins with the generation of numerous candidate frames using sliding windows of varying sizes. The features are extracted from these frames, which are then used in conjunction with a classifier to detect and precisely determine the location of each target. However, the large computational load poses significant challenges for real-time target detection. The vehicle detection features communicated include Scale Invariant Feature Transform (SIFT), Histogram of Oriented Gradient (HOG), Haar-like Features (Haar), etc. [10,11,12,13], while classifier devices include Support Vector Machine (SVM), Adaptive Boosting (Adaboost), etc. [14,15]. Common vehicle detection models are Haar + Adaboost, HOG + SVM, and the Deformable Part Model (DPM) [16]. Traditional feature selection methods rely on a priori knowledge, but in real application scenarios, multiple objective interferences such as light changes and deformation exist. Detection algorithms face challenges when applied in real-world situations, often lacking the precision and robustness needed for practical implementation [17,18,19]. With the advent of the Convolutional Neural Network (CNN), researchers have found that the feature extraction process in CNN mirrors the human visual system, progressing from edge detection to local features and ultimately to the whole image [20,21]. Since the beginning of the 21st century, the emergence of deep learning has revolutionized computer vision, shifting it from dependence on manually crafted features to attaining higher levels of accuracy and intelligence [22,23].
Vehicle detection often encounters challenges such as varying object scales, dense traffic, and real-time processing requirements. The Region-CNN (R-CNN) [24] framework introduced a two-stage approach using a selective search for proposal generation, but it is slow and computationally expensive. Fast R-CNN [25] improved efficiency by extracting features from the entire image, but still relied on external proposal methods. The Faster R-CNN [26] further introduced a Region Proposal Network, enabling faster and more accurate detection. Despite the fact that these models excel in complex scenes with occlusion, their significant computational demands restrict their applicability to real-time vehicle detection systems.
To cater to the real-time demands of vehicle detection in intricate traffic environments, single-stage object detection algorithms have gained popularity. These approaches eliminate the region proposal step utilized in two-stage detectors, enabling faster inference with relatively lower computational overhead. The Single Shot Multibox Detector (SSD) [27] stands out as one of the initial single-stage models, enhancing detection speed through the incorporation of multiscale feature maps. However, SSD typically struggles to identify small objects, which is a common occurrence in distant or partially obstructed vehicle instances. In contrast, the You Only Look Once (YOLO) series [28] reimagines detection as a unified regression task, handling both category prediction and bounding box regression within a single network. YOLO surpasses SSD in terms of speed and end-to-end modeling capabilities. In particular, in YOLOv5 and subsequent iterations, enhancements to the network structure and loss function have not only enabled real-time detection, but also significantly improved detection accuracy for small targets and occlusion scenarios. These advances effectively address the need for high-performance and low-latency detectors in practical traffic settings.
In recent times, the field of vehicle target detection has faced significant challenges with respect to real-time processing and accuracy in complex environments, which are crucial for intelligent transportation and autonomous driving. To address the constraints of devices with limited resources, MobileNet [29], recognized for its efficiency, is commonly used as a foundational network to create mobile detectors such as MobileNet-YOLO due to its compact size and quick inference abilities. Although MobileNet excels at speed, it encounters challenges in expressing features comprehensively, leading to issues in dealing with intricate scenarios, such as occlusion or detecting small targets. In contrast, the Efficient Detection (EfficientDet) series [30] incorporates pyramidal features in a lightweight manner, achieving a balance between precision and efficiency in vehicle detection. However, its detection accuracy lags behind newer architectures, and it is less sensitive to detecting complex objects. Recently, a Transformer-based Real-Time Detection Transformer (RT-DETR) [31] has emerged, providing improved modeling capabilities and real-time performance. Despite its advantages, the high computational requirements of RT-DETR pose challenges in practical implementation. Consequently, developing a vehicle detection model that considers accuracy, speed, and deployment efficiency remains a complex research pursuit.
To improve the performance of vehicle target detection in complex traffic environments and solve the problem that it is difficult to use a lightweight model as a detection model, this article proposes a lightweight vehicle detection model based on enhanced YOLOv8. The model retains the structure of the upper layer of the backbone and introduces the Adaptive Downsampling (ADown) module to improve the convolution structure in the Convolution-BatchNorm-SiLU module (CBS) of the lower layer of the backbone and the convolution structure in the CBS module of the neck. Through Adaptive Downsampling, the computational pressure problem in high-resolution image processing is solved, detailed information of key vehicle targets is effectively retained, and detection accuracy and real-time performance are improved. A Lightweight Shared Convolutional Detection Head (LSCD) is proposed. The shared convolutional layer is designed using group normalization to replace the head convolutional structure, so that the classification, regression, and confidence tasks share the convolutional layer, and the network structure of the original model detection head is reconstructed, which solves the computational bottleneck of accurate and real-time recognition of vehicle targets in complex traffic scenarios and improves the accuracy and speed of vehicle detection. We conducted detailed experiments on two datasets, and the results show that the model is suitable for multitype vehicle target detection in a variety of weather and scenarios. This research is of great practical significance for intelligent transportation.
2. Preliminary
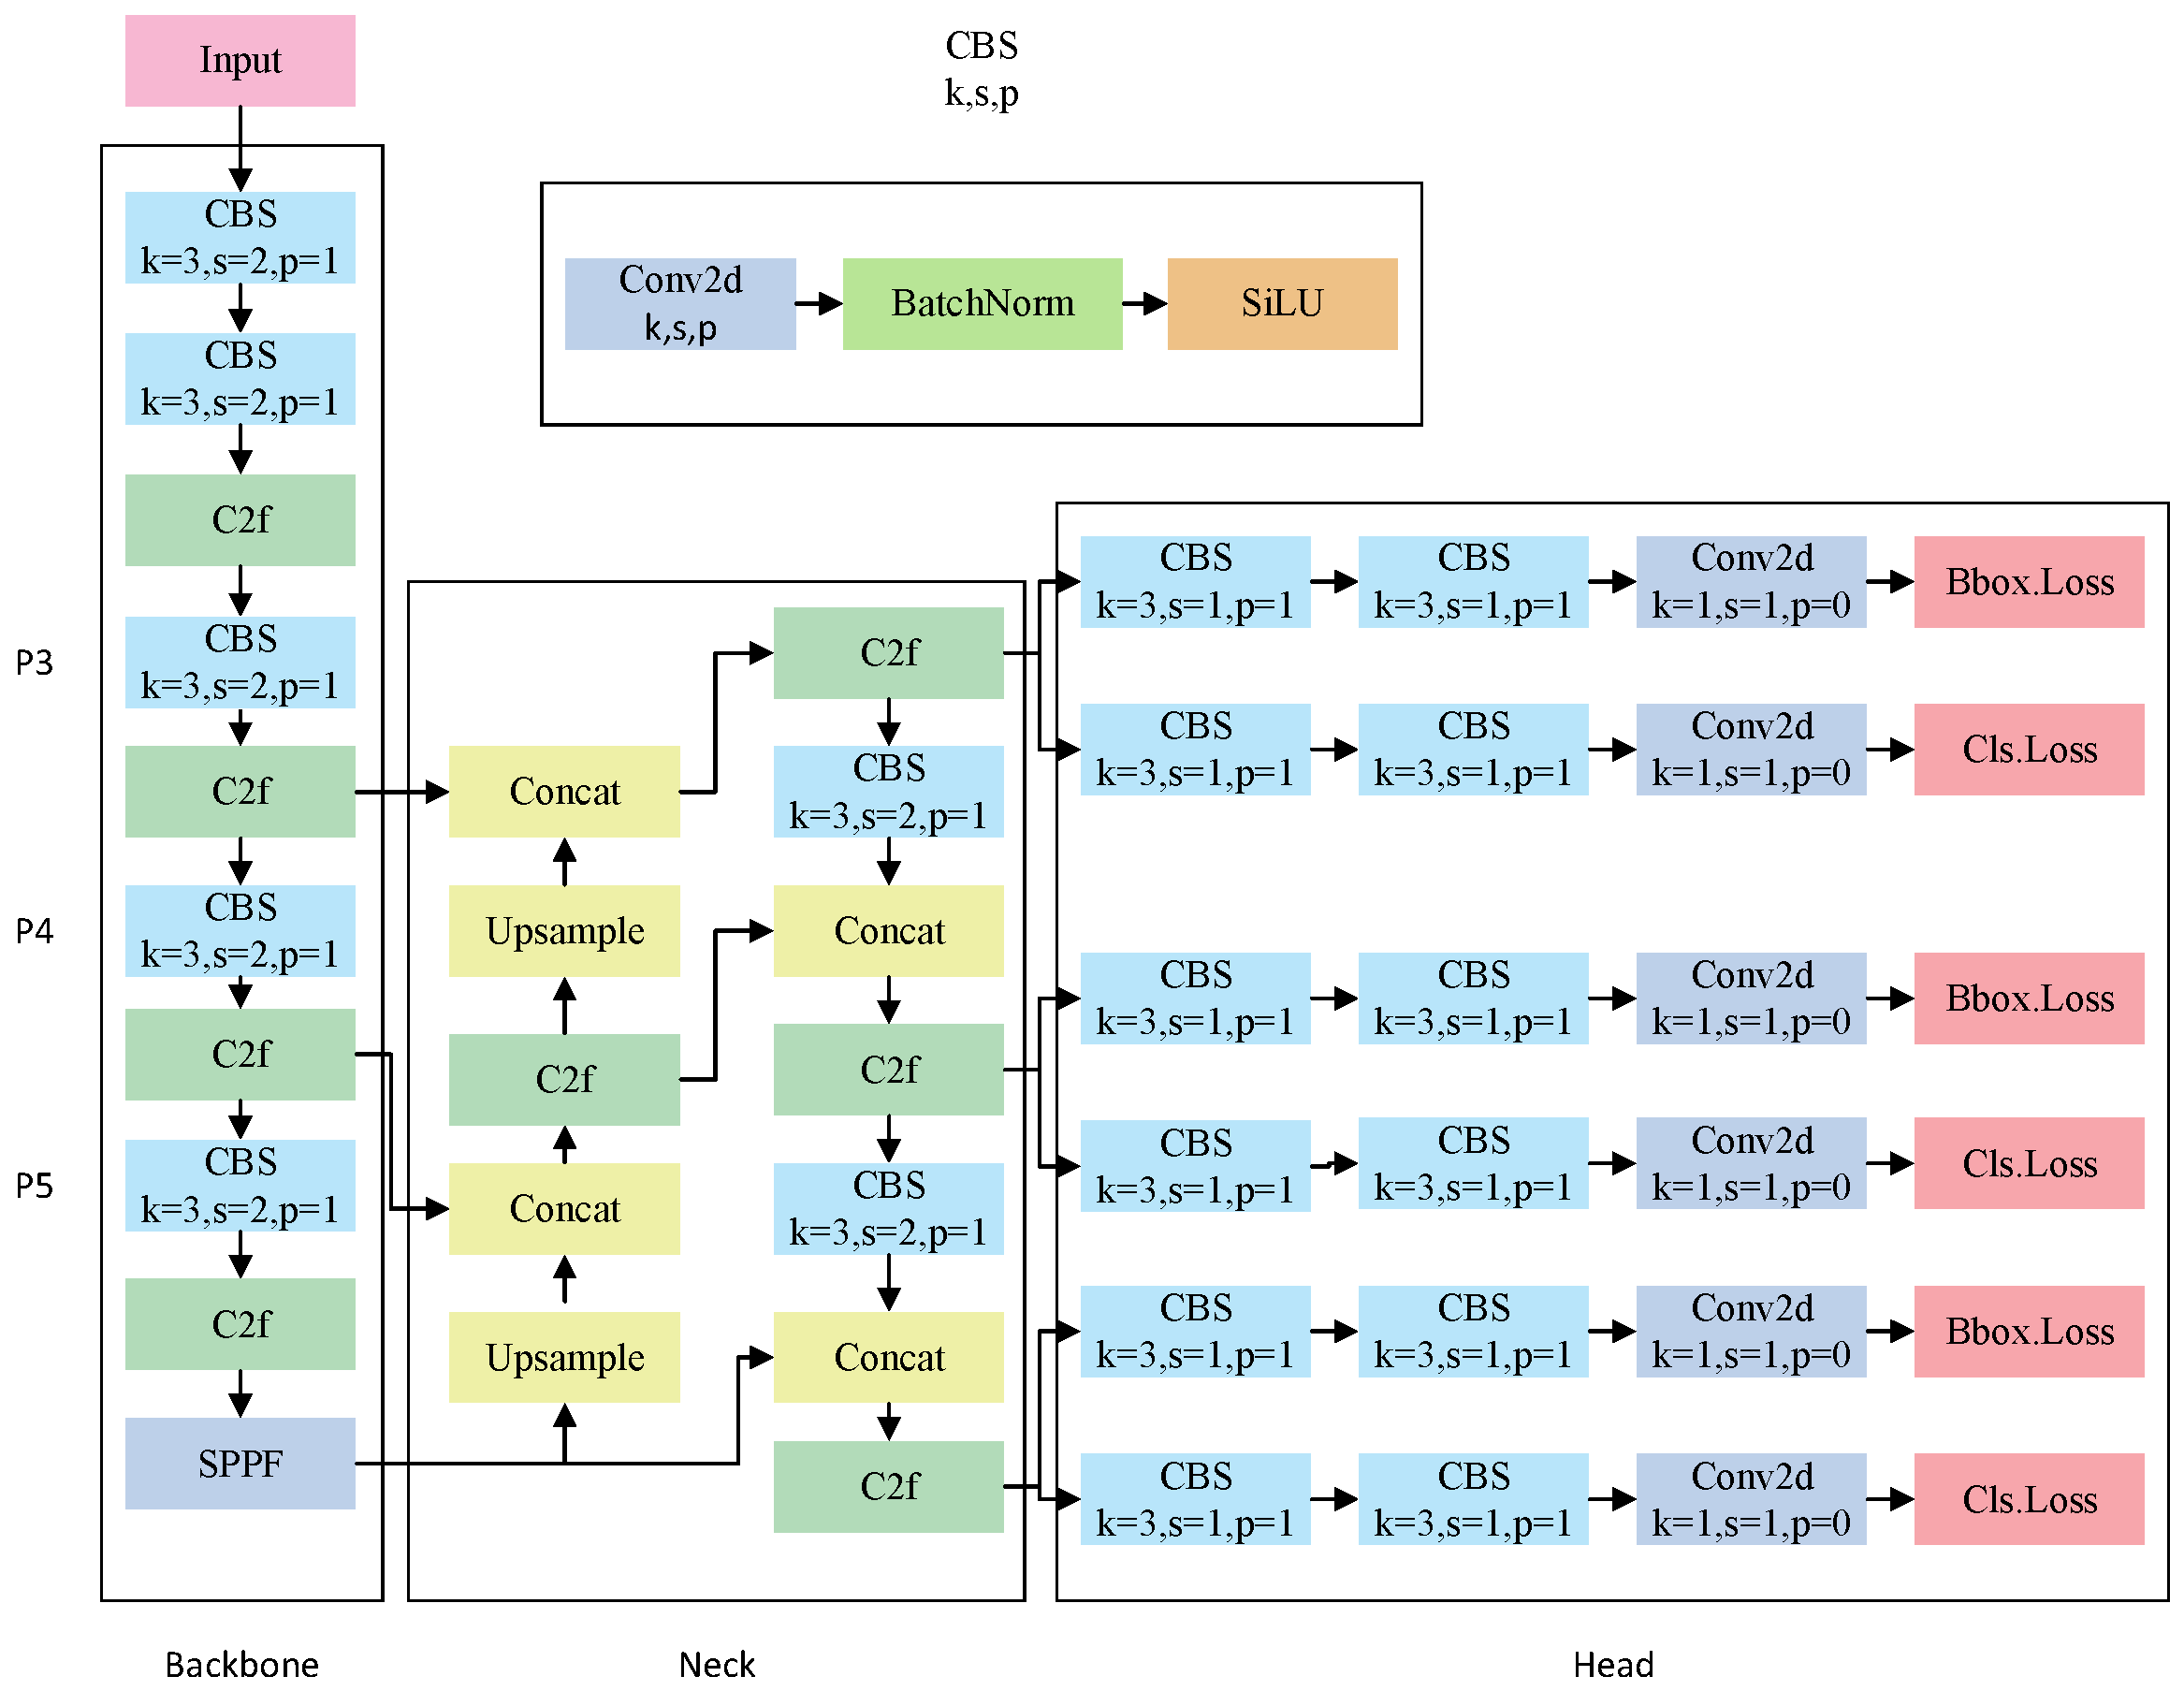
YOLOv8 [32] provides five variants of the model: YOLOv8n, YOLOv8s, YOLOv8m, YOLOv8l, and YOLOv8x, which are differentiated by depth and width. As the accuracy of the model increases, there is a notable increase in both the parameter count and the computational complexity. In this paper, YOLOv8n is used to detect vehicle targets. The YOLOv8 model performs adaptive image scaling, adaptive anchor box calculation, and a variety of data enhancement techniques at the input end. When using different image sizes for prediction, the model uses operations such as scaling and padding to convert the input image to an input size of 640 × 640, automatically analyzes the target box size in the training set, calculates the optimal anchor box distribution, and uses data enhancement methods such as Mosaic enhancement, MixUp enhancement, Affine transform, color jitter, and random flipping. The backbone is composed of several convolutional layers that extract features, progressively converting the original image into increasingly abstract semantic representations. The neck handles multiscale feature fusion, combining feature maps from various stages of the backbone to enhance the model’s feature representation. By merging feature information across scales using horizontal connections and a pyramid-like hierarchy, the model improves its ability to detect multiscale targets. The head performs final object detection and classification, utilizing a decoupled head structure that separates object classification and bounding box regression into independent network branches, each with specialized heads for classification and localization tasks. Figure 1 shows the network architecture of YOLOv8.
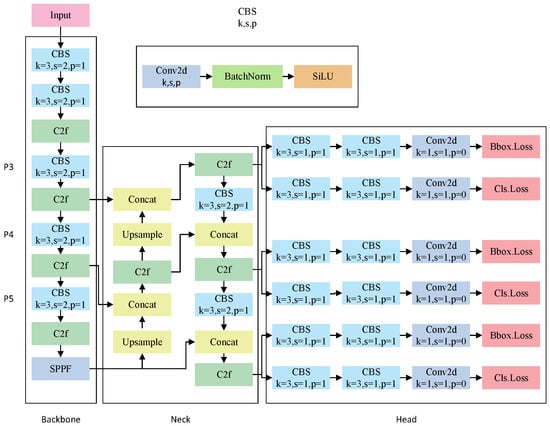
Figure 1.
YOLOv8 network model.
3. Methods
3.1. Lightweight Vehicle Target Detection Algorithm YOLO-AL
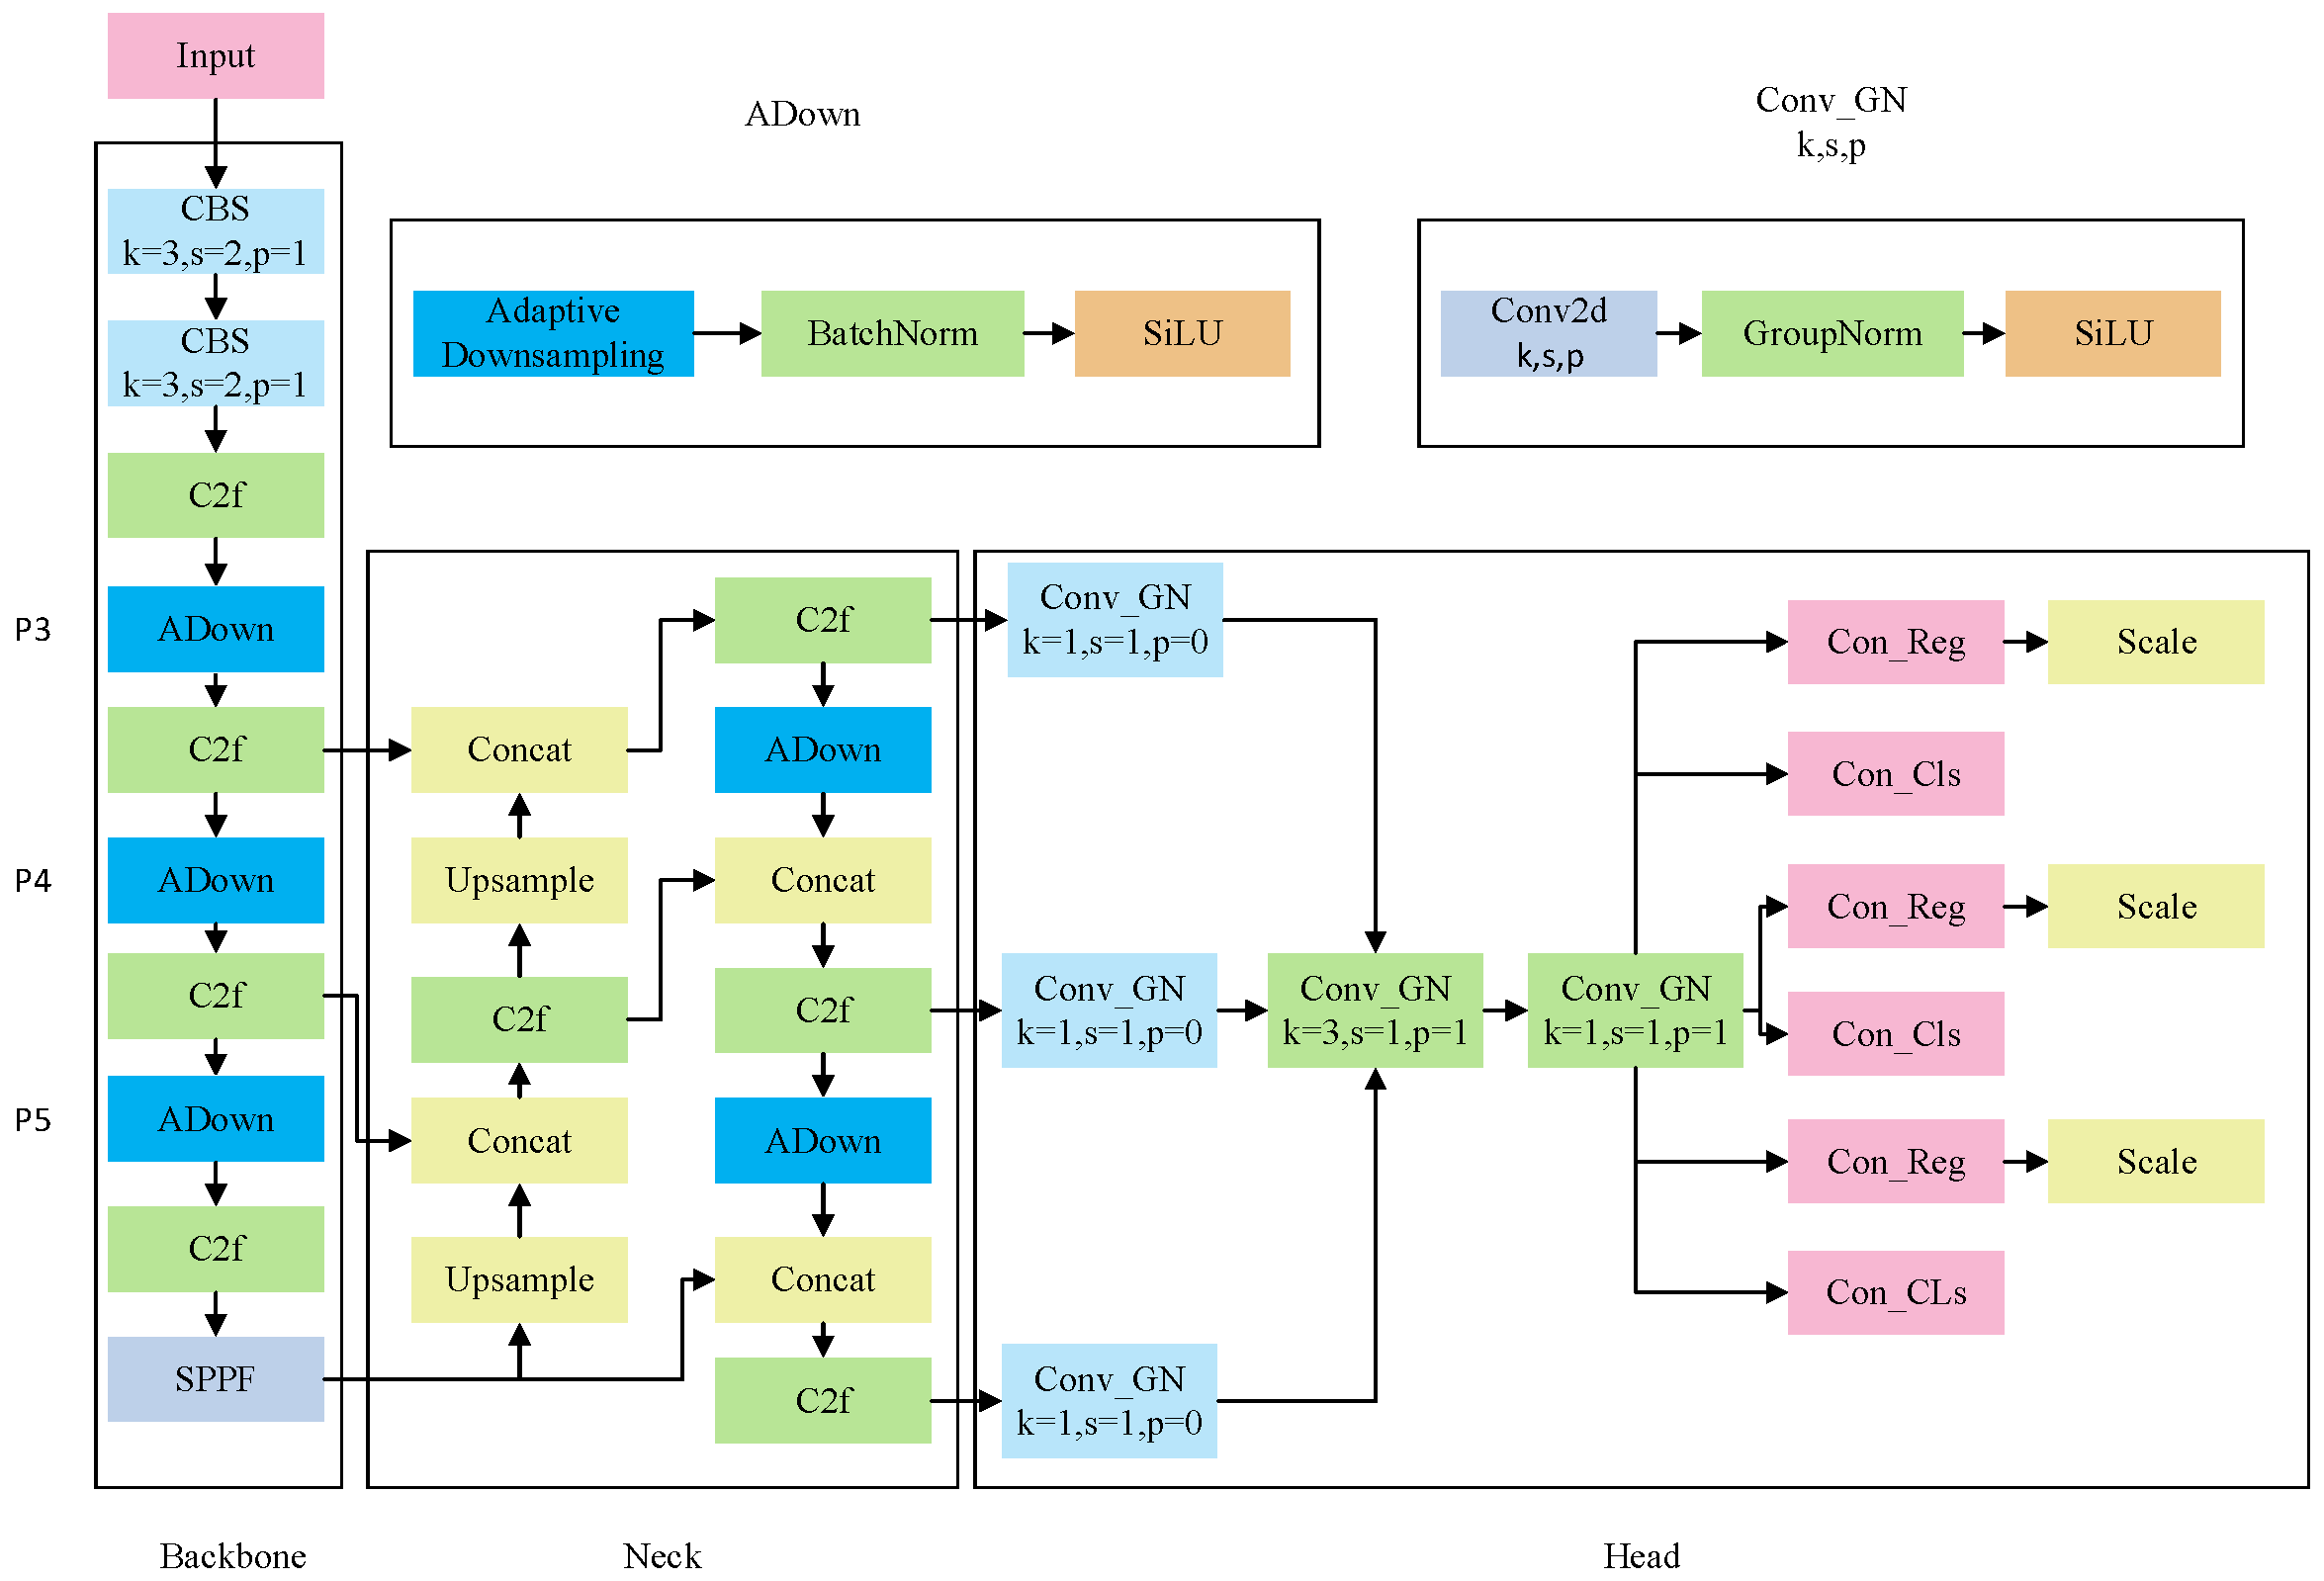
Aiming at the requirement of implementing the lightweight vehicle target detection model, a new lightweight YOLO-AL model is proposed to improve YOLOv8n, which can detect vehicle targets in various traffic scenarios with greater precision under the limitations of device resources. Figure 2 illustrates the network architecture of YOLO-AL.
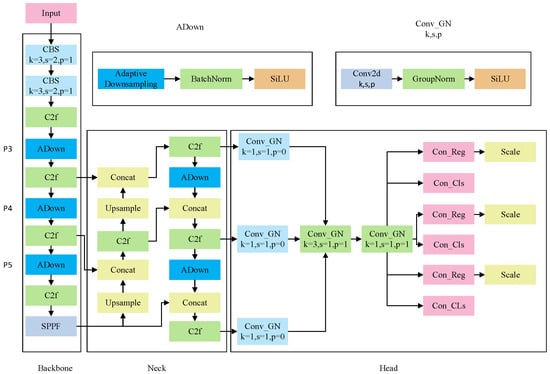
Figure 2.
Lightweight vehicle target detection model YOLO-AL.
YOLO-AL integrates the ADown module in the P3, P4, and P5 layers of the backbone part, improves the convolution structure of the CBS module, and replaces the convolution structure responsible for downsampling in the neck part. This approach yields significant benefits in preserving essential features, enhancing perception abilities, and accommodating multiscale targets. It is especially well suited for detecting vehicle targets in intricate traffic scenarios. To enhance vehicle target detection capabilities and simplify deployment on mobile devices, YOLO-AL was developed with the LSCD module, which uses shared convolution to improve the convolution structure of the original detection head and reconstruct the network structure of the detection head. The improvement reduces the complexity of the model and obtains a wider receptive field, thereby improving the model’s ability to detect vehicle targets.
3.2. Adaptive Downsampling Module
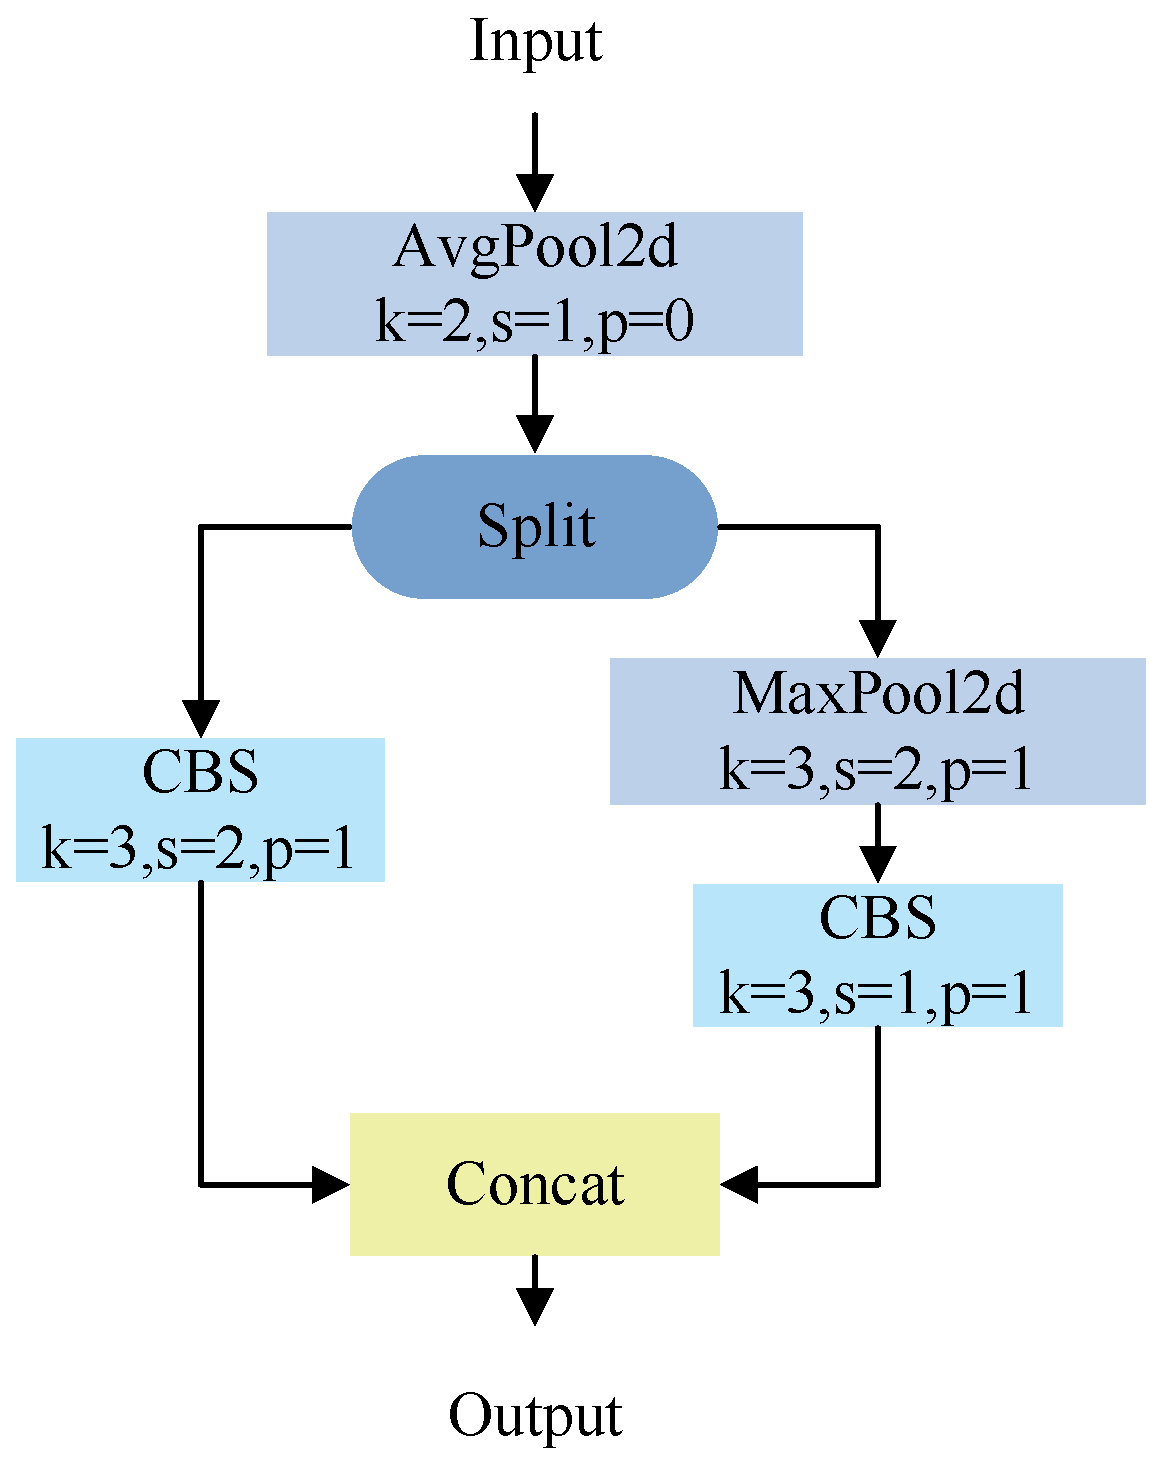
Standard pooling processes the entire image uniformly, which means that pooling cannot adjust the resolution according to the complexity of different regions and is prone to losing many spatial details, especially at the edges of objects and complex textures. Although stride-based downsampling is more flexible, it still applies the same step size to the entire feature map and does not adjust the feature complexity of specific areas. There is still a risk of losing important information in some areas, especially in small objects and detailed areas. The ADown module can dynamically adjust the downsampling method based on the content, scale, and semantic information of the feature map, rather than using a standard pooling or stride-based downsampling.
The ADown module adjusts the resolution of the feature map in an adaptive way, which means that the resolution of each area can change dynamically according to its complexity. For example, in vehicle targets or complex scene areas, the ADown module maintains a high resolution to ensure that subtle spatial details, such as vehicle outlines, textures, and reflections are detected. For background areas, the ADown module moderately reduces resolution to effectively reduce computational overhead. This approach effectively reduces the amount of computation and memory consumption while retaining important spatial details, significantly improving the accuracy and efficiency of vehicle target detection. Figure 3 shows the ADown module network architecture.

Figure 3.
ADown module network structure diagram.
Vehicle target detection requires detecting targets with huge size differences, such as large trucks in the near distance and small cars in the far distance. Introducing the ADown module for downsampling can help the network better learn features of different scales. The ADown module can reduce computational complexity through dimensionality reduction and downsampling, improve feature extraction capabilities, enhance multiscale feature learning, and improve model efficiency and detection accuracy, especially when dealing with complex traffic scenarios. In addition, the ADown module can also help the model improve generalization and real-time performance, which is very useful for real-world traffic scenarios with limited computing resources.
Average pooling divides the input image into rectangular regions and outputs the average value of the elements within each region. Its mathematical expression is as follows:
where is the average output value of the aggregation of the region R associated with the k-th feature map, is the element in position in the region R, and is the number of elements in the rectangular region R.
Maximum pooling divides the input image into rectangular regions and outputs the maximum value of each region for the same input image. Its mathematical expression is as follows:
where is the maximum output value for the aggregation of the region R associated with the map of the k -th characteristic.
This algorithm introduces the ADown module to replace some CBS modules. A lightweight feature extraction and aggregation network is designed to effectively extract and aggregate vehicle target feature information at a low computational cost.
3.3. Lightweight Shared Convolutional Detection Head
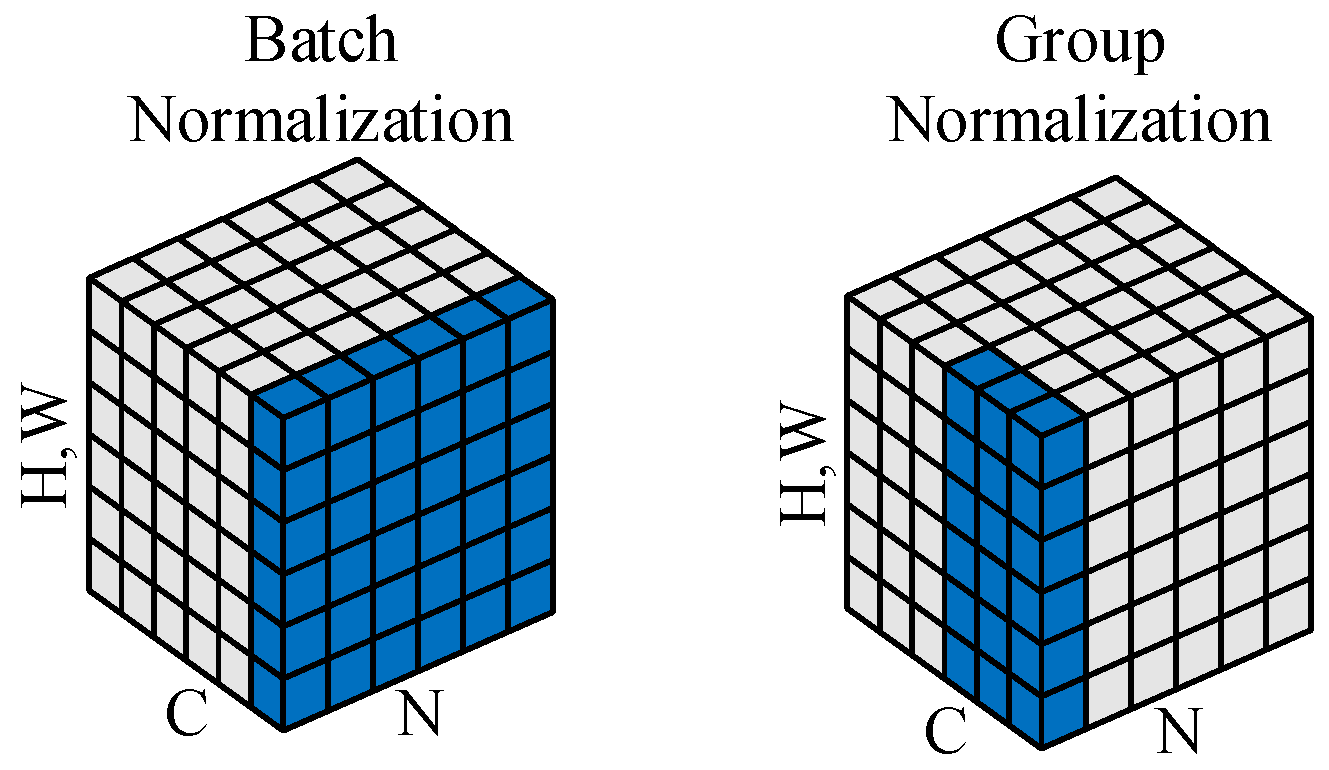
The batch normalization (BN) layer standardizes the output, ensuring that the mean of each feature in a small batch is near 0 and the variance is close to 1, thus ensuring the stability of the data in the network. However, when the batch size becomes smaller, the simulation effect of BN is not good. Group normalization (GN) [33] is a new deep learning normalization method that solves the impact of BN on the dependence of batch size. Its main idea is to divide the channels into several groups and then normalize the channels in each group.
Generally speaking, the output of the previous layer is . The normalization method is as follows:
where represents the average value of the output from the previous layer, m is the size of the training sample batch, and is a vector of parameter that controls the translation of the normalized data.
where represents the standard deviation of the output data from the preceding layer.
where is a small value close to 0, and its size can be adjusted to prevent the denominator from becoming 0, without compromising the stability of the formula.
where is a vector of parameter that determines the degree of scaling of the normalized data.
The BN and GN algorithms are illustrated in Figure 4. For an image with an input size of , where N denotes the batch size, C represents the number of input channels, and H and W are the height and width of the input image, respectively, group normalization divides the input channels C into G groups. The normalization is then applied to each group, transforming the input feature dimensions from C to G, and the normalized dimensions become , where each group contains channels.

Figure 4.
Diagram of batch normalization algorithm and group normalization algorithm.
The performance and stability of BN are generally best when training large batches. For vehicle object detection, especially when real-time processing and low latency are required, smaller batches are usually used, and the instability of small batch statistics leads to fluctuations during training. During the inference phase, BN needs to use the statistics of the entire training set to normalize the feature maps. However, in real-time object detection, the size of each input image or video frame is usually small, so using the global mean and variance during training for inference may lead to unstable behavior.
GN normalizes each sample by grouping channels for normalization, rather than relying on the mean and variance of the entire batch. This makes GN particularly effective in small batch training or inference in real time. This is particularly important for vehicle target detection, as such applications often require single-frame inference, where BN often does not work stably. GN uses the same statistics, the mean and variance within each group, during both training and inference, making it more stable during inference. For real-time inference in vehicle target detection, GN can avoid the instability caused by BN during inference due to fluctuations in batch statistics.
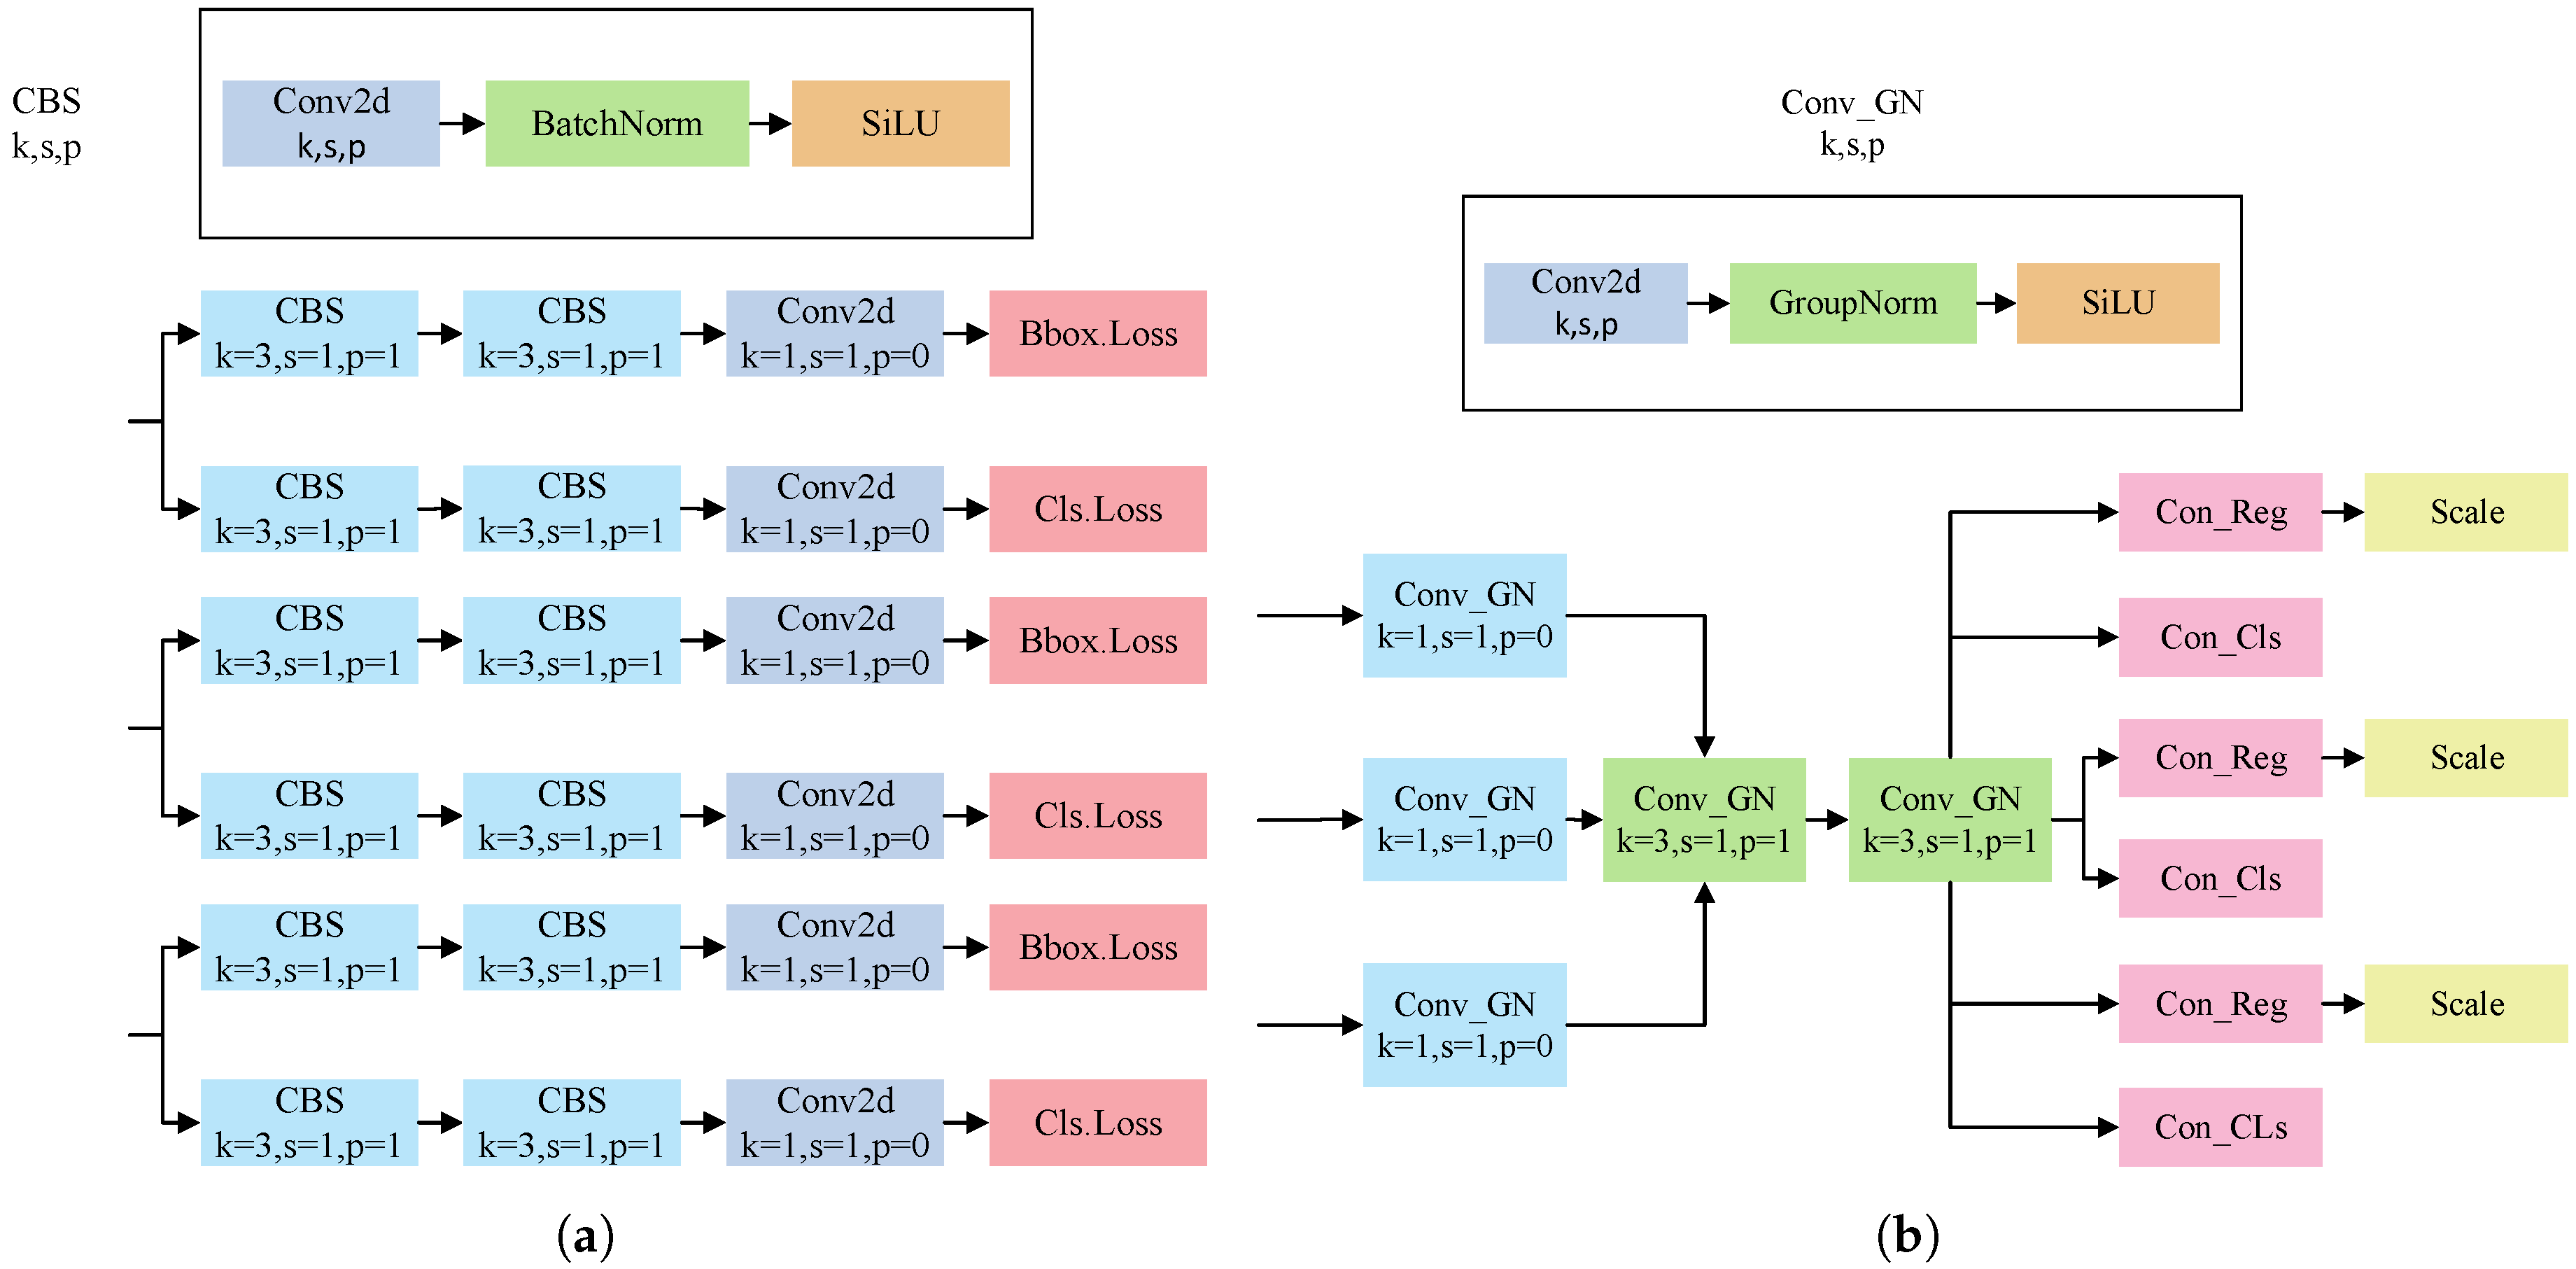
Modern vehicle target detection tasks usually require processing a large number of high-resolution images, and low latency and high computational efficiency are the core requirements that must be met. In vehicle target detection, the appearance and structure of the vehicle are relatively fixed, and many tasks have similar low-level features. Improving the original detection head by designing a shared convolutional layer through GN can significantly reduce redundant calculations and parameters, thereby achieving the purpose of improving computational efficiency. At the same time, this design can take into account both detection accuracy and inference speed and is very suitable for efficient and accurate target detection in complex traffic environments. Figure 5 shows the YOLOv8 detection head and the LSCD module.

Figure 5.
(a) YOLOv8 detection head. (b) LSCD module.
In our detection head design, group normalization is applied to facilitate the fusion of feature information across different branches. The feature maps output from the YOLOv8n backbone are first compressed using a 1 × 1 shared convolution. This enables different branches to share a common set of compressed features, improving training efficiency and promoting consistency across tasks. Next, two 3 × 3 shared convolutional layers are used to process the multiscale feature maps. These layers share weights across scales, enabling parameter sharing and feature reuse, and reducing redundancy in the detection head. The resulting feature map is then split into three scale-aware branches, each responsible for both classification and regression. Although operating on different scales, all branches start from the same shared features, ensuring that low-level details and high-level semantics are preserved and consistently used. For regression outputs, a scale layer is employed to project the results back to their original resolution. During this step, channel-wise weighting and normalization are applied to ensure effective information balance. This strategy improves the ability of the model to detect vehicles of various sizes and shapes while maintaining the lightweight and efficient nature of the detection head.
The three-layer multiscale feature maps output by backbone and neck are as follows:
where i corresponds to different scales, such as P3, P4, and P5, is the number of channels, and , is the space size.
Use 1 × 1 shared convolution to compress feature map channels of all scales to a unified dimension . The convolution kernel parameters are shared among all scales, reducing model parameters.
Then, use two 3 × 3 shared convolutions to extract features. The parameters of the two convolution kernels are also shared across scales, and the output is a multiscale shared feature with a unified channel dimension.
Each scale feature is fed into the classification and regression heads, respectively.
where outputs the category probability of each anchor; outputs bounding box offset or center point coordinates.
To adapt to different input resolutions, the regression output is scaled down using a scale module. ScaleNorm can include feature channel weighting, GN to enhance feature fusion on different scales, and upsampling or downsampling operations to restore spatial dimensions.
This strategy improves the model’s capacity to detect vehicles of various sizes and shapes while maintaining the lightweight and efficient nature of the detection head.
4. Experiments
4.1. Evaluation Indicators for Target Detection
This paper uses mean average precision (mAP), number of parameters, floating point operations (FLOPs), frames per second (FPS), and the PR curve, confusion matrix, F1 score map, and heatmap to evaluate the performance of the model.
Precision P represents the ratio between the number of samples predicted correctly and the number of positive samples predicted. Recall R represents the ratio between the number of samples predicted correctly and the number of samples that are actually positive [34]. The formula is shown below:
where is the number of positive samples correctly identified, is the number of negative samples misreported, and is the number of positive samples missed.
In the PR curve, the horizontal axis represents the recall rate and the vertical axis represents the precision rate. The area enclosed by the PR curve and the coordinate axis is called average precision (AP). The formula is as follows:
In actual detection tasks, the objects to be detected often involve multiple categories. The mAP value is the average of all AP values, which can comprehensively evaluate the detection precision of the model in all categories. The formula is as follows:
where N represents the number of object classes to be detected, n denotes the n-th category, and indicates the detection accuracy for the n-th class of objects.
4.2. KITTI 2D
The KITTI 2D dataset [35] developed in 2012, is a crucial benchmark in computer vision. The dataset collects data from real traffic scenes using specially configured acquisition vehicles, covering a variety of scenarios and conditions, and is widely used in the evaluation of object detection, image segmentation, and other visual tasks. Due to its rich annotation information and diverse scene settings, the KITTI 2D dataset has become one of the most commonly used computer vision algorithm evaluation standards in the world.
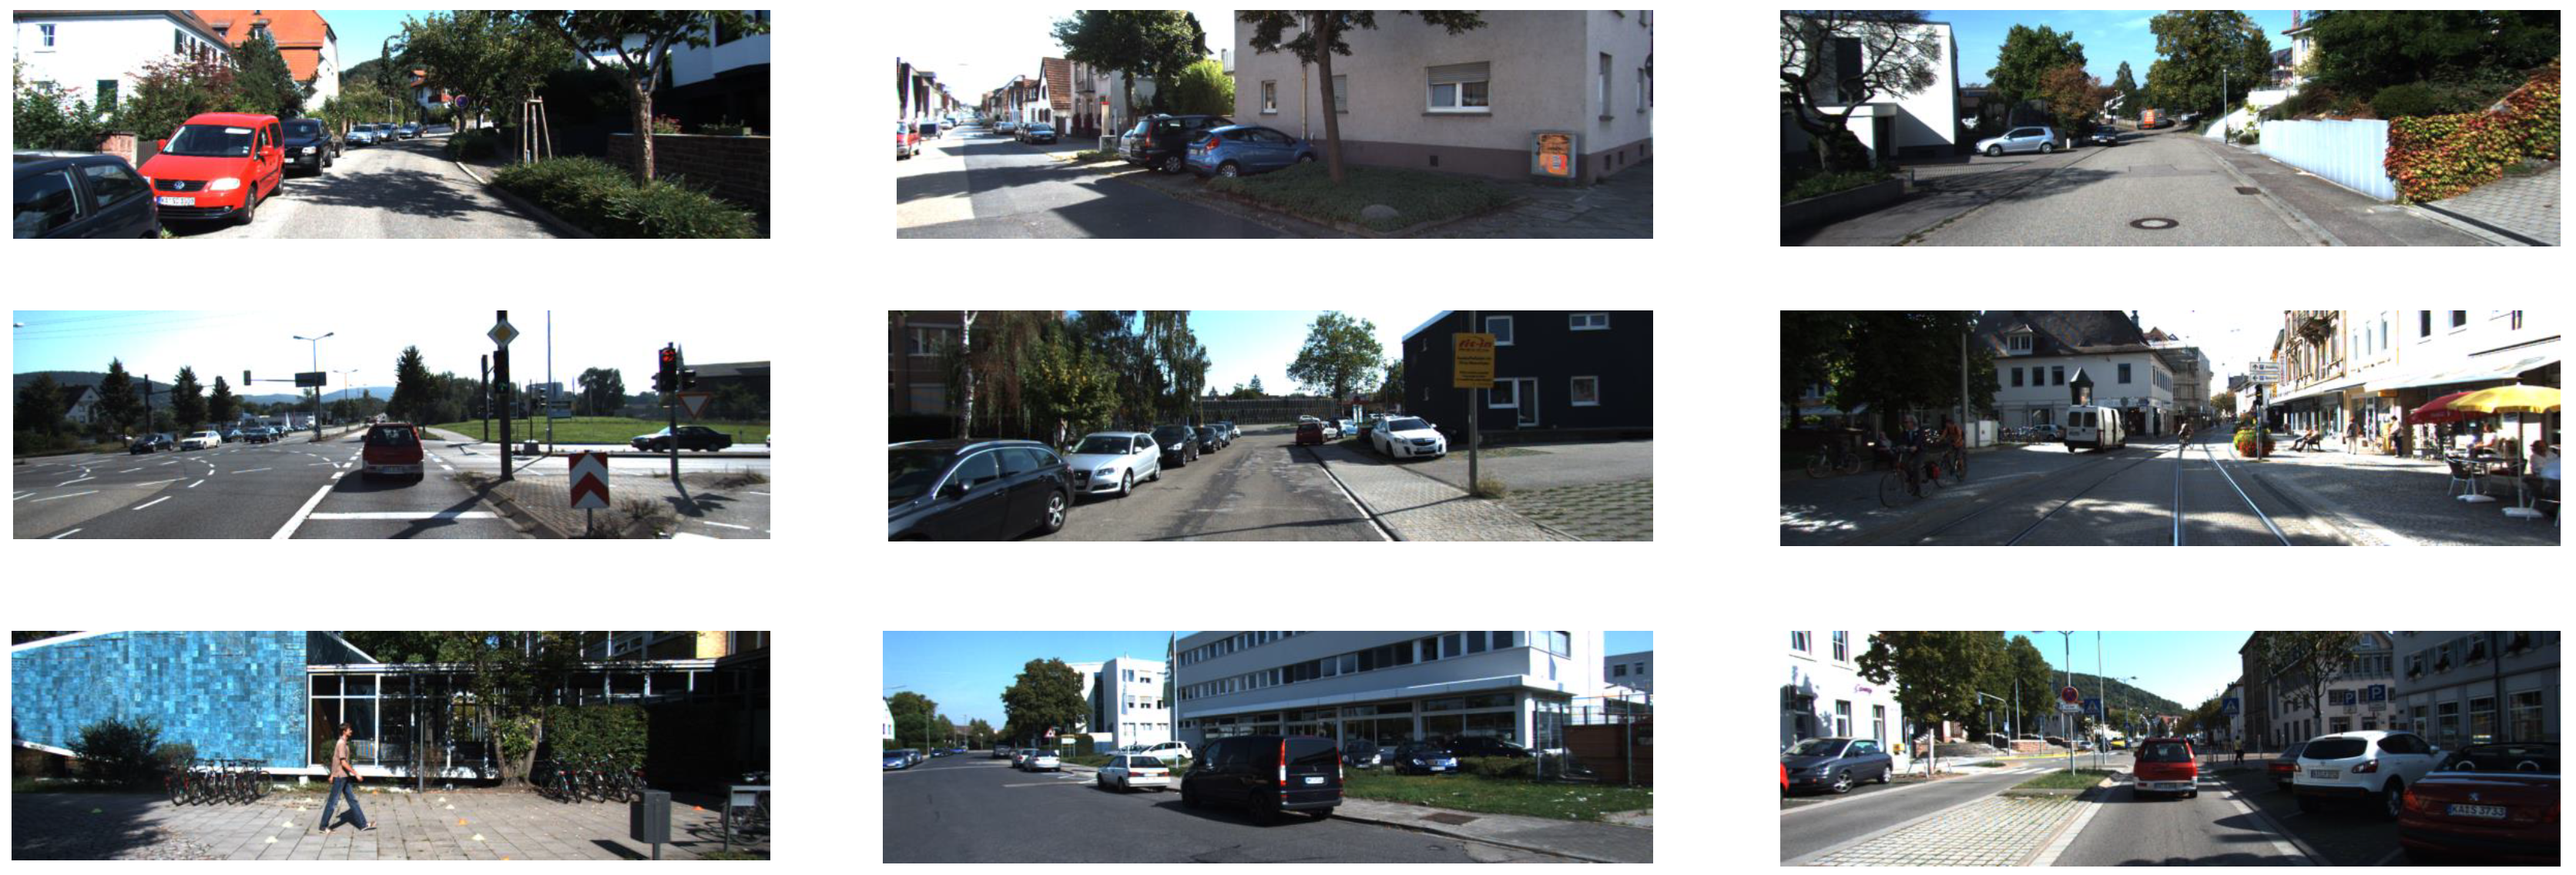
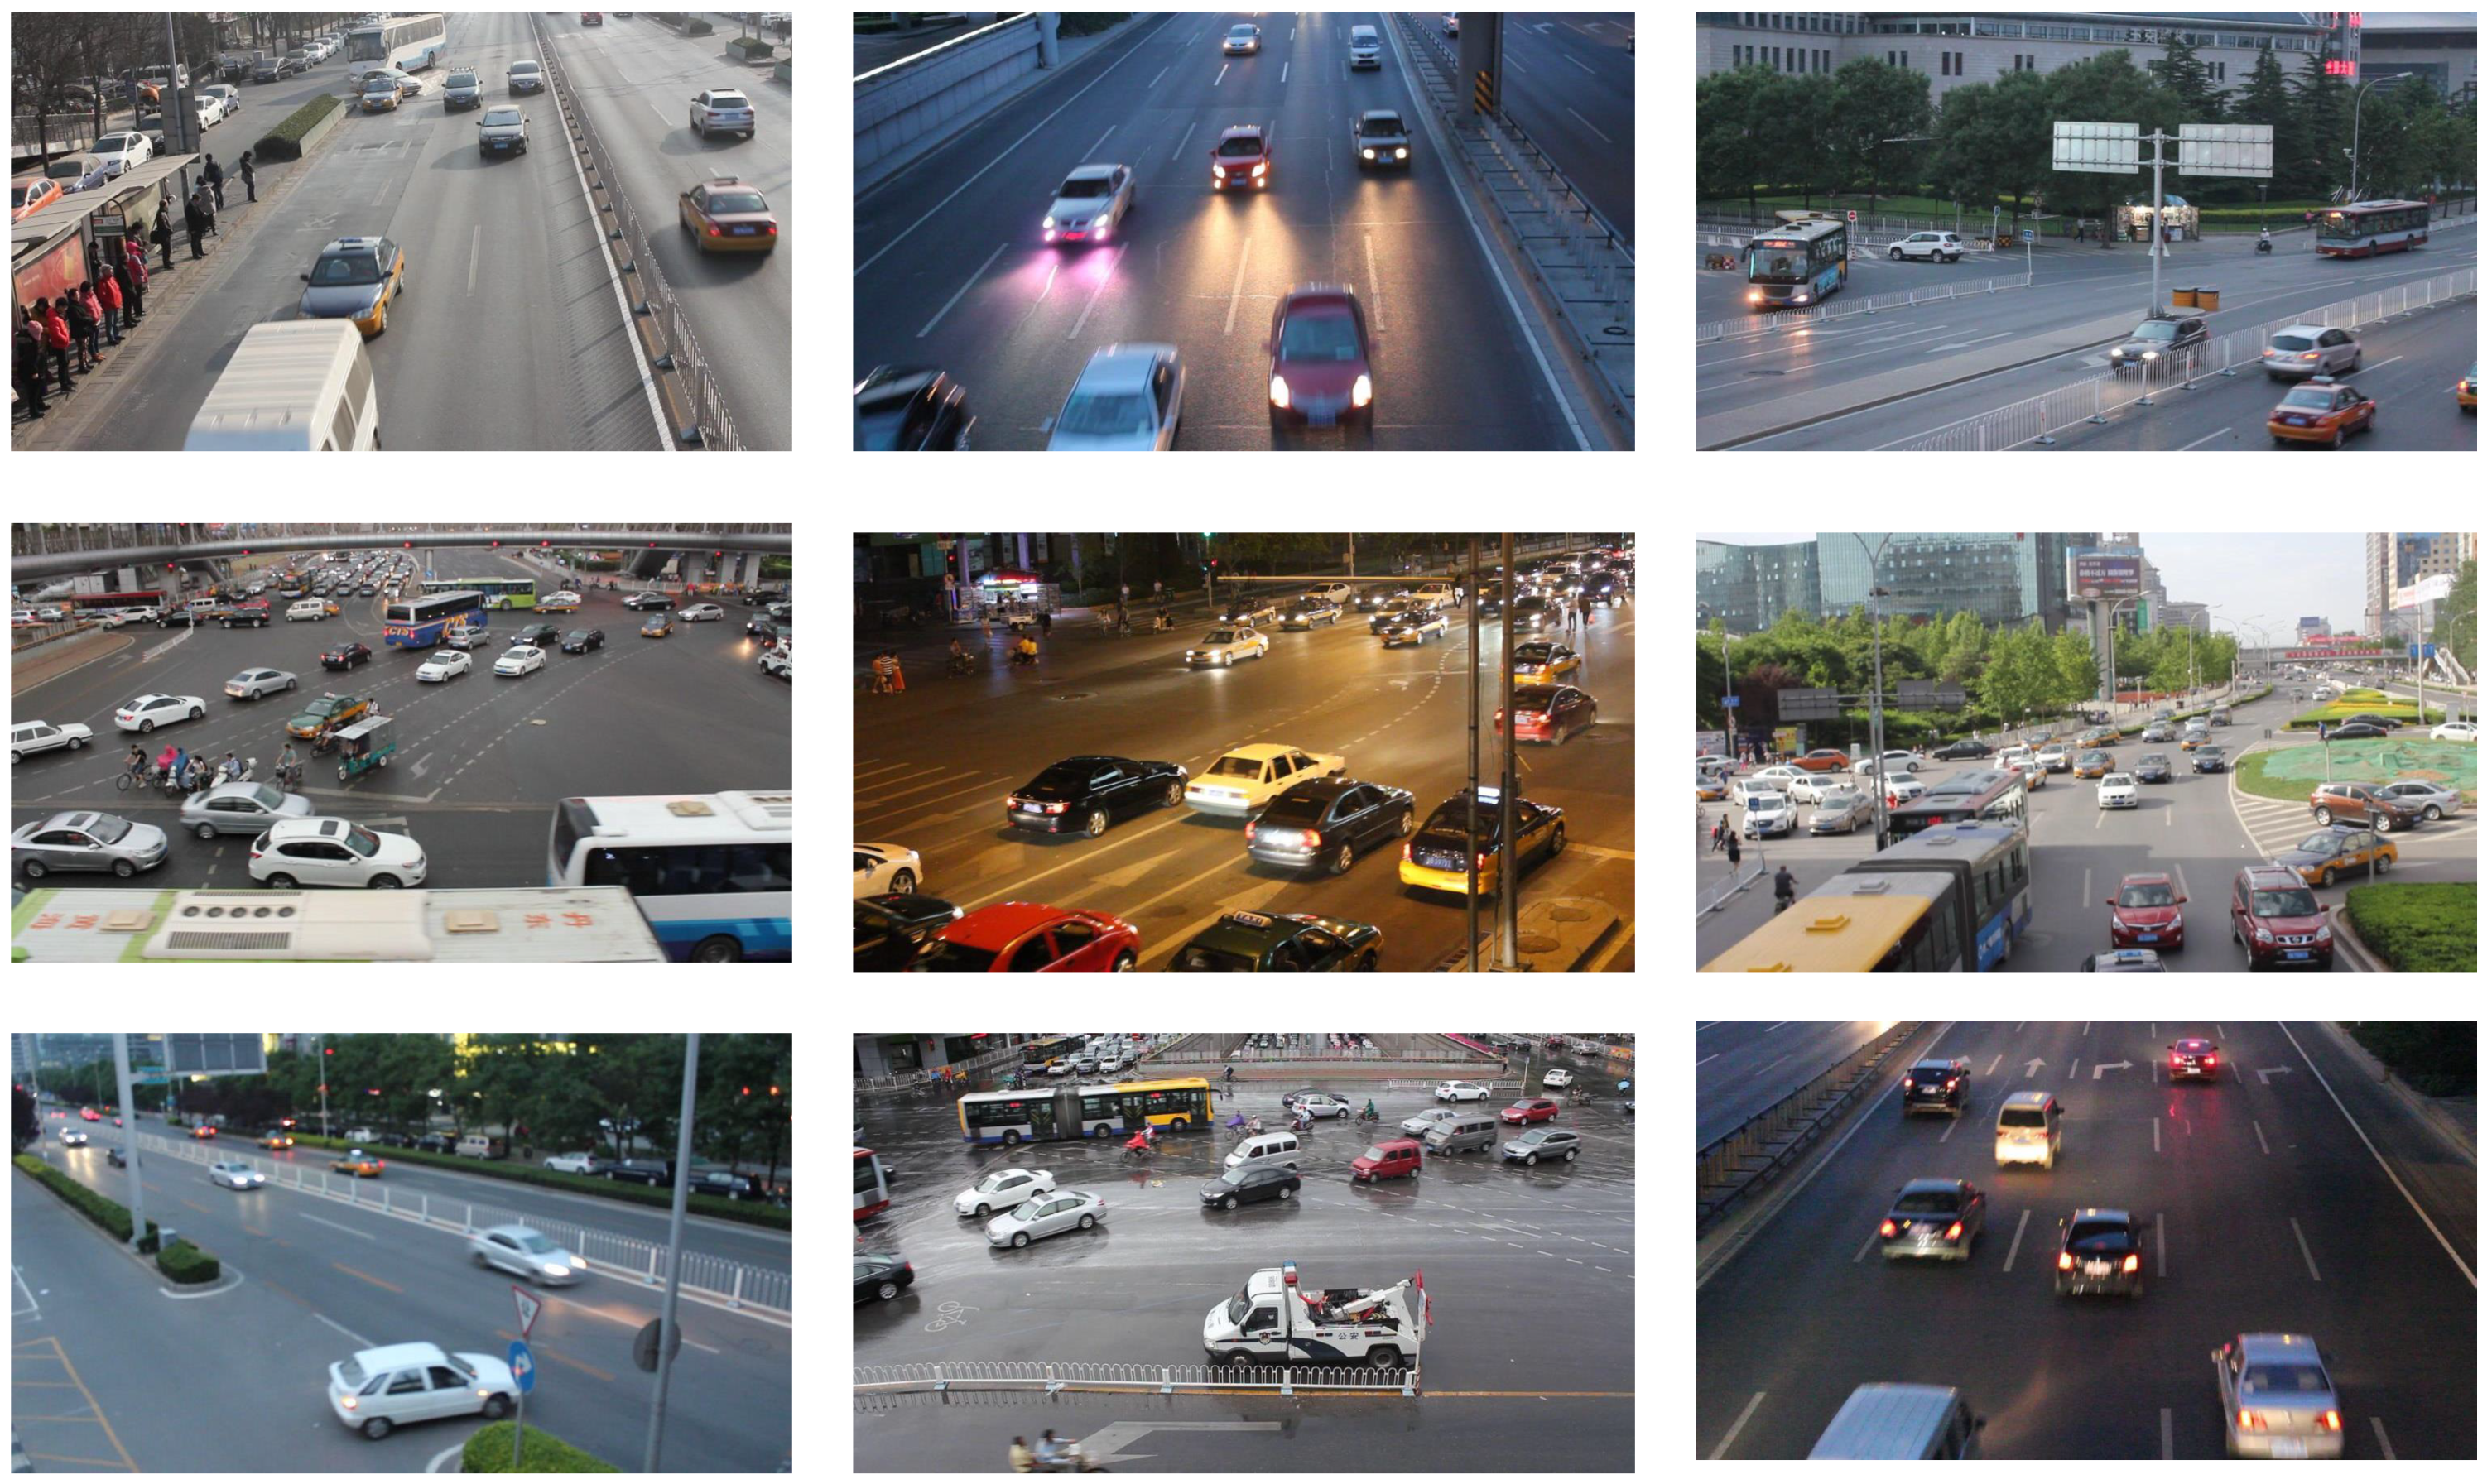
The KITTI 2D dataset uses the image from the left camera and contains 7481 labeled images divided into 8:1:1 ratios, including 5985 training sets, 748 validation sets, and 748 test sets. The categories of labels are Car, Van, Truck, Tram, Pedestrian, Person (sitting), Cyclist, and Misc. In this experiment, Misc, Person (sitting), and Pedestrian are deleted. Figure 6 shows an example of the KITTI 2D dataset.
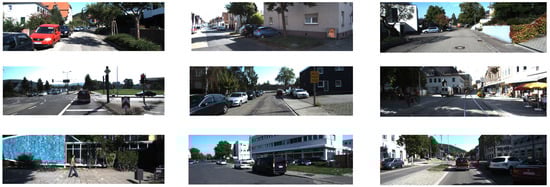
Figure 6.
KITTI 2D dataset sample example.
To more accurately assess the model proposed in this paper and validate the reliability and effectiveness of the algorithm, all experiments in this chapter are conducted in a standardized operating environment. The specific environment configuration and hyperparameter settings are shown in Table 1 and Table 2.

Table 1.
Experimental environment configuration.
Table 2.
Hyperparameter settings.
This experiment compares the YOLO-AL model with classic target detection models to evaluate its performance, including Faster R-CNN, YOLOv5n, YOLOv6n, YOLOv7-tiny [36], YOLOv8n, YOLOv9-tiny [37], YOLOv10n [38], MobileNetv4-YOLO, EfficientDet-D0, and RT-DETR-L. Detailed detection results are presented in Table 3.
Table 3.
Performance comparison of models on the KITTI 2D dataset.
As presented in Table 3, The lightweight vehicle detection model YOLO-AL achieved the highest mAP@0.5 in the KITTI 2D dataset, which is 94.5%. Although FLOPs are slightly larger than EfficientDet-D0 and the FPS is slightly lower than Mobilenetv4-YOLO, it has significant advantages in other aspects. Compared to the original model YOLOv8n, the mAP@0.5 of YOLO-AL increased by 1.1%, the parameter count was reduced by 33%, and FLOPS reduced by 28%, while FPS increased by 12%.
To evaluate the effectiveness of each component of YOLO-AL, a detailed ablation study was performed on the KITII 2D dataset while ensuring that all experimental settings and parameters were consistent. Table 4 shows the comparison data from the ablation experiment. The evaluation indicators for the experiment are mAP@0.5, the number of parameters, FLOPs, and FPS. The addition of each module improves the model detection accuracy and speed while effectively reducing the number of parameters and FLOPs.
Table 4.
Ablation experiment of YOLO-AL on KITTI 2D dataset.
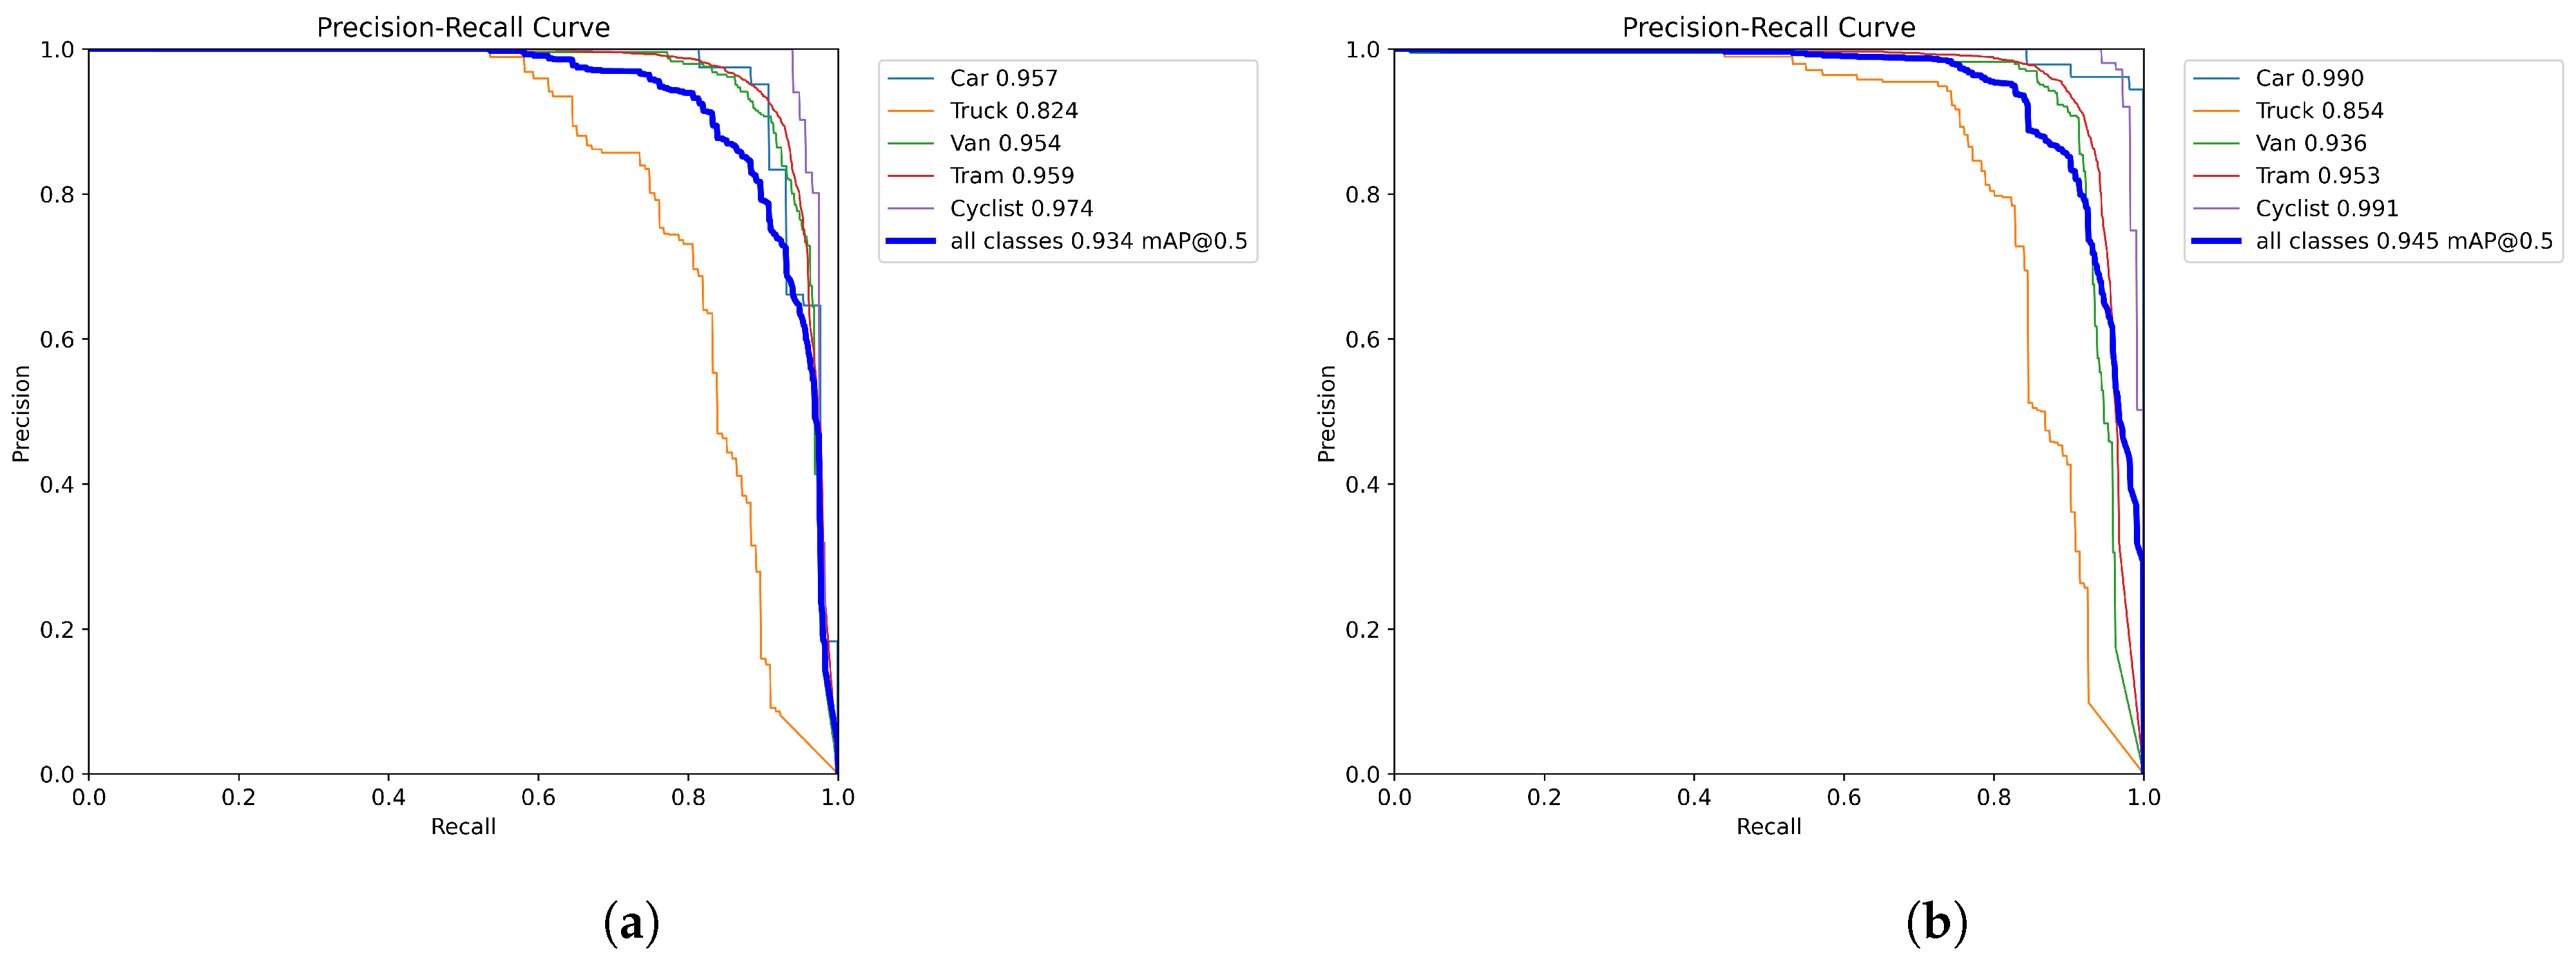
A comparison of the PR curves of the original models YOLOv8n and YOLO-AL on the KITTI 2D dataset is shown in Figure 7. A larger area under the curve indicates superior model performance, as it signifies the model’s ability to achieve higher recall while maintaining high precision. Therefore, PR curve plots offer a comprehensive performance comparison and facilitate a more accurate evaluation of the model’s effectiveness in multiscale vehicle target detection tasks. After integrating the ADown and LSCD modules, the model’s mAP@0.5 improved from 0.934 to 0.945. This advancement significantly outperforms the base model, especially in distinguishing common vehicles such as cars and nonmotorized vehicles such as cyclists in traffic settings. The decrease in mAP for Vans and Trams could be attributed to their visual similarities. Factors contributing to this decline include the reduced discriminative ability of features due to the lightweight design of the model, loss of target specifics through downsampling, and scale and semantic misalignment caused by shared convolutions. These elements collectively influence the precision of object localization and classification.
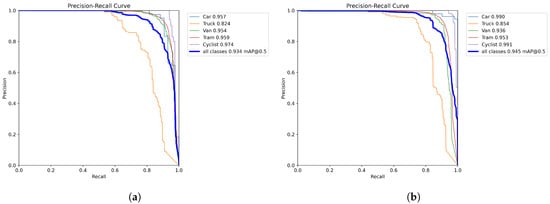
Figure 7.
(a) YOLOv8n. (b) YOLO-AL. PR curve comparison of YOLO-AL on KITTI 2D dataset.
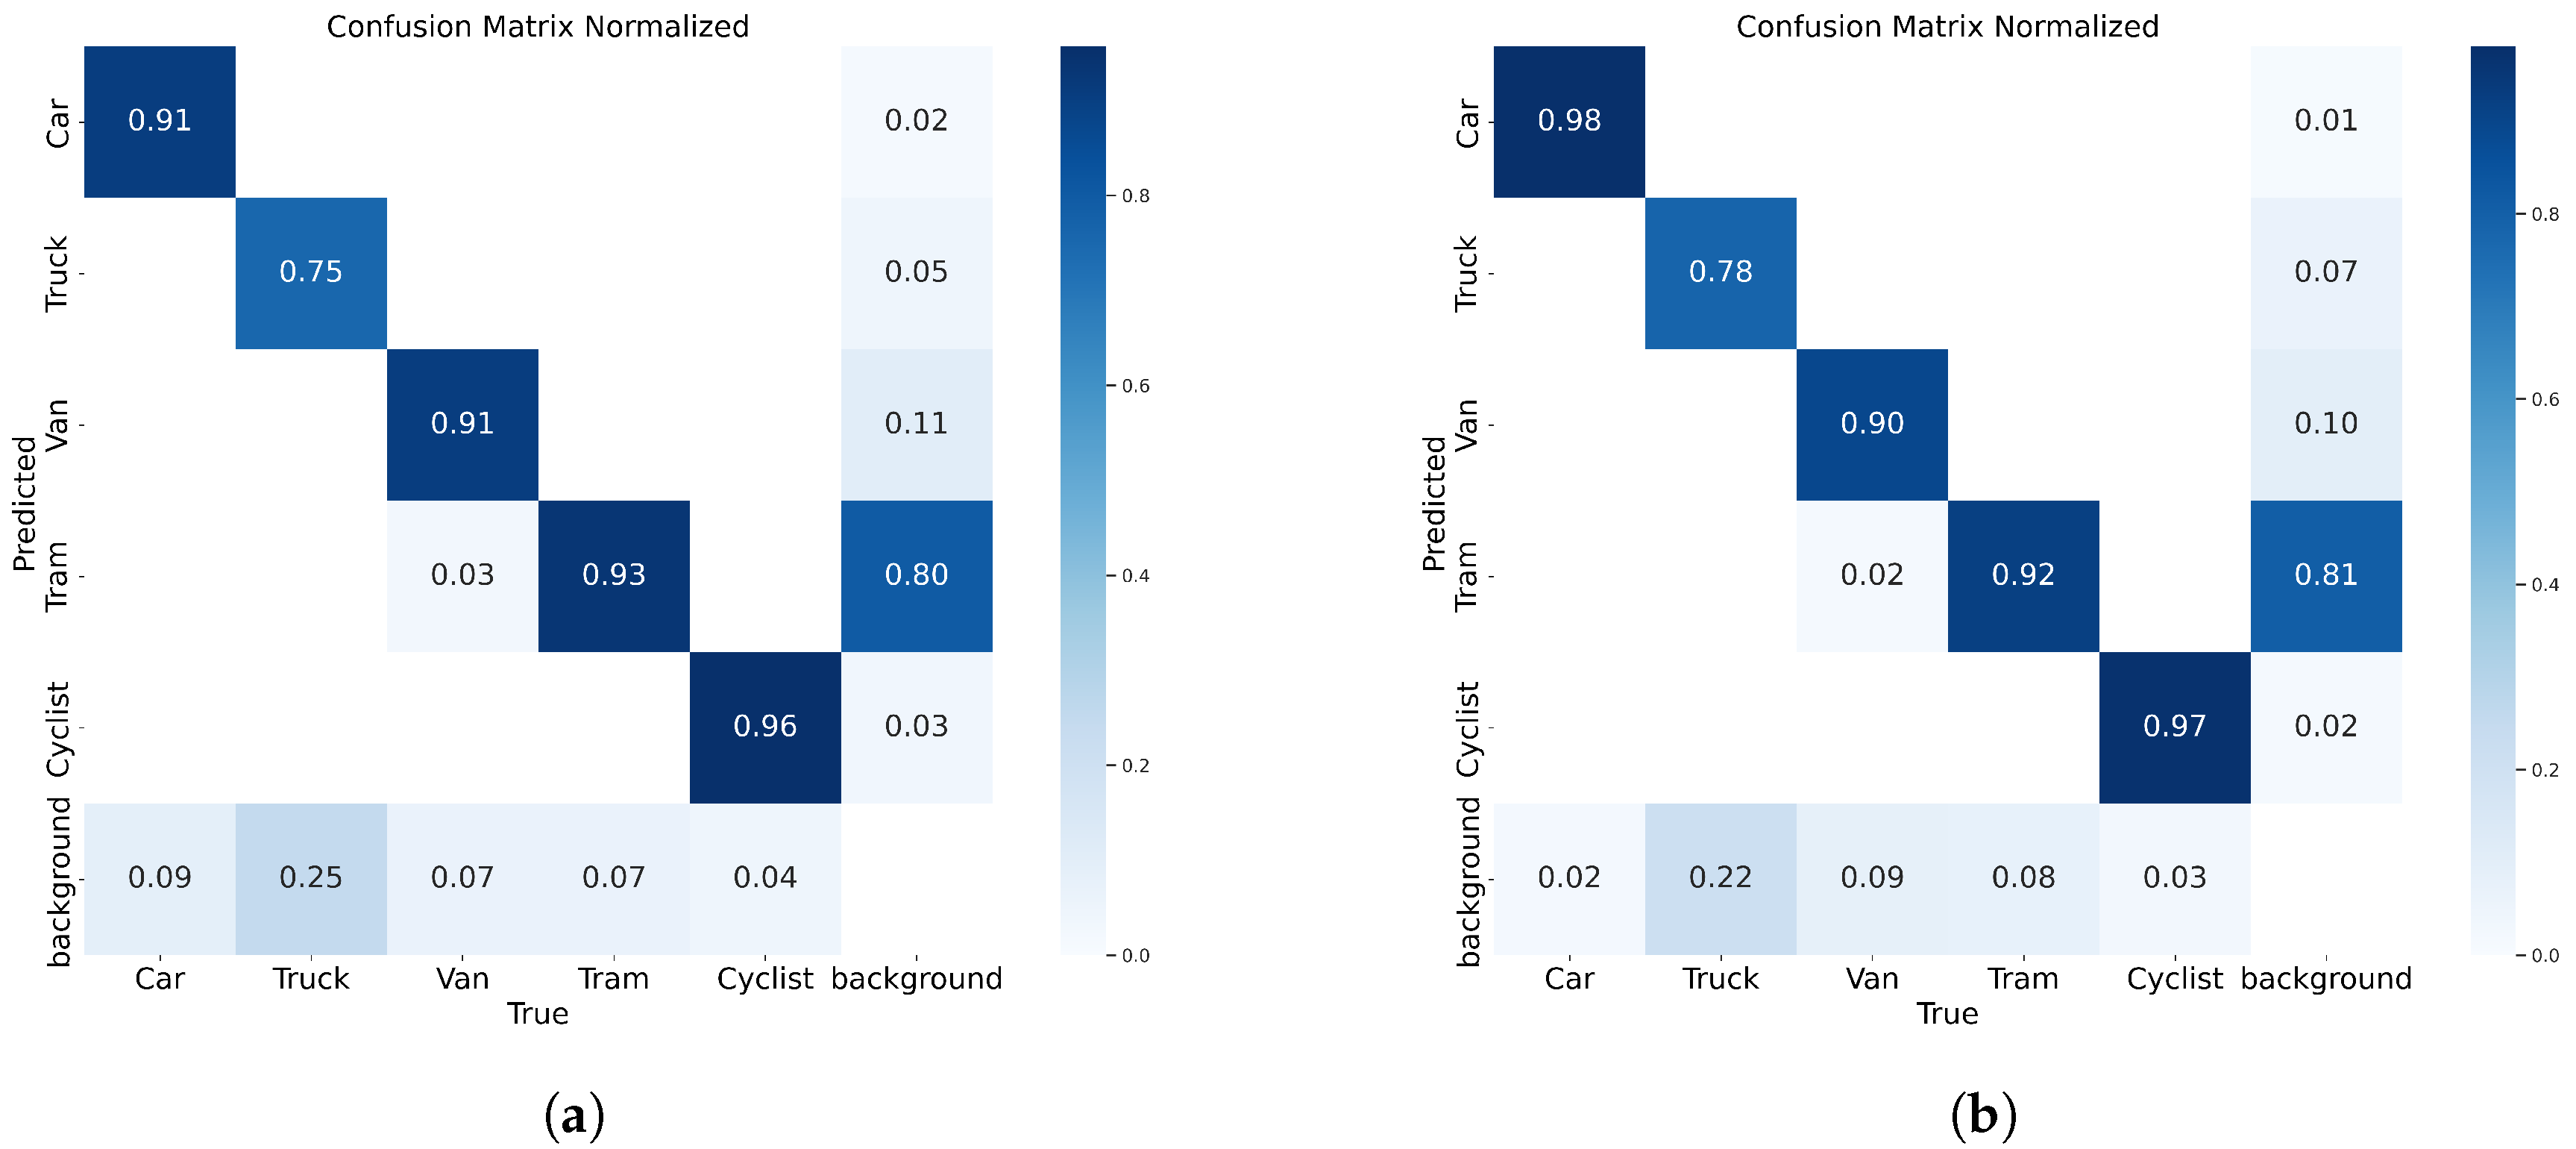
Figure 8 shows a comparison of the confusion matrices of the YOLOv8n model and the YOLO-AL model. Specifically, on the KITTI 2D dataset, the YOLO-AL model reduces the leakage rate by 7%, 4%, and 1% in the categories of Car, Truck, and Bicycle, respectively, compared to the YOLOv8n model. The reason why the misclassification of Tram is reduced by 1% is that there are cases where the Tram is considered as a background. The shared parameters and the unified scale processing mechanism may not accurately distinguish between Vans and Trams with similar appearances, resulting in a 1% decrease in their respective positive classifications.
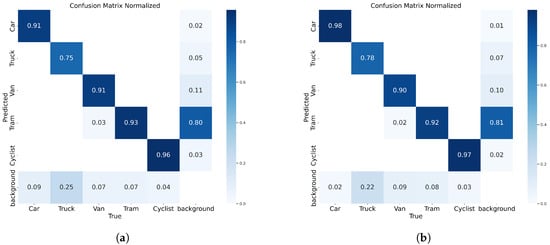
Figure 8.
(a) YOLOv8n. (b) YOLO-AL. Confusion matrix comparison of YOLO-AL on KITTI 2D dataset.
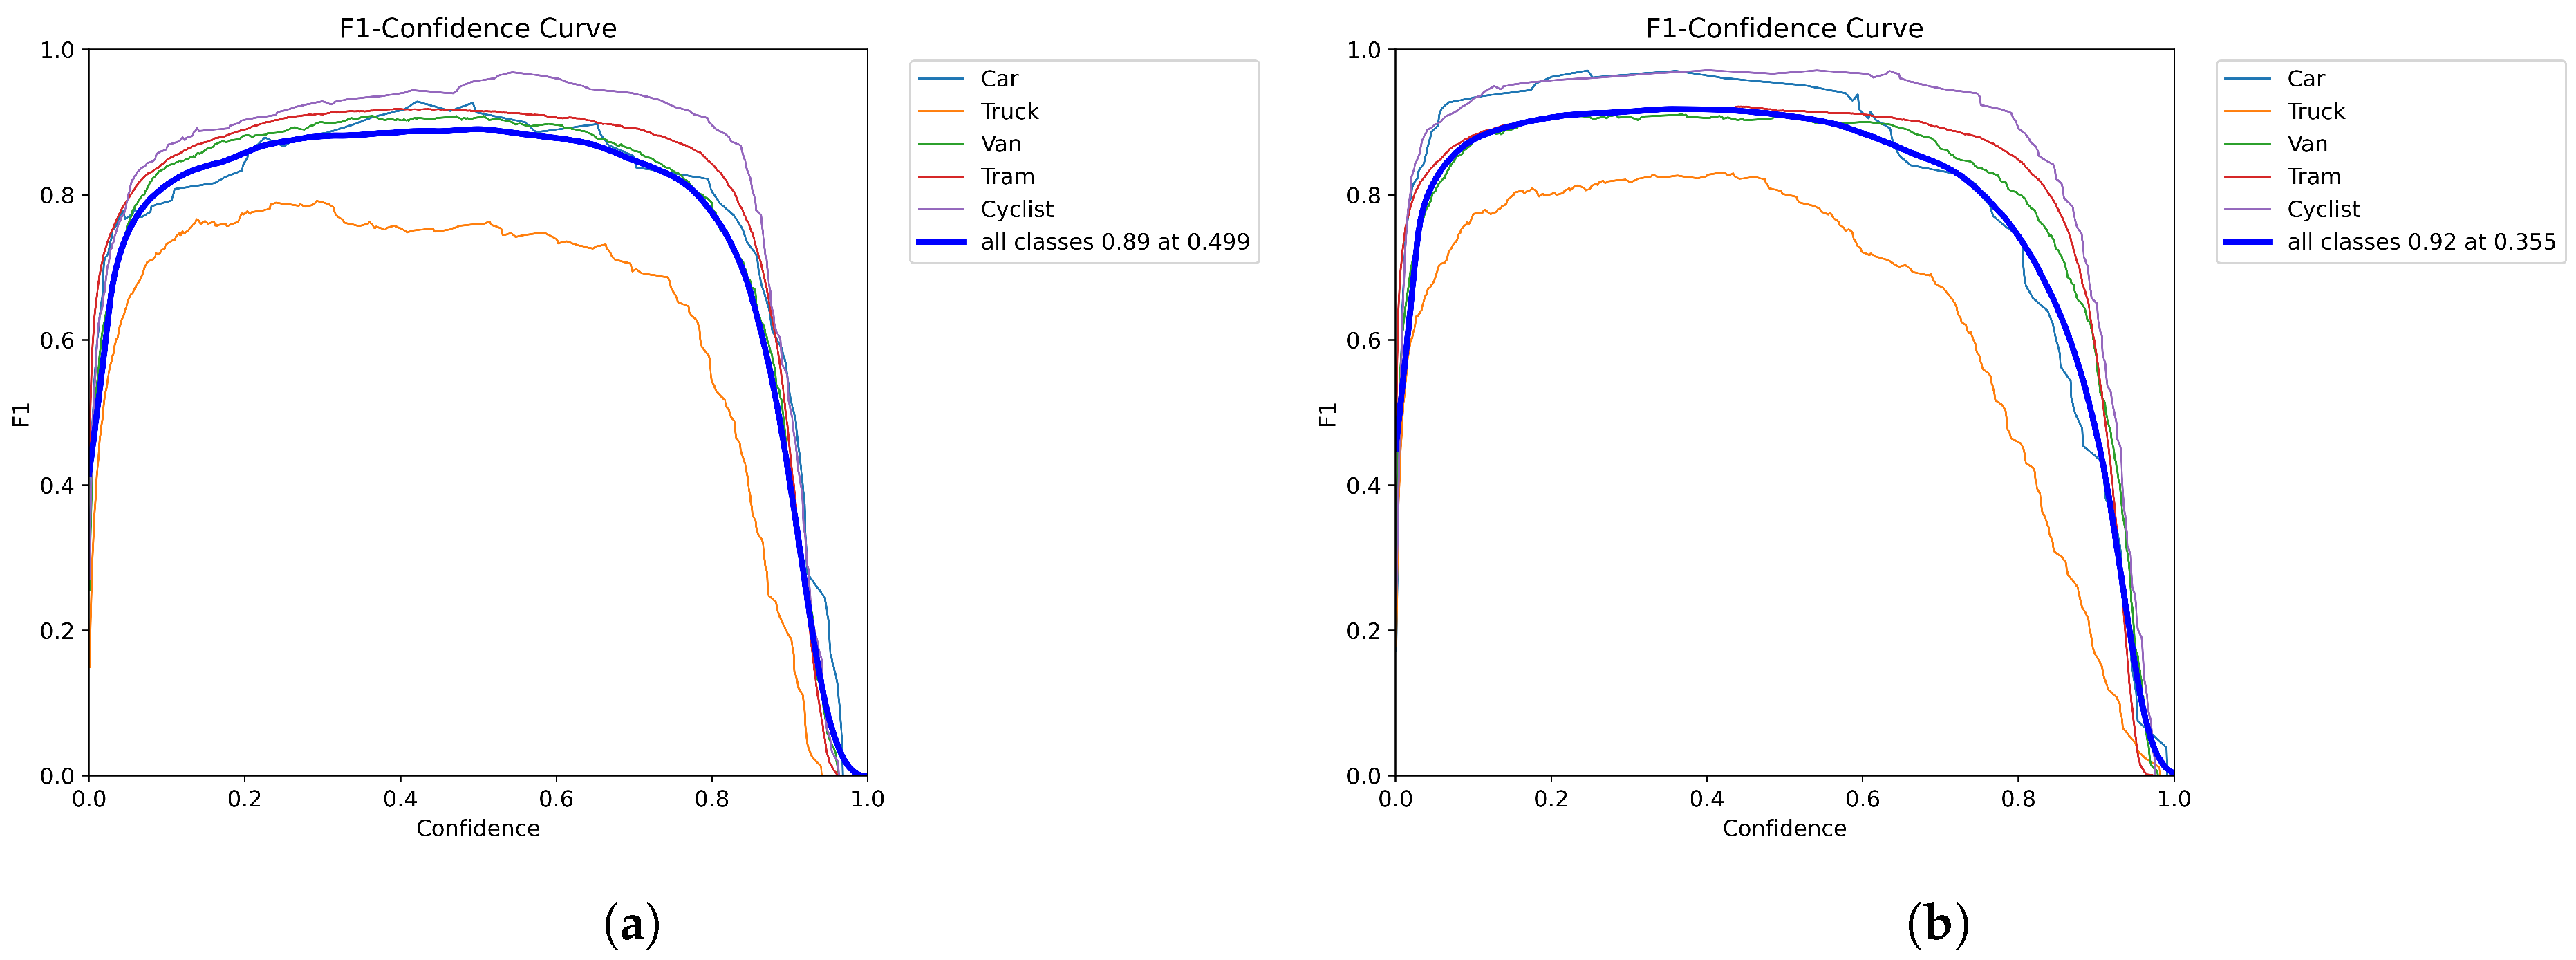
Figure 9 shows the comparison of the F1 scores. A higher F1 score means that the model performs more balanced and efficiently in the detection task, capturing the majority of positive samples and reducing false positives to achieve a good balance between precision and comprehensiveness. The original model, the YOLOv8n model, has an F1 score of 0.89 in all categories. The YOLO-AL model has an F1 score of 0.92 in all categories. This shows that the YOLO-AL model outperforms the original model and can achieve better performance in detection tasks.
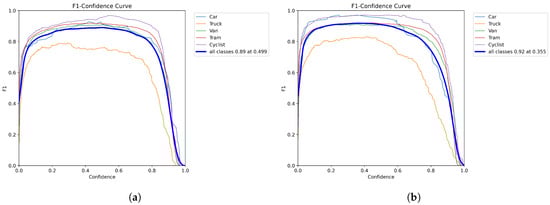
Figure 9.
(a) YOLOv8n. (b) YOLO-AL. Comparison of F1 scores of YOLO-AL on KITTI 2D dataset.
The results of the heatmap comparison between the original YOLOv8 model and the YOLO-AL model are shown in Figure 10. A heatmap is a visualization tool that is used to analyze how the model focuses on different regions of the input image, showing the intensity of the network response across those areas. In a heatmap, the red regions generally indicate a higher response intensity, suggesting that the model prioritizes features in those areas for the final prediction. Lighter regions indicate less attention from the model, which implies that these areas have a lesser impact on the output. In contrast, the heat map of the YOLOv8n model shows that the attention area is relatively scattered, which indicates that it may be disturbed by more background noise during the target positioning process, resulting in a slight decrease in detection accuracy. The YOLO-AL model is able to focus on a smaller area, especially on the key parts of the target vehicle. The results show that the YOLO-AL model exhibits higher accuracy and better target positioning capabilities in the vehicle target detection task.
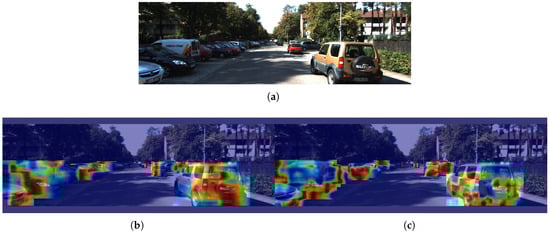
Figure 10.
(a) Original. (b) YOLOv8n. (c) YOLO-AL. Heatmap comparison of YOLO-AL on KITTI 2D dataset.
4.3. UA-DETRAC
UA-DETRAC [39] is an open-source dataset widely used for target detection and multi-target tracking, mainly for vehicle detection and tracking tasks in traffic scenes. The UA-DETRAC benchmark dataset consists of 100 long-time traffic surveillance videos, 60 of which are used for training and 40 for testing. There are four conditions in the video: sunny, cloudy, rainy, and night.
Since the UA-DETRAC dataset contains multiple similar videos, the vehicle changes and background differences between adjacent video frames are small. If used directly for training the target detection model, it may lead to data redundancy. To improve the model’s generalization capability and shorten training time, this study extracts one frame every 10 frames, resulting in approximately 13,824 original video images. This method not only reduces data redundancy, but also effectively reduces the overfitting phenomenon caused by repeated learning of the same features. On this basis, 7500 images with large traffic volume and complex background changes were selected as the experimental dataset. Figure 11 shows an example of the UA-DETRAC dataset.

Figure 11.
UA-DETRAC dataset sample example.
The UA-DETRAC dataset is divided into 8:1:1 ratios, including 6000 training sets, 750 validation sets, and 750 test sets. The dataset includes labels for four vehicle categories: Car, Bus, Van, and Others, However, the Others category was excluded from this experiment.
Table 5 shows the specific detection results. The lightweight vehicle detection model YOLO-AL achieved the highest mAP@0.5 on the UA-DETRAC dataset, reaching 92.0%. Although FLOPs are slightly larger than EfficientDet-D0 and the FPS is slightly lower than Mobilenetv4-YOLO, it has obvious advantages in other aspects. Compared to the original model YOLOv8n, YOLO-AL mAP@0.5 increased by 2.0%, the number of parameters decreased by 33%, the FLOPS decreased by 28%, and the FPS increased by 11%.
Table 5.
Performance comparison of models on the UA-DETRAC dataset.
Table 6 shows the comparison data from the ablation experiment. The addition of each module improves the model detection accuracy and speed while effectively reducing the number of parameters and FLOPs.
Table 6.
Ablation experiment of YOLO-AL on UA-DETRAC dataset.
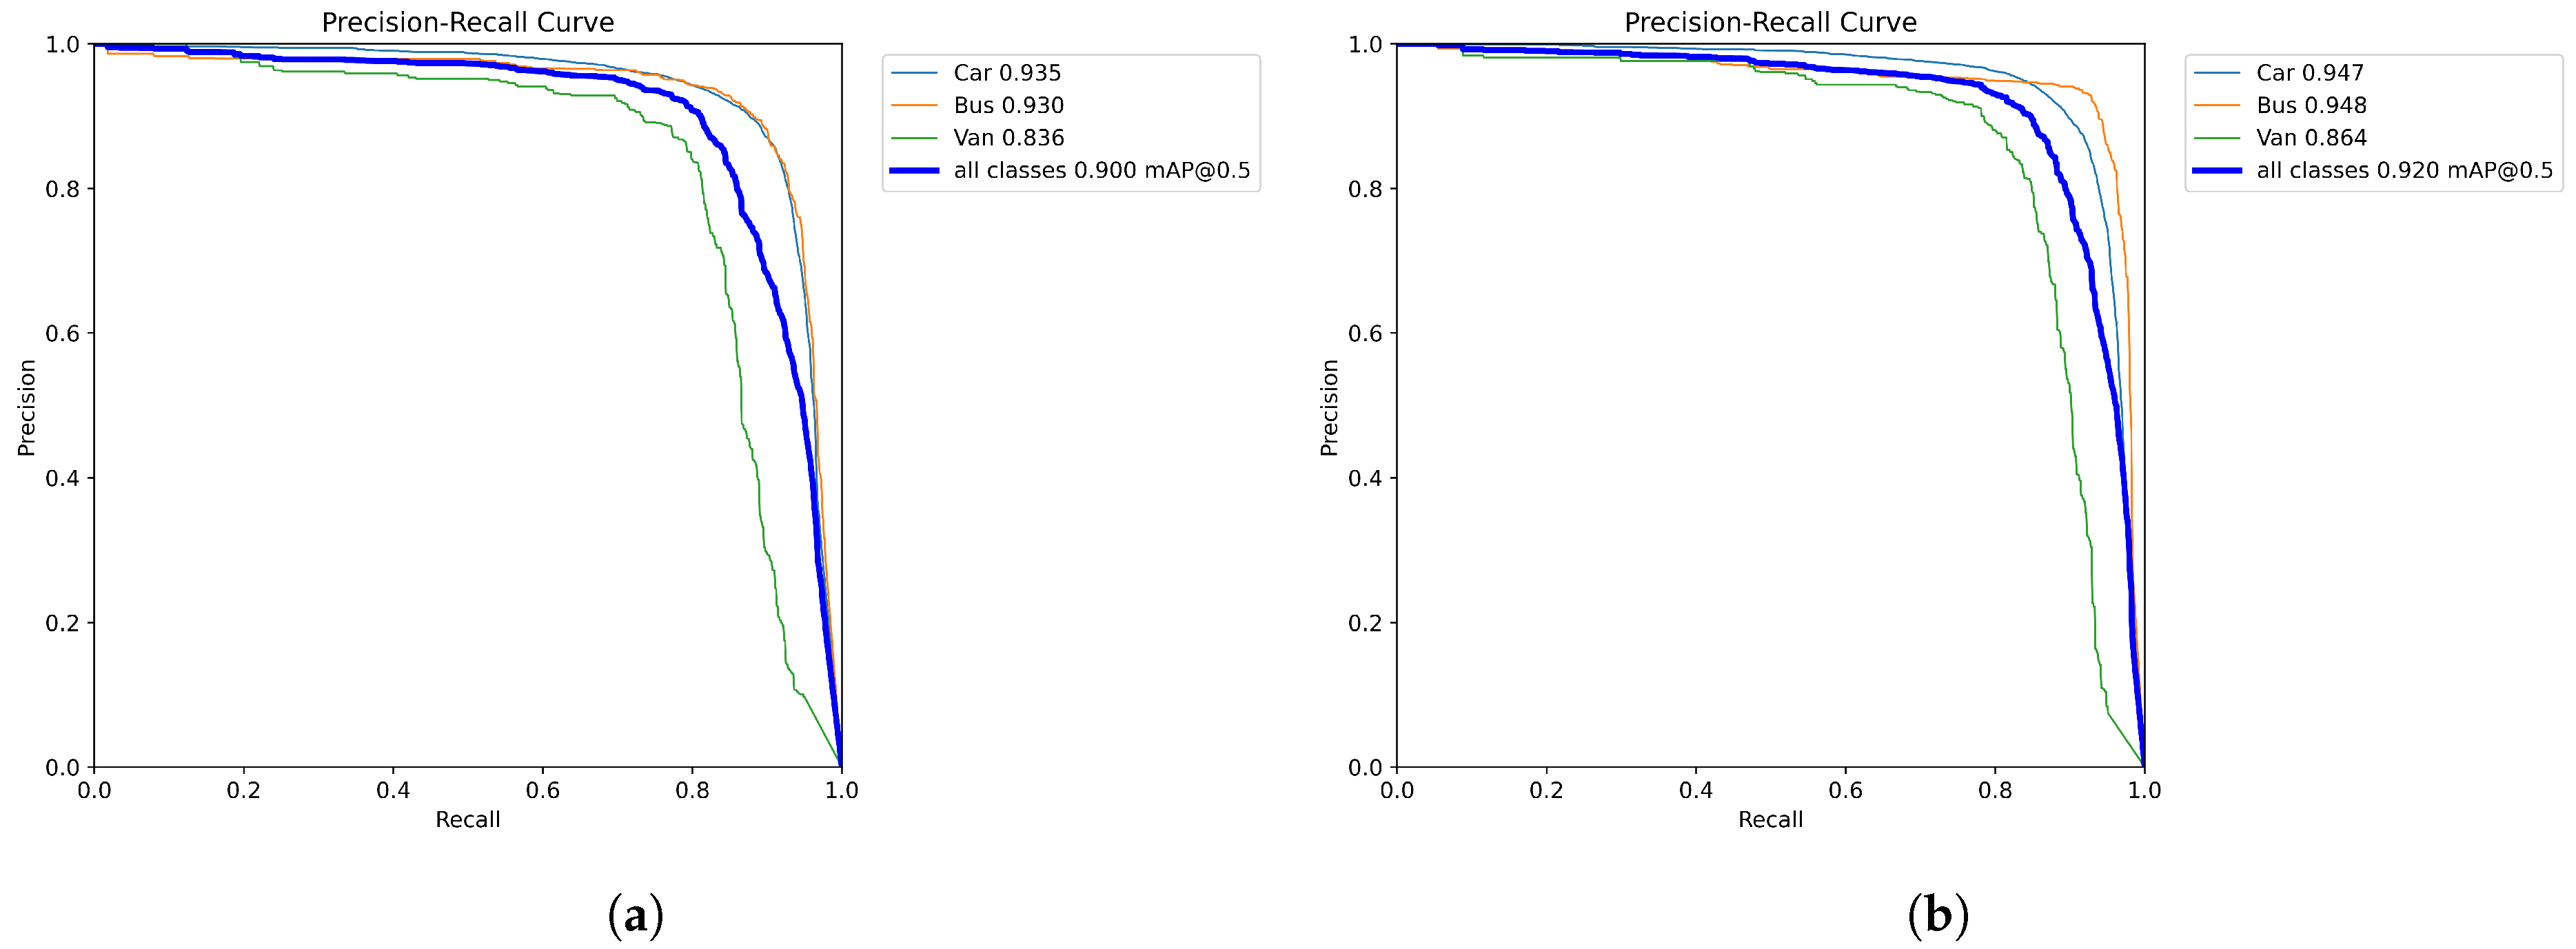
The comparison of the PR curves of the original model YOLOv8n and YOLO-AL on the UA-DETRAC datasets is shown in Figure 12. Compared with the original model, the mAP@0.5 of the YOLO-AL model increased from 90.0% to 92.0%, with significant improvements in all categories.
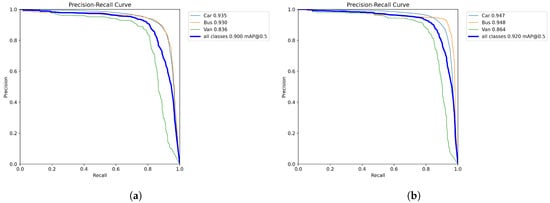
Figure 12.
(a) YOLOv8n. (b) YOLO-AL. PR curve comparison of YOLO-AL on UA-DETRAC dataset.
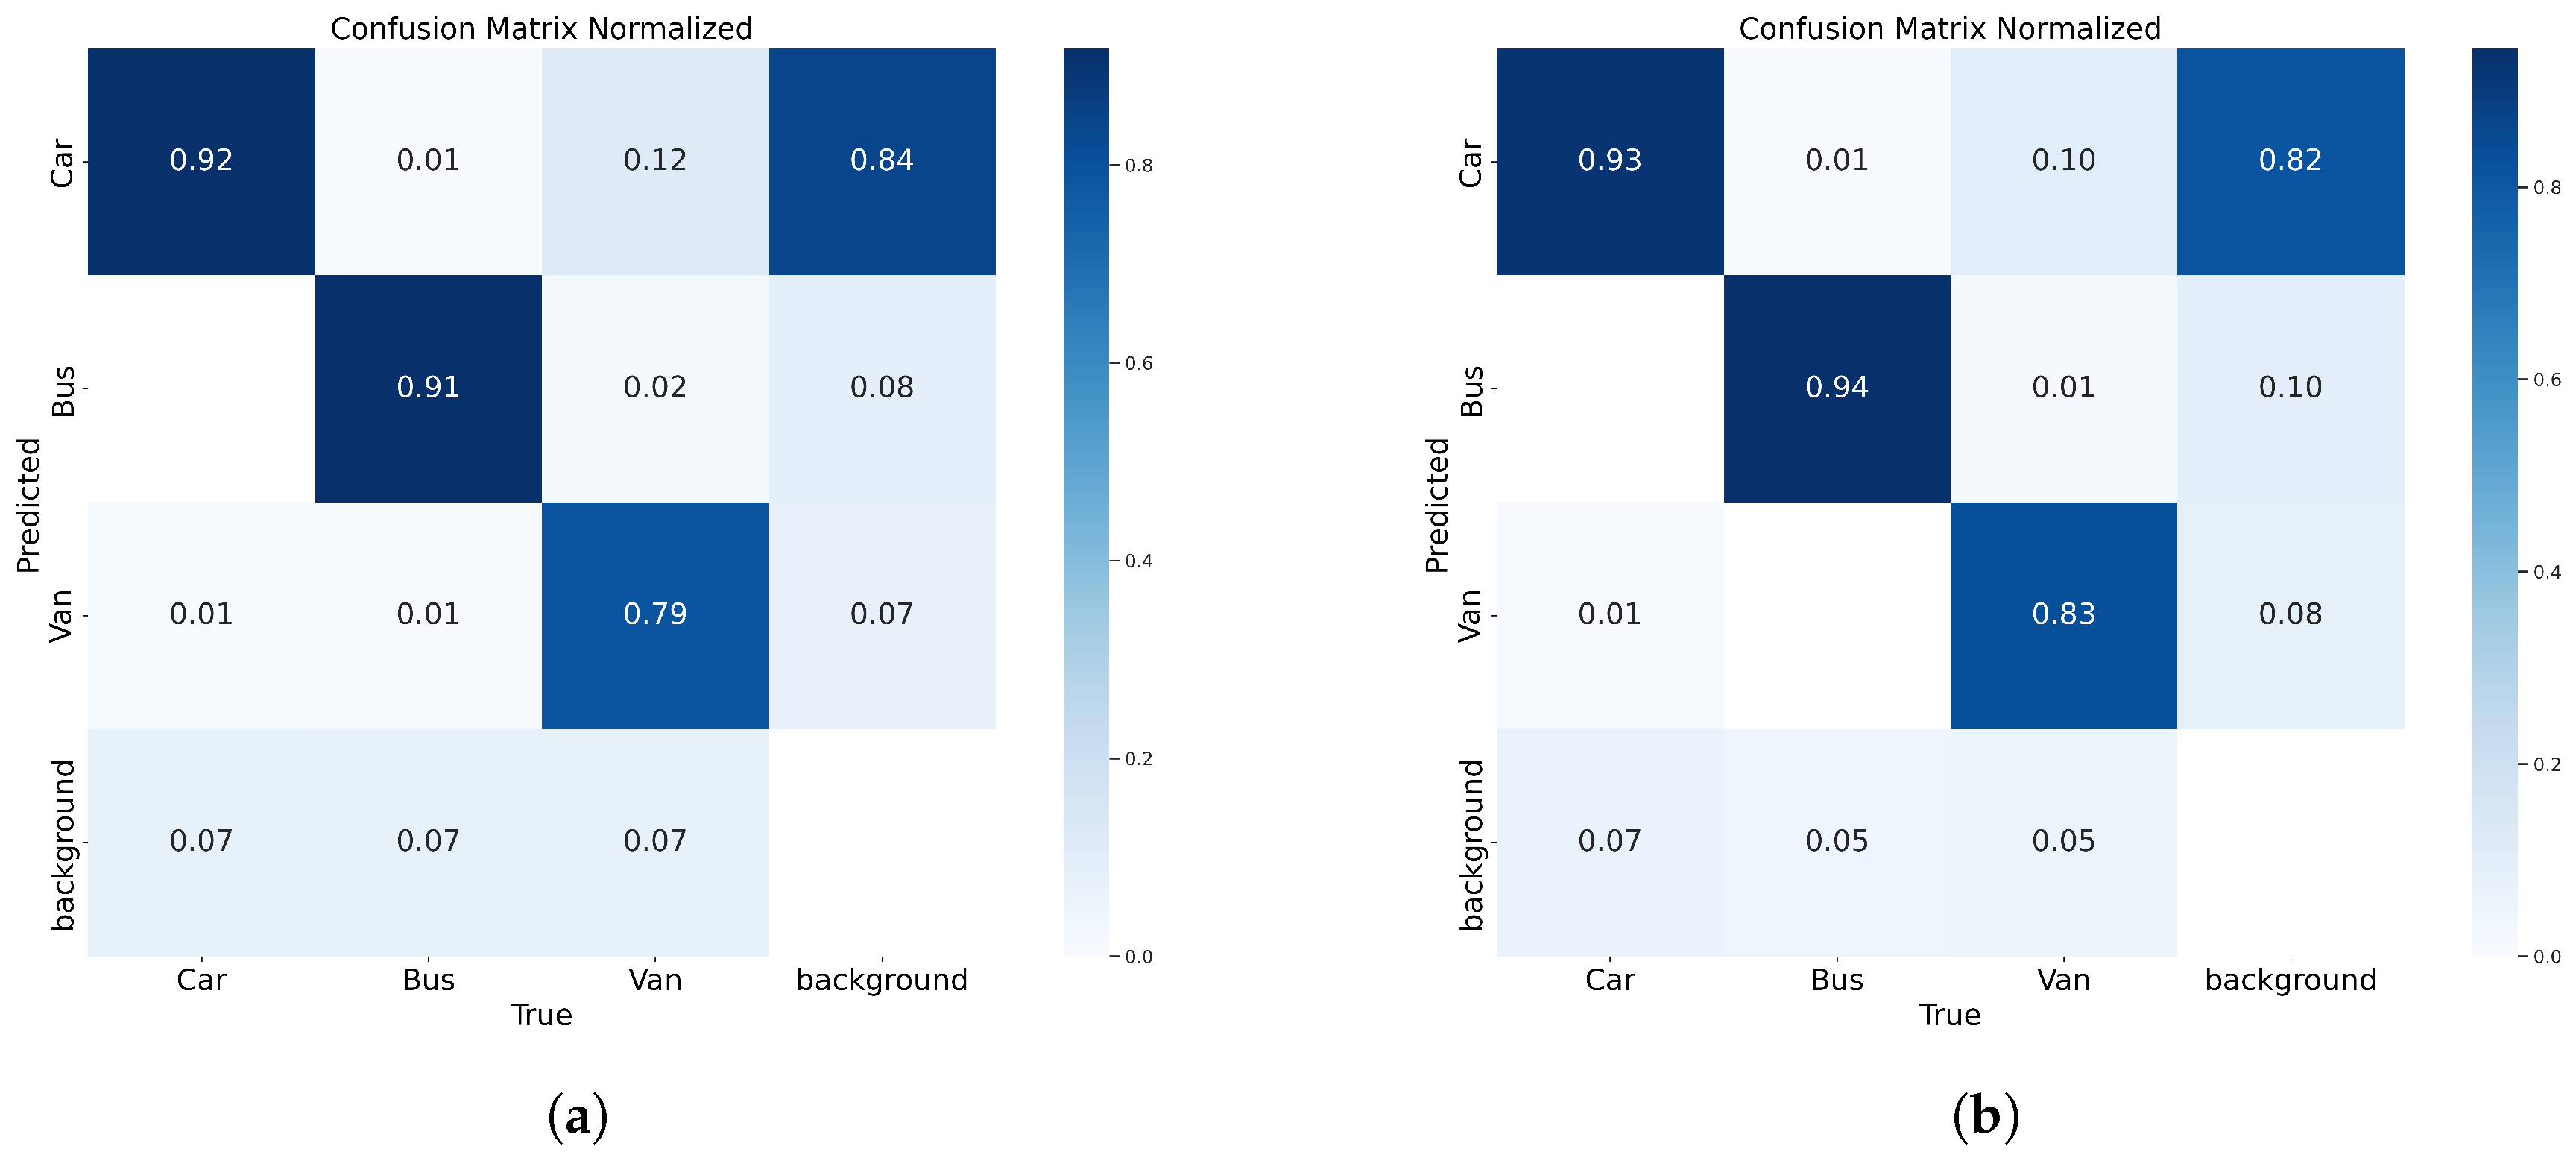
Figure 13 shows a comparison of the confusion matrices of the YOLOv8n model and the YOLO-AL model. The YOLO-AL model achieved 1%, 3%, and 4% lower leakage detection rates than the YOLOv8n model in the Car category, Bus category, and Van category, respectively. In contrast, YOLO-AL achieves a lower leakage rate.
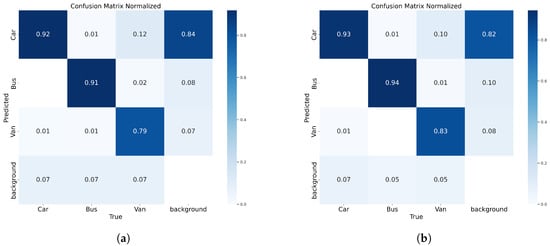
Figure 13.
(a) YOLOv8n. (b) YOLO-AL. Confusion matrix comparison of YOLO-AL on UA-DETRAC dataset.
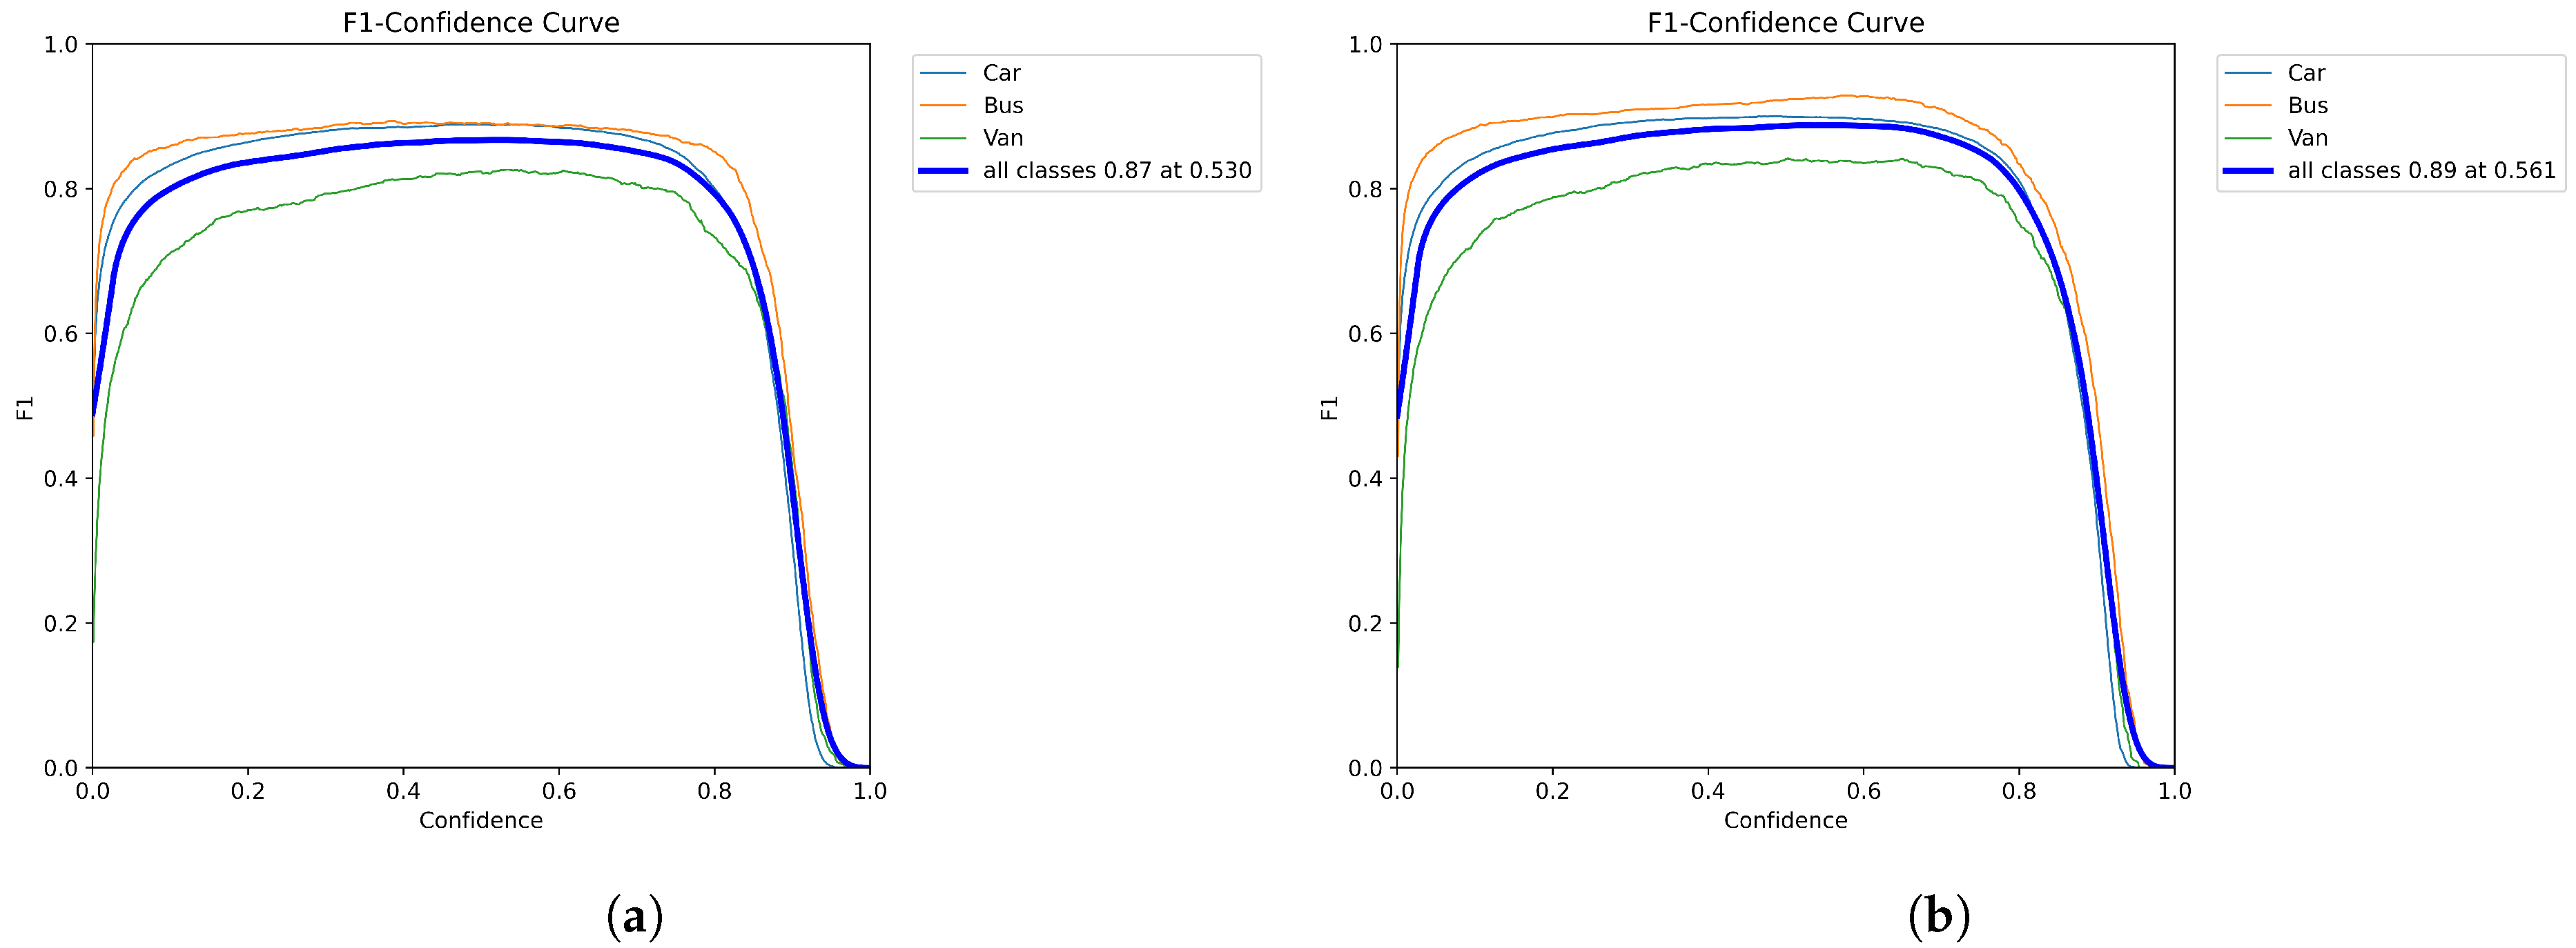
The comparison of the F1 score graph is shown in Figure 14. The original model achieved an average F1 score of 0.87 in all categories. YOLO-AL achieved an average F1 score of 0.89 in all categories. The higher score indicates that the model performs better in vehicle object detection and can detect and locate vehicle objects more reliably in images.
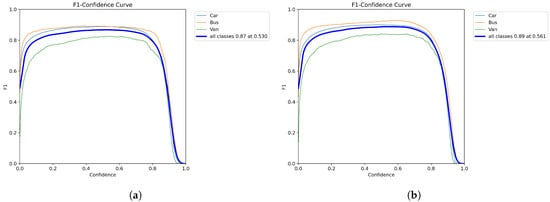
Figure 14.
(a) YOLOv8n. (b) YOLO-AL. Comparison of F1 scores of YOLO-AL on UA-DETRAC dataset.
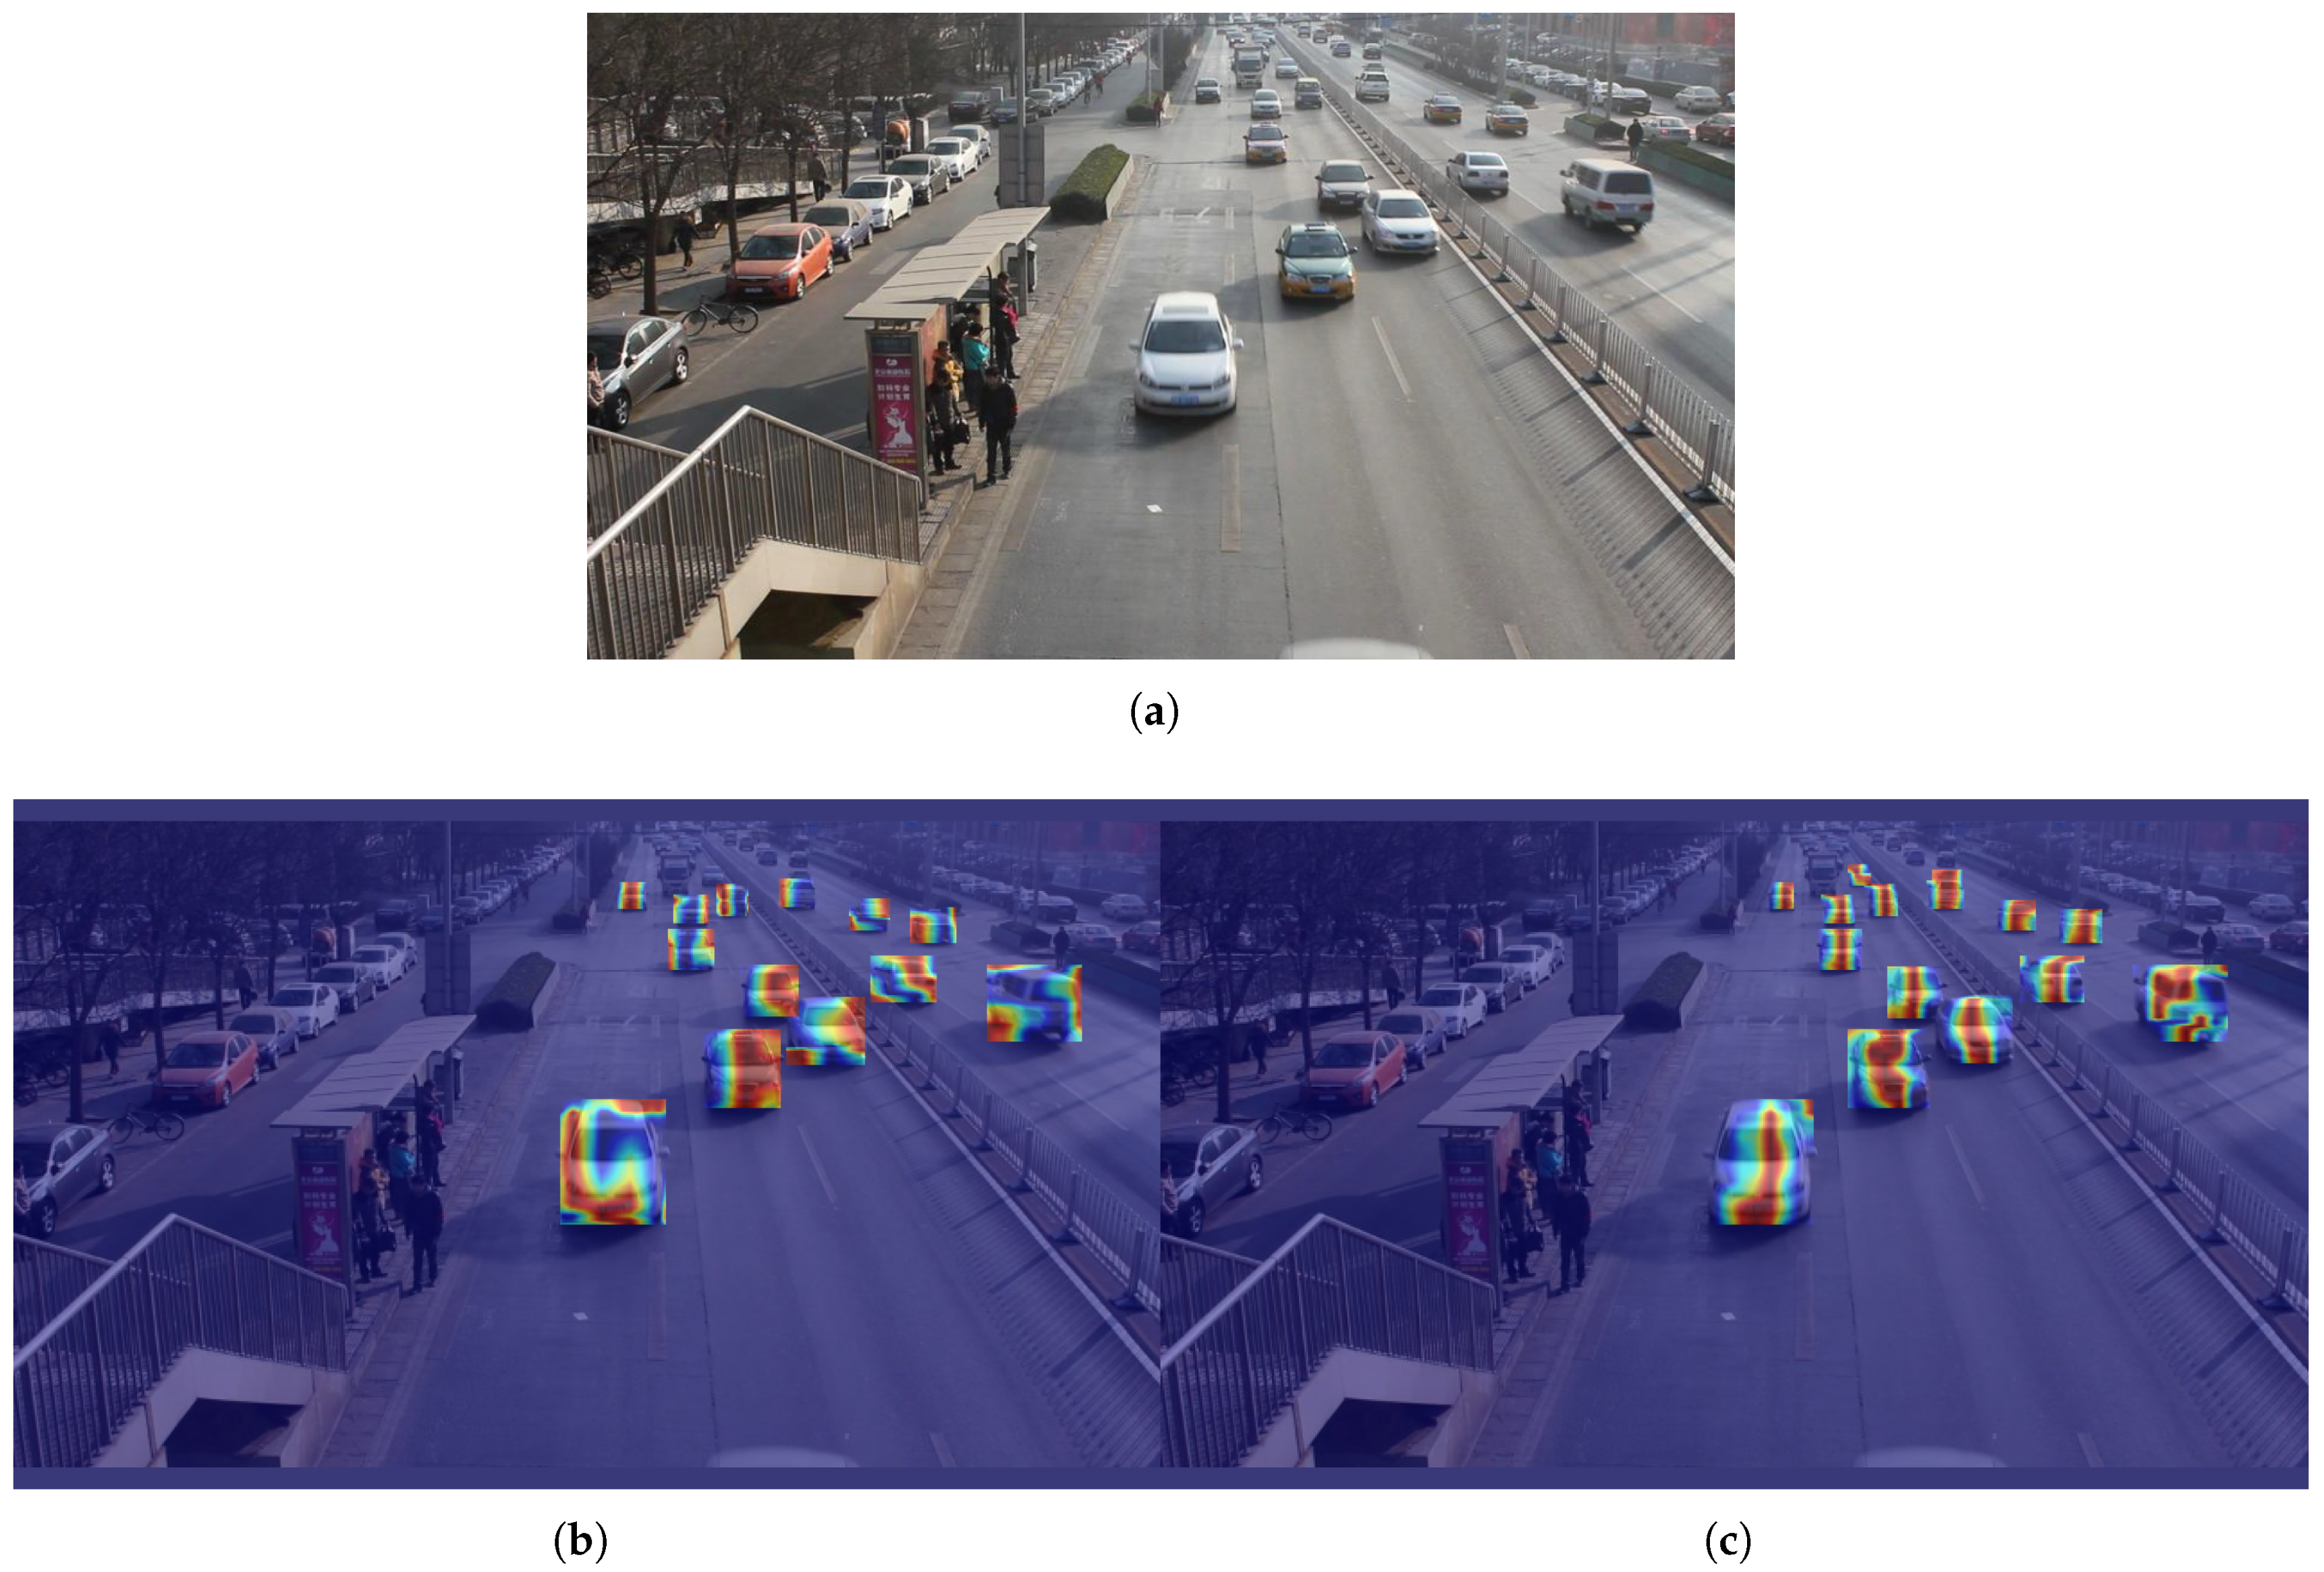
The results of the heatmap comparison of the original model YOLOv8 and the YOLO-AL model are shown in Figure 15. Compared with the original model, the YOLO-AL model is more likely to detect distant vehicle targets, which shows that YOLO-AL has higher accuracy in the field of vehicle target detection.

Figure 15.
(a) Original. (b) YOLOv8n. (c) YOLO-AL. Heatmap comparison of YOLO-AL on UA-DETRAC dataset.
5. Conclusions
This paper presents a lightweight vehicle target detection model, YOLO-AL, which is an enhanced version of YOLOv8n. Specifically, the ADown module was introduced in the backbone and neck, which improved the convolution of the original CBS module in the network, improved the ability to express characteristics through effective downsampling, reduced the complexity and computational complexity of the model, and built a lighter feature extraction aggregation network, thus improving the accuracy of small target recognition and overall detection performance in vehicle target detection. The LSCD module is used to optimize the head and reconstruct the network structure of the original model detection head. It adopts group normalization to design shared convolutional layers so that classification, regression, and confidence prediction tasks share the same features. This improves feature expression capabilities and category distinction, and significantly reduces redundant calculations and parameters. In the KITTI 2D dataset, the YOLO-AL mAP improved by 1.1%, and the FPS increased by 12%. Moving on to the UA-DETRAC dataset, mAP showed a growth of 2.0% with a simultaneous 11% increase in FPS. These results highlight the generalizability of the model and its ability to adapt to various traffic situations. The novel model introduced in this study managed to decrease the number of parameters by 33% and FLOPs by 28%. This reduction is of significant importance in addressing the challenges posed by limited computational resources and the complexities associated with deploying vehicle detection algorithms effectively in real-world traffic settings. This design can balance detection accuracy and inference speed and is very suitable for efficient and accurate target detection in complex traffic environments.
Author Contributions
Conceptualization, M.Z. and Z.Z.; methodology, M.Z. and Z.Z.; software, M.Z.; validation, M.Z.; formal analysis, M.Z. and Z.Z.; investigation, M.Z. and Z.Z.; resources, Z.Z.; data curation, M.Z.; writing—original draft preparation, M.Z.; writing—review and editing, M.Z. and Z.Z.; visualization, M.Z.; supervision, Z.Z.; project administration, Z.Z.; funding acquisition, Z.Z. All authors have read and agreed to the published version of the manuscript.
Funding
This research received no external funding.
Institutional Review Board Statement
Not applicable.
Informed Consent Statement
Not applicable.
Data Availability Statement
Data are available on request from the corresponding author.
Conflicts of Interest
The authors declare no conflicts of interest.
References
- Chen, S.; Piao, L.; Zang, X.; Luo, Q.; Li, J.; Yang, J.; Rong, J. Analyzing differences of highway lane-changing behavior using vehicle trajectory data. Phys. A Stat. Mech. Its Appl. 2023, 624, 128980. [Google Scholar] [CrossRef]
- Zhu, T.; Liu, Z. Intelligent transport systems in china: Past, present and future. In Proceedings of the 2015 Seventh International Conference on Measuring Technology and Mechatronics Automation, Nanchang, China, 13–14 June 2015; pp. 581–584. [Google Scholar]
- Chen, X.; Hu, R.; Luo, K.; Wu, H.; Biancardo, S.; Zheng, Y.; Xian, J. Intelligent ship route planning via an A search model enhanced double-deep Q-network. Ocean. Eng. 2025, 327, 120956. [Google Scholar] [CrossRef]
- Lee, D. Effective Gaussian mixture learning for video background subtraction. IEEE Trans. Pattern Anal. Mach. Intell. 2005, 27, 827–832. [Google Scholar] [PubMed]
- Zhang, H.; Zhang, H. A moving target detection algorithm based on dynamic scenes. In Proceedings of the 2013 8th International Conference on Computer Science & Education, Colombo, Sri Lanka, 26–28 April 2013; pp. 995–998. [Google Scholar]
- Deng, G.; Guo, K. Self-adaptive background modeling research based on change detection and area training. In Proceedings of the 2014 IEEE Workshop on Electronics, Computer and Applications, Ottawa, ON, USA, 8–9 May 2014; pp. 59–62. [Google Scholar]
- Barnich, O. Van Droogenbroeck, M. A universal background subtraction algorithm for video sequences. IEEE Trans. Image Process. 2010, 20, 1709–1724. [Google Scholar] [CrossRef] [PubMed]
- Weng, M.; Huang, G.; Da, X. A new interframe difference algorithm for moving target detection. In Proceedings of the 2010 3rd International Congress on Image and Signal Processing, Yantai, China, 16–18 October 2010; Volume 1, pp. 285–289. [Google Scholar]
- Fang, Y.; Dai, B. An improved moving target detecting and tracking based on optical flow technique and kalman filter. In Proceedings of the 2009 4th International Conference on Computer Science & Education, Nanning, China, 25–28 July 2009; pp. 1197–1202. [Google Scholar]
- Alahi, M.; Sukkuea, A.; Tina, F.; Nag, A.; Kurdthongmee, W.; Suwannarat, K.; Mukhopadhyay, S. Integration of IoT-enabled technologies and artificial intelligence (AI) for smart city scenario: Recent advancements and future trends. Sensors 2023, 23, 5206. [Google Scholar] [CrossRef] [PubMed]
- Viola, P.; Jones, M. Rapid object detection using a boosted cascade of simple features. In Proceedings of the 2001 IEEE Computer Society Conference on Computer Vision and Pattern Recognition, Kauai, HI, USA, 8–14 December 2001; Volume 1, p. I. [Google Scholar]
- Xu, Z.; Huang, W.; Wang, Y. Multi-class vehicle detection in surveillance video based on deep learning. J. Comput. Appl. Math. 2019, 39, 700–705. [Google Scholar]
- Zhang, S.; Wang, X. Human detection and object tracking based on Histograms of Oriented Gradients. In Proceedings of the 2013 Ninth International Conference on Natural Computation (ICNC), Shenyang, China, 23–25 July 2013; pp. 1349–1353. [Google Scholar]
- Freund, Y.; Schapire, R. A decision-theoretic generalization of on-line learning and an application to boosting. J. Comput. Syst. Sci. 1997, 55, 119–139. [Google Scholar] [CrossRef]
- Kaijun, Y. A least squares support vector machine classifier for information retrieval. J. Converg. Inf. Technol. 2013, 8, 177–183. [Google Scholar]
- Felzenszwalb, P.; McAllester, D.; Ramanan, D. A discriminatively trained, multiscale, deformable part model. In Proceedings of the 2008 IEEE Conference on Computer Vision and Pattern Recognition, Anchorage, AK, USA, 23–28 June 2008; pp. 1–8. [Google Scholar]
- Li, G.; Zeng, R.; Lin, L. Moving target detection in video monitoring system. In Proceedings of the 2006 6th World Congress on Intelligent Control and Automation, Dalian, China, 21–23 June 2006; Volume 2, pp. 9778–9781. [Google Scholar]
- Wu, X.; Song, X.; Gao, S.; Chen, C. Review of target detection algorithms based on deep learning. Transducer Microsyst. Technol. 2021, 40, 4–7. [Google Scholar]
- Xie, W.; Zhu, D.; Tong, X. Small target detection method based on visual attention. Comput. Eng. Appl. 2013, 49, 125–128. [Google Scholar]
- Li, Z.; Liu, F.; Yang, W. A survey of convolutional neural networks: Analysis, applications, and prospects. IEEE Trans. Neural Netw. Learn. Syst. 2021, 33, 6999–7019. [Google Scholar] [CrossRef] [PubMed]
- LeCun, Y.; Bengio, Y.; Hinton, G. Deep learning. Nature 2015, 521, 436–444. [Google Scholar] [CrossRef] [PubMed]
- Zhang, Y.; Guo, Z.; Wu, J.; Tian, Y.; Tang, H.; Guo, X. Real-time vehicle detection based on improved yolo v5. Sustainability 2022, 14, 12274. [Google Scholar] [CrossRef]
- Chen, D.; Huang, C.; Fan, T.; Lau, H.; Yan, X. Predictive Modeling for Vessel Traffic Flow: A Comprehensive Survey from Statistics to AI. Transp. Saf. Environ. 2025, tdaf022. [Google Scholar] [CrossRef]
- Girshick, R.; Donahue, J.; Darrell, T.; Malik, J. Rich feature hierarchies for accurate object detection and semantic segmentation. In Proceedings of the IEEE Conference on Computer Vision and Pattern Recognition, Columbus, OH, USA, 23–28 June 2014; pp. 580–587. [Google Scholar]
- Bharati, P.; Pramanik, A. Deep learning techniques—R-CNN to mask R-CNN: A survey. In Computational Intelligence in Pattern Recognition: Proceedings of CIPR 2019, London, UK, 13 November 2019; Springer: Singapore, 2020; pp. 657–668. [Google Scholar]
- Ren, S.; He, K.; Girshick, R.; Sun, J. Faster r-cnn: Towards real-time object detection with region proposal networks. IEEE Trans. Pattern Anal. Mach. Intell. 2017, 39, 1137–1149. [Google Scholar] [CrossRef] [PubMed]
- Liu, W.; Anguelov, D.; Erhan, D.; Szegedy, C.; Reed, S.; Fu, C.; Berg, A. Ssd: Single shot multibox detector. In Proceedings of the Computer Vision–ECCV 2016: 14th European Conference, Amsterdam, The Netherlands, 11–14 October 2016; pp. 21–37. [Google Scholar]
- Redmon, J.; Divvala, S.; Girshick, R.; Farhadi, A. You only look once: Unified, real-time object detection. In Proceedings of the IEEE Conference on Computer Vision and Pattern Recognition, Las Vegas, NV, USA, 27–30 June 2016; pp. 779–788. [Google Scholar]
- Qin, D.; Leichner, C.; Delakis, M.; Fornoni, M.; Luo, S.; Yang, F.; Wang, W.; Banbury, C.; Ye, C.; Akin, B.; et al. MobileNetV4: Universal models for the mobile ecosystem. In Proceedings of the European Conference on Computer Vision, Milan, Italy, 29 September–4 October 2024; pp. 79–96. [Google Scholar]
- Tan, M.; Pang, R.; Le, Q. Efficientdet: Scalable and efficient object detection. In Proceedings of the IEEE/CVF Conference on Computer Vision and Pattern Recognition, Seattle, WA, USA, 14–20 June 2020; pp. 16965–16974. [Google Scholar]
- Zhao, Y.; Lv, W.; Xu, S. DETRs beat YOLOs on real-time object detection. In Proceedings of the IEEE/CVF Conference on Computer Vision and Pattern Recognition, Seattle, WA, USA, 16–22 June 2024; pp. 16965–16974. [Google Scholar]
- Varghese, R.; Sambath, M. Yolov8: A novel object detection algorithm with enhanced performance and robustness. In Proceedings of the 2024 International Conference on Advances in Data Engineering and Intelligent Computing Systems (ADICS), Chennai, India, 18–19 April 2024; pp. 1–6. [Google Scholar]
- Wu, Y.; He, K. Group normalization. Int. J. Comput. Vis. 2020, 128, 742–755. [Google Scholar] [CrossRef]
- Everingham, M.; Luc, V.; Williams, C.; Winn, J.; Zisserman, A. The pascal visual object classes (voc) challenge. Int. J. Comput. Vis. 2010, 88, 303–338. [Google Scholar] [CrossRef]
- Geiger, A.; Lenz, P.; Urtasun, R. Are we ready for autonomous driving? The KITTI vision benchmark suite. In Proceedings of the IEEE Conference on Computer Vision and Pattern Recognition, Providence, RI, USA, 16–21 June 2012; pp. 3354–3361. [Google Scholar]
- Wang, C.; Bochkovskiy, A.; Liao, H. YOLOv7: Trainable bag-of-freebies sets new state-of-the-art for real-time object detectors. In Proceedings of the IEEE/CVF Conference on Computer Vision and Pattern Recognition, Vancouver, BC, Canda, 18–22 June 2023; pp. 7464–7475. [Google Scholar]
- Wang, C.; Yeh, I.; Liao, H. Yolov9: Learning what you want to learn using programmable gradient information. In Proceedings of the European Conference on Computer Vision, Milan, Italy, 29 September–4 October 2024; pp. 1–21. [Google Scholar]
- Wang, A.; Chen, H.; Liu, L.; Chen, K.; Lin, Z.; Han, J.; Ding, G. Yolov10: Real-time end-to-end object detection. Adv. Neural Inf. Process. Syst. 2024, 37, 107984–108011. [Google Scholar]
- Wen, L.; Du, D.; Cai, Z. UA-DETRAC: A new benchmark and protocol for multi-object detection and tracking. Comput. Vis. Image Underst. 2020, 193, 102907. [Google Scholar] [CrossRef]

Disclaimer/Publisher’s Note: The statements, opinions and data contained in all publications are solely those of the individual author(s) and contributor(s) and not of MDPI and/or the editor(s). MDPI and/or the editor(s) disclaim responsibility for any injury to people or property resulting from any ideas, methods, instructions or products referred to in the content. |
© 2025 by the authors. Licensee MDPI, Basel, Switzerland. This article is an open access article distributed under the terms and conditions of the Creative Commons Attribution (CC BY) license (https://creativecommons.org/licenses/by/4.0/).