
Application of Pipe Slit Anchor Mesh Spraying Supporting Technology Based on Loose Circle Supporting Theory in Makeng Iron Ore Mine


Abstract
1. Introduction
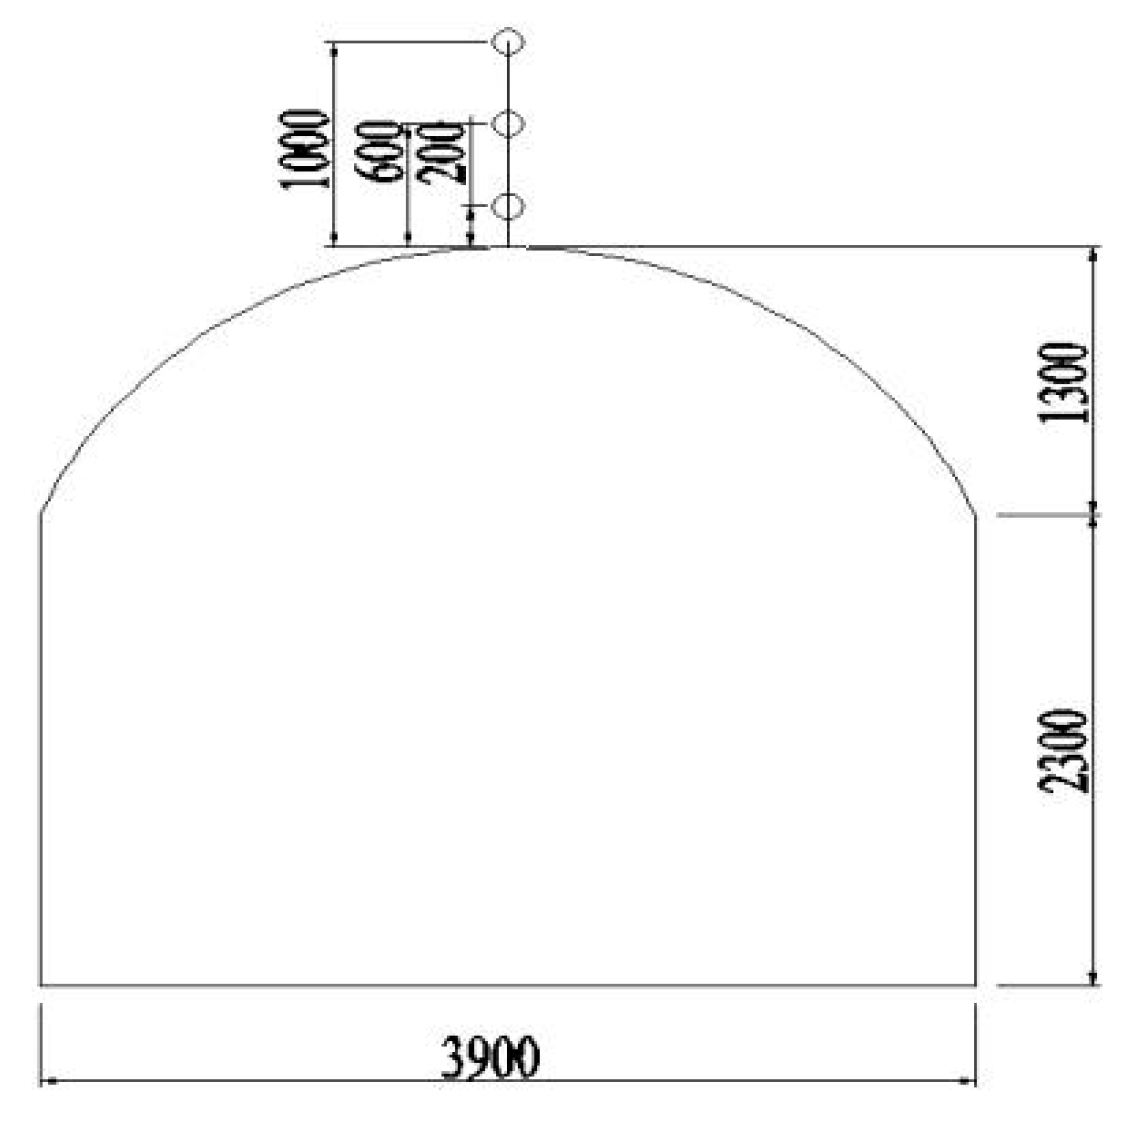
2. Project Overview
3. Loose Ring Measurement
3.1. Loose Ring Field Test
- Drilling measurement hole: Drilling with φ90 or higher drilling rig. Each measuring point is drilled according to the designed drilling position, the drilling azimuth is 5–10° down the tying angle, the drilling depth is at least 5 m, and the hole depth is measured with a ruler.
- Hole cleaning and water filling: Clean the drilling slag in the drilling hole, send the test probe into the bottom of the hole through the extendable tube of the self-made probe, and then send the water filling pipe into the drilling hole to fill the water.
- Test process: Measure the distance between receivers, input data such as project number, hole depth and distance between receivers into the test equipment. After the hole is filled with water, keep the hole full of water, and then slowly and evenly pull the test line to pull out the probe. As the probe is pulled out, readings are taken every 20 cm until the transducer is completely detached from the borehole, as shown in the top view. With the different position of the drill, that is, the different depth from the two sides of the roadway, the reading on the tester changes due to the different degrees of fragmentation of the rock mass. After the measurement, the computer data analysis system is used to take the best and representative readings as the final analysis data of the measurement results.
3.2. Sonic Method for Testing Loose Rings
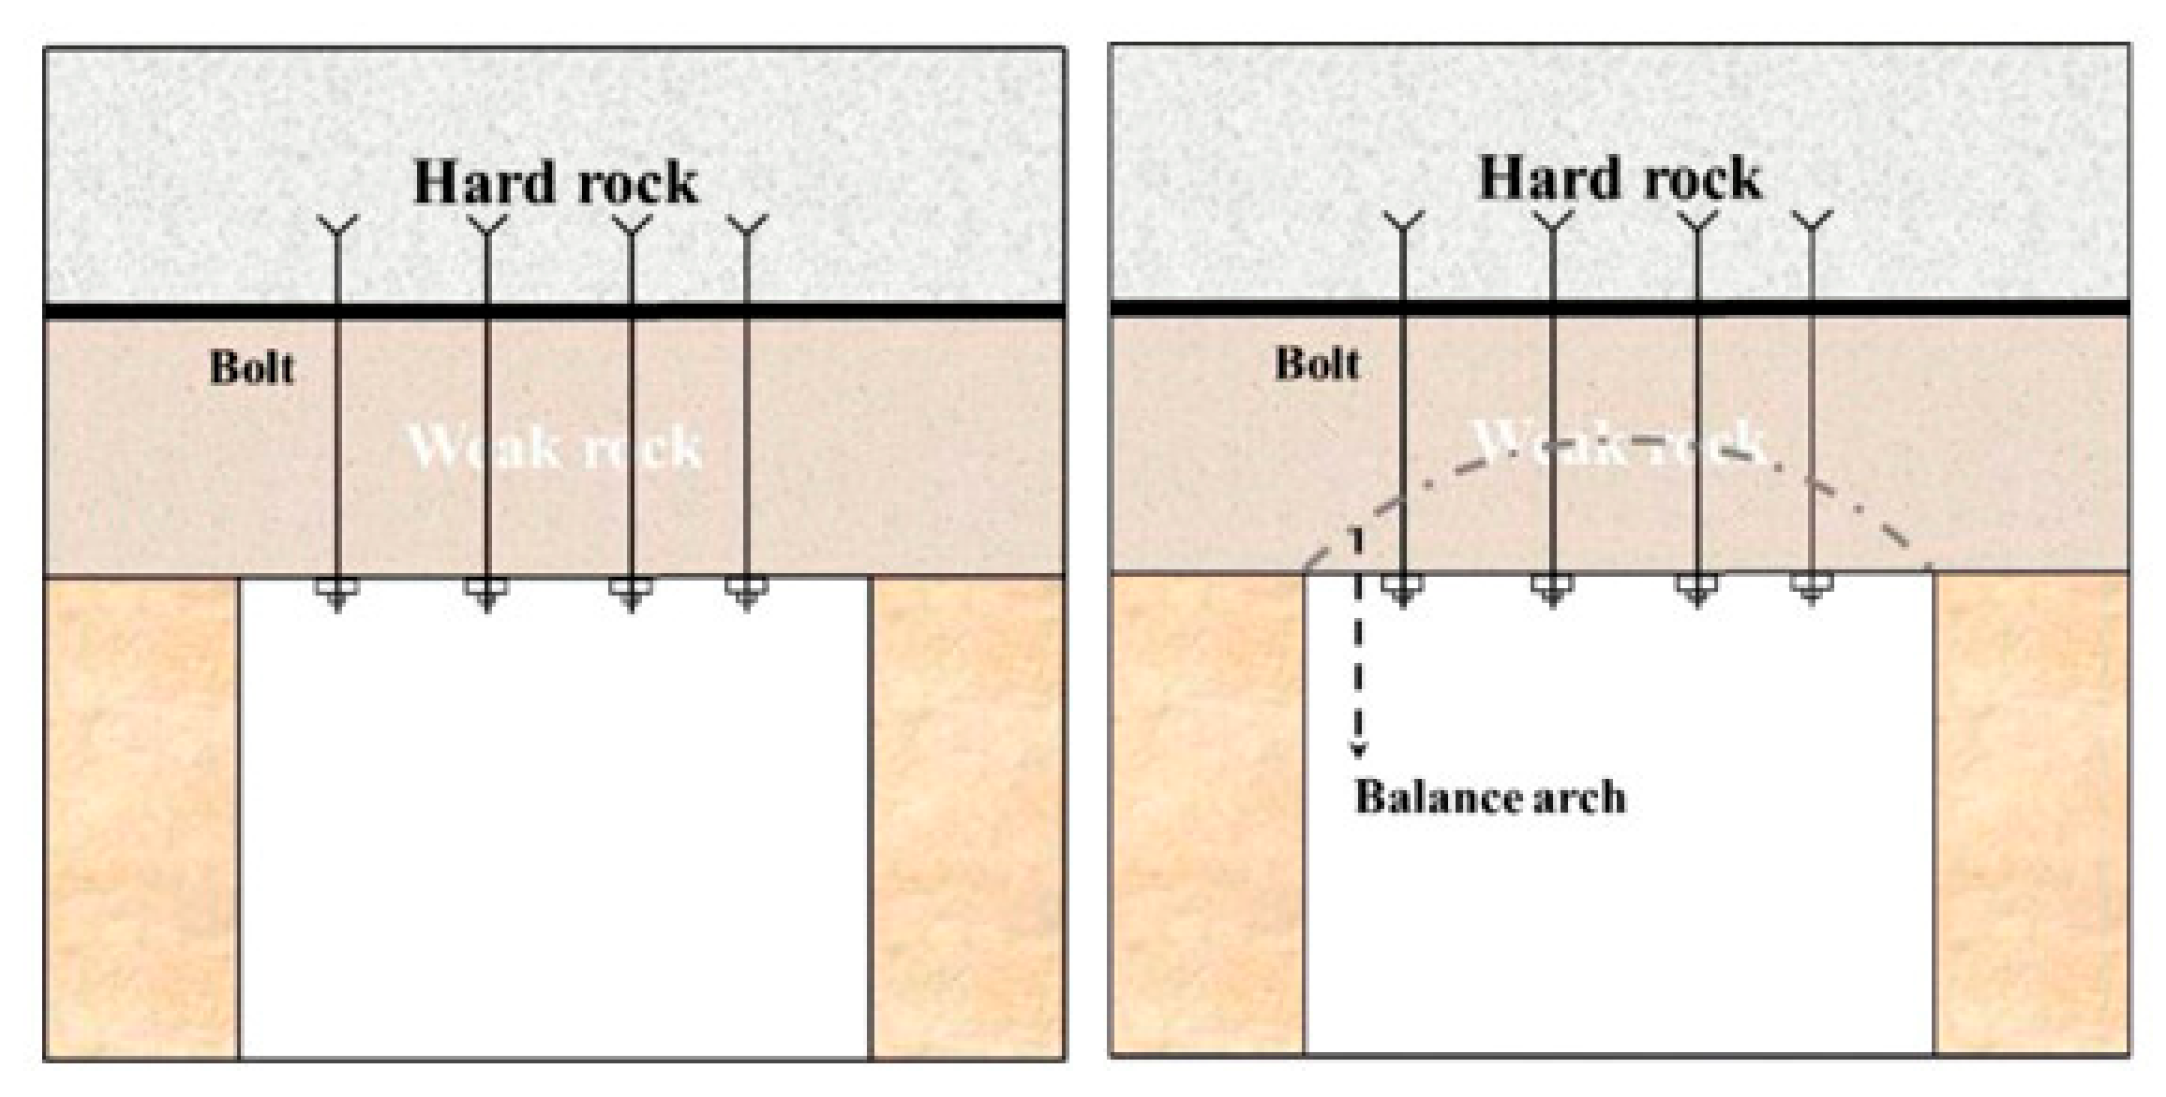
4. Determination of Parameters for Slit Pipe Anchor Net Spray Support
5. Simulation Analysis of Support Effectiveness
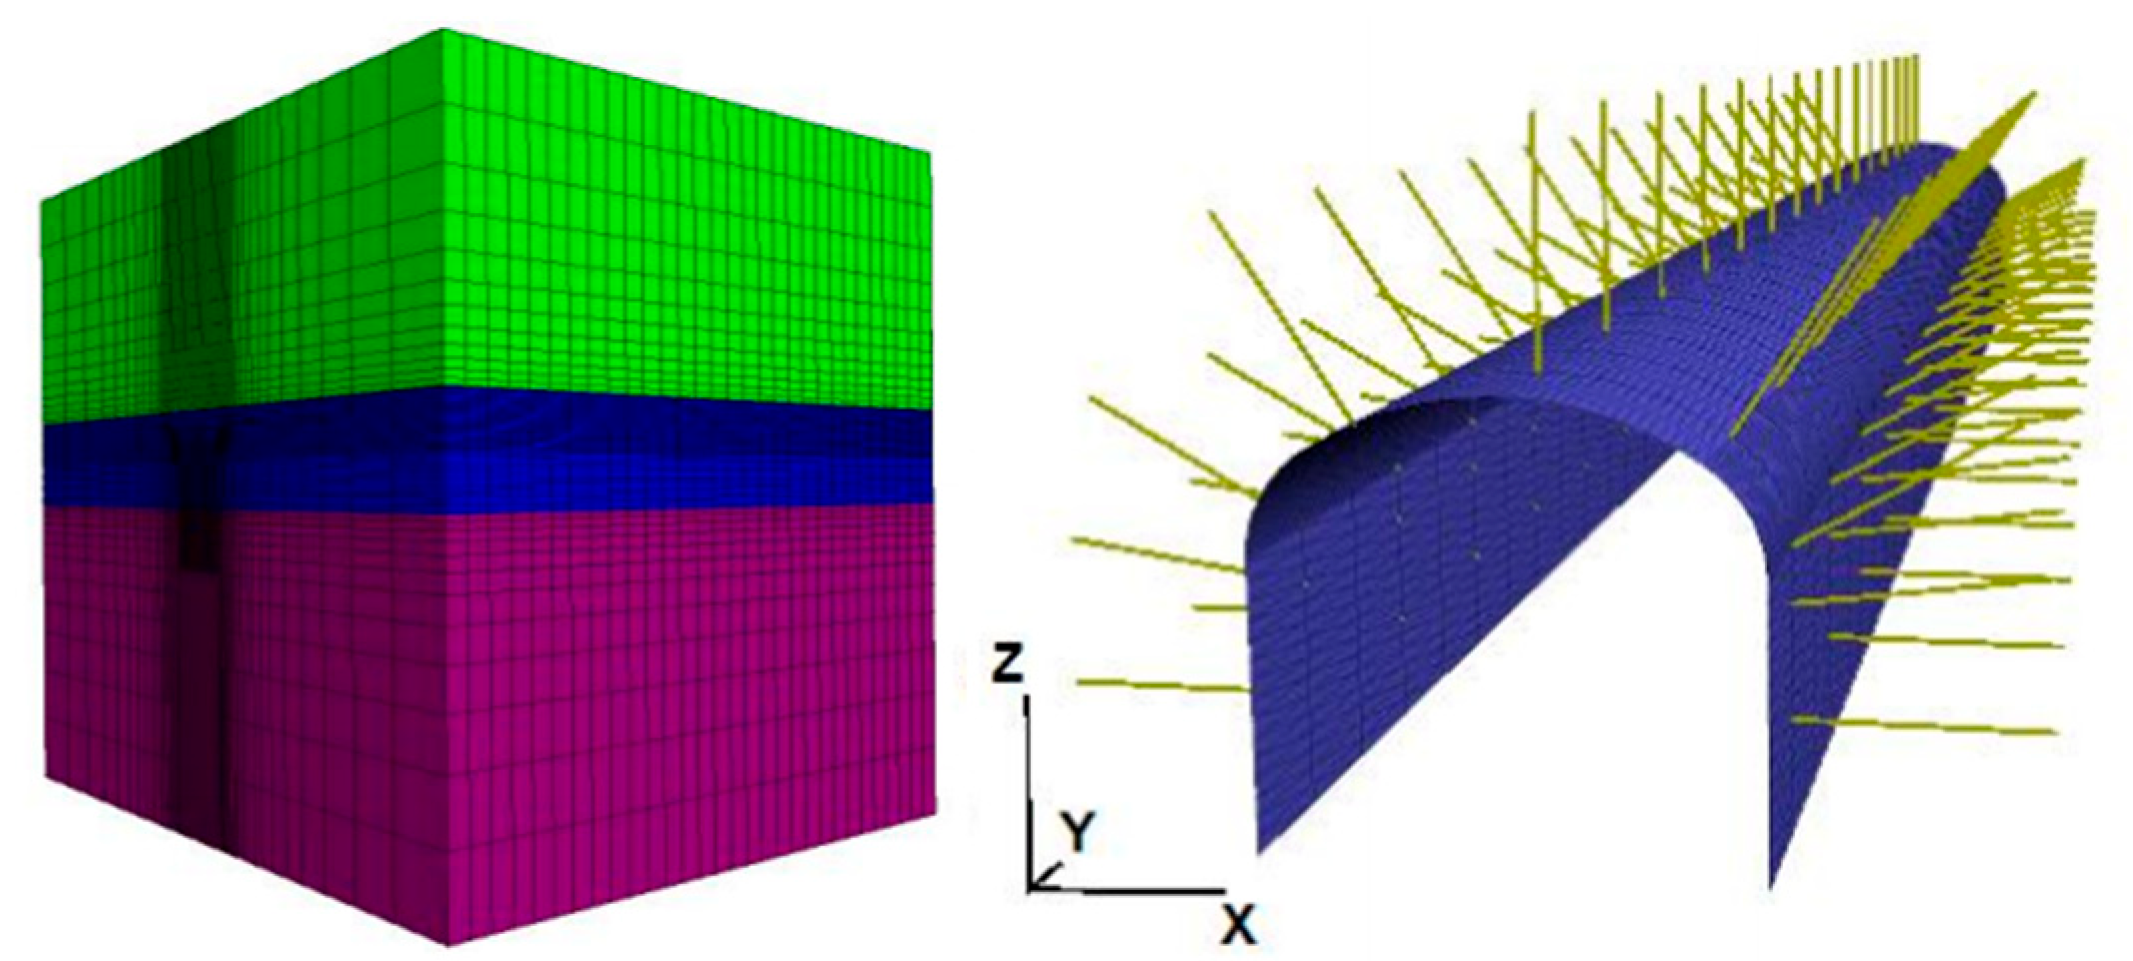
5.1. Modelling
- The ore-bearing rock mass is considered an ideal elastic–plastic material. After reaching the yield point, neither the material strength nor volume changes with plastic flow, and strain hardening or softening effects are not taken into account.
- Both the ore body and surrounding rock are assumed to be locally homogeneous and isotropic. The plastic flow does not alter the isotropic nature of the materials.
- All physical parameters involved in the analysis are considered time-independent, reflecting the brittle nature of the rock.
- Given the limitations of finite difference calculations, tectonic activity is disregarded. The in situ stress field is assumed to be geostatic, rock layers are in full contact with each other, and the interior of each rock layer is treated as a continuous medium. Groundwater effects are also excluded from the model.
- The calculation considers only the effects of geostress, neglecting the impact of seismic waves, explosive shock waves, and groundwater on the stability of the rock mass.
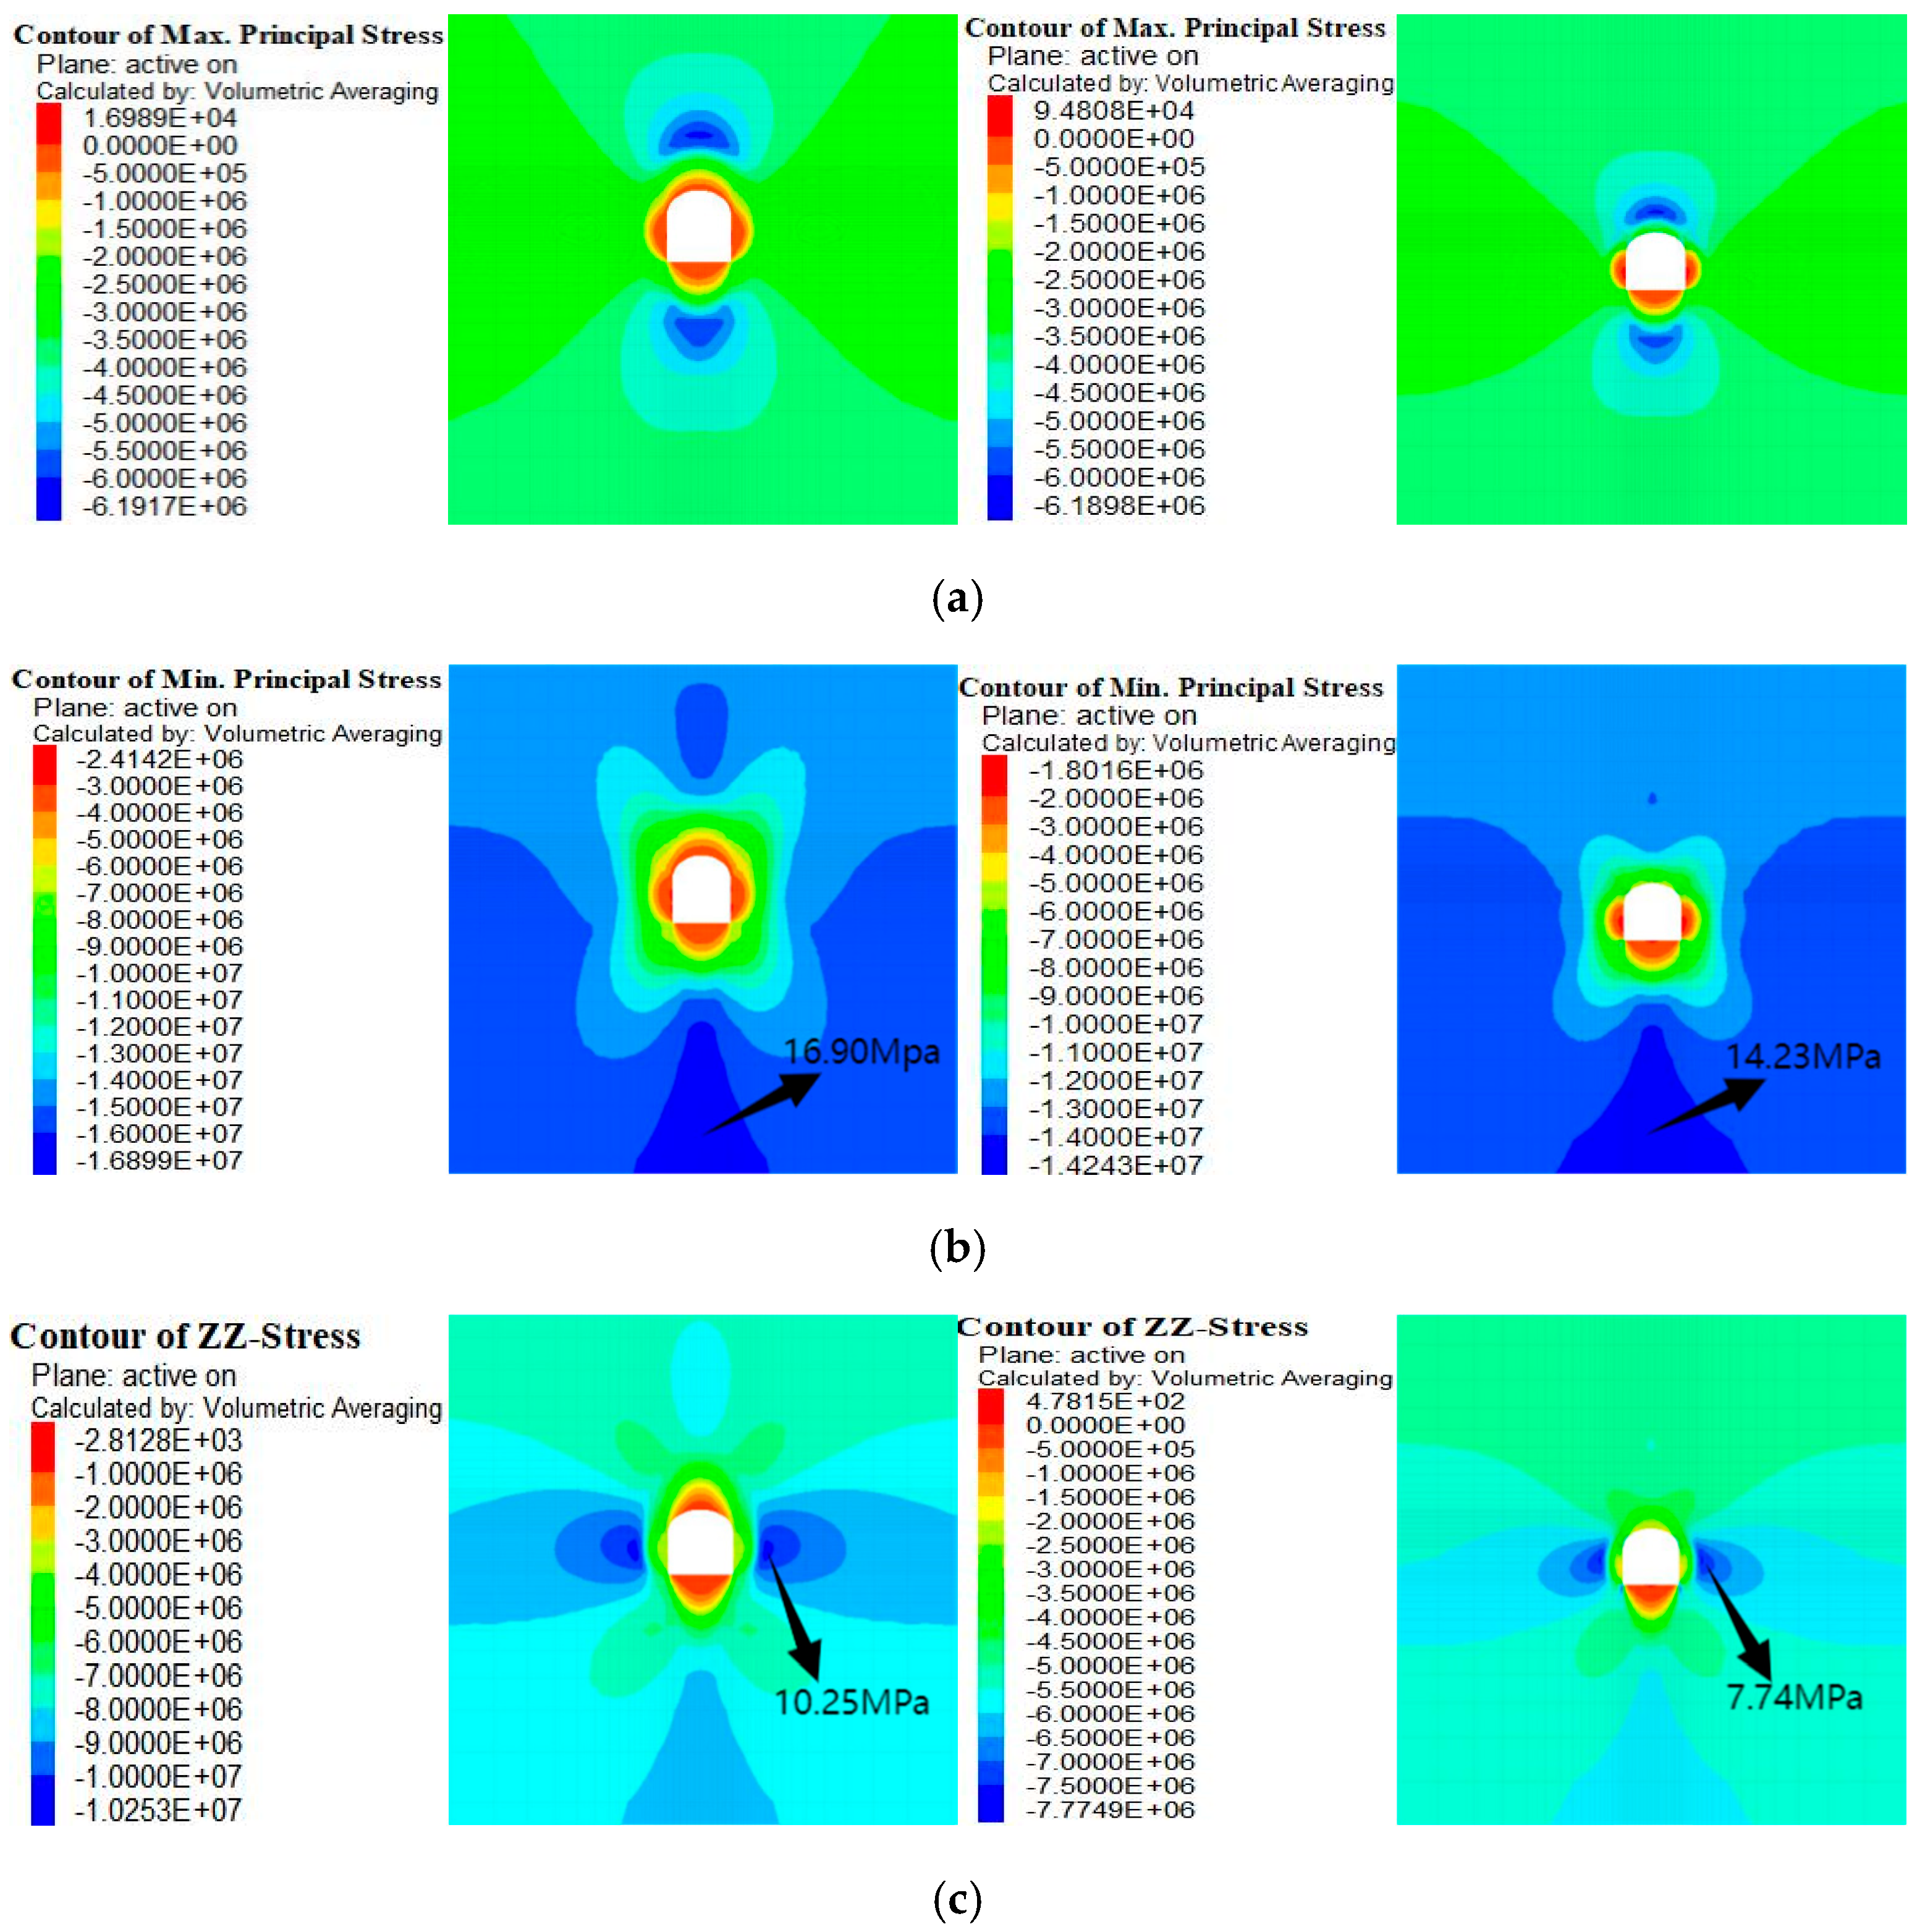
5.2. Stress Analysis of the Roadway Perimeter Rock
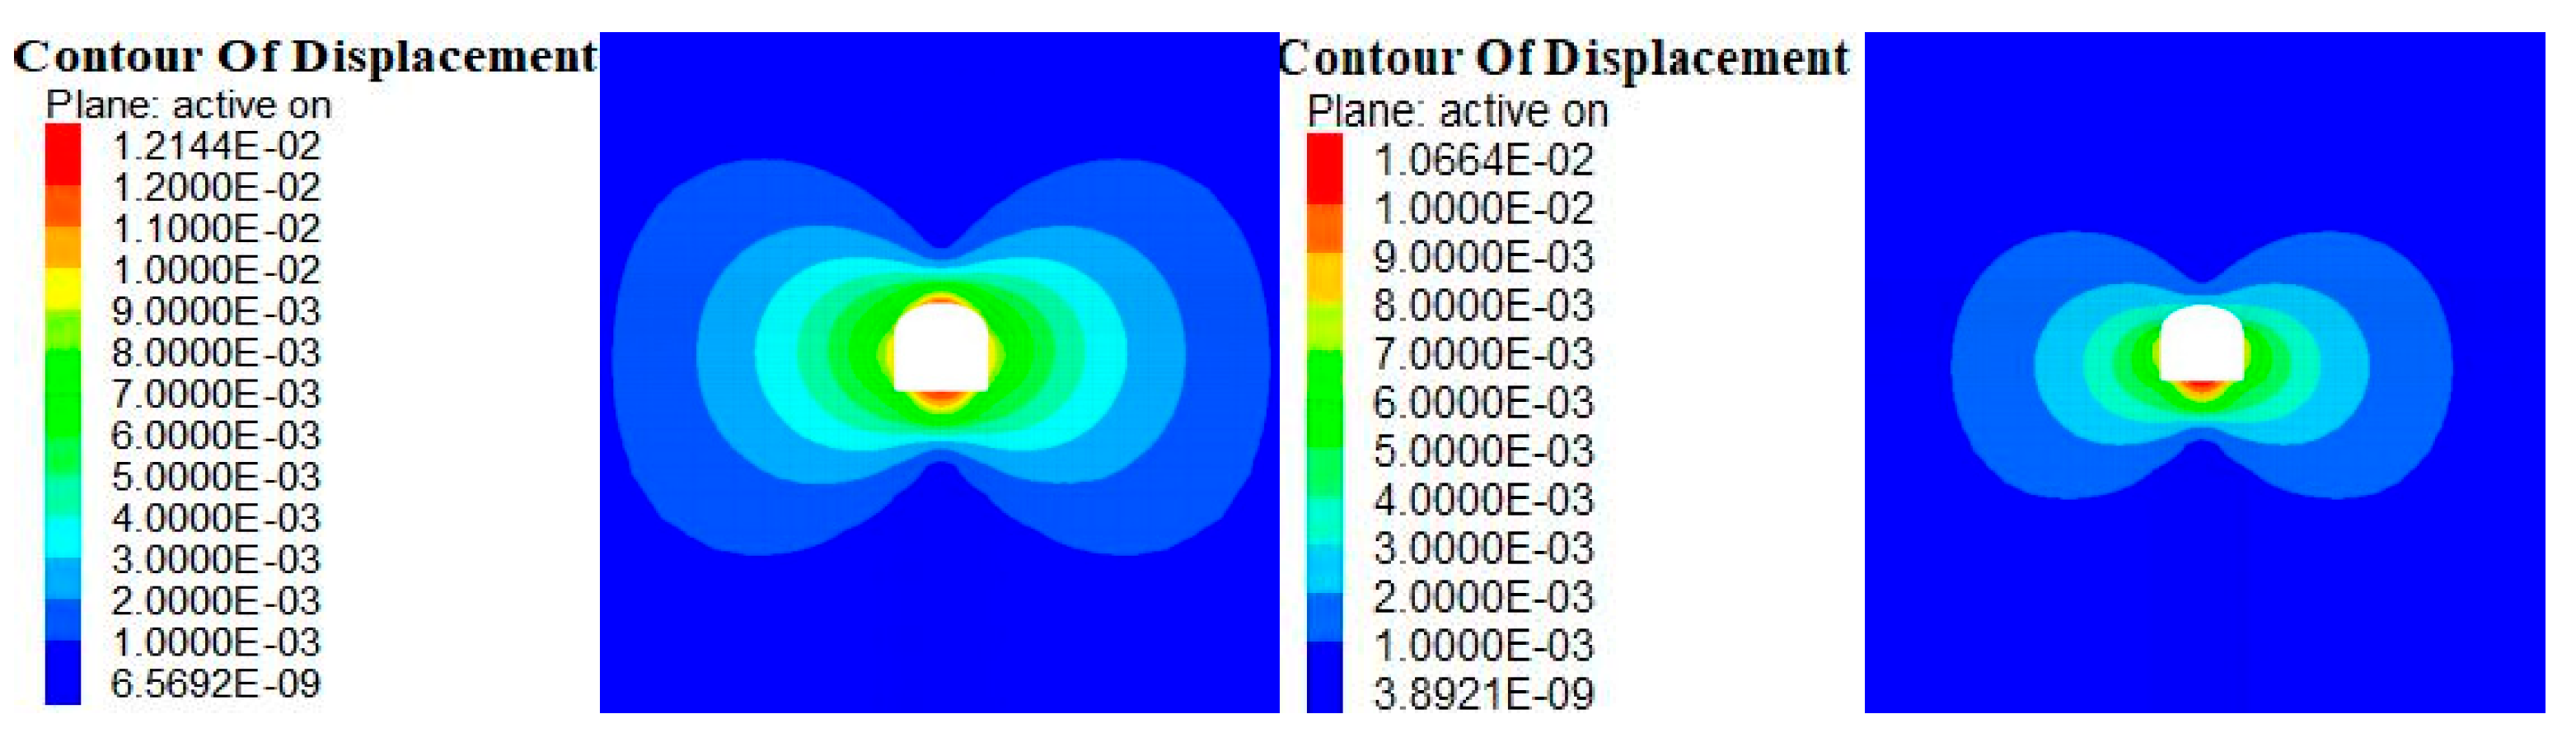
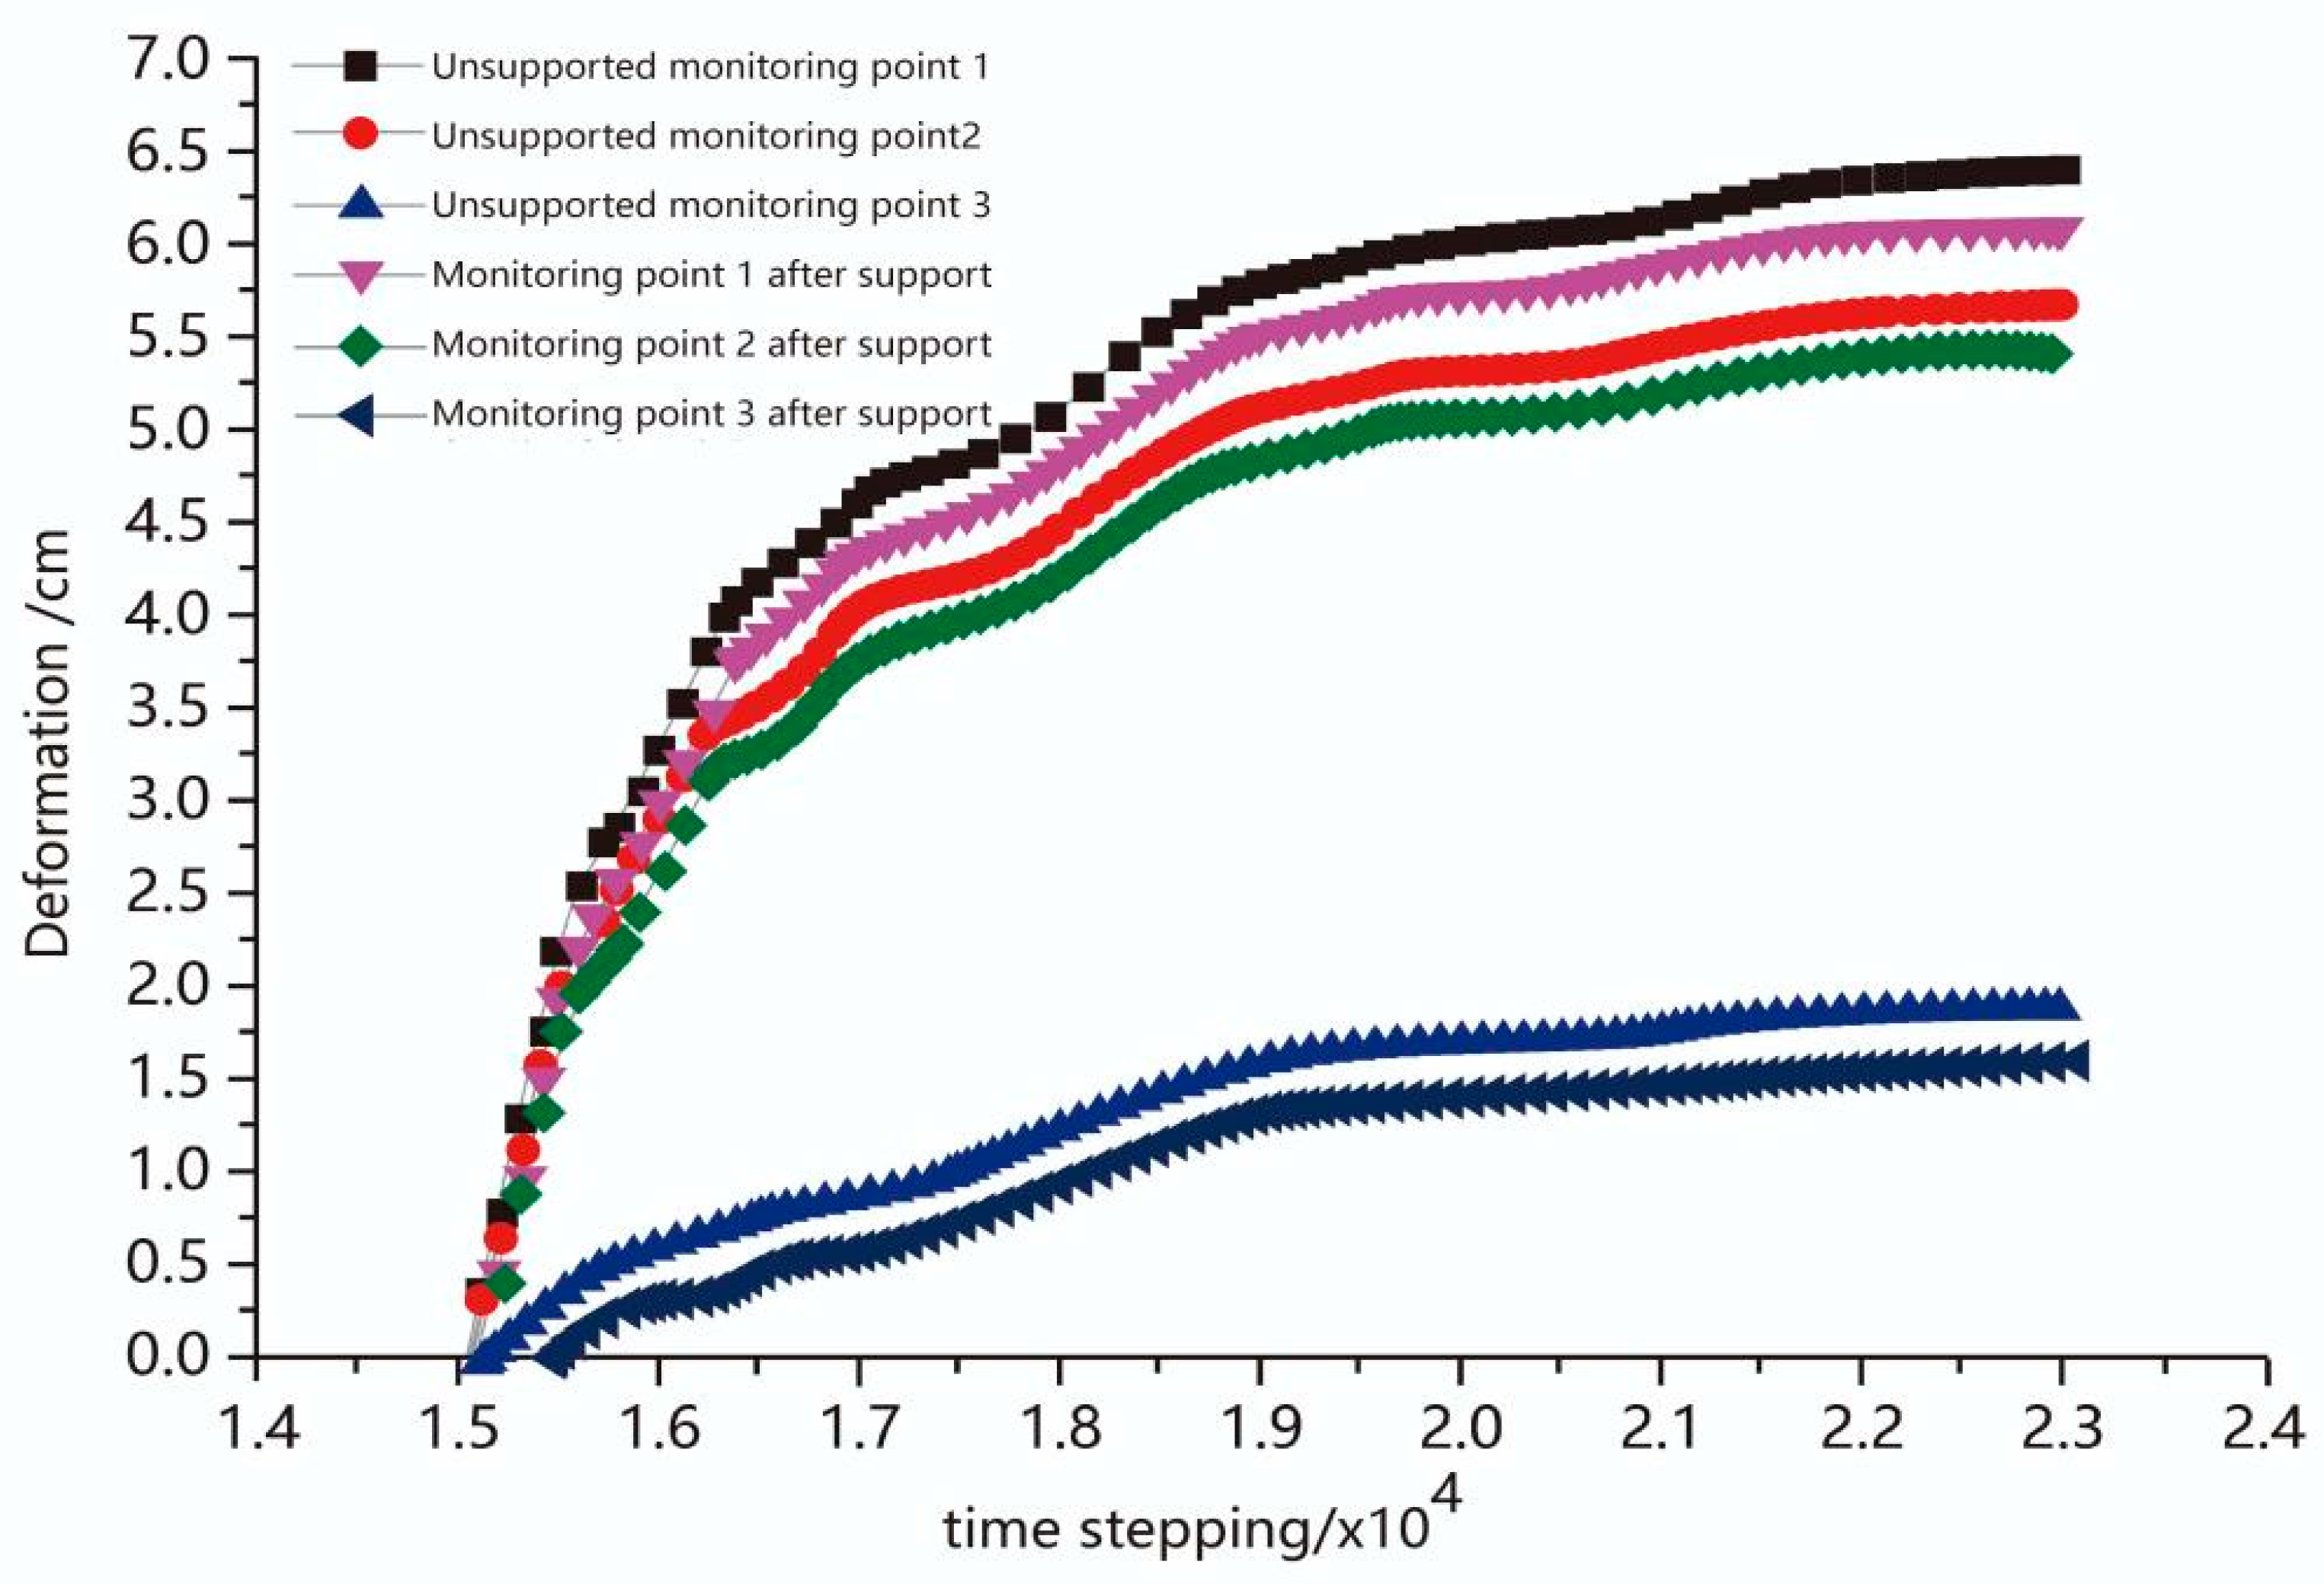
5.3. Analysis of the Deformation of the Roadway Perimeter Rock
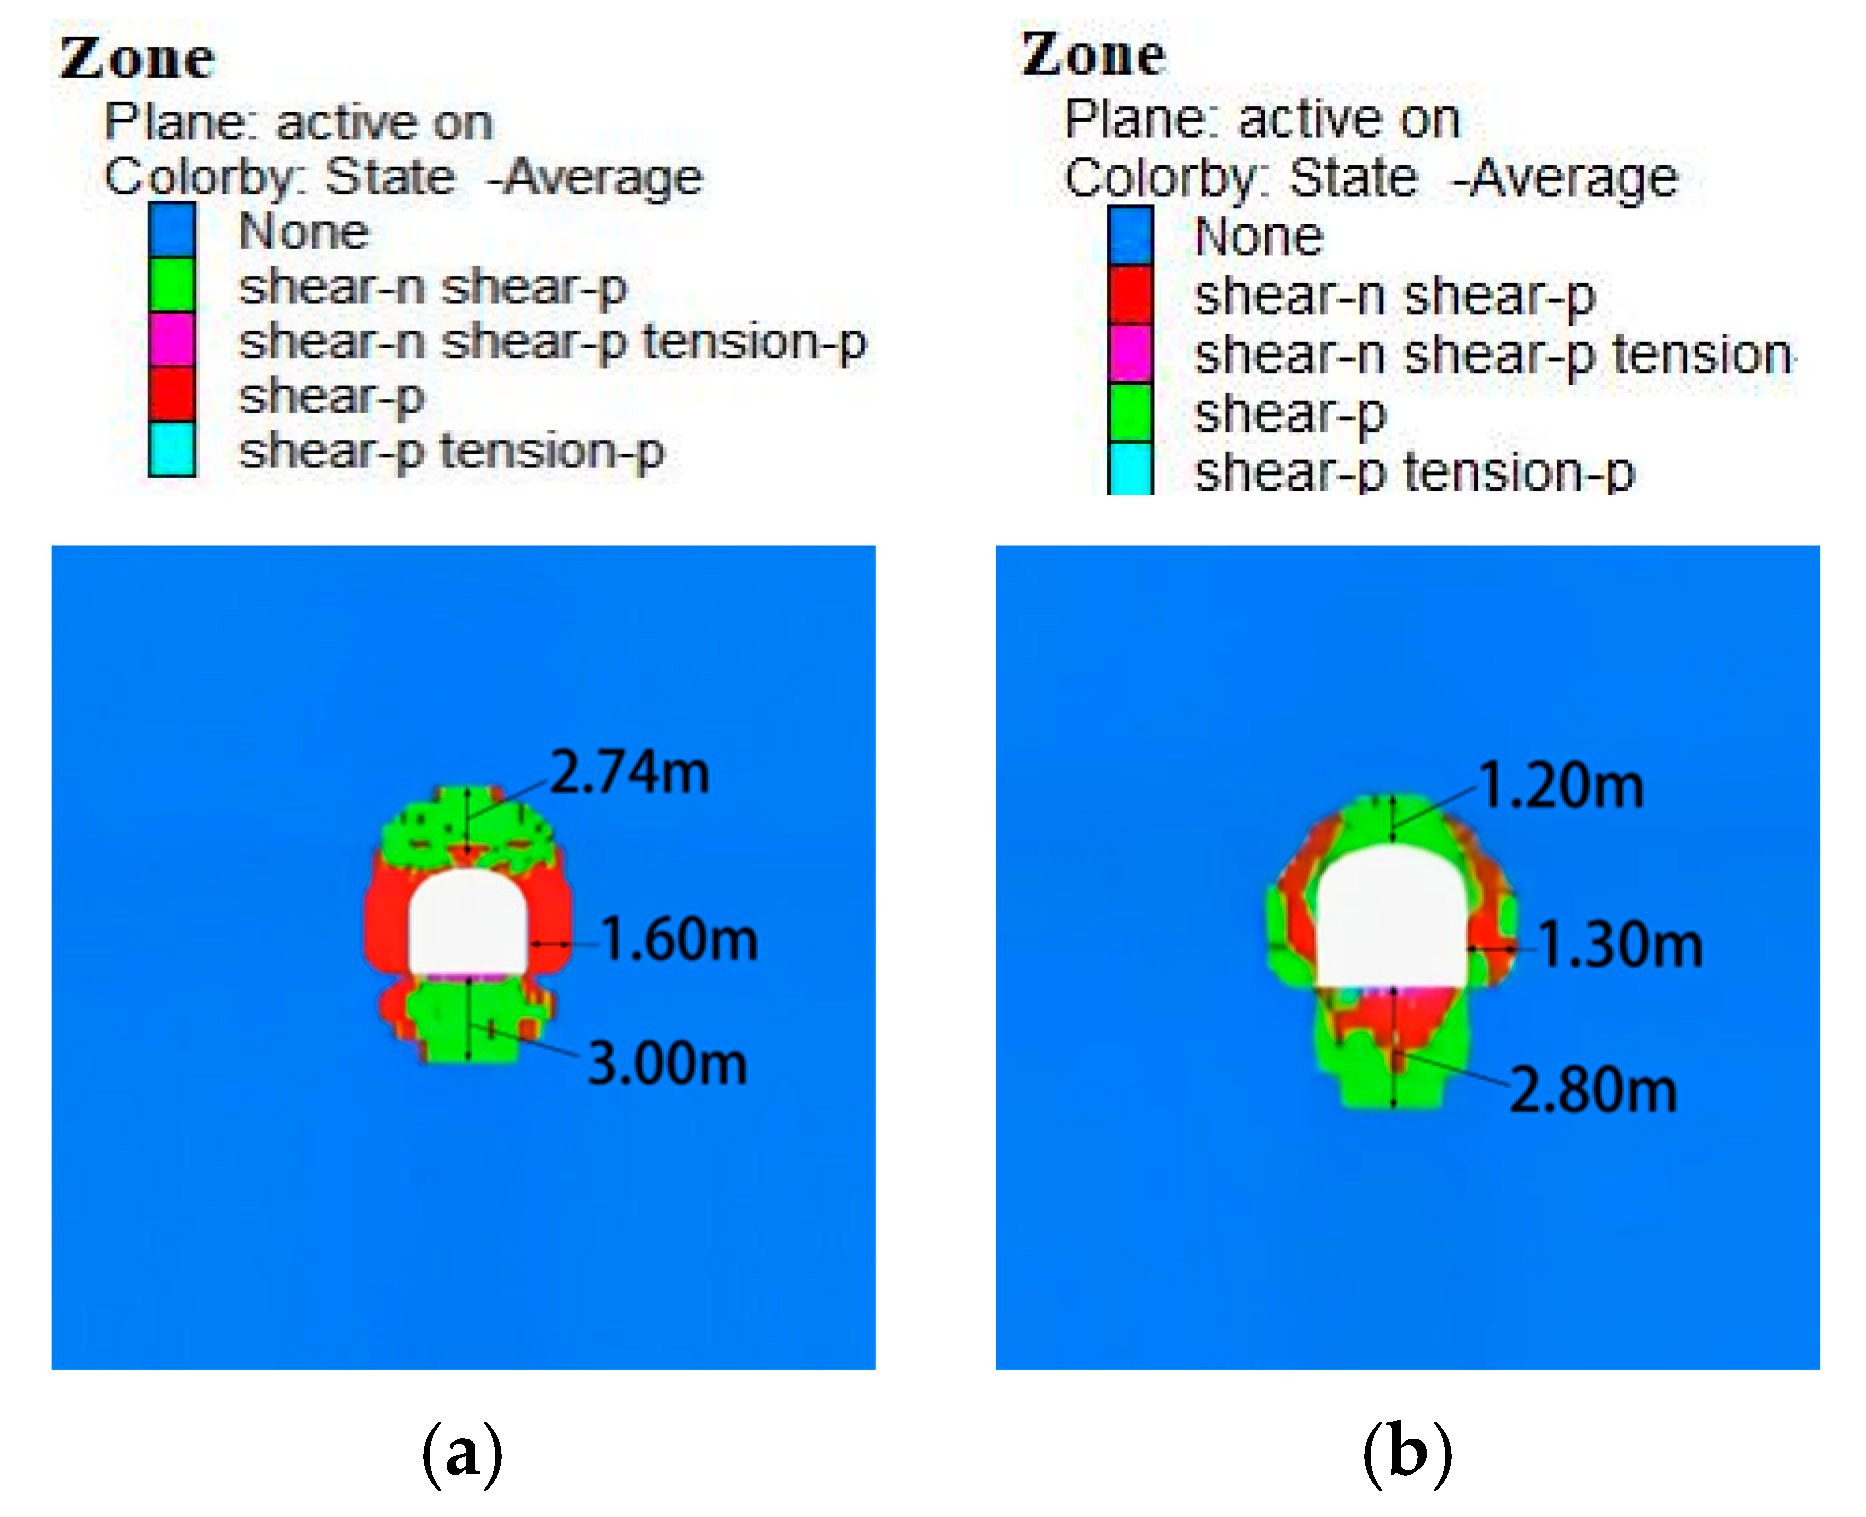
5.4. Analysis of the Damage to the Roadway Perimeter Rock
6. Engineering Applications
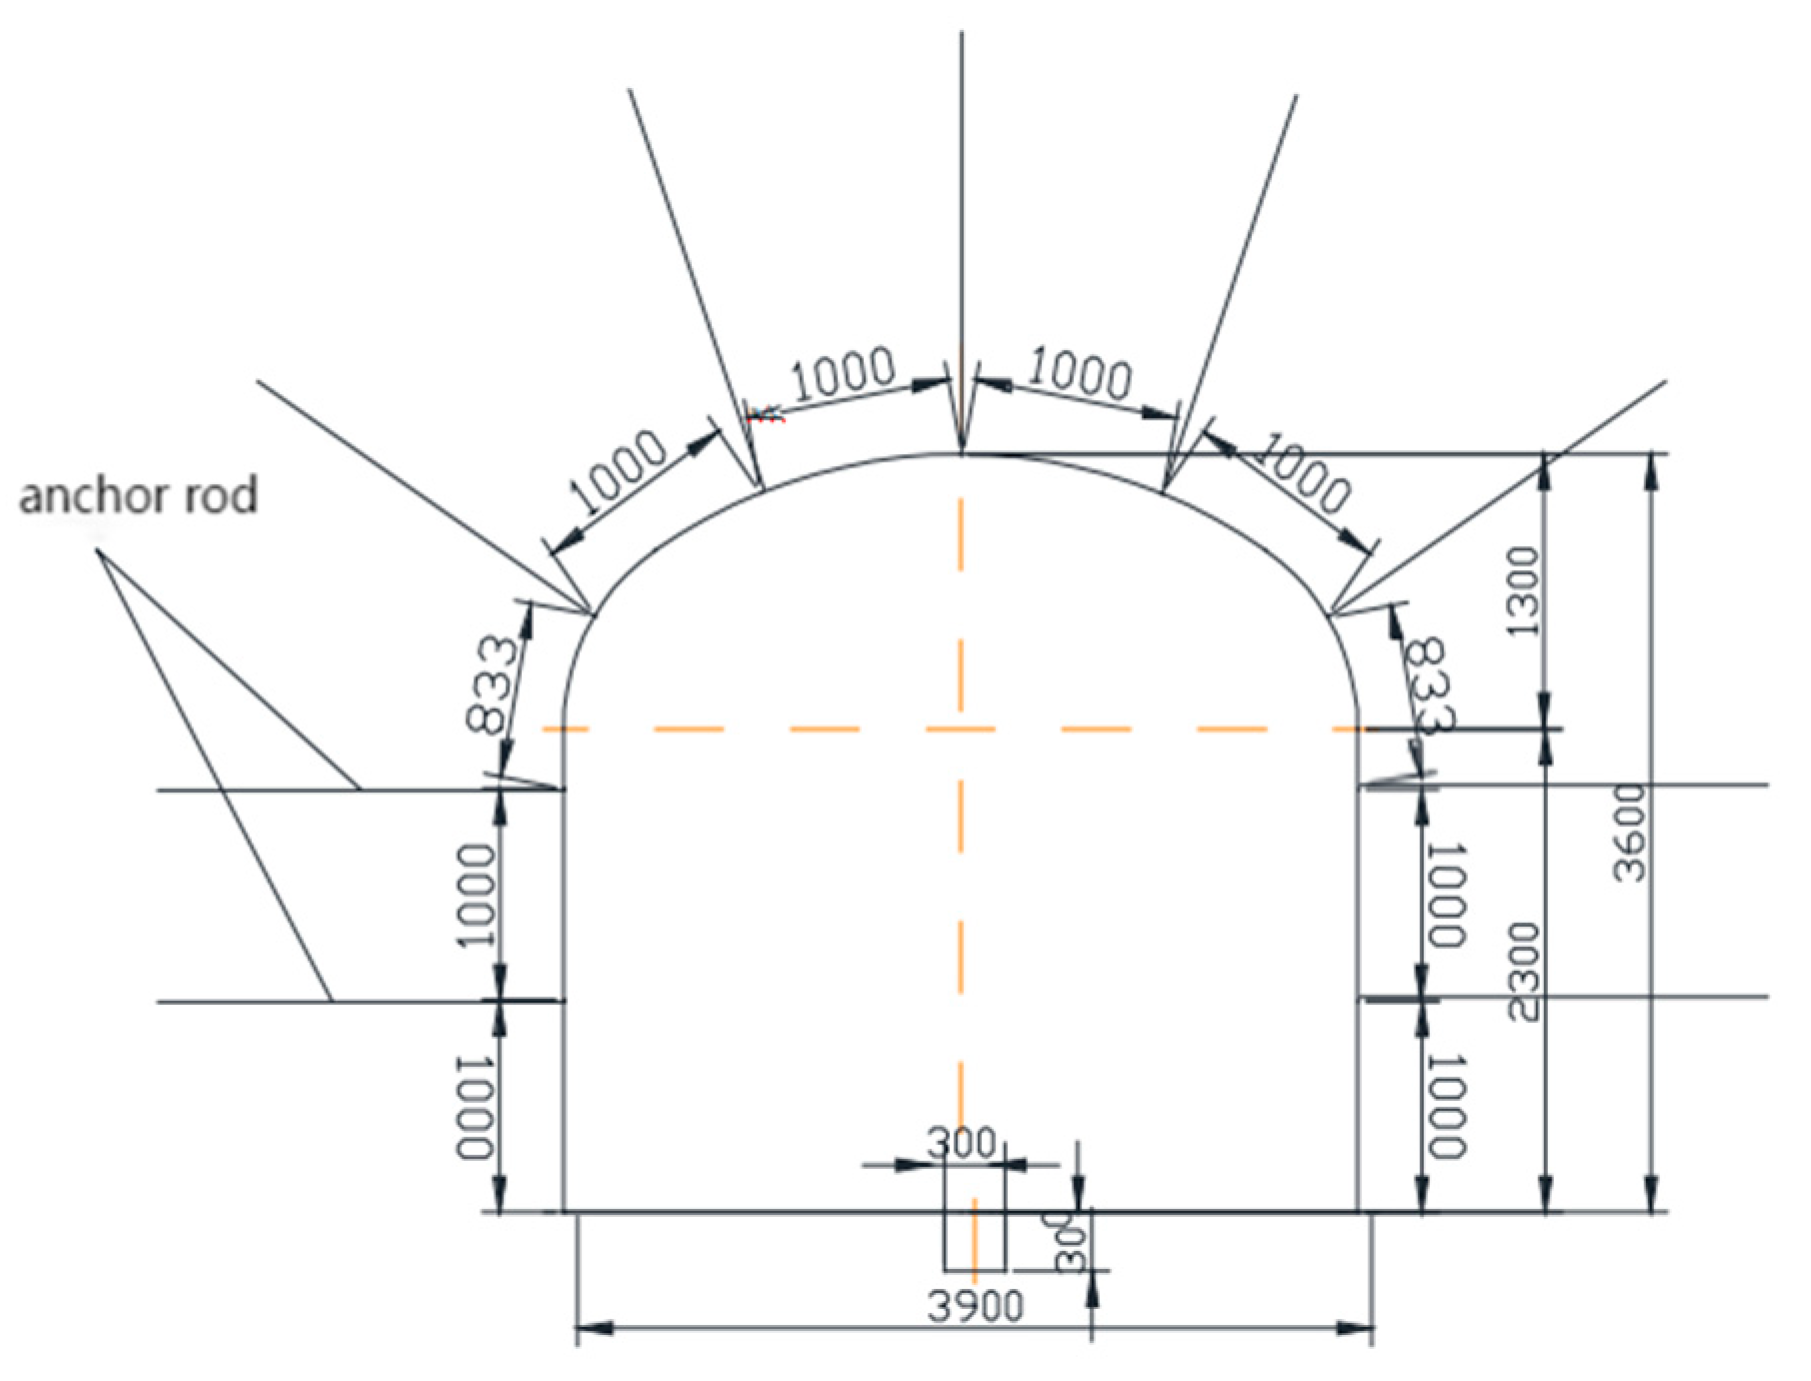
6.1. Rock Support
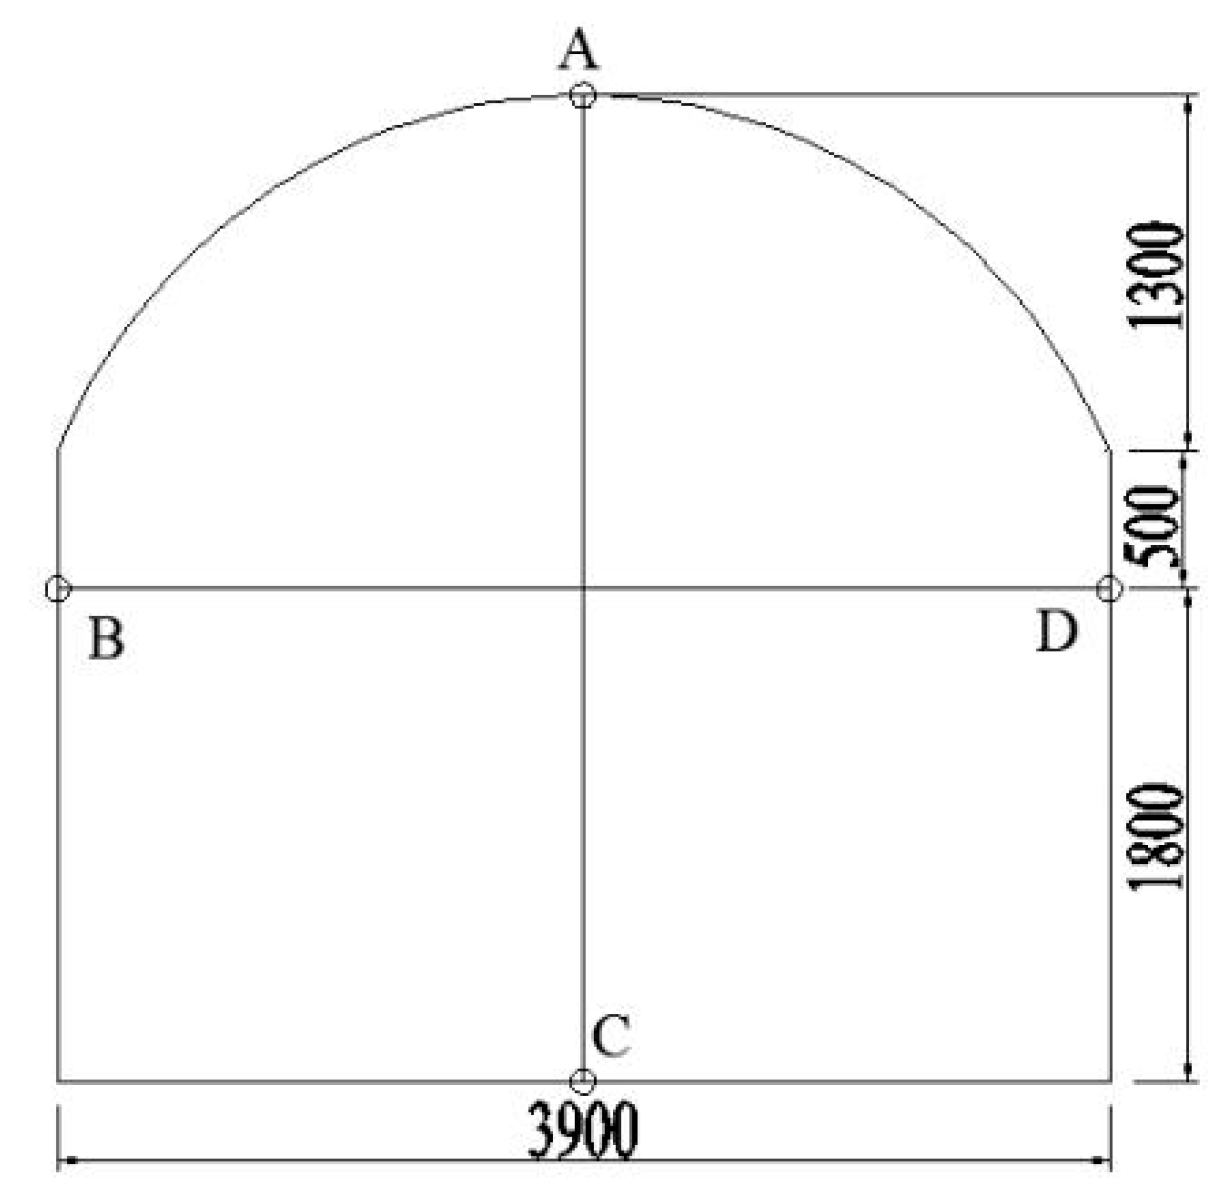
6.2. Monitoring Method of Tunnel Convergence Deformation and Setting of Measuring Point
6.3. Field Analysis and Follow-Up Measures
7. Conclusions
- Based on the loosening zone theory, the quantitative analysis of the support requirements of the surrounding rock of the roadway was conducted, and an optimized scheme of combined support with grouting, anchor rods and mesh was proposed. Through theoretical calculations, key parameters such as the length of anchor rods (2.5–3.0 m), spacing (0.8 × 0.8 m) and thickness of the sprayed layer (120–150 mm) were determined. A quantitative design system for supporting parameters of high-stress roadways was established.
- The support system reduces the maximum principal stress to 14.23 MPa, a decrease of 15.8%, and the vertical stress to 7.74 MPa, a decrease of 24.5%, while weakening the stress concentration and promoting uniform distribution. The increase in minimum principal stress and reduction in the tensile zone indicate the effective suppression of tensile stress, particularly at wall bases.
- After applying the anchor net shotcrete support, roof and gang displacements are reduced by 17.1% and 17.7%, respectively, with consistent 16.9% reductions at 0.6 m and 1.0 m depths. The support system effectively controls both surface and deep deformation, enhancing the overall stability and safety of the roadway.
- After applying anchor net shotcrete support, the plastic zone was significantly reduced: the roof decreased from 2.74 m to 1.20 m, a reduction of 56%; the base plate from 3.00 m to 2.80 m, a reduction of 6.7%; and the gang section from 1.60 m to 1.30 m, a reduction of 19%. These results indicate that the support system effectively enhances the bearing capacity and suppresses plastic deformation, particularly in the roof, thereby improving the tunnel’s long-term stability.
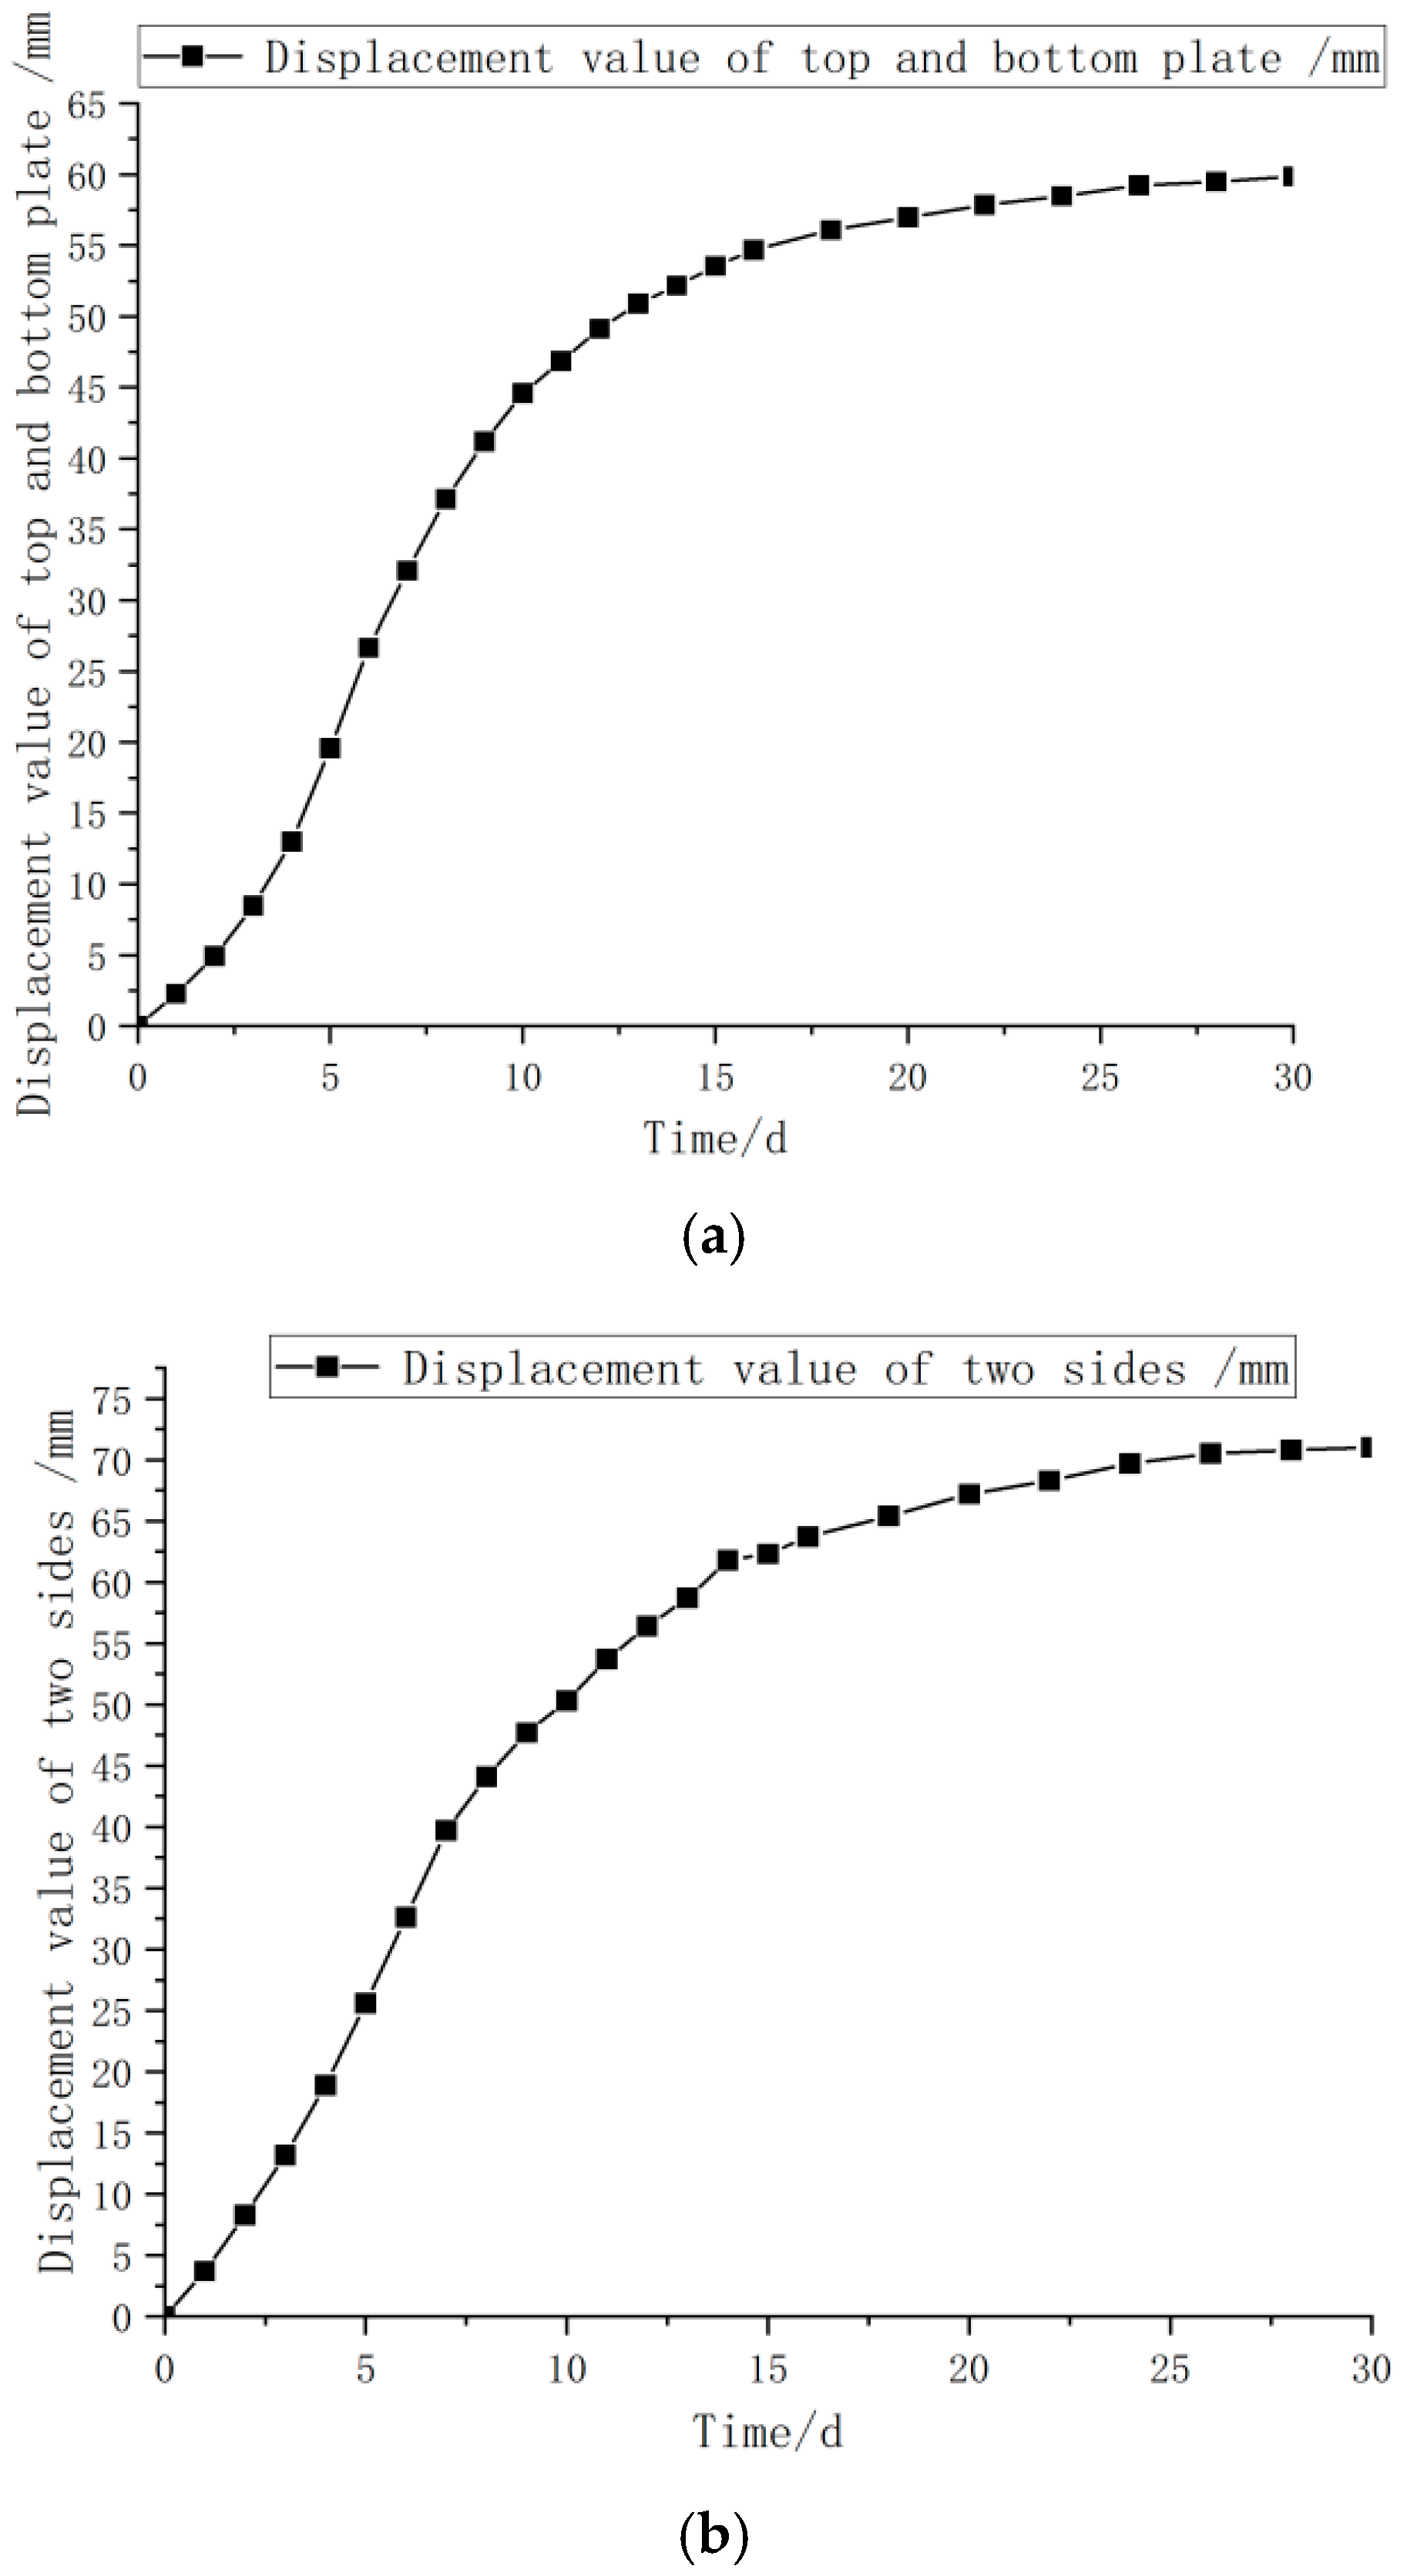
- Displacement monitoring shows that support–rock coupling improves significantly after 10–15 days, leading to stabilized deformation. The relative convergence rates of roof–floor and sidewalls are 1.66% and 1.82%, confirming the support effectiveness and roadway stability. In Makeng Mine, local cracking near blasting points was controlled through timely backfilling, which reduced deformation and prevented spalling. This strategy enhances long-term structural stability and ensures safe mining operations.
- After applying anchor net shotcrete support in Makeng Iron Mine, blasting-induced vibrations caused local cracking of the concrete layer near the blasting point, but no spalling occurred. To address this, the mine adopted a “rapid mining, rapid exit, rapid filling” approach, backfilling hollow areas to reduce surrounding rock deformation, prevent crack propagation, and avoid spalling. Localized shotcrete repairs were applied after filling, restoring structural integrity and ensuring long-term stability. This method significantly improves roadway stability and ensures safe mining operations.
Author Contributions
Funding
Institutional Review Board Statement
Informed Consent Statement
Data Availability Statement
Conflicts of Interest
References
- Hao, Y.; Liu, C.; Wu, Y.; Pu, H.; Chen, Y.; Shen, L.; Li, G. Numerical Modeling on Strain Energy Evolution in Rock System Interaction with Energy-Absorbing Prop and Rock Bolt. Int. J. Min. Sci. Technol. 2023, 33, 1273–1288. [Google Scholar] [CrossRef]
- Jiang, B.; Xin, Z.; Zhang, X.; Deng, Y.; Wang, M.; Li, S.; Ren, W. Mechanical Properties and Influence Mechanism of Confined Concrete Arches in High-Stress Tunnels. Int. J. Min. Sci. Technol. 2023, 33, 829–841. [Google Scholar] [CrossRef]
- Kang, Y.; Geng, Z.; Liu, B.; Chen, J. Study on Gas Extraction Efficiency Using In-Seam Borehole Method Considering Influence of Plastic Zone Induced by Borehole Drilling. Geomech. Energy Environ. 2023, 33, 100426. [Google Scholar] [CrossRef]
- Sharifzadeh, M.; Lou, J.; Crompton, B. Dynamic Performance of Energy-Absorbing Rockbolts Based on Laboratory Test Results. Part I: Evolution, Deformation Mechanisms, Dynamic Performance and Classification. Tunn. Undergr. Space Technol. 2020, 105, 103510. [Google Scholar] [CrossRef]
- Zhang, Z.; Deng, M.; Bai, J.; Yan, S.; Yu, X. Stability Control of Gob-Side Entry Retained under the Gob with Close Distance Coal Seams. Int. J. Min. Sci. Technol. 2021, 31, 321–332. [Google Scholar] [CrossRef]
- Zuo, J.; Wen, J.; Liu, D.; Wu, L.; Sun, Y. Control Theory of Uniform Strength Support in Deep Roadway. J. Min. Sci. Technol. 2021, 6, 148–159. [Google Scholar] [CrossRef]
- Shen, B. Coal mine roadway stability in soft rock: A case study. Rock Mech. Rock Eng. 2014, 47, 2225–2238. [Google Scholar] [CrossRef]
- Li, H.; Lin, B.; Hong, Y.; Gao, Y.; Yang, W.; Liu, T.; Huang, Z. Effects of in-situ stress on the stability of a roadway excavated through a coal seam. Int. J. Min. Sci. Technol. 2017, 27, 917–927. [Google Scholar] [CrossRef]
- Farmer, I.W. Stress Distribution along a Resin Grouted Rock Anchor. Int. J. Rock Mech. Min. Sci. Geomech. Abstr. 1975, 12, 347–351. [Google Scholar] [CrossRef]
- Cai, M.; He, M.; Liu, D. Rock Mechanics and Engineering; Science and Technology Press: Beijing, China, 2002. [Google Scholar]
- Hoek, E.; Carranza-Torres, C.; Corkum, B. Hoek-Brown Failure Criterion-2002 Edition. Proc. NARMS-Tac 2002, 1, 267–273. [Google Scholar]
- Gao, M.-s.; Zhang, N.; Dou, L.-m.; Wang, K.; Kan, J.-g. Study of Roadway Support Parameters Subjected to Rock Burst Based on Energy Balance Theory. Zhongguo Kuangye Daxue Xuebao 2007, 36, 426–430. [Google Scholar]
- Aydan, Ö. Rock Mechanics and Rock Engineering: Volume 2: Applications of Rock Mechanics-Rock Engineering; CRC Press: Boca Raton, FL, USA, 2019. [Google Scholar]
- Hashemi, M.; Moghaddas, S.; Ajalloeian, R. Application of Rock Mass Characterization for Determining the Mechanical Properties of Rock Mass: A Comparative Study. Rock Mech. Rock Eng. 2010, 43, 305–320. [Google Scholar] [CrossRef]
- Kang, H.; Wang, J.; Lin, J. Case Studies of Rock Bolting in Coal Mine Roadways. Yanshilixue Yu Gongcheng Xuebao 2010, 29, 649–664. [Google Scholar]
- Jia, H.; Wang, H. Principle and Application of the Double Cacheable and Gradually Deformable Supporting Shells for Soft Rock Tunneling. Rock Soil Mech. 2015, 36, 1119–1126. [Google Scholar]

| Observation Point | Mining Depth (m) | Maximum Principal Stress σ1 | Intermediate Principal Stress σ2 | Minimum Principal Stress σ3 | ||||||
|---|---|---|---|---|---|---|---|---|---|---|
| Numerical Value (MPa) | Orientations (°) | Tilt (°) | Numerical Value (MPa) | Orientations (°) | Tilt (°) | Numerical Value (MPa) | Orientations (°) | Tilt (°) | ||
| 160 m level | 510 | 17.46 | 211.5 | 30.8 | 16.53 | −56.8 | 2.7 | 13.49 | 217.7 | −59 |
| 115 m level | 555 | 24.59 | 250.4 | 0.7 | 20.57 | −19.2 | 18.7 | 15.27 | 158.2 | 71.2 |
| 90 m level | 580 | 30.22 | 229.3 | 1.2 | 16.55 | −29.2 | 83.8 | 14.00 | 139.1 | 6.0 |
| 18 m level | 652 | 31.33 | 224.9 | 7.0 | 21.86 | −41.2 | 27.8 | 18.04 | 121.9 | 61.1 |
| Observation Point | Mining Depth (m) | Test Site | Stress Component (MPa) | ||
|---|---|---|---|---|---|
| σx | σy | σz | |||
| 160 m level | 510 | 74# Line Transportation Lane | 16.41 | 16.52 | 14.54 |
| 115 m level | 555 | 74# North Transportation Lane | 20.06 | 20.55 | 15.82 |
| 90 m level | 580 | 74# Line Transportation Lane | 23.33 | 20.91 | 16.52 |
| 18 m level | 652 | 75# Line North Transportation Lane | 25.88 | 26.28 | 19.08 |
| Hole Number | Position | Rockiness | Depth of Hole (m) | Effective Hole Distance (m) | Average Speed of Sound (m/s) | Rock Average Sound Velocity (m/s) | Note |
|---|---|---|---|---|---|---|---|
| 1 | 85 level 24# transverse drift | ore body | 10 | 0.8~4 | 3254 | 3624 | vertical hole |
| 2 | 115 level 28# transverse drift | ore body | 7 | 0.8~4 | 3977 | \ | |
| 3 | 145 level 28# transverse drift | ore body | 6 | 0.8~4 | 3645 | \ |
| Grouping Name | Soil Natural Density (g/cm−3) | Elasticity Modulus (GPa) | Poisson’s Ratio | Cohesive Force (MPa) | Internal Friction Angle (°) |
|---|---|---|---|---|---|
| Marbled limestone | 2.69 | 41.51 | 0.27 | 18.28 | 41.89 |
| mine | 3.82 | 47.70 | 0.27 | 27.65 | 47.88 |
| Quartzized limestone | 2.54 | 36.83 | 0.28 | 27.14 | 41.05 |
| Parameter | Density (g/cm−3) | Elasticity Modulus (GPa) | Poisson’s Ratio |
|---|---|---|---|
| lining concrete | 2.50 | 28.00 | 0.27 |
| Anchor bolt | 7.80 | 210.00 | 0.30 |
| Displacement Value of Top and Bottom Plate (mm) | The Displacement Value of the Two Sides (mm) | Top and Bottom Relative Convergence Rate (%) | Relative Convergence Rate (%) |
|---|---|---|---|
| 59.85 | 71.00 | 1.66 | 1.82 |
Disclaimer/Publisher’s Note: The statements, opinions and data contained in all publications are solely those of the individual author(s) and contributor(s) and not of MDPI and/or the editor(s). MDPI and/or the editor(s) disclaim responsibility for any injury to people or property resulting from any ideas, methods, instructions or products referred to in the content. |
© 2025 by the authors. Licensee MDPI, Basel, Switzerland. This article is an open access article distributed under the terms and conditions of the Creative Commons Attribution (CC BY) license (https://creativecommons.org/licenses/by/4.0/).
Share and Cite
Zhang, L.; Deng, Z.; Li, G. Application of Pipe Slit Anchor Mesh Spraying Supporting Technology Based on Loose Circle Supporting Theory in Makeng Iron Ore Mine. Appl. Sci. 2025, 15, 5537. https://doi.org/10.3390/app15105537
Zhang L, Deng Z, Li G. Application of Pipe Slit Anchor Mesh Spraying Supporting Technology Based on Loose Circle Supporting Theory in Makeng Iron Ore Mine. Applied Sciences. 2025; 15(10):5537. https://doi.org/10.3390/app15105537
Chicago/Turabian StyleZhang, Lixin, Zehui Deng, and Gang Li. 2025. "Application of Pipe Slit Anchor Mesh Spraying Supporting Technology Based on Loose Circle Supporting Theory in Makeng Iron Ore Mine" Applied Sciences 15, no. 10: 5537. https://doi.org/10.3390/app15105537
APA StyleZhang, L., Deng, Z., & Li, G. (2025). Application of Pipe Slit Anchor Mesh Spraying Supporting Technology Based on Loose Circle Supporting Theory in Makeng Iron Ore Mine. Applied Sciences, 15(10), 5537. https://doi.org/10.3390/app15105537