Article

Hydrogen Purification Performance of Pressure Swing Adsorption in Coal-Derived Activated Carbon/Zeolite 13X Layered Bed

1
School of Automotive Engineering, Wuhan University of Technology, Wuhan 430070, China
2
Automobile Technology and Service College, Wuhan City Polytechnic, Wuhan 430064, China
3
State Key Laboratory of Maritime Technology and Safety, Wuhan University of Technology, Wuhan 430063, China
4
School of Transportation and Logistics Engineering, Wuhan University of Technology, Wuhan 430063, China
5
Institute of Thermal Science and Technology, Shandong University, Jinan 250061, China
*
Authors to whom correspondence should be addressed.
Appl. Sci. 2025, 15(10), 5505; https://doi.org/10.3390/app15105505
Submission received: 15 April 2025 / Revised: 10 May 2025 / Accepted: 13 May 2025 / Published: 14 May 2025
(This article belongs to the Special Issue Production, Storage and Utilization of Hydrogen Energy)

Abstract

:
The large-scale production of high-purity hydrogen via pressure swing adsorption (PSA) remains a prominent research focus. This study develops a multi-component heat and mass transfer model for a lean hydrogen mixture (N2/CO2/H2/CO = 44.6/35.4/19.9/0.1 mol%) on a coal-derived activated carbon (AC)/zeolite 13X layered bed to investigate its breakthrough curve and PSA purification performance. The model is implemented on the Aspen Adsorption platform and validated with published data. Parametric analysis of the breakthrough curve reveals that a high pressure and a low feed flow rate can delay the breakthrough of impurity gases. The simulated variations in pressure, purity, and recovery during the PSA cycle align with the published results. Studies on PSA cycle parameters show that, in general, a high pressure, a low feed flow rate, a short adsorption time, and a high P/F ratio improve purity but reduce recovery. The purity and recovery of the layered bed outperform those of the single-layer bed. Specifically, gradually modifying the AC/zeolite 13X length ratio from 10:0 to 5:5 enhances hydrogen purity, while adjusting it from 10:0 to 3:7 enhances hydrogen recovery. At AC/zeolite 13X = 5:5, the highest purity was 97.38%, while at AC/zeolite 13X = 3:7, the highest recovery was 49.13%.

1. Introduction

Hydrogen energy represents a promising solution for improving energy efficiency and advancing the use of clean energy. Due to the limited availability and environmental drawbacks of fossil fuels, hydrogen fuel cells have gained increasing attention as a sustainable power source. The operation of fuel cells requires a continuous supply of high-purity hydrogen gas. Industrially, hydrogen is predominantly produced through large-scale processes such as petroleum cracking, methane reforming, and coke oven gas utilization [1,2,3]. However, the hydrogen generated by these methods often contains impurities that do not meet the stringent purity standards required for fuel cell applications [4]. The impurity gas CO can poison metal catalysts within fuel cells, significantly impairing their catalytic performance [5]. Therefore, additional separation and purification steps are essential to ensure hydrogen purity.
Adsorption technology has become a widely adopted method for gas separation due to its advantages, including low cost, high efficiency, operational simplicity, and environmental friendliness. Based on this, pressure swing adsorption (PSA) is extensively employed to produce high-purity hydrogen. A substantial body of research has focused on utilizing PSA technology to achieve hydrogen with high purity [6,7,8,9]. Zafanelli investigated three different vacuum pressure swing adsorption (VPSA) systems for extracting hydrogen from compressed natural gas (CNG) and achieved a hydrogen purity of 68% [10]. The VPSA process enables the efficient concentration of H2 from an initial level of 20% to 68%, with a recovery of up to 92%.
Tail gas is commonly used as a combustion fuel in hydrogen production processes. However, this gas mixture, which contains a small amount of hydrogen, can also be purified and recycled. Recent studies have demonstrated that the recovery and purification of such mixtures are economically viable [11]. Lean hydrogen mixtures are typically derived from various industrial off-gases and contain hydrogen at concentrations of 13% to 24%. These mixtures may also include impurity gases such as CO2, N2, CO, and CH4.
Such multi-component gases often exhibit complex competitive adsorption behavior on adsorption beds, which is described by breakthrough curves. The formation of breakthrough curves and their temporal changes are closely linked to adsorption isotherms, gas diffusion rates, and adsorption bed parameters. The breakthrough time of different gases reflects the adsorption selectivity of the adsorbents for specific components, as well as the efficiency of the adsorption bed. Researchers have also investigated the impact of various parameters on the breakthrough curve, which can further inform the optimization of PSA performance [12,13,14]. Xiao’s study of the breakthrough curves for H2/CH4/CO2 on CuBTC revealed that a higher feed flow rate led to earlier breakthrough, and increased adsorption pressure resulted in a delayed breakthrough [15].
As the core part of PSA, the direct performance of adsorbents in removing impurity gases (purity and recovery) has been widely studied. Adsorbents are usually porous materials, including activated carbons, zeolites, and MOFs [16,17,18]. Jose used CaX zeolite to purify hydrogen from nitrogen-rich off-gas, obtaining hydrogen with a purity higher than 99.7% and a recovery of over 65% [19]. Additionally, some researchers have also proposed the use of layered beds for the PSA process, achieving good results [4,20,21]. At the same time, researchers have continuously optimized the operating conditions and other parameters in the PSA process to explore more satisfactory results. Zhang investigated the PSA process for a gas mixture with a composition of H2/CH4/CO/N2/CO2 = 56.4/26.6/8.4/5.5/3.1 mol% on a layered bed consisting of activated carbon and zeolite 5A and employed the Box–Behnken design method to optimize the PSA process [22]. They also discovered that a higher P/F ratio and a longer pressure equalization time are conducive to the enhancement of hydrogen purity. Therefore, it is necessary to provide guidelines for optimizing the actual PSA performance through simulation, improving the efficiency and economy of the entire process.
Activated carbon is a widely utilized adsorbent material for hydrogen purification through PSA technology. Coal-derived activated carbon (AC) is the most primitive activated carbon, with a wide range of sources and affordable prices. Zeolites, particularly valued for their high CO2 adsorption capacity, are also extensively studied and commonly used in layered bed configurations with activated carbons for improving PSA hydrogen purification efficiency [23]. In this study, an adsorption dynamic model is developed for a lean hydrogen mixture (N2/CO2/H2/CO = 44.6/35.4/19.9/0.1 mol%) on a coal-derived activated carbon/zeolite 13X layered bed using adsorption isotherm experimental data. Additionally, the simulation results of breakthrough curves for both single and layered beds are compared with published data, validating the model’s accuracy. This study also examines the effects of the feed pressure, feed flow rate, and AC/zeolite 13X ratio on the dynamic separation behavior on the layered bed. Based on these results, a dual-bed, six-step pressure swing adsorption cycle model is established. The accuracy of this cycle model is validated using purity and recovery as indicators of hydrogen purification performance. Finally, the impacts of various parameters, the feed pressure, feed flow rate, adsorption time, P/F ratio and AC/zeolite 13X ratio, on hydrogen purification performance are investigated.

2. Mathematical Modeling

This section develops a mathematical model to investigate the PSA process. The mathematical model includes mass, momentum, energy balance equations, adsorption isotherms, and kinetics. Meanwhile, the mathematical model is based on the following assumptions:
(1)
The ideal gas law is applicable.
(2)
An axially dispersed plug flow model is used to describe the flow pattern.
(3)
Radial variations in temperature, pressure, concentration, and velocity are negligible.
(4)
The inter-phase mass transfer coefficient is expressed using the linear driving force (LDF) model.
(5)
The aging of adsorbents is not considered.

2.1. Mass Conservation Equation

The mass conservation of the adsorption bed is shown by the following equation [23]:
ε b c i t + v g c i z = D L ε b 2 c i z 2 ρ p 1 ε b q i t
where ε b is the bed porosity; c i is the volume molarity of component ‘ i ’; v g is the Darcy velocity of gas; D L is the axial dispersion coefficient; ρ p is the bed density; q i is the dynamic adsorption amount; and t and z are the axial time and position of the bed, respectively.

2.2. Energy Conservation Equation

The energy conservation in the adsorption bed is shown by the following equation [24]:
ε t ρ g C p g T g t + ρ g C p g v g T g z = ε b K g 2 T g z 2 P v g z + a p h g s T s T g + 4 h i n d b T w T g
where ε t is the total porosity; ρ g is the gas density; C p g is the specific heat capacity of the gas; T g is the temperature of the gas; K g is the axial thermal conductivity of the gas; P is the pressure; a p is the specific surface area of the adsorbent; h g s is the heat transfer coefficient between the gas and solid; T s is the temperature of the solid; h i n is the heat transfer coefficient between the gas and wall; d b is the inside diameter of the bed; and T w is the temperature of the wall.
The principle of energy conservation is applied to the solid phase of the adsorption bed:
ρ b C p s T s t + ρ b j = 1 N C p a j q j T s t = K s 2 T s z 2 + ρ b j = 1 N H a d s , j q j t + a p h g s T g T s
where ρ b is the bulk density of the adsorbent; C p s is the heat capacity of the solid; C p a is the heat capacity of the adsorbed phase; K s is the thermal conductivity of the solid; and H a d s is the isosteric adsorption enthalpy.
The energy conservation relationship on the wall of the adsorption bed is [24]:
ρ w C p w T w t = K w 2 T w z 2 + 4 d b h i n T g T w + 4 d b + 2 δ w h o u t T a m b T w d b + 2 δ w 2 d b 2
where ρ w is the wall density; C p w is the heat capacity of the wall; K w is the thermal conductivity of the wall; h i n is the heat transfer coefficient between the gas and wall; δ w is the thickness of the wall; h o u t is the heat transfer coefficient between the wall and environment; and T a m b is the ambient temperature.

2.3. Momentum Conservation Equation

Considering the pressure drop within the bed, the Ergun equation is employed to describe the momentum conservation relationship [24]:
d P d z = 1.5 × 10 3 1 ε b 2 ( 2 R p ) 2 ε b 3 μ v g + 1.75 × 10 5 ρ g 1 ε b 2 R p ε b 3 v g 2
where μ is the dynamic viscosity, and R p is the particle radius.

2.4. Adsorption Isotherms and Kinetics

The extended temperature-dependent dual-site Langmuir (TD DSL) model described by Equations (6)–(10) is used to express the adsorption isotherms of AC and zeolite 13X [25]. Meanwhile, the adsorption kinetics is presented by the LDF model in Equation (11).
q i * = q m 1 , i b 1 , i p i 1 + j = 1 N b 1 , j p j + q m 2 , i b 2 , i p i 1 + j = 1 N b 2 , j p j , i = 1,2 , , N
q m 1 = k 1
b 1 = k 2 exp k 3 T
q m 2 = k 4
b 2 = k 5 exp k 6 T
q i t = w i q i * q i , i = 1,2 , , N
where q i * is the equilibrium adsorption amount; q m 1 , i , b 1 , i , q m 2 , i , and b 2 , i are the DSL isotherm parameters for component ‘ i ’; k 1 to k 6 are the TD DSL isotherm parameters; and w i is the LDF coefficient.

2.5. Ideal Gas Equation of State

The ideal gas equation of state is used to express the physical properties of gases:
c i = y i P R T
where y i is the molar fraction of component ‘ i ’, and R is the universal gas constant.

3. Validation

3.1. Validation of Adsorption Isotherms

The adsorption isotherms and isosteric enthalpy of adsorption of CO2, N2, H2, and CO are shown in Table 1. The TD DSL model is used to fit the experimental isotherms taken from Refs. [26,27]. It should be noted that only data within the partial pressure range of each component are used for fitting to improve the accuracy of subsequent simulations. The experimental data were obtained at 293 K, 308 K, and 323 K. From Figure 1, it can be observed that the TD DSL model shows a good fit. Both low temperature and high pressure can increase the adsorption amount. On AC and zeolite 13X, there is an order of adsorption amount: CO2 > CO > N2 > H2. The adsorption amount of N2 and H2 on AC is higher than that on zeolite 13X, whereas the adsorption amount of CO2 and CO on zeolite 13X exceeds that on AC. It is worth noting that as the pressure increases, CO2 on zeolite 13X tends to reach adsorption saturation, while this is not the case for AC. This indicates the strong adsorption affinity of zeolite 13X for CO2. Considering the desorption in the subsequent PSA process, there may be difficulty in the regeneration of zeolite 13X, resulting in a loss of the adsorbents’ working capacity. Therefore, in the layered bed, AC is employed to remove CO2, while zeolite 13X primarily serves to remove N2 and CO.

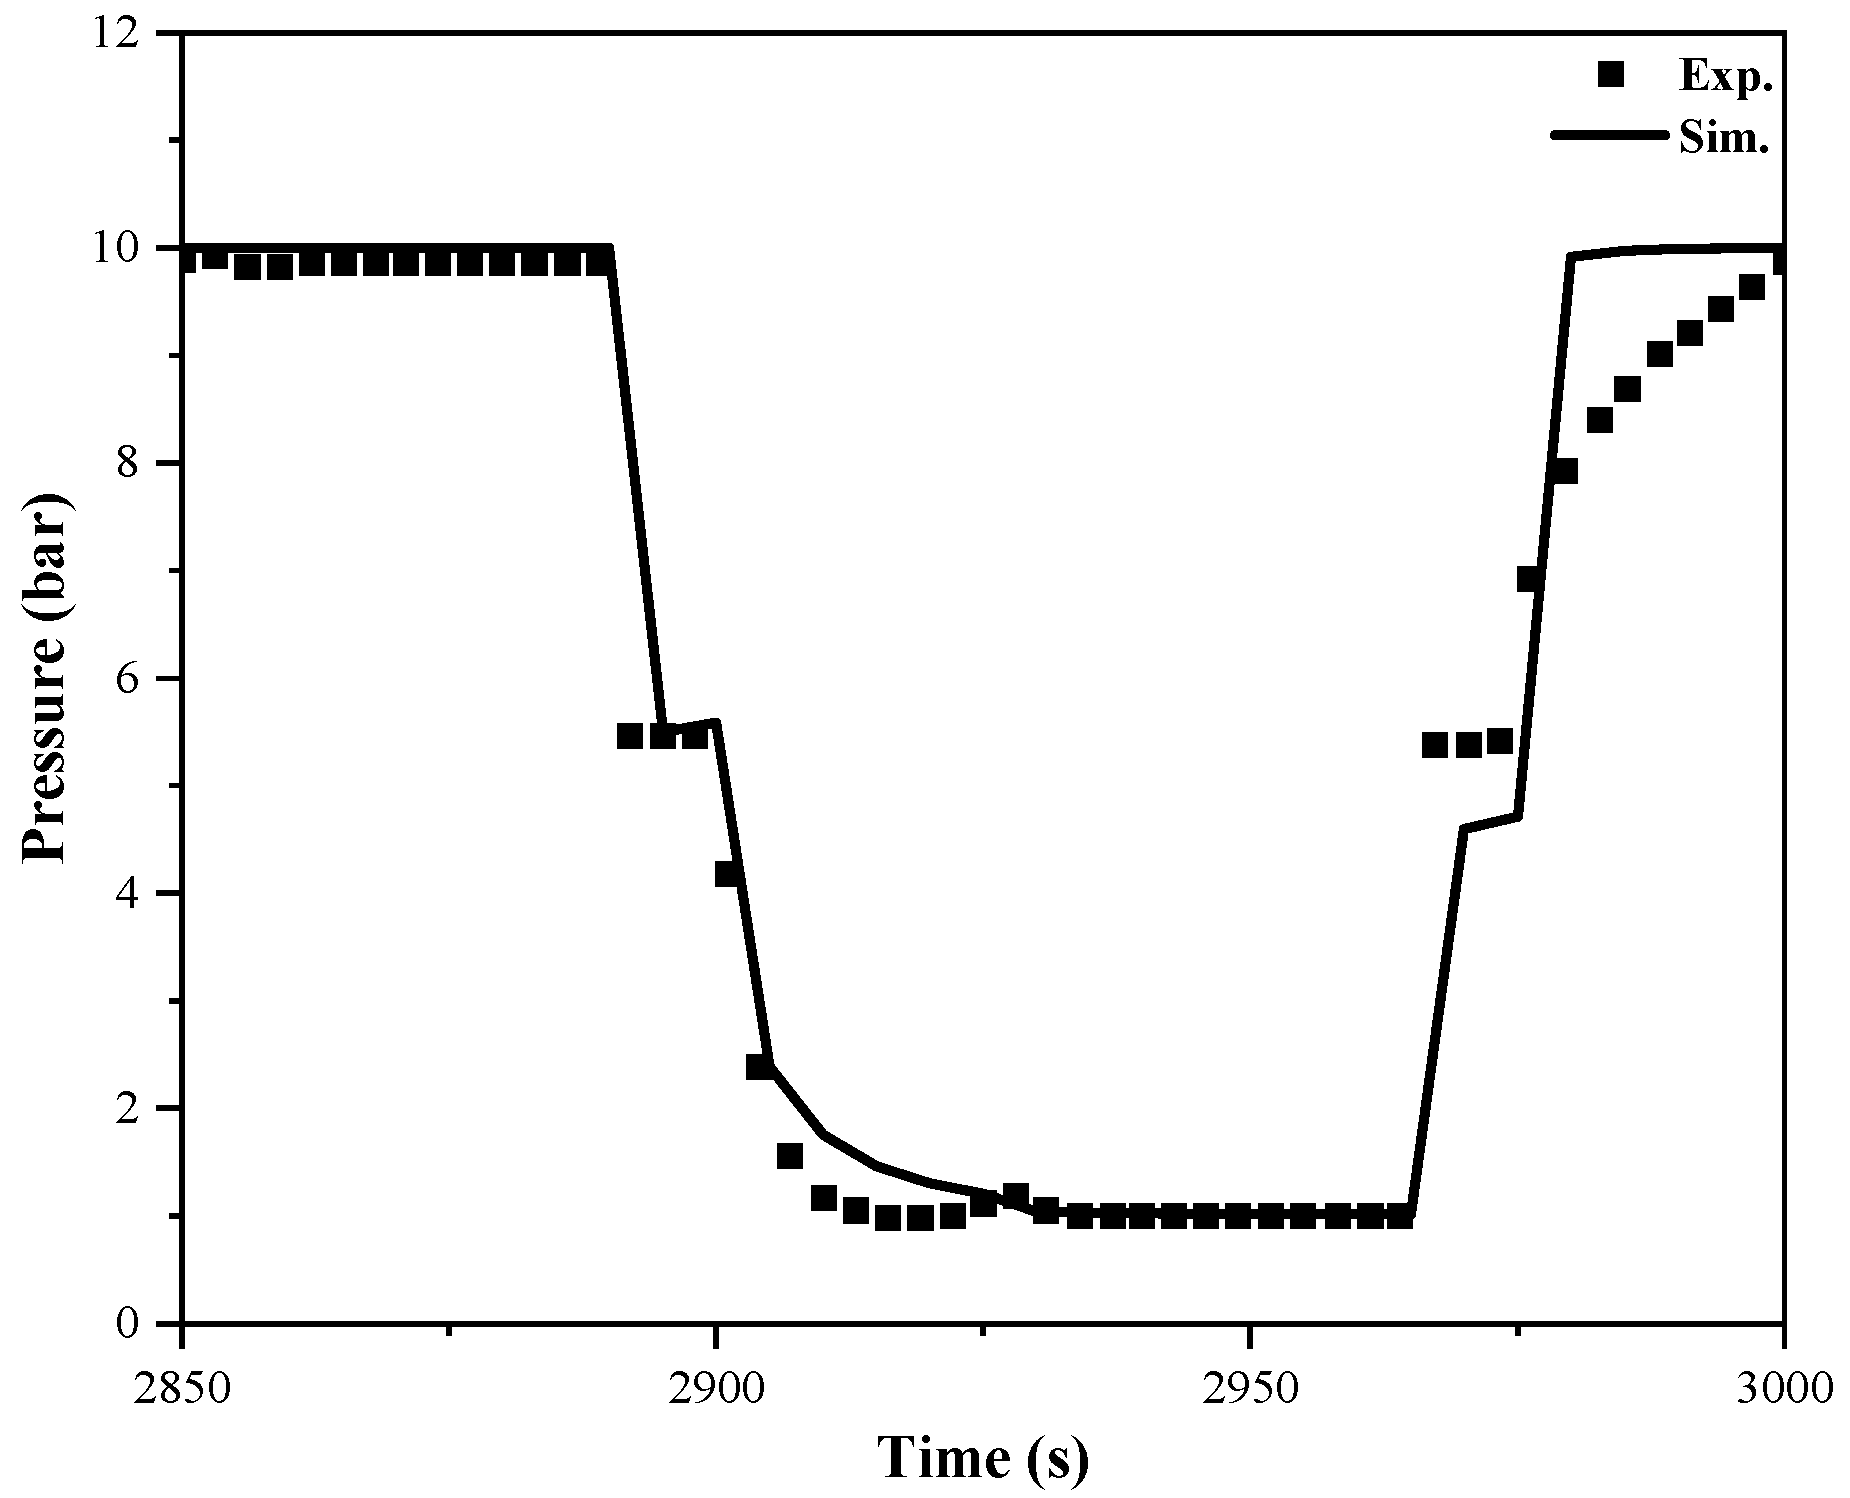
3.2. Validation of Breakthrough Curves on Adsorption Beds

By solving the mathematical equations presented in Section 2, the breakthrough curves on the adsorption bed can be obtained. Table 2 provides the physical property parameters used in the simulation. It is important to note that the structural parameters of the adsorption bed were selected to match typical laboratory-scale PSA setups. Figure 2 illustrates the breakthrough curve results for a lean hydrogen mixture (N2/CO2/H2/CO = 44.6/35.4/19.9/0.1 mol%) on the AC single bed, the zeolite 13X single bed, and an AC/zeolite 13X = 6:4 layered bed, respectively. The simulation conditions include a temperature of 298.15 K, a feed flow rate of 3 LSTP/min, and a feed pressure of 10 bar. It should be noted that, before the simulation begins, pure hydrogen gas is fed into the adsorption bed to saturate the adsorbent with hydrogen. Therefore, the adsorption bed is completely filled with pure hydrogen gas under the initial simulation conditions.
The breakthrough curve reflects the distinct adsorption characteristics of various adsorbents and the adsorption kinetics between different adsorbates. The breakthrough times of N2, CO, and CO2 are as follows: 260 s, 360 s, and 1000 s for the AC single bed; 310 s, 750 s, and 1485 s for the zeolite 13X single bed; and 265 s, 500 s, and 1225 s for the AC/zeolite 13X = 6:4 layered bed. Whether on a single-layer or layered bed, the breakthrough sequence of impurity gases is N2, CO, and CO2. The breakthrough sequence of impurity gases is determined by the adsorption kinetics equation (Equation (11)), which reflects the combined influence of adsorption capacity and the mass transfer coefficient ( w i ). As indicated by the LDF equation, both a higher w i and a higher adsorption capacity can enhance the adsorption rate, delaying the breakthrough. This effect is particularly evident when comparing the breakthrough times of CO2 on AC and zeolite 13X. For the two adsorbents studied, the order of w i is CO > N2 > CO2, while the adsorption capacities follow CO2 > CO > N2. Ultimately, the observed breakthrough sequence corresponds to the order of adsorption capacities, suggesting that adsorption capacity has a greater impact on breakthrough behavior than kinetic limits here.
A comparison of the breakthrough times indicates that zeolite 13X is more efficient in removing N2 and CO. Additionally, the higher roll-up of CO on the zeolite 13X bed suggests that zeolite 13X has a higher adsorption affinity for impurity gases. The CO roll-up phenomenon refers to the increase in the CO molar fraction at the outlet that exceeds its inlet molar fraction. This occurs due to competitive adsorption in multi-component gas mixtures, where the strongly adsorbed adsorbate (CO2) displaces the weakly adsorbed adsorbate (CO) from the adsorbents’ surface, causing the desorption of the weakly adsorbed adsorbate. Although CO2 penetrates later on zeolite 13X, Lee pointed out that during the pressure swing between 1 bar and the feed pressure, the working capacity of CO2 on zeolite 13X is much smaller than that on AC [28]. Solving this issue through vacuum pressure adsorption (VPSA) would significantly increase the cost. Therefore, hydrogen purification is performed using an AC/zeolite 13X layered bed configuration. As shown in Figure 2c, the breakthrough of impurity gases and the roll-up of CO on the layered bed have been significantly improved. To assess the accuracy of the simulation results, residual analysis of the breakthrough curves is conducted and presented in Figure 2. Minor discrepancies, such as the height of the CO roll-up and the breakthrough rate of CO2, may come from idealized model assumptions. Despite these deviations, the good agreement between the experimental data and simulation results validates the model and supports its application in PSA cycle studies.

4. Results and Discussion

4.1. Parametric Study on Breakthrough Curves of AC/Zeolite 13X Layered Bed

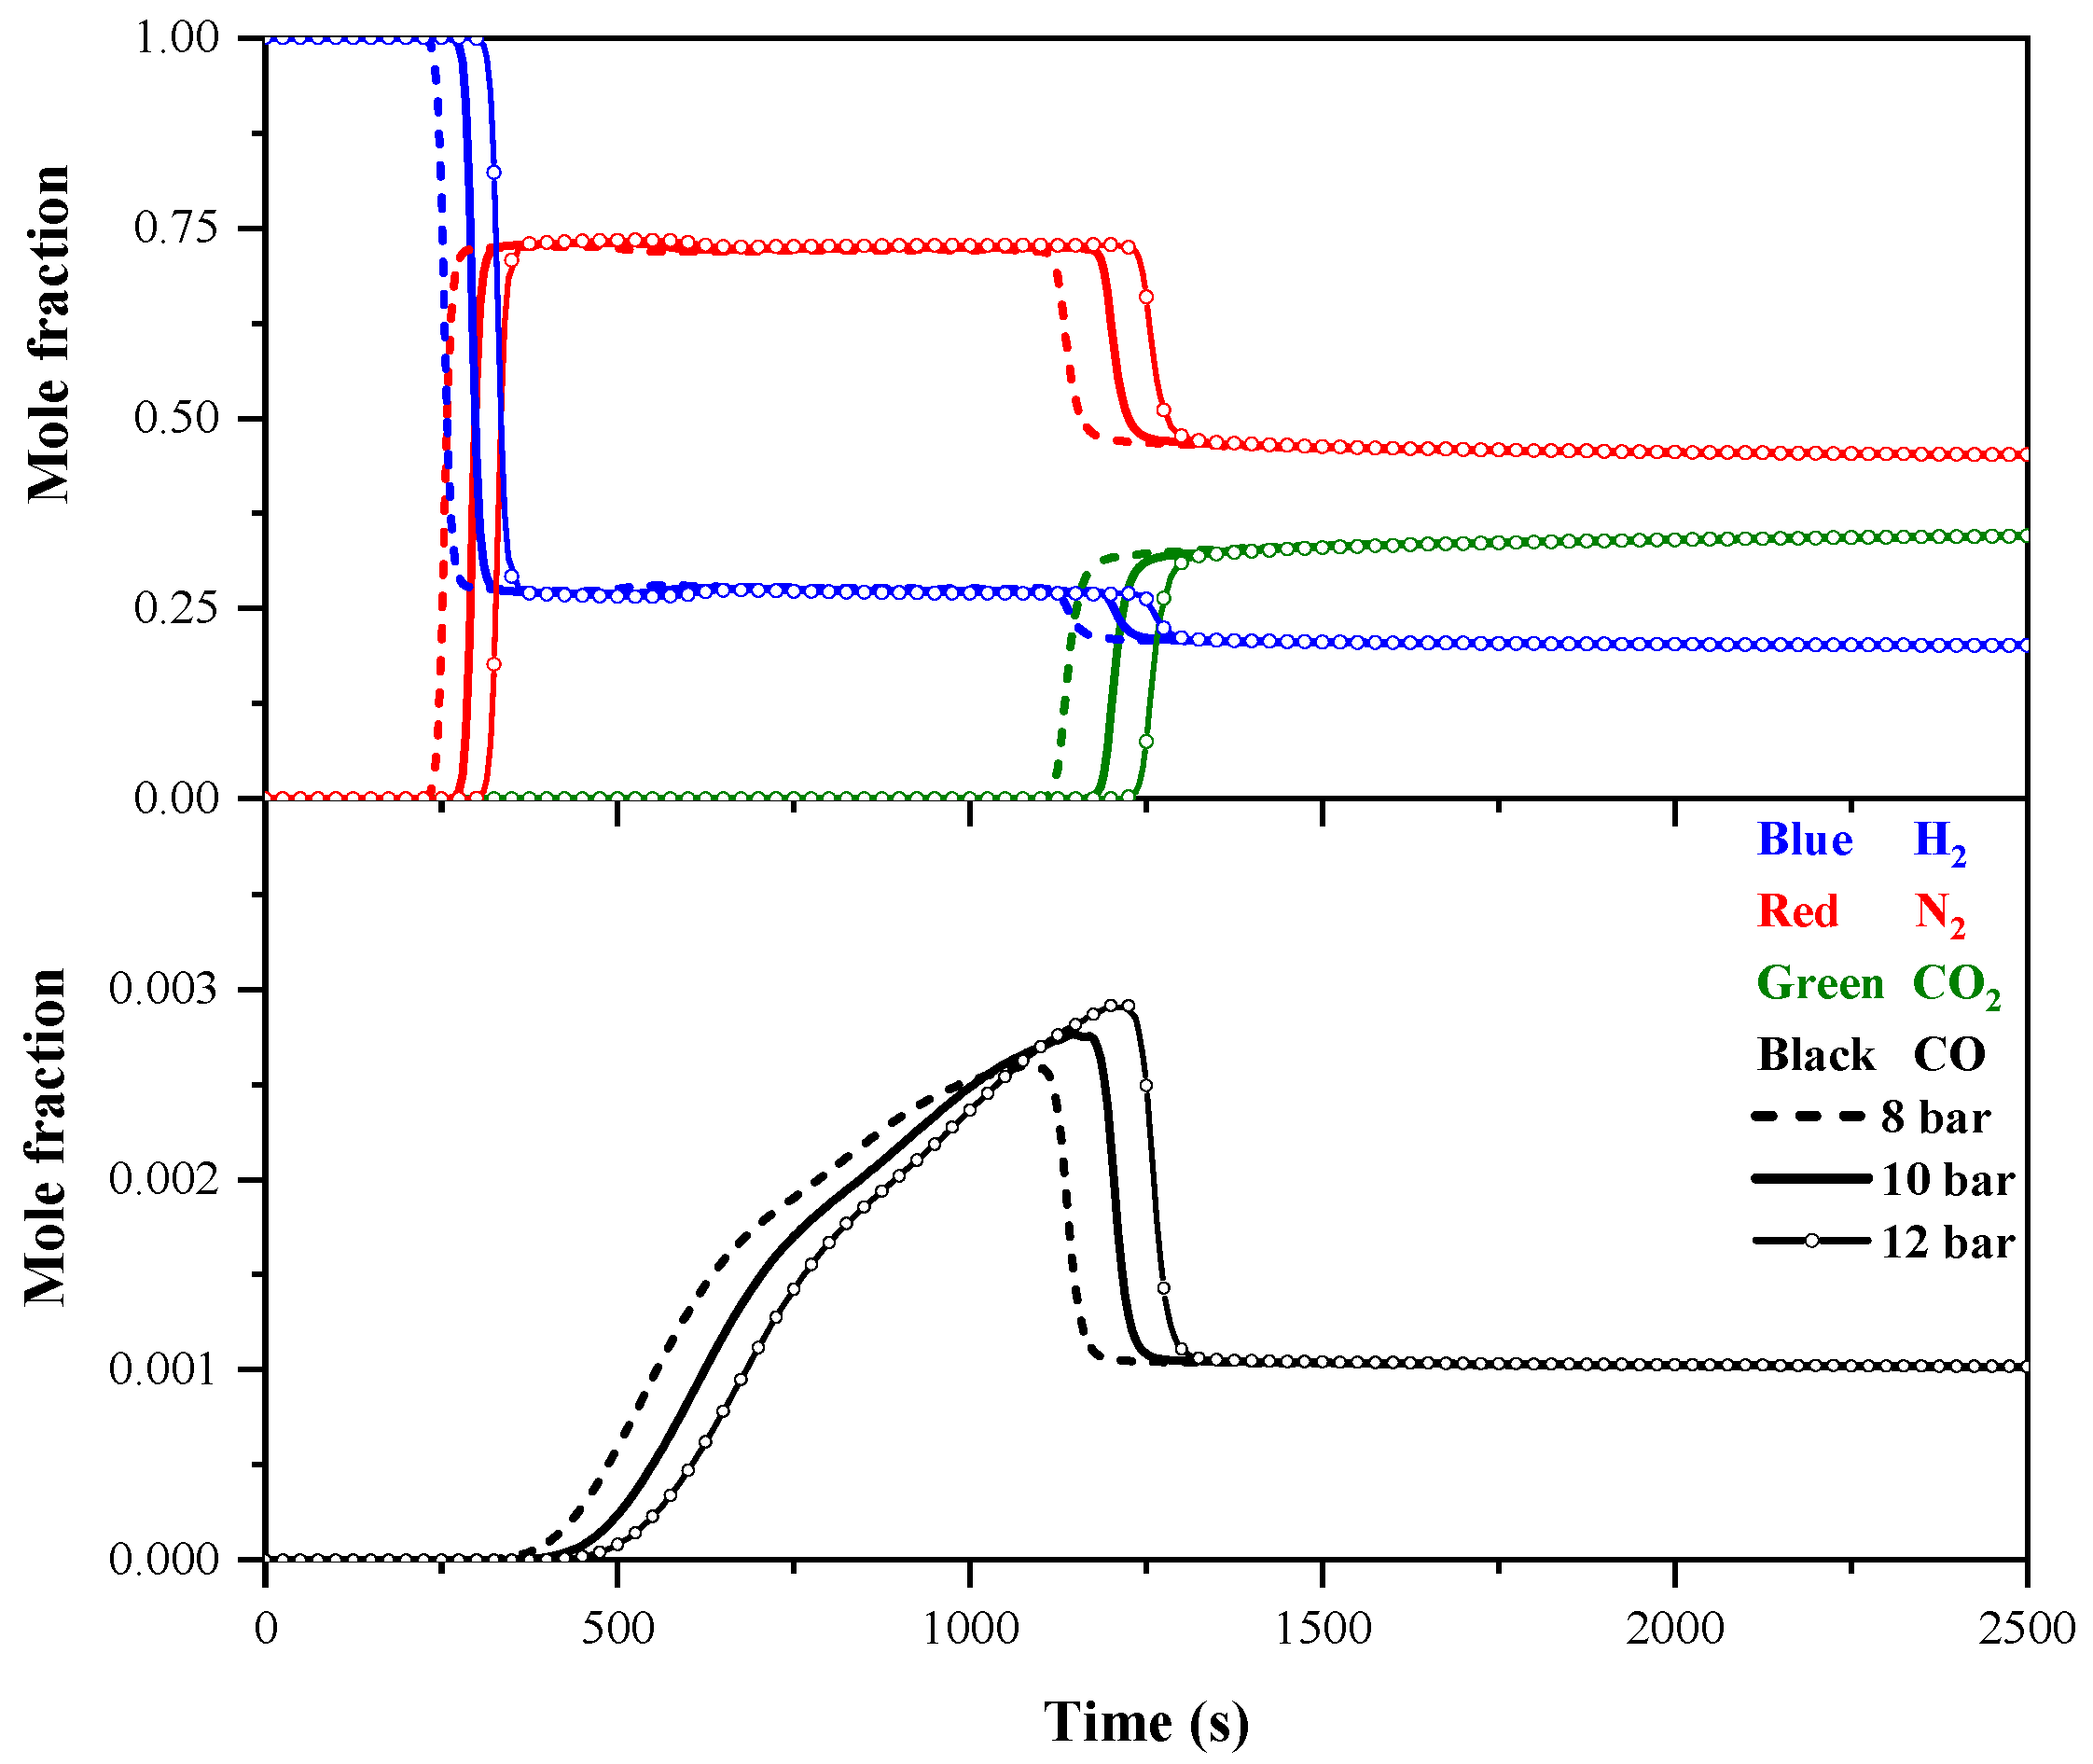
4.1.1. Effect of Feed Pressure on Breakthrough Curves

Figure 3 shows the effect of different feed pressures on the breakthrough curve of the layered bed. It can be observed that as the feed pressure increases, the breakthrough of each impurity gas is progressively delayed. Notably, the difference in the breakthrough time between 8 bar and 10 bar is slightly greater than the difference between 10 bar and 12 bar. According to the adsorption isotherm model, higher pressure corresponds to a higher adsorption amount. With a constant feed flow rate, it takes more time for the gas to reach adsorption saturation. Therefore, as the pressure increases, the breakthrough time of impurity gases also increases. Similarly, this reason explains why the roll-up of CO also rises with increasing pressure. However, the variations in breakthrough times across different pressures suggest that, as the pressure increases, its effect on gas adsorption gradually diminishes.

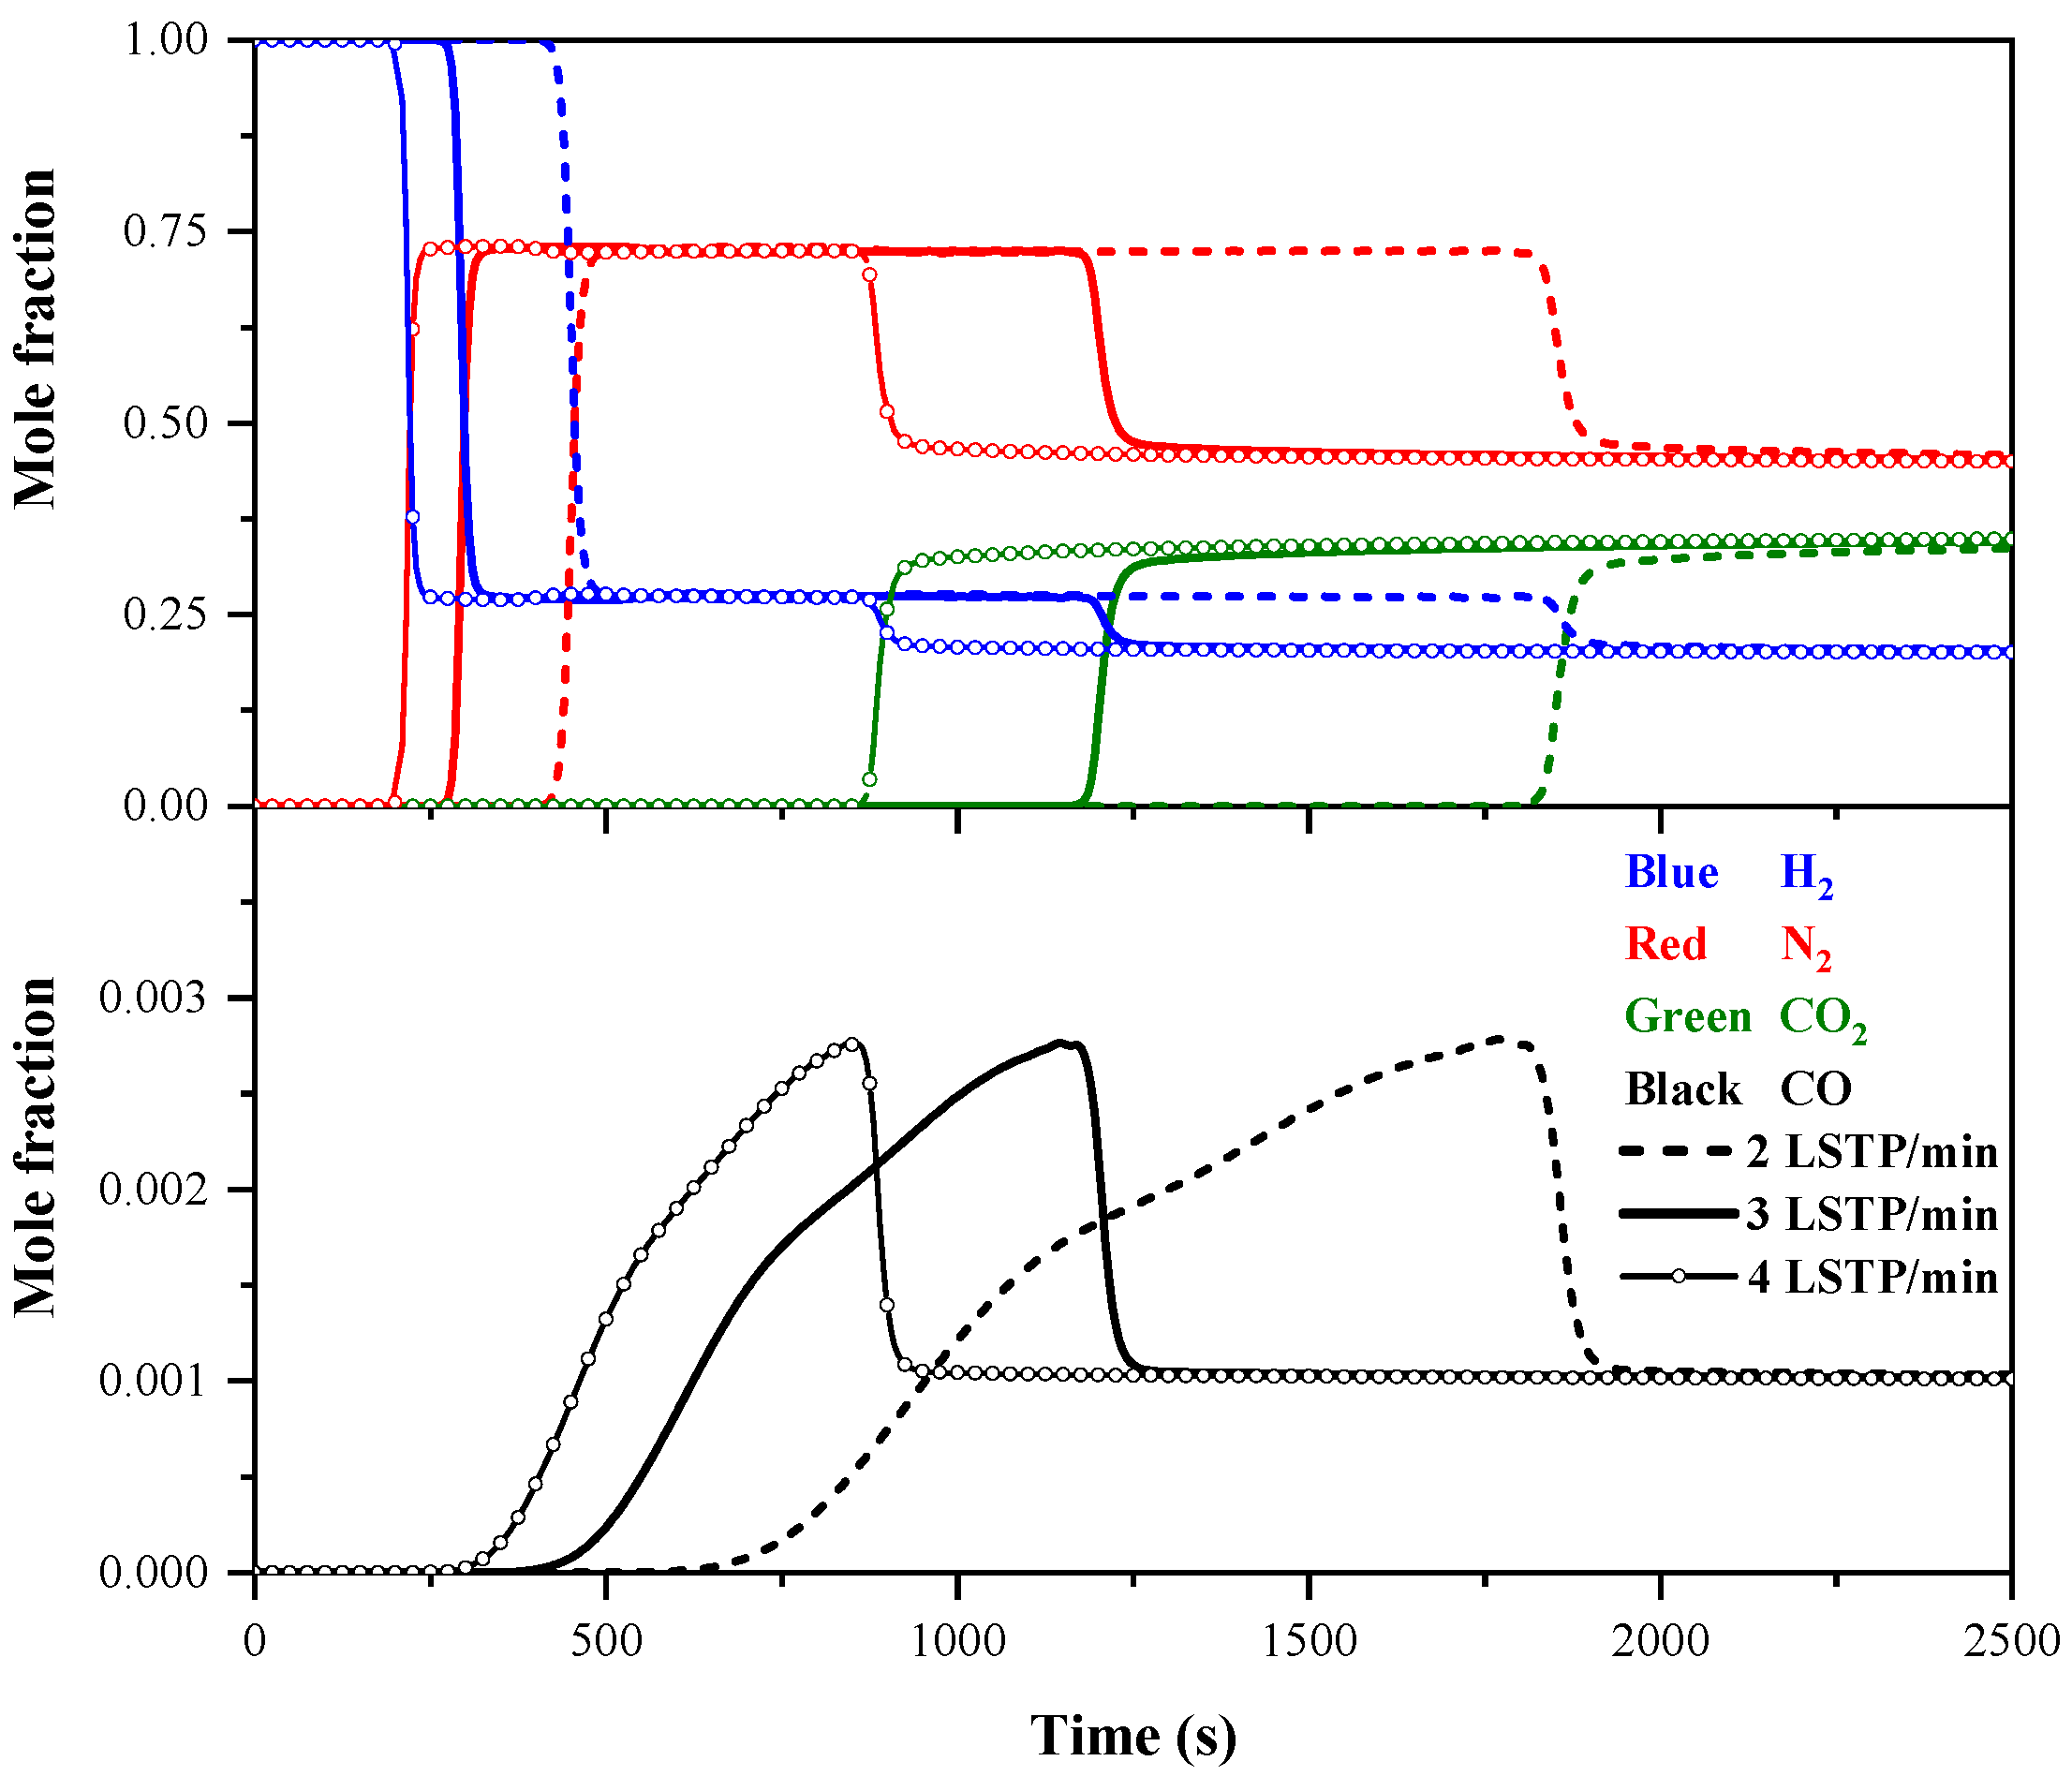
4.1.2. Effect of Feed Flow Rate on Breakthrough Curves

The breakthrough curve simulation of the layered bed was conducted under different feed flow rates. Figure 4 shows that as the feed flow rate increases, the breakthrough time of each impurity gas decreases. The increase in the feed flow rate shortens the residence time of the gas in the adsorption bed, reducing contact between the adsorbent and impurity gases. This limits mass transfer, causes the adsorbent to reach saturation more quickly, and results in an earlier breakthrough of the impurity gas. Notably, the difference in the breakthrough time between 2 LSTP/min and 3 LSTP/min is significantly greater than the difference between 3 LSTP/min and 4 LSTP/min. This phenomenon can be attributed to the lack of a linear relationship between the feed flow rate and breakthrough time at higher flow rates, which is due to the non-constant mass transfer resistance of the adsorbent.

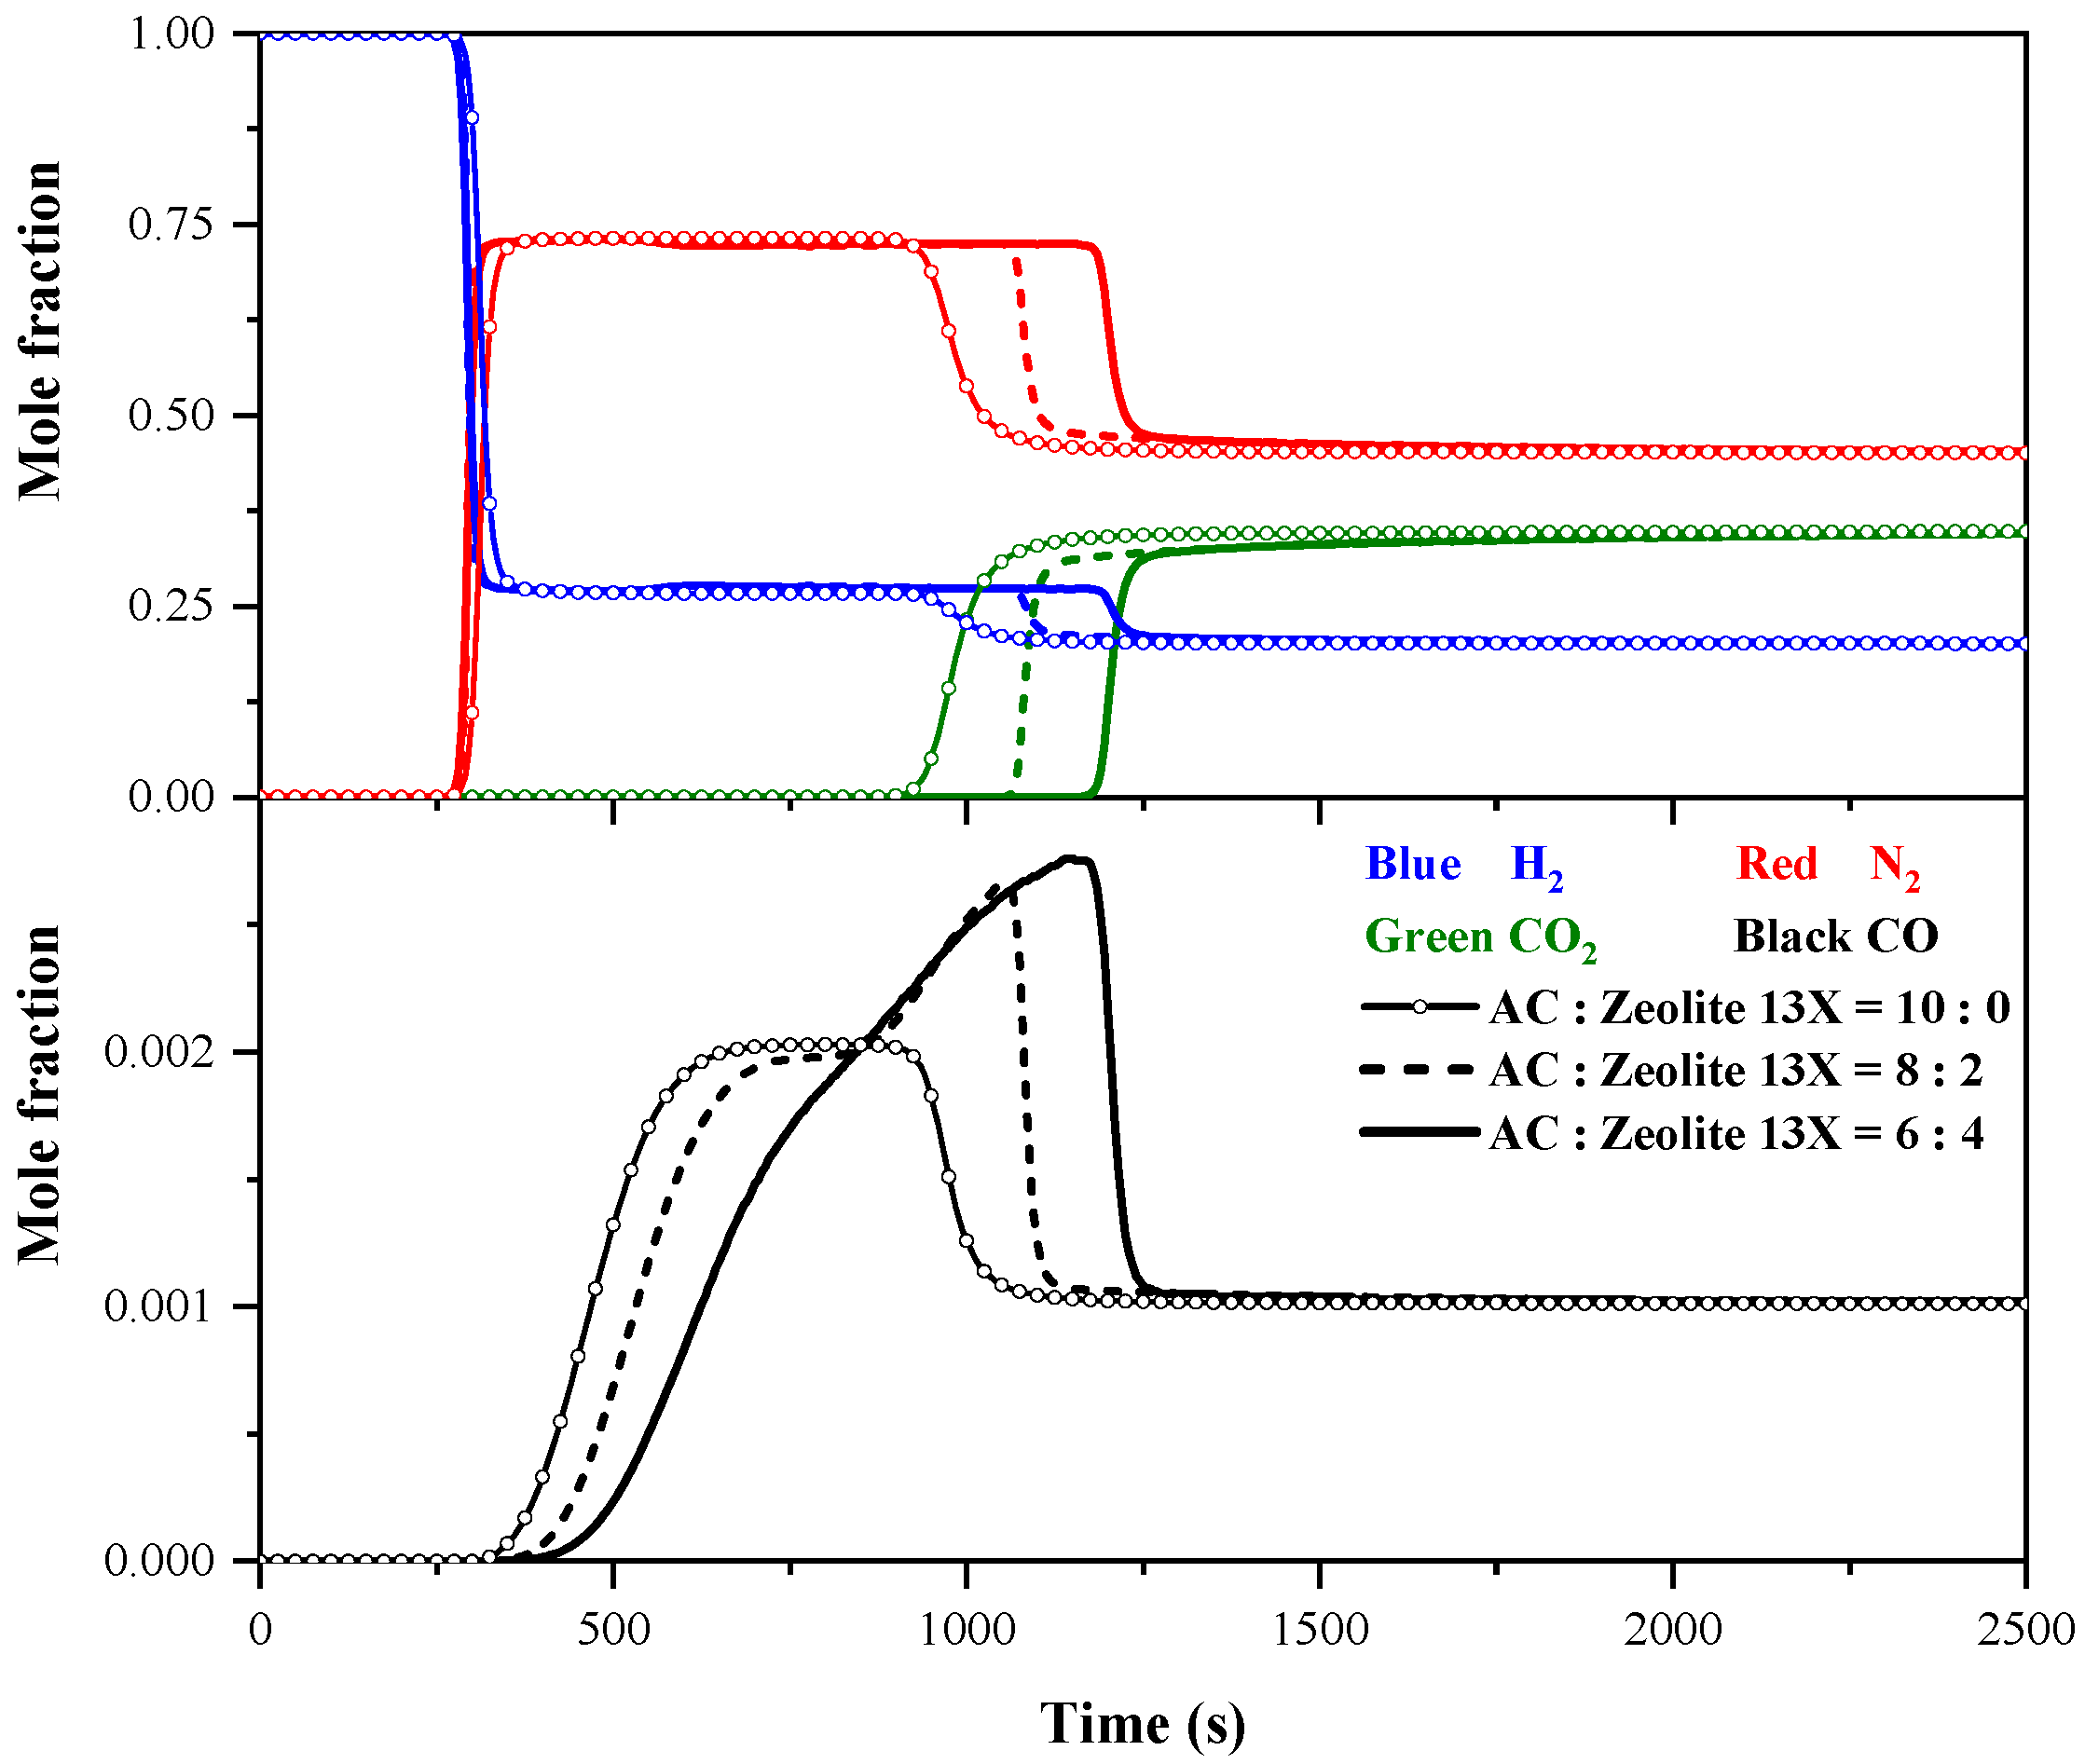
4.1.3. Effect of AC/Zeolite 13X Ratio on Breakthrough Curves

This section investigates the effect of different AC/zeolite 13X ratios on the breakthrough curves of layered beds and compares the results with those of the AC single-layer bed. The specific results are presented in Figure 5. The addition of zeolite 13X to the AC bed improves the CO roll-up shape typically observed in the AC single-layer bed. Meanwhile, the roll-up height increases. As the proportion of zeolite 13X increases, the roll-up height further rises, suggesting that the adsorption amount has been significantly enhanced. The breakthrough of the impurity gases CO and CO2 is notably delayed, whereas N2 shows minimal change. The breakthrough curves on the single-layer bed indicate that the breakthrough times of CO and CO2 on zeolite 13X are longer than those on AC, highlighting that the incorporation of zeolite 13X has somewhat optimized the dynamic separation of CO and CO2 in the layered bed. Notably, the N2 breakthrough time on layered beds with AC:13X ratios of 8:2 and 6:4 is nearly identical, though slightly earlier than in the AC single-layer bed. This may be due to AC’s stronger adsorption capacity for N2 compared to zeolite 13X. The addition of zeolite appears to reduce the bed’s dynamic separation efficiency for N2, though variations in the zeolite 13X ratio have minimal impact on this effect within the range studied.

4.2. Modeling and Validation of PSA Cycle

As shown in Figure 6, a dual-bed, six-step PSA cycle model using the Aspen Adsorption platform was developed. The PSA flow diagram is presented in Table 3. In Figure 6, F1, W1, and P1 represent the inlet, waste outlet, and product outlet, respectively. VF1, VW1, VP1, and VD1 are valves that regulate gas flow. Bed1 refers to the AC/zeolite 13X layered bed. D1 is an interactor, representing a virtual bed. Actually, D1 functions as Bed2.
The control of each step in the PSA cycle is implemented through a series of valve operations, described as the following: (1) Adsorption (AD) step: Valves VF1, VP1, and VD1 are opened to let high-pressure feed gas enter Bed1. Impurities are adsorbed, while hydrogen, which is less adsorbed, flows out. Some H2 flows towards P1, and the rest enters Bed2 for purge. (2) Depressurizing pressure equalization (DPE) step: Valves VF1 and VP1 are closed to stop the feed gas. The pressure in Bed1 drops, while the pressure in Bed2 rises until both reach the same level. (3) Blowdown (BD) step: Valve VD1 is closed, and VW1 is opened. The pressure in Bed1 quickly drops to atmospheric level, releasing the adsorbed impurities through W1. (4) Purge (PG) step: Valves VF1, VP1, and VD1 remain closed, and VW1 stays open. Hydrogen from Bed2 flows into Bed1 to remove the remaining impurities. (5) Pressurizing pressure equalization (PPE) step: Valve VW1 is closed to stop the purge. The pressure in Bed2 decreases, while that in Bed1 increases until they equalize. (6) Feed pressurization (FP) step: Valve VF1 is reopened to feed gas into Bed1, raising its pressure to the required level. This marks the beginning of the next PSA cycle.
The boundary conditions of each step in the simulation are detailed below:
(1) Boundary conditions in the AD and FP step:
ε b D L c i 0 z = v g ( 0 ) ( c i n , i 0 c i 0 )
c i L z = 0
ε b K g T 0 z = v g ( 0 ) ρ g ( 0 ) C p g ( T i n T 0 )
T L z = 0
(2) Boundary conditions in the PG and PPE step:
ε b D L c i L z = v g ( L ) ( c i n , i L c i L )
c i 0 z = 0
ε b K g T L z = v g ( L ) ρ g ( L ) C p g ( T i n T L )
T 0 z = 0
(3) Boundary conditions in the DPE and BD step:
c i 0 z = c i L z = 0
T 0 z = T L z = 0
The initial operating conditions for the cyclic process are set as follows: feed pressure of 10 bar, feed flow rate of 3 LSTP/min, temperature of 298.15 K, P/F ratio of 0.3, and a layer ratio of AC/zeolite 13X = 6:4. The process runs for 20 cycles. The P/F ratio is a critical parameter in the cyclic process, yet it has not been adequately addressed in the study of breakthrough curves. The P/F ratio refers to the ratio of the hydrogen purge during the PG step to the hydrogen feed during the AD step in the PSA cycle, as detailed in Equation (23). The value of the P/F ratio significantly influences the purification performance of the PSA process.
P / F   r a t i o = v g | z = L ,   a t   P G   s t e p y H 2 , f e e d v g | z = 0 , a t   A D   s t e p
where v g | z = L , a t   P G   s t e p is the gas flow rate at the outlet during the PG step; y H 2 , f e e d is the molar fraction in the feed gas; and v g | z = 0 , a t   A D   s t e p is the gas flow rate at the inlet during the AD step.
The PSA cycle model is validated by analyzing the bed pressure variations during the 20th cycle, as illustrated in Figure 7. Between 2850 and 2890 s, the AD step takes place in the adsorption bed, maintaining a pressure of approximately 10 bar to facilitate the adsorption of impurity gases. From 2890 to 2900 s, the DPE step occurs, during which the pressure rapidly drops and then briefly stabilizes after equalization. Between 2900 and 2925 s, the BD step is carried out, reducing the bed pressure quickly to around 1 bar (atmospheric pressure). During 2925–2965 s, the PG step is performed, with the exhaust valve remaining open and the pressure maintained near atmospheric levels. From 2965 to 2975 s, the PPE step takes place, functioning as the reverse of the DPE step. Finally, during 2975–3000 s, the FP step begins, reintroducing the feed gas into the bed and increasing the pressure back to 10 bar.
The performance of the PSA process is evaluated based on hydrogen purity and recovery:
P u r i t y % = 0 t A D c H 2 v g | z = L d t i = 1 N 0 t A D c i v g | z = L d t × 100 %
R e c o v e r y % = 0 t A D c H 2 v g | z = L d t 0 t P G c H 2 v g | z = L d t 0 t A D c H 2 v g | z = 0 d t + 0 t F P c H 2 v g | z = 0 d t × 100 %
where t A D , t P G , and t F P are the time of the AD step, PG step, and FP step, respectively; v g | z = L is the outlet velocity of the gas; and v g | z = 0 is the inlet velocity of the gas.
Figure 8 presents the variation in hydrogen purity and recovery over the entire PSA cycle. Prior to the start of the cycle, pure H2 is fed into the adsorption bed until the adsorbent reaches saturation, fully filling the bed with hydrogen. As a result, at the end of the first cycle, the outlet H2 purity approaches about 100%, and the recovery is relatively high. However, with each subsequent cycle, the incomplete regeneration of the adsorbent allows small amounts of impurity gases to exit with the H2 during the adsorption step. This causes a gradual decline in both purity and recovery. By approximately the fifth cycle, the recovery begins to stabilize; from the tenth cycle onward, the purity also stabilizes, indicating that the PSA process has reached a steady state.
The simulated purity values show good agreement with the experimental data. However, discrepancies in recovery are observed during the third to fifth cycles, potentially due to experimental errors. In general, the simulated recovery is slightly higher than the experimental values, possibly due to unmeasured H2 losses during experiments, leading to a lower observed recovery. Overall, the simulated H2 purity and recovery trends align well with the experimental results. Following a dual-bed, six-step PSA process applied to a lean hydrogen mixture (N2/CO2/H2/CO = 44.6/35.4/19.9/0.1 mol%), a hydrogen product with 97.03% purity and 48.60% recovery is achieved. Although the operating conditions in this study differ from those used in other works, the simulation result of hydrogen performance is acceptable, higher than the purity of 96.03% on the CuBTC/zeolite 13X layered bed and the recovery of 48.4% on zeolite 13X obtained by Ref. [25]. However, there is a gap between this work and Ref. [29]. In that study, a H2 product with a purity of 99.97% and a recovery of 67% was obtained using dual-stage VPSA, but the authors noted that increasing the vacuum pressure resulted in significantly higher energy consumption.

4.3. Parametric Study on Hydrogen Purification Performance

4.3.1. Effect of Feed Pressure

Figure 9 illustrates the variations in hydrogen purity and recovery under different feed pressures. During the AD step, an increase in pressure leads to greater adsorption of impurity gases. As a result, the molar fraction of hydrogen at the outlet increases, thereby enhancing purity. However, the increased adsorption amount also results in the higher consumption of feed gas, which in turn reduces the recovery. The figure further shows that as the feed pressure continues to rise, the rate of increase in hydrogen purity becomes more pronounced, particularly when the pressure is raised from 12 bar to 14 bar, where hydrogen purity increases from 97.36% to 97.98%. Simultaneously, the decrease in recovery becomes more significant. It should be noted that there is a limit to the effect of increasing pressure on hydrogen purity. Although this study does not address the effects at higher pressures, it is possible that beyond a certain threshold, further increases in pressure may have a diminishing impact on hydrogen purity. Nonetheless, within the pressure range studied, a higher feed pressure appears to improve hydrogen purity, albeit at the cost of a notable decrease in recovery.

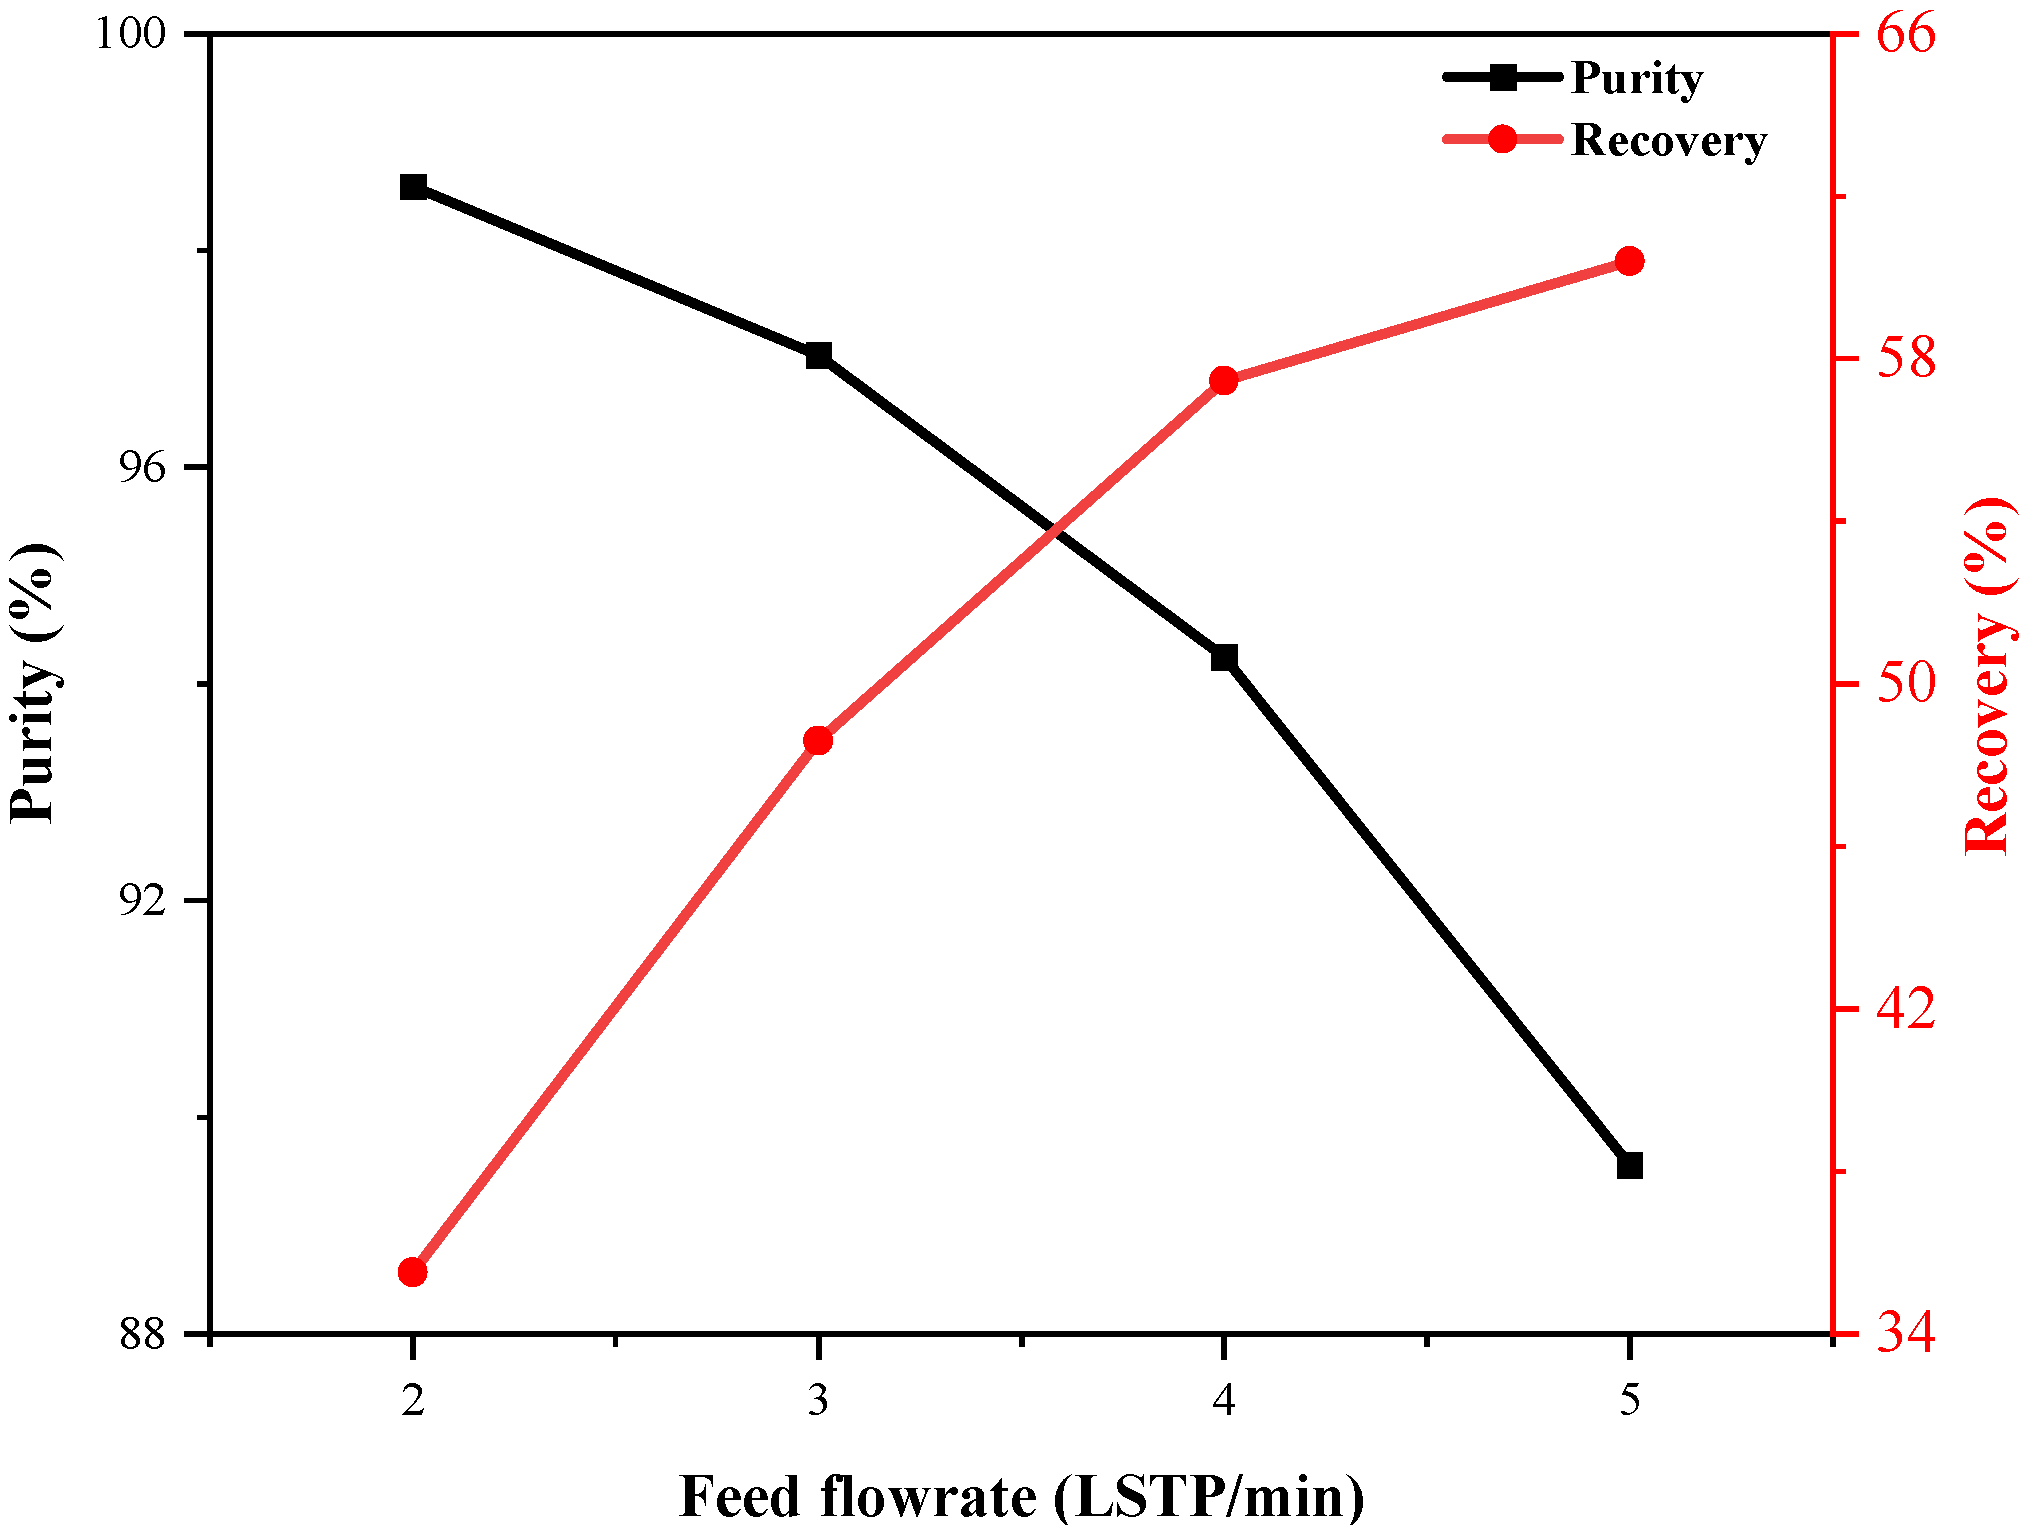
4.3.2. Effect of Feed Flow Rate

Figure 10 shows the hydrogen purity and recovery variations under different feed flow rates. As expected, an increase in feed flow rate, while maintaining a constant PSA cycle time, leads to a higher total volume of mixed gas processed by the adsorption bed. This results in an increase in the recovery of product hydrogen. Furthermore, the figure shows that as the feed flow rate increases, the decrease in hydrogen purity becomes more pronounced, while the rate of increase in recovery diminishes. Notably, when the feed flow rate rises from 2 LSTP/min to 3 LSTP/min, purity decreases from 98.59% to 97.03%, and recovery increases from 35.52% to 48.60%. In contrast, when the feed flow rate increases from 4 LSTP/min to 5 LSTP/min, purity decreases sharply from 94.25% to 89.56%, while recovery only increases from 57.46% to 60.40%. The former change can be attributed to the incomplete adsorption of a greater amount of impurities, causing them to overflow from the outlet and increasing the rate of purity decrease. The latter change is likely due to the feed flow rate reaching the processing capacity of the adsorbent per unit mass, resulting in a diminishing rate of increase in recovery.

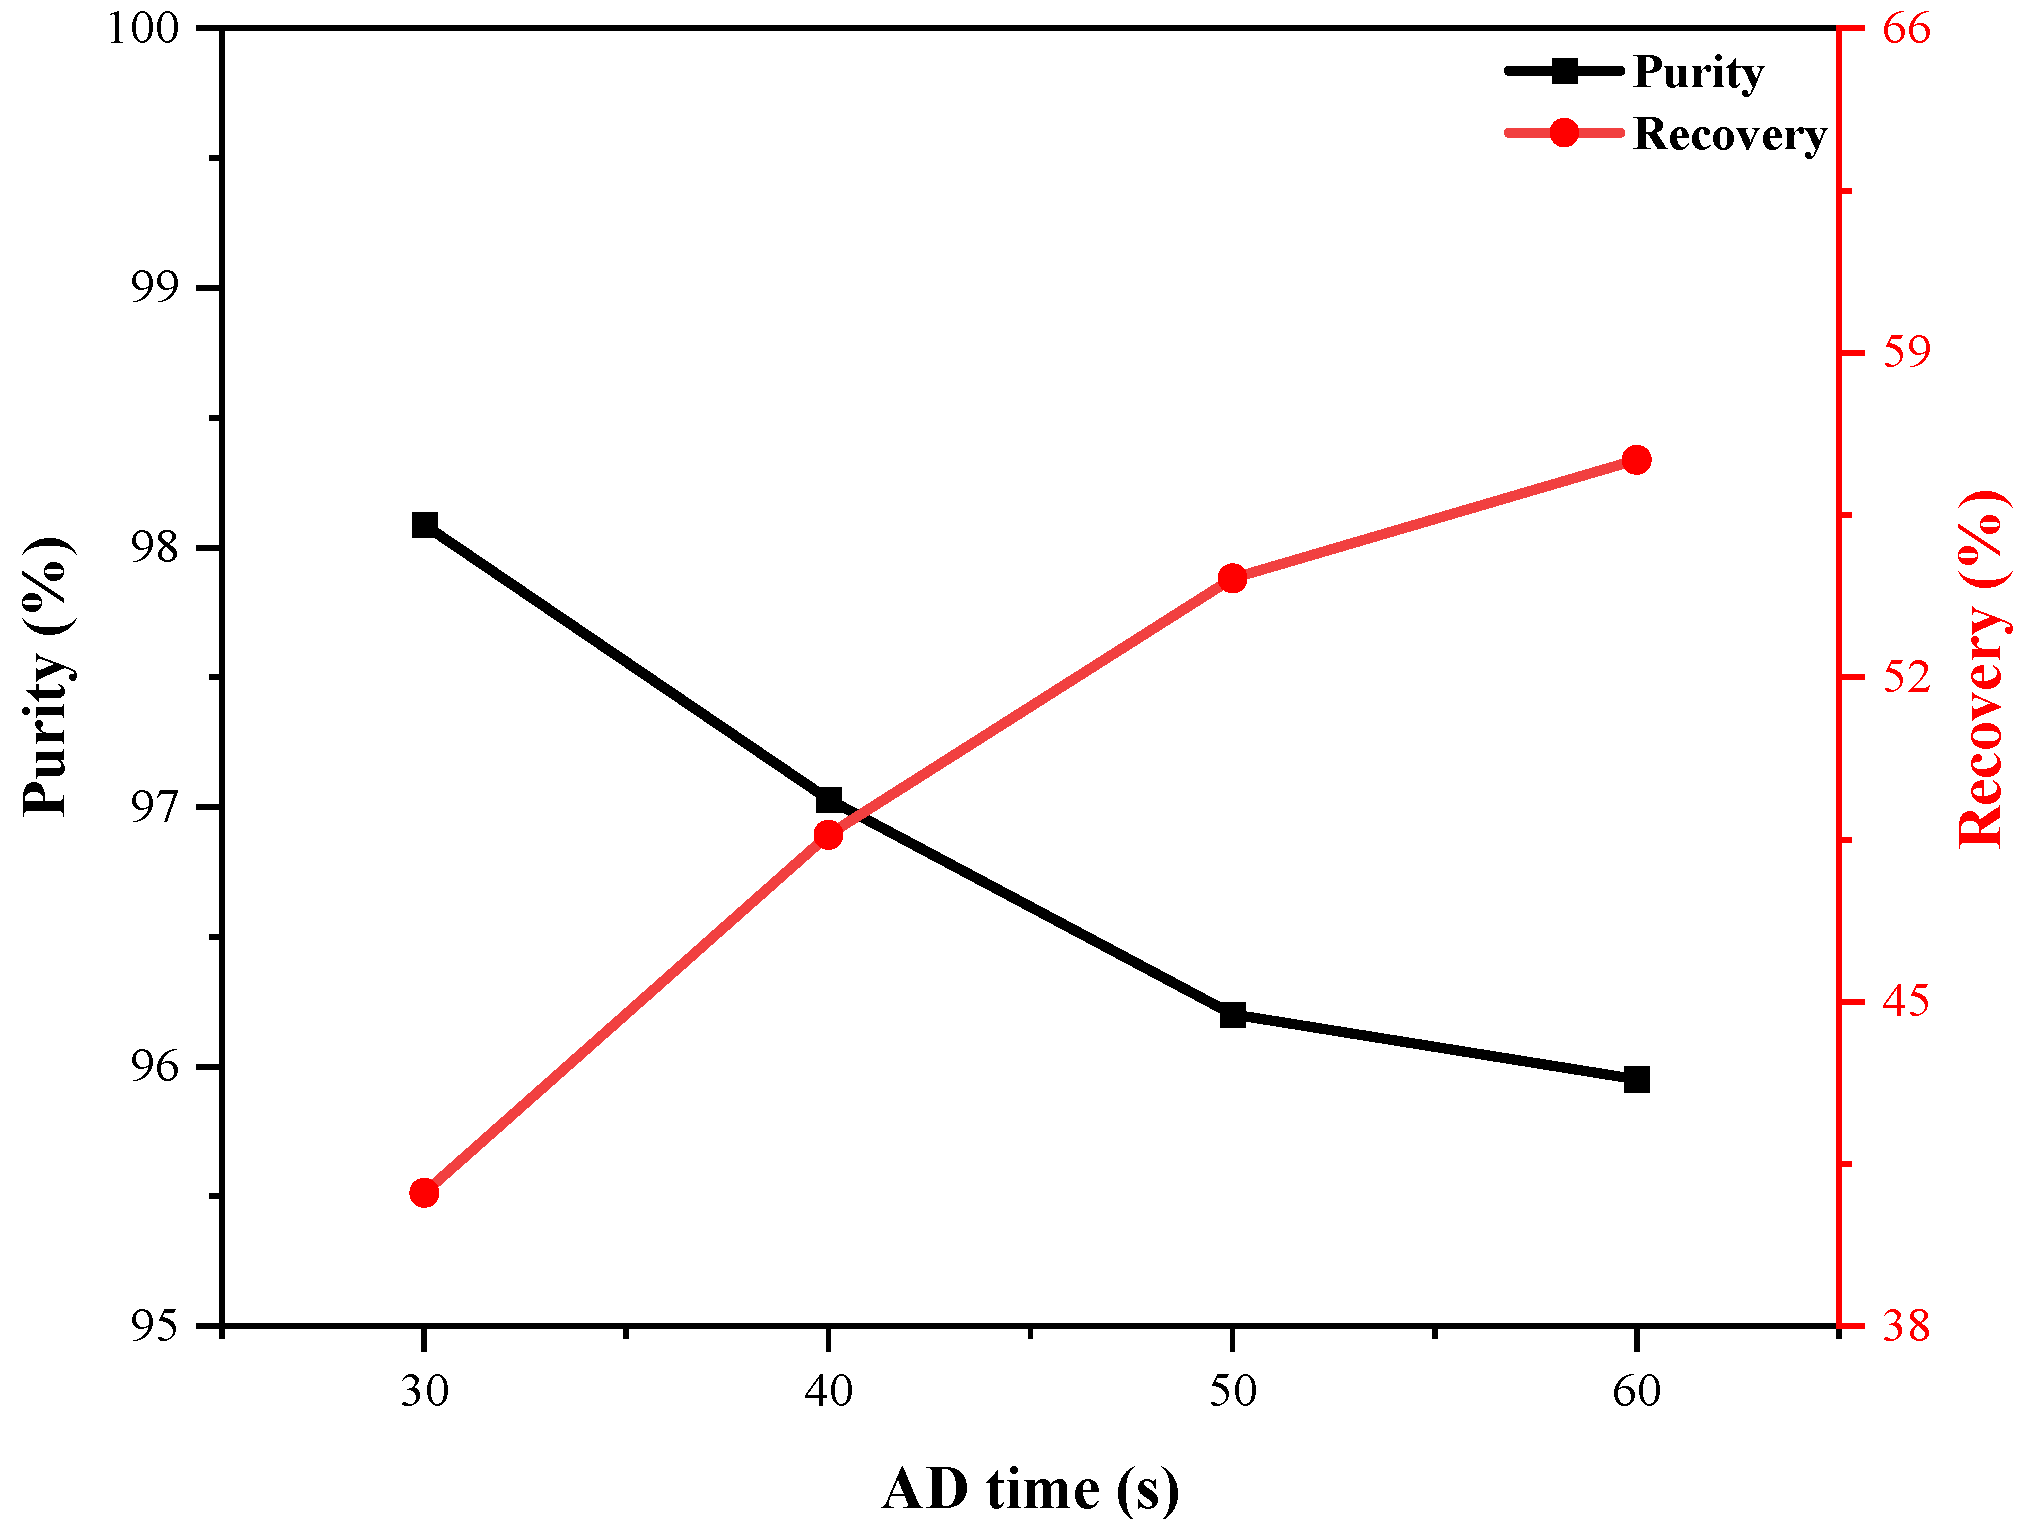
4.3.3. Effect of AD Time

Figure 11 illustrates the changes in hydrogen purity and recovery with varying AD step times. Similar to the feed flow rate, extending the AD step time increases the total amount of mixtures processed during the entire PSA cycle, resulting in higher hydrogen recovery. However, as the AD time is further extended, the increase in recovery diminishes, suggesting that the processing capacity of the adsorption bed is limited and cannot fully meet the increasing demand for processed gas. As the PSA cycle progresses, the working capacity of the adsorbent decreases, which in turn reduces its adsorbed amount for impurity gases in subsequent AD steps. Consequently, prolonging the AD time may cause the impurity gases to reach saturation adsorption earlier, leading to an overflow of impurities from the outlet and a decrease in hydrogen purity. Furthermore, this trend highlights that with the continued extension of the AD time, the decrease in hydrogen purity becomes more pronounced.

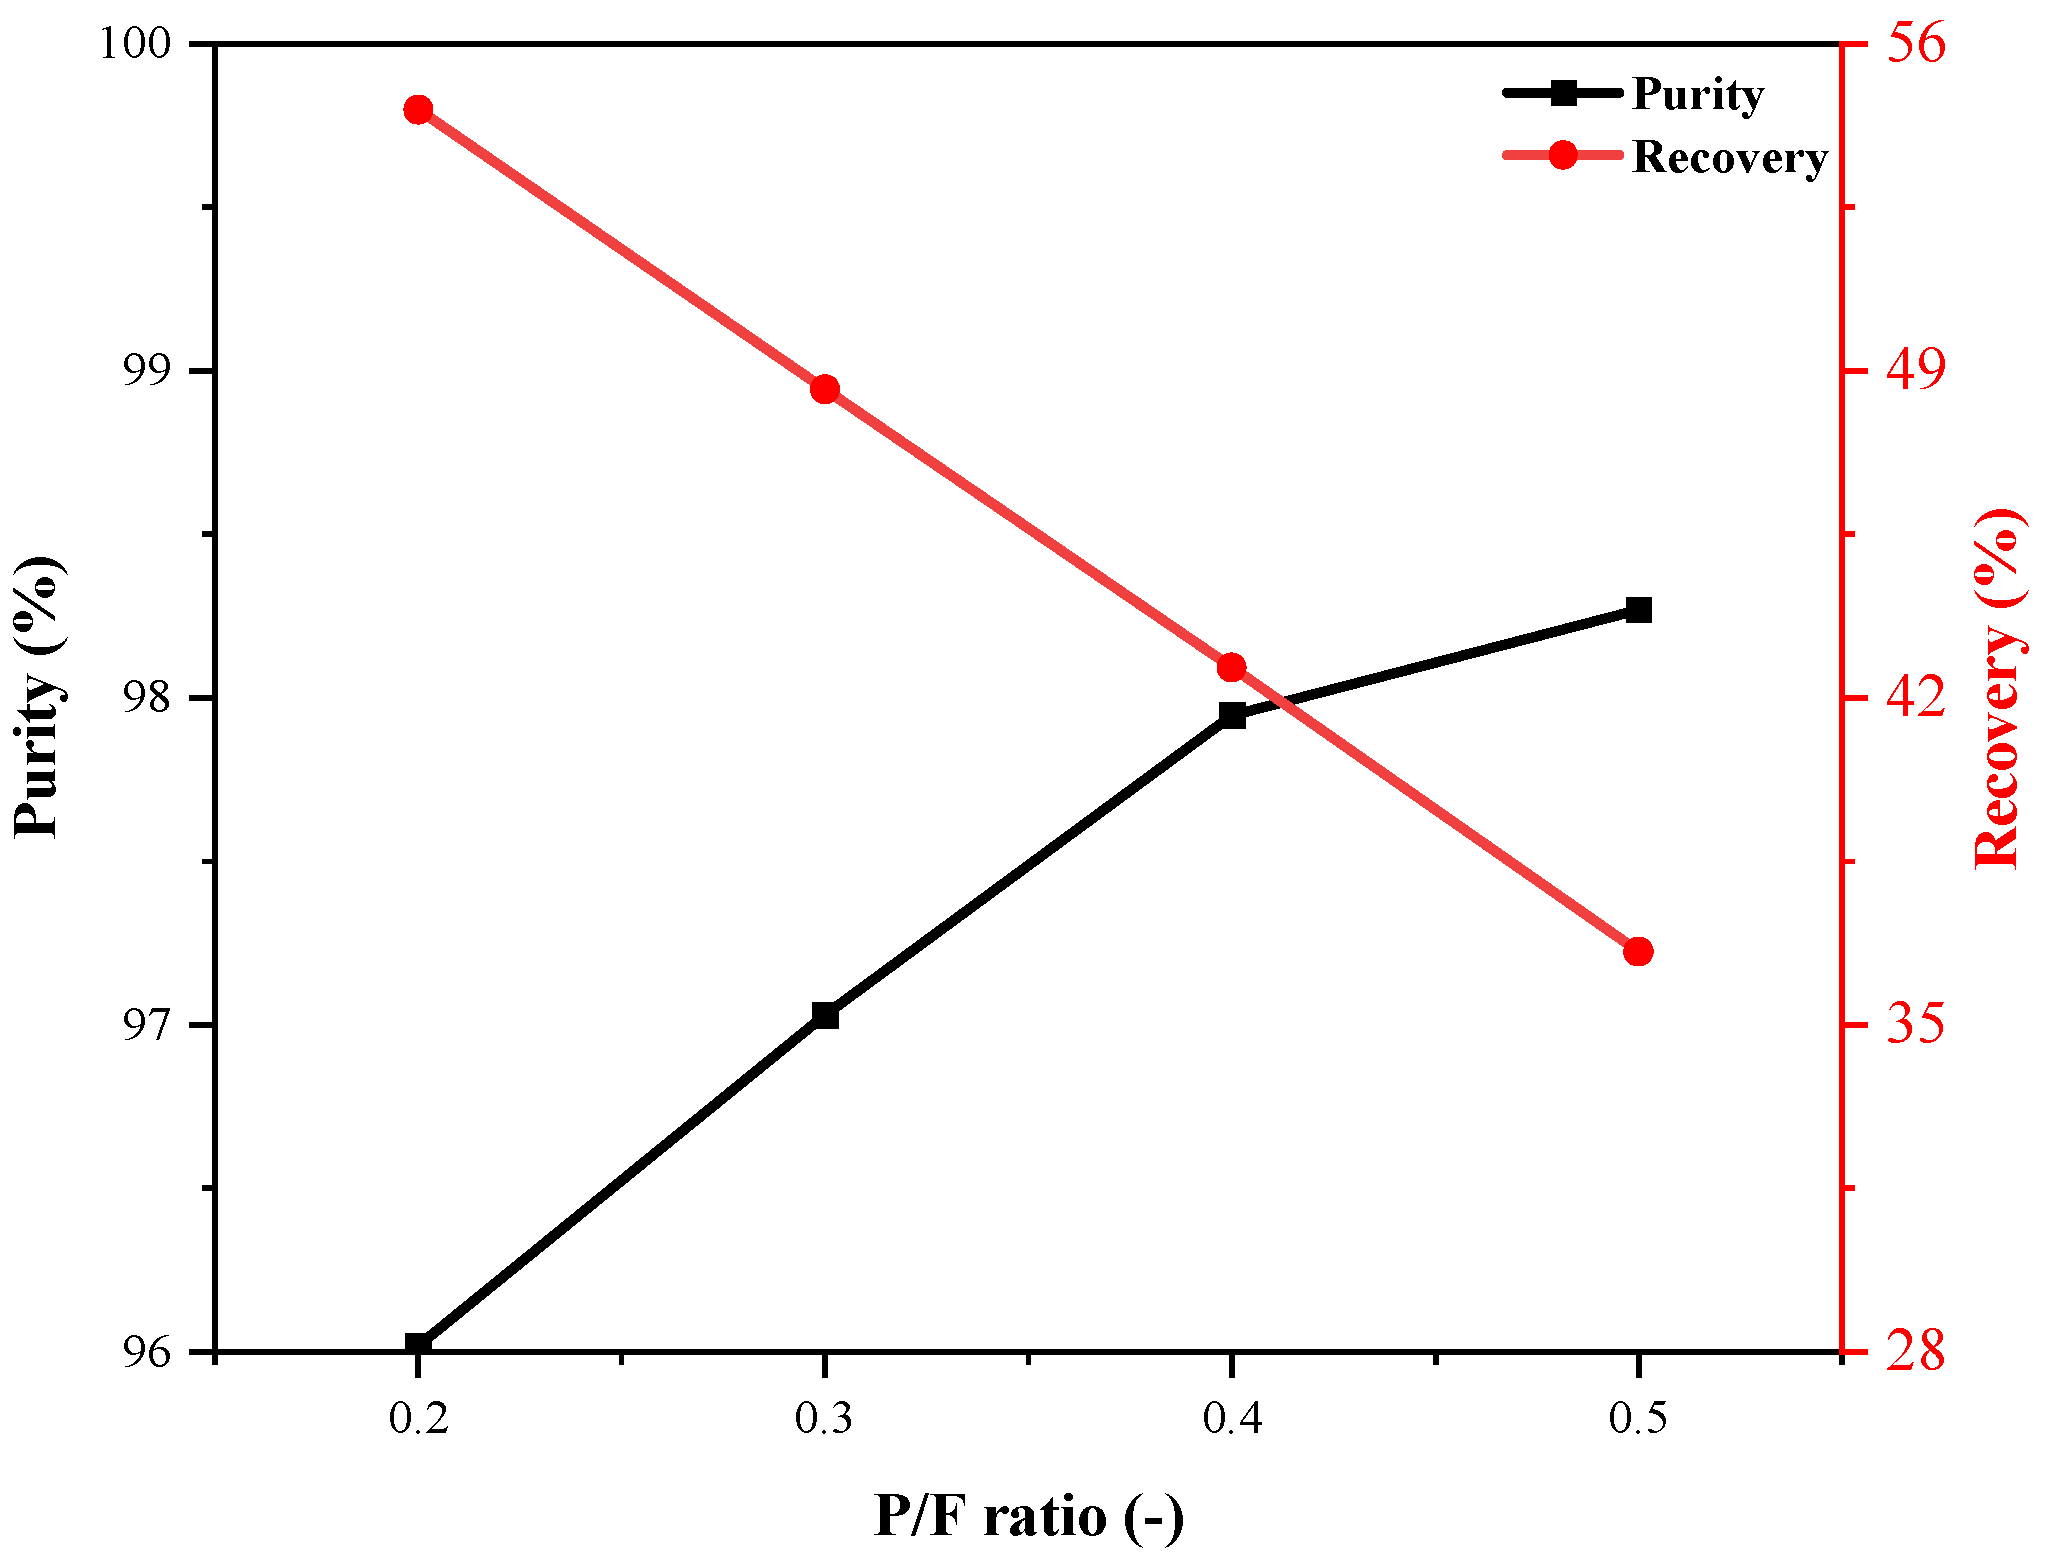
4.3.4. Effect of P/F Ratio

This section investigates the effect of various P/F ratios (0.2, 0.3, 0.4, and 0.5) on the PSA process, with the results presented in Figure 12. The amount of hydrogen fed into the AD step remains constant. Consequently, as the P/F ratio increases, an increase in the pure hydrogen used in the PG step results in a higher total amount of hydrogen consumed throughout the PSA process, leading to a significant decrease in the recovery. Using more hydrogen for purge helps reduce the residual impurity gases in the adsorption bed, thereby increasing hydrogen purity. However, as the P/F ratio continues to rise, the rate of increase in purity gradually diminishes. This indicates that the improvement in the ‘cleanliness’ of the fixed bed reaches a limit as the P/F ratio increases. Notably, the P/F ratio has a significantly greater influence on recovery than on purity.

4.3.5. Effect of AC/Zeolite 13X Ratio

This section explores the impact of the AC/zeolite 13X ratio on PSA cycle performance. The purification performance of adsorption beds with different structural configurations is investigated, including layered and single-layer beds composed exclusively of AC or zeolite 13X. The results are presented in Figure 13.
The results indicate that the purification performance of the zeolite 13X single-layer bed surpasses that of the AC bed. Moreover, incorporating zeolite 13X or AC into the other single-layer bed significantly enhances the purification performance of the adsorption bed. Notably, the enhancement resulting from adding zeolite 13X to a single-layer activated carbon (AC) bed is more pronounced. When the AC/zeolite 13X ratio is adjusted from 10:0 to 9:1, hydrogen purity increases from 86.28% to 91.73%, while recovery improves from 47.38% to 48.19%. Further decreasing the AC/zeolite 13X ratio to 5:5 leads to continued improvements in both the hydrogen purity and recovery. At AC/zeolite 13X = 5:5, purity reaches its maximum value of 97.38%. At AC/zeolite 13X = 3:7, recovery peaks at 49.13%. The recovery across different layered beds is relatively similar, with a maximum difference of approximately 1%. In contrast, the variation in hydrogen purity is more significant. The optimal bed configuration should be determined based on the specific purity and recovery requirements of the intended application. Additionally, it is worth noting that the purity and recovery of the zeolite 13X single-layer bed are higher than those of the 9:1 ratio but lower than those of the 8:2 ratio. This may indicate that when the proportion of zeolite 13X in the adsorption bed is too low, its purification performance cannot be effectively utilized.
The results of the parametric studies highlight a trade-off between hydrogen purity and recovery. Several key results are specifically summarized in Table 4. To identify optimal solutions, the findings of this study can serve as a foundation for further exploration using multi-objective optimization algorithms to determine the best operating conditions, bed configurations, and corresponding hydrogen purity and recovery. Future work will consider the parameter range and incorporate multi-beds with larger size and multi-step approaches to better align with the requirements of industrial-scale studies. In large-scale industrial hydrogen production, operating conditions, such as the feed pressure and feed flow rate, are significantly higher than those at laboratory scale. For example, PSA systems for SMR hydrogen purification typically operate at around 20 bar. Additionally, increasing the number of beds and steps further enhances both purity and recovery [23]. Hydrogen productivity and energy consumption can also be considered to further improve the overall PSA performance. Additionally, the model developed in this work can be not only further extended but also used to investigate the hydrogen purification performance of other advanced adsorbent materials such as MOFs. Such efforts will enhance the performance of hybrid layered configurations.

5. Conclusions

A dynamic adsorption model for a lean hydrogen mixture (N2/CO2/H2/CO = 44.6/35.4/19.9/0.1 mol%) on an AC/zeolite 13X layered bed was developed and validated against experimental data. Building on this, a dual-bed, six-step PSA cycle model was implemented using the Aspen Adsorption platform to study the influence of key operating parameters, including the feed pressure, flow rate, AD time, P/F ratio, and AC/zeolite 13X ratio. The following conclusions are drawn:
(1)
Increasing the feed pressure and decreasing the feed flow rate delay the breakthrough of impurity gases in the adsorption bed. A higher pressure enhances impurity gas adsorption and improves purity but reduces recovery due to greater feed gas consumption. A higher feed flow rate boosts recovery by processing more gas but reduces purity due to insufficient gas–adsorbent contact.
(2)
Extending the AD time improves recovery but may lead to early adsorbent saturation and reduced purity. A higher P/F ratio increases hydrogen usage during the purge step, enhancing purity but lowering recovery.
(3)
The performance of a layered bed is superior compared with that of an AC or zeolite 13X single-layer bed. Within a certain range, increasing the proportion of zeolite 13X on the layered bed can enhance the dynamic separation of impurity gases across the entire adsorption bed, further improving the overall purification performance. The highest purity of 97.38% and highest recovery of 49.13% occur at AC/zeolite 13X ratios of 5:5 and 3:7, respectively.
This study offers guidance for designing operation parameters and bed structures in PSA processes. Future work will expand the scope of parameter studies to better reflect industrial-scale conditions and evaluate PSA performance from multiple perspectives, including hydrogen productivity and energy consumption. Moreover, the commonly observed trade-off between purity and recovery highlights the need for further multi-objective optimization.

Author Contributions

Conceptualization, C.L. and L.T.; methodology, T.Y. and Z.Y.; software, Z.Y.; validation, X.L.; formal analysis, B.C.; investigation, B.C.; resources, C.Y. and J.X.; data curation, L.T.; writing—original draft preparation, T.Y. and Z.Y.; writing—review and editing, C.L. and J.X.; visualization, Y.Y.; supervision, C.Y.; project administration, T.Y. and Y.Y.; funding acquisition, C.L., L.T., and X.L. All authors have read and agreed to the published version of the manuscript.

Funding

This research was funded by the Natural Science Foundation of Hubei Province of China (2025AFB665), the National Natural Science Foundation of China (52176191 and 51476120), the Master’s and Doctoral Special Project (2023whcvcS05), and the Research Innovation Team Project of Wuhan City Polytechnic (2023whcvcTD01 and 2023whcvcTD02).

Institutional Review Board Statement

Not applicable.

Informed Consent Statement

Not applicable.

Data Availability Statement

The original contributions presented in this study are included in the article. Further inquiries can be directed to the corresponding authors.

Conflicts of Interest

The authors declare no conflicts of interest.

Abbreviations

The following abbreviations are used in this manuscript:
ACCoal-derived activated carbon
ADAdsorption
BDBlowdown
CNGCompressed natural gas
DPEDepressurizing pressure equalization
DSLDual-site Langmuir
FPFeed pressurization
LDFLinear driving force
LSTP/minLiter per minute at standard state (273.15 K and 101.3 kPa)
P/FPurge/feed
PGPurge
PPEPressurizing pressure equalization
PSAPressure swing adsorption
TD DSLTemperature-dependent dual-site Langmuir
VPSAVacuum pressure swing adsorption

References

  1. Fan, Z.; Weng, W.; Zhou, J.; Gu, D.; Xiao, W. Catalytic decomposition of methane to produce hydrogen: A review. J. Energy Chem. 2021, 58, 415–430. [Google Scholar] [CrossRef]
  2. Guo, R.; Li, L.; Chang, C.; Di, Z. Steel slag-enhanced reforming process for blue hydrogen production from coke oven gas: Techno-economic evaluation. J. Clean. Prod. 2022, 379, 134778. [Google Scholar] [CrossRef]
  3. Okere, C.J.; Sheng, J.J. Review on clean hydrogen generation from petroleum reservoirs: Fundamentals, mechanisms, and field applications. Int. J. Hydrogen Energy 2023, 48, 38188–38222. [Google Scholar] [CrossRef]
  4. Zhang, X.; Bao, C.; Zhou, F.; Lai, N.-C. Modeling study on a two-stage hydrogen purification process of pressure swing adsorption and carbon monoxide selective methanation for proton exchange membrane fuel cells. Int. J. Hydrogen Energy 2023, 48, 25171–25184. [Google Scholar] [CrossRef]
  5. Shi, X.; Song, W.; Wei, T.; Zhang, K.; Shao, Z. Improved CO tolerance of Pt nanoparticles on polyaniline-modified carbon for PEMFC anode. Fuel 2025, 382, 133239. [Google Scholar] [CrossRef]
  6. Wang, J.; Chen, X.; Du, T.; Liu, L.; Webley, P.A.; Kevin Li, G. Hydrogen production from low pressure coke oven gas by vacuum pressure swing adsorption. Chem. Eng. J. 2023, 472, 144920. [Google Scholar] [CrossRef]
  7. Xiao, J.; Mei, A.; Tao, W.; Ma, S.; Bénard, P.; Chahine, R. Hydrogen purification performance optimization of vacuum pressure swing adsorption on different activated carbons. Energies 2021, 14, 2450. [Google Scholar] [CrossRef]
  8. Zhu, X.; Shi, Y.; Li, S.; Cai, N. Two-train elevated-temperature pressure swing adsorption for high-purity hydrogen production. Appl. Energy 2018, 229, 1061–1071. [Google Scholar] [CrossRef]
  9. Zhu, X.; Shi, Y.; Li, S.; Cai, N. Elevated temperature pressure swing adsorption process for reactive separation of CO/CO2 in H2-rich gas. Int. J. Hydrogen Energy 2018, 43, 13305–13317. [Google Scholar] [CrossRef]
  10. Zafanelli, L.F.A.S.; Aly, E.; Henrique, A.; Rodrigues, A.E.; Mouchaham, G.; Silva, J.A.C. Green hydrogen recovery from natural gas grids by vacuum pressure swing adsorption. Ind. Eng. Chem. Res. 2024, 63, 6333–6346. [Google Scholar] [CrossRef]
  11. Vo, N.D.; Oh, D.H.; Kang, J.-H.; Oh, M.; Lee, C.-H. Dynamic-model-based artificial neural network for H2 recovery and CO2 capture from hydrogen tail gas. Appl. Energy 2020, 273, 115263. [Google Scholar] [CrossRef]
  12. Mihaylov, M.; Ivanova, E.; Zdravkova, V.; Andonova, S.; Drenchev, N.; Chakarova, K.; Kefirov, R.; Kukeva, R.; Stoyanova, R.; Hadjiivanov, K. Purification of hydrogen from CO with Cu/ZSM-5 adsorbents. Molecules 2021, 27, 96. [Google Scholar] [CrossRef] [PubMed]
  13. Baamran, K.; Al-Naddaf, Q.; Lawson, S.; Ali Rownaghi, A.; Rezaei, F. Kinetic process assessment of H2 purification over highly porous carbon sorbents under multicomponent feed conditions. Sep. Purif. Technol. 2023, 306, 122695. [Google Scholar] [CrossRef]
  14. Yang, T.; Zhan, C.; Fang, L.; Bénard, P.; Chahine, R.; Xiao, J. Improvement of temperature profiles using variable heat of adsorption in modeling H2/CO2 breakthrough experiments. Int. J. Energy Res. 2022, 46, 15099–15115. [Google Scholar] [CrossRef]
  15. Xiao, J.; Fang, L.; Bénard, P.; Chahine, R. Parametric study of pressure swing adsorption cycle for hydrogen purification using Cu-BTC. Int. J. Hydrogen Energy 2018, 43, 13962–13974. [Google Scholar] [CrossRef]
  16. Dehdari, L.; Xiao, P.; Gang Li, K.; Singh, R.; Webley, P.A. Separation of hydrogen from methane by vacuum swing adsorption. Chem. Eng. J. 2022, 450, 137911. [Google Scholar] [CrossRef]
  17. Brea, P.; Delgado, J.A.; Águeda, V.I.; Gutiérrez, P.; Uguina, M.A. Multicomponent adsorption of H2, CH4, CO and CO2 in zeolites NaX, CaX and MgX. Evaluation of performance in PSA cycles for hydrogen purification. Microporous Mesoporous Mater. 2019, 286, 187–198. [Google Scholar] [CrossRef]
  18. Silva, B.; Solomon, I.; Ribeiro, A.M.; Lee, U.H.; Hwang, Y.K.; Chang, J.-S.; Loureiro, J.M.; Rodrigues, A.E. H2 purification by pressure swing adsorption using CuBTC. Sep. Purif. Technol. 2013, 118, 744–756. [Google Scholar] [CrossRef]
  19. Delgado, J.A.; Agueda, V.I.; Uguina, M.A.; Sotelo, J.L.; Brea, P. Hydrogen recovery from off-gases with nitrogen-rich impurity by pressure swing adsorption using CaX and 5A zeolites. Adsorption 2015, 21, 107–123. [Google Scholar] [CrossRef]
  20. Divekar, S.; Arya, A.; Hanif, A.; Chauhan, R.; Gupta, P.; Nanoti, A.; Dasgupta, S. Recovery of hydrogen and carbon dioxide from hydrogen PSA tail gas by vacuum swing adsorption. Sep. Purif. Technol. 2021, 254, 117113. [Google Scholar] [CrossRef]
  21. Hong, S.-H.; Jung, M.Y.; Lee, C.-H. Performance and dynamic behavior of H2 layered-bed PSA processes using various activated carbons and zeolite LiX for steam methane reforming gas. Chem. Eng. J. 2023, 473, 144942. [Google Scholar] [CrossRef]
  22. Zhang, N.; Bénard, P.; Chahine, R.; Yang, T.; Xiao, J. Optimization of pressure swing adsorption for hydrogen purification based on Box-Behnken design method. Int. J. Hydrogen Energy 2021, 46, 5403–5417. [Google Scholar] [CrossRef]
  23. Moon, D.-K.; Park, Y.; Oh, H.-T.; Kim, S.-H.; Oh, M.; Lee, C.-H. Performance analysis of an eight-layered bed PSA process for H2 recovery from IGCC with pre-combustion carbon capture. Energy Convers. Manag. 2018, 156, 202–214. [Google Scholar] [CrossRef]
  24. Li, C.; Yuan, C.; Yang, T.; Luo, H.; Chahine, R.; Tong, L.; Yuan, Y.; Xiao, J. Breakthrough curves of H2/CO2 adsorptions on CuBTC and MIL-125(Ti)_NH2 predicted by empirical correlations and deep neural networks. Sep. Purif. Technol. 2025, 354, 129450. [Google Scholar] [CrossRef]
  25. Jamali, S.; Mofarahi, M.; Rahideh, H.; Lee, C.-H. Cu-BTC adsorbent for H2 purification: A study on adsorption kinetics and PSA performance. Sep. Purif. Technol. 2025, 360, 131095. [Google Scholar] [CrossRef]
  26. Park, Y.; Ju, Y.; Park, D.; Lee, C.-H. Adsorption equilibria and kinetics of six pure gases on pelletized zeolite 13X up to 1.0 MPa: CO2, CO, N2, CH4, Ar and H2. Chem. Eng. J. 2016, 292, 348–365. [Google Scholar] [CrossRef]
  27. Park, Y.; Moon, D.-K.; Kim, Y.-H.; Ahn, H.; Lee, C.-H. Adsorption isotherms of CO2, CO, N2, CH4, Ar and H2 on activated carbon and zeolite LiX up to 1.0 MPa. Adsorption 2014, 20, 631–647. [Google Scholar] [CrossRef]
  28. Park, Y.; Kang, J.-H.; Moon, D.-K.; Jo, Y.S.; Lee, C.-H. Parallel and series multi-bed pressure swing adsorption processes for H2 recovery from a lean hydrogen mixture. Chem. Eng. J. 2021, 408, 127299. [Google Scholar] [CrossRef]
  29. Zafanelli, L.F.; Aly, E.; Henrique, A.; Rodrigues, A.E.; Silva, J.A. Dual-stage vacuum pressure swing adsorption for green hydrogen recovery from natural gas grids. Sep. Purif. Technol. 2025, 360, 130869. [Google Scholar] [CrossRef]
Figure 1. Adsorption isotherms of (a) CO2, (b) N2, (c) CO, and (d) H2 on AC and zeolite 13X at 293 K, 308 K, and 323 K (symbol: experimental data from Refs. [26,27]; line: TD DSL fitting).
Applsci 15 05505 g001
Figure 2. Breakthrough curves and residuals on (a) AC single-layer bed, (b) zeolite 13X single-layer bed, and (c) AC/zeolite 13X = 6:4 layered bed at 10 bar and 3 LSTP/min (full symbol: experimental data from Ref. [28]; line: simulation results; open symbol: residuals).
Applsci 15 05505 g002
Figure 3. Effect of feed pressure on the breakthrough curve of AC/zeolite 13X = 6:4 layered bed.
Applsci 15 05505 g003
Figure 4. Effect of feed flow rate on the breakthrough curve of AC/zeolite 13X = 6:4 layered bed.
Applsci 15 05505 g004
Figure 5. Effect of AC/zeolite 13X ratio on the breakthrough curve of AC/zeolite 13X layered bed.
Applsci 15 05505 g005
Figure 6. Schematic diagram of the PSA cycle model in Aspen Adsorption.
Applsci 15 05505 g006
Figure 7. Pressure variation in the adsorption bed in the 20th cycle (symbol: experimental data from Ref. [28]; line: simulation result).
Applsci 15 05505 g007
Figure 8. Variation in hydrogen purity and recovery obtained from the PSA cycle with the number of cycles (symbol: experimental data from Ref. [28]; line: simulation result).
Applsci 15 05505 g008
Figure 9. Influence of feed pressure on the purification of PSA.
Applsci 15 05505 g009
Figure 10. Influence of feed flow rate on the purification of PSA.
Applsci 15 05505 g010
Figure 11. Influence of AD time on the purification of PSA.
Applsci 15 05505 g011
Figure 12. Influence of P/F ratio on the purification of PSA.
Applsci 15 05505 g012
Figure 13. Influence of AC/zeolite 13X ratio on the purification of PSA.
Applsci 15 05505 g013
Table 1. LDF parameters, TD DSL parameters, and enthalpy of adsorption [28].
AdsorbateCO2N2H2CO
AC
w i [s−1]0.0500.2200.9000.350
k 1 [mol/kg]6.6118.755248.54.65
k 2 [kPa−1]1.04 × 10−78.75 × 10−71.38 × 10−73.27 × 10−6
k 3 [K]330617777651720
k 4 [mol/kg]0.0110.1210.0170.099
k 5 [kPa−1]7.76 × 10−72.74 × 10−61.06 × 10−112.24 × 10⁻⁷
k 6 [K]3300280570103390
H a d s [kJ/mol]−22.5−14.0−12.0−15.0
Zeolite 13X
w i [s−1]0.1200.6500.9000.750
k 1 [mol/kg]3.3952.7613.1012.708
k 2 [kPa−1]1.80 × 10−51.18 × 10−66.64 × 10−72.66 × 10−7
k 3 [K]2964195512942502
k 4 [mol/kg]2.3050.5471.1181.165
k 5 [kPa−1]6.30 × 10−97.33 × 10−83.82 × 10−53.92 × 10−7
k 6 [K]4291306452.413006
H a d s [kJ/mol]−32.2−18.0−8.00−21.0
Table 2. Characteristics of adsorbents and adsorption bed [28].
AdsorbentACZeolite 13X
Particle   radius ,   R p [m]0.00085–0.00120.0010–0.0011
Particle   density ,   ρ p [kg/m3]7501050
Bulk   density ,   ρ b [kg/m3]558751
Bed   porosity ,   ε b 0.2560.284
Total   porosity ,   ε t 0.6980.673
Heat   capacity ,   C p s [J/kg/K]15701100
Pore volume [cm3/g]0.460.39
Total surface area [m2/g]1306.4742.9
Adsorption bed
Length ,   L [m]1.0
Inside   diameter ,   d b [m]0.021
Thickness   of   wall ,   δ w [m]0.0022
Heat   capacity   of   wall ,   C p w [J/kg/K]502.8
Density   of   wall ,   ρ w [kg/m3]7830
Thermal   conductivity   of   wall ,   K w [W/m/K]16
Table 3. Cyclic configuration of the dual-bed, six-step PSA process.
Step123456
Bed1ADDPEBDPGPPEFP
Bed2PGPPEFPADDPEBD
Time [s]401025401025
Table 4. Summary of the results of parametric studies.
RunOperating ConditionBed ConfigurationPerformance
Feed Pressure [Bar]Feed Flow Rate [LSTP/min]AD Time [s]P/F RatioAC/Zeolite 13XPurity [%]Recovery [%]
1103400.36:497.0348.60
283400.36:496.9350.72
3123400.36:497.3646.29
4143400.36:497.9843.79
5102400.36:498.5935.52
6104400.36:494.2557.46
7105400.36:489.5660.40
8103300.36:498.0940.87
9103500.36:496.2054.14
10103600.36:495.9556.69
11103400.26:496.0254.58
12103400.46:497.9542.64
13103400.56:498.2736.57
14103400.310:086.2847.38
15103400.30:1095.0748.30
16103400.35:597.3848.79
17103400.33:797.1949.13
Disclaimer/Publisher’s Note: The statements, opinions and data contained in all publications are solely those of the individual author(s) and contributor(s) and not of MDPI and/or the editor(s). MDPI and/or the editor(s) disclaim responsibility for any injury to people or property resulting from any ideas, methods, instructions or products referred to in the content.

