Abstract
Comparing electroanalysis and chromatography, this study highlights that electroanalysis, specifically using a glassy carbon sensor (GCS), is the most appropriate choice for quantifying recalcitrant organic compounds. Octocrylene (OC), an organic compound commonly found in sunscreens, is of particular concern in swimming pool water monitoring, as its presence above legal limits poses health risks. OC quantification was performed using both high performance liquid chromatography (HPLC) and electroanalysis in sunscreen formulations and water matrices. The limits of detection (LODs) and quantification (LOQ) for OC were approximately 0.11 ± 0.01 mg L−1 and 0.86 ± 0.04 mg L−1 by electroanalysis, and 0.35 ± 0.02 mg L−1 and 2.86 ± 0.12 mg L−1 by HPLC. Electroanalysis successfully quantified OC in real sunscreen samples, and the results were comparable to those obtained by HPLC. The matrices tested—swimming pool water and distilled water (containing 0.002 M Cl−) contaminated with 0.4 ± 0.2 g L−1 of sunscreen (based on a maximum concentration in sunscreen and cosmetic formulations of 10%)—showed OC concentrations below 10% in the formulation, with no significant differences observed between the two techniques. GCS was further utilized to monitor OC degradation via anodic oxidation at current densities of 5 and 10 mA cm−2, using a boron-doped diamond (BDD) anode. The combined approach demonstrated high efficacy in both detecting and eliminating OC from various water matrices, making it a reliable and efficient alternative for environmental and water quality monitoring.
1. Introduction
Octocrylene (OC) is a common ingredient in cosmetics and sunscreens. It is a clear, colorless, greasy, and viscous liquid, synthesized through the reaction of 2-ethylhexyl cyanoacetate and benzophenone, forming an ester (Figure 1). The molecule’s acrylate segment features prolonged conjugation, allowing it to absorb UV-B and short-wave UV-A radiation (280–320 nm), thereby protecting the skin from direct DNA damage. Additionally, its ethylhexanol component, a fatty alcohol, provides emollient and water-resistant properties [1,2].
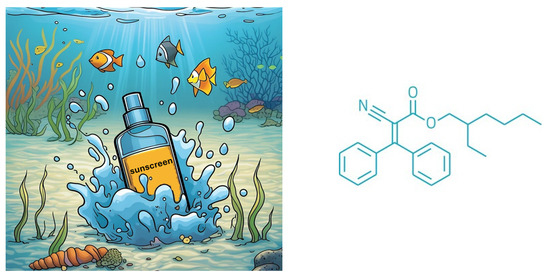
Figure 1.
Representation of water pollution due to sunscreens and the organic structure of octocrylene (OC).
OC is widely used in sunscreens and is highly persistent in aquatic environments due to its strong lipophilicity (log Kow = 6.88). It has been detected in a wide range of water sources, including swimming pools, tap water, treated and untreated sewage effluents, and surface waters such as rivers, lakes, and seas. Reported concentrations range from 12 to 38 μg L−1 [2,3,4]. The presence of UV filters like OC in aquatic environments has raised concerns about potential risks to human health and ecosystems (Figure 1).
UV filters, once introduced into aquatic systems, can bioaccumulate and transform into more toxic compounds. A study by the Oceanology Observatory of Banyuls-sur-Mer in southeast France highlights this concern, revealing that OC degrades into benzophenone [3,4]. This byproduct is banned in several countries due to its potential to disrupt hormones, affecting thyroid function, exhibiting estrogenic activity (stimulating ovulation in women), and inducing anti-androgenic effects (blocking testosterone) [5,6]. Additionally, exposure to UV radiation can cause benzophenone to induce DNA damage and structural alterations [7,8,9].
Beyond environmental concerns, OC can penetrate the skin and trigger allergic reactions, particularly in individuals with sensitive skin. A study by the U.S. Food and Drug Administration (FDA) found that certain sunscreen ingredients, including OC, can enter the bloodstream, raising concerns about bioaccumulation. This could potentially disrupt hormonal balance and even be transmitted from mother to child through breastfeeding [7].
Several instrumental methods are available for identifying and quantifying water pollutants, including gas chromatography, spectrophotometry, high-performance liquid chromatography (HPLC), chemiluminescence, potentiometry, and electrophoresis [10,11,12]. However, these techniques often require complex and time-consuming sample pre-treatment processes and can be costly to operate and maintain [13,14,15,16,17].
Despite these challenges, traditional analytical methods remain widely used due to their high sensitivity and precision in detecting pollutants in both treated and untreated water. They also help characterize contaminants based on their physicochemical and microbiological properties, ensuring compliance with regulatory standards.
In contrast, electroanalytical methods offer several distinct advantages, including rapid response, simple and cost-effective operation, time efficiency, high selectivity, and sensitivity [18,19,20,21]. Various sensors can be developed using carbonaceous materials, metals, nanostructures, and modified electrodes. Among these, GCSs have gained particular attention due to their unique carbon structure that provides lower adsorption, higher conductivity and sensitivity, lower background current, and ease of surface preparation and modification [22,23,24].
Periodic renewal of the sensor surface is crucial in electroanalysis to ensure the selective and sensitive detection of octocrylene (OC). In this study, we present a reliable electroanalytical method for detecting and quantifying OC in real water samples, recognizing that OC is a major UV filter component in Brazilian sunscreens. An analytical curve was constructed by correlating OC concentration with the voltammetric current response under defined experimental conditions. Using this method, OC was quantified in both synthetic and real samples to assess the sensitivity, selectivity, and reliability of the approach. Detection and quantification limits obtained through electroanalysis were compared with those from chromatographic analysis. Finally, the sensor was employed to monitor OC concentrations during the treatment of real water samples.
2. Materials and Methods
2.1. Reagents
Electrolyte solutions were prepared using analytical-grade sodium chloride and ethyl alcohol (both from Sigma-Aldrich, St. Louis, MO, USA), acetic acid (Merck, Darmstadt, Germany), boric acid (Synth, Osaka, Japan), along with distilled water. The OC sample (97% purity) was provided by the Cosmetics Laboratory at the Faculty of Pharmacy, Federal University of Rio Grande do Norte. Additionally, various sunscreens for kids (60 g) were purchased for analysis. Swimming pool water samples were collected from a 200-unit condominium in Natal (Brazil) following a recreation weekend, a period when persistent sunscreens components were likely to be present in the water. At this time, no active chlorine disinfectant species remained. It is important to note that the swimming pool water in this condominium was treated using an on-line chlorination/electrolyzer system, with NaCl as the reagent.
2.2. Preparation of Solutions
A stock solution of OC (1.0 × 10⁻³ M) was prepared by dissolving the solid compound in 10 mL of ethyl alcohol and 90 mL of water. This solution was used to construct analytical curves. For electroanalytical measurements, a 0.04 M Britton–Robinson (BR) buffer was prepared using acetic, boric, and phosphoric acids. NaCl solutions (approximately 0.002 M) were prepared using distilled water to mimic swimming pool water conditions after recreational use, reflecting the average residual chloride concentration, since NaCl serves as a precursor for chlorine disinfection.
Children’s sunscreens were purchased from a supermarket and labeled with codes (S1, S2, S3, S4, and S5). The product labels indicated the presence of OC but did not specify its concentration. Sunscreens with different sun protection factors (SPFs)—S1 (30), S2 (50), S3 (70), S4 (50), and S5 (50)—were selected to assess whether SPF had any influence on the OC content. Each NaCl solution and swimming pool water sample (S2) was spiked with 0.4 ± 0.2 g of sunscreen. It is important to note that OC is allowed as a UV absorber and filter in both the EU and the United States, with a maximum concentration of 10% in sunscreen and cosmetic formulations [3]. Therefore, 0.4 g of sunscreen in 100 mL of aqueous solution may contain up to 0.04 g of OC, corresponding to approximately 0.0011 M for each sample prepared (NaCl solutions and swimming pool water samples).
2.3. Instrumental Analytical Measurements
The liquid chromatography system used was an Ultimate 3000 HPLC (Thermo, Waltham, MA, USA) equipped with a C18 column and operated in isocratic mode with an 80/20 acetonitrile/water eluent. The system was coupled with a Dionex (Sunnyvale, CA, USA) model detector and operated using Thermo Scientific Chromeleon Chromatography Data System software (version 6.8) for data processing. This setup offered excellent separation performance, reliable operation, and maximum flexibility for a variety of applications.
Electrochemical measurements were conducted using an Autolab PGSTAT302N potentiostat/galvanostat (Metrohm, Zurich, Switzerland) controlled by GPES software (version 4.0). To construct the curves using differential pulse voltammetry (DPV), a three-electrode electrochemical cell was employed with a glassy carbon working electrode, Ag/AgCl (3M KCl) reference electrode, and platinum counter electrode (see Figure 2). The working electrode had an exposed geometric area of 3.14 ± 0.10 mm2 and was polished with polishing paper before and after each measurement. The electroanalysis parameters for OC were as follows: 10 mL of BR buffer solution (pH 6) as the electrolyte; initial potential: −0.8 V; final potential: −1.5 V (initial potential: −1.5 V, final potential: −0.8 V when anodic response was investigated); step potential: +0.005 V; modulation amplitude: +0.1 V; modulation time: 0.02 s; time interval: 0.5 s; and equilibrium time: 10 s.
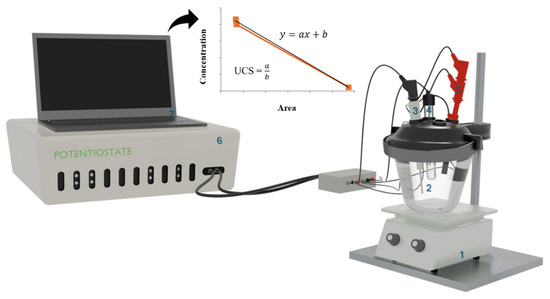
Figure 2.
The electroanalytical setup used for quantifying OC in NaCl solutions and swimming pool water samples by the standard addition method consisted of the following components: (1) stirring plate, (2) electrochemical cell, (3) counter electrode, (4) reference electrode, (5) working electrode, (6) potentiostat/galvanostat, and (7) computer.
2.4. Procedure for Measuring OC Using the GCS
For OC determination, an analytical curve was constructed by measuring the current peak intensity as a function of analyte concentration. Ten points were obtained by adding known amounts of a 0.01 M stock OC solution to 10 mL of BR buffer (0.5 M H2SO4). Before each measurement, the GCS surface was immersed in the electrolyte for 10 min. All experiments used to construct the analytical curves (via chromatographic and electrochemical methods) were performed in duplicate under ambient conditions and following the experimental procedures outlined in Section 2.3.
OC quantification in NaCl solutions and swimming pool water samples was carried out using the standard addition method to minimize potential matrix effects. Known volumes of a stock OC solution were added to the samples (chloride solutions or water matrices), generating three additional data points. Experiments were performed in quintuplicate to reduce experimental error, ensuring a confidence level greater than 95% for all measurements. Only the most reliable data set was selected for analysis.
2.5. Water Matrix Treatment
Anodic oxidation technology was employed as a water treatment process at the laboratory scale. The experiments were conducted using an electrochemical flow cell, which contained stainless steel (SS) and boron-doped diamond (BDD) electrodes as the cathode and anode, respectively. The system was connected to a 2 L storage solution tank. A power supply (MINIPA MPL-3305M) was used to apply current densities of 5 and 10 mA cm−2 for 180 min, with samples withdrawn at predetermined intervals.
The BDD circular plate, purchased from Metakem GmbH (Usingen, Germany), had an active surface area of 69.4 ± 0.5 cm2. The electrode gap between the SS and BDD was approximately 1.7 ± 0.5 cm, with only one side of the BDD electrode exposed to the solution. A peristaltic pump, with a flow rate of approximately 19 L h−1, was used to circulate 2 L of OC-contaminated water through the reaction compartment at room temperature during each experiment.
3. Results and Discussion
The sensitivity of the GCS was evaluated using differential pulse voltammetry (DPV) by recording both anodic and cathodic scans. Due to the chemical structure of OC, its functional groups can undergo oxidation or reduction. However, the anodic DPV profile showed no significant voltammetric current signal. In contrast, the cathodic scan revealed a prominent current peak at −1.13 V, indicating a strong reductive interaction between OC and the GCS surface (Figure 3). This behavior aligns with findings from previous studies [25,26].
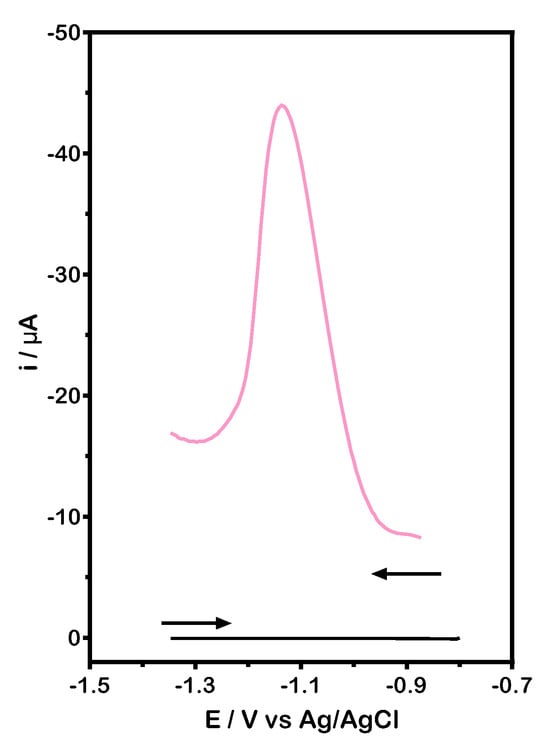
Figure 3.
DPV profile recorded in BR buffer (0.04 M, pH 6.0): (black line) blank; (pink line) 1.00 ± 0.15 mg L−1 of OC in BR buffer. Experimental conditions as described in the experimental section.
To assess the dynamic and linear ranges, calibration plots were generated over a broad concentration range using DPV and HPLC methods (Figure 4). The data clearly showed that the slope gradually decreased until reaching an asymptotic value, following the expected linear trend at lower concentration levels. For electroanalysis, the calibration plot was linear between 0.09 ± 0.01 and 1.08 ± 0.06 mg L−1 (Figure 4a), while for chromatography, it was linear between 1.00 and 5.00 mg L−1 (Figure 4b). However, repeatability decreased at lower concentration levels.
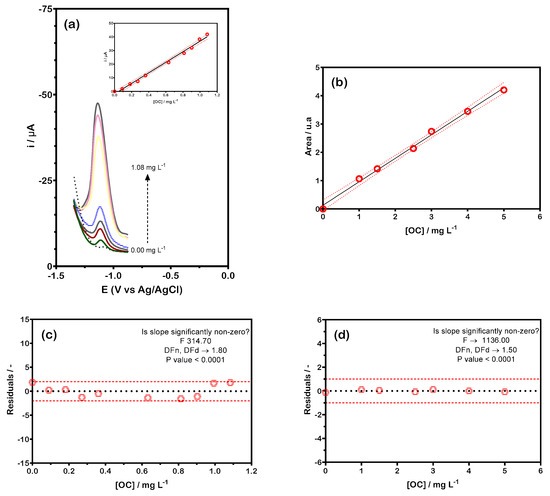
Figure 4.
OC calibration curves: (a) DPV profiles recorded in BR buffer (0.04 M, pH 6.0) for various OC concentrations: 0.00; 0.09; 0.18; 0.27; 0.36; 0.63; 0.81; 0.90; 0.99, and 1.08 mg L−1; inset: current peak intensity as a function of OC concentration; (b) chromatographic responses recorded in BR buffer (0.04 M, pH 6.0) for OC concentrations: 0.00; 1.00; 1.50; 2.50; 3.00; 4.00, and 6.00 mg L−1; (c) weighted residuals from electroanalytic measurements; (d) weighted residuals from chromatographic responses.
Using the GCS, multiple analytical curves were constructed, with peak intensity measured as a function of analyte concentration. The electroanalysis results yielded the following calibration equation (Equation (1)):
(n = 10, R2 = 0.9952, P = 95%) as shown in the inset of Figure 4a. Similarly, the chromatography data produced the following calibration equation (Equation (2)):
(n = 7, R2 = 0.9964, P = 95%) as shown in Figure 4b. Furthermore, the regression residuals (Figure 4c,d) displayed a random distribution around zero, visually confirming the absence of significant nonlinearity in either method. Notably, the calibration curves remained consistent across different days, demonstrating their reproducibility.
i/μA = (31.77 ± 4.13) × [OC] mg L−1 − (1.84 ± 1.83)
i/μA = (0.83 ± 0.06) × [OC] mg L−1 − (0.14 ± 0.19)
Additionally, the regression standard deviation method [27] was used to determine the limit of detection (LOD), following Equation (3):
where b represents the slope of the calibration plot, and Sy/x is the residual standard deviation. This approach minimizes false positive and false negative errors (α = β = 0.05) in line with IUPAC recommendations [28] and prior research [27,28,29]. The LOD values were 0.11 ± 0.01 mg L−1 for electroanalysis and 0.86 ± 0.04 mg L−1 for HPLC. Similarly, the limit of quantification (LOQ) was estimated using Equation (4):
LOD = 3 × Sy/x/b
LOQ = 10 × Sy/x/b
The LOQ values were 0.35 ± 0.02 mg L−1 for electroanalysis and 2.86 ± 0.12 mg L−1 for HPLC.
These results indicate that the electroanalytic approach was more sensitive than HPLC, as it achieved LOD and LOQ values. Furthermore, when comparing the electroanalytical method’s performance with previously published studies (Table 1), the GCS demonstrated high accuracy and confidence in detecting and quantifying similar organic compounds in aqueous solutions.

Table 1.
Comparison of the electrode performances for electrochemical detection and quantification of OC.
Electroanalytical measurements confirmed the statistical significance of the linear regression model, as the calculated F-value (Fcal) of 314.70 exceeded the tabulated F-value (F5% (1.80)) of 238.90. Similarly, chromatographic results reinforced this finding, with an Fcal of 1136.00 surpassing the F5% (1.50) of 230.20. Additionally, both methods yielded an F ratio greater than 1.00, indicating strong statistical reliability. The regression model accounted for 99.64% of OC concentration variations in chromatography and 97.52% in electroanalysis, demonstrating the accuracy of both approaches.
3.1. Comparison Between Electroanalytic and Chromatographic Approaches for Quantifying OC in Different Sunscreen Samples Using the Standard Additions Method
As described earlier, all samples (NaCl solutions and swimming pool water) with a known amount of OC were analyzed using both HPLC and electroanalytic methods. The samples were prepared to achieve a concentration of 0.4 mg L−1, which is within established environmental limits and falls within the linear range of both methods [3,32,33]. The OC concentrations provided by the manufacturers of the sunscreens were compared with those determined through electroanalytical and chromatographic methods, as shown in Figure 5. It is worth noting that, while the sunscreen labels indicated the presence of OC, they did not provide quantitative information on its concentration. The amount of OC added to the solutions confirmed that it made up less than 10% of the total formulation.
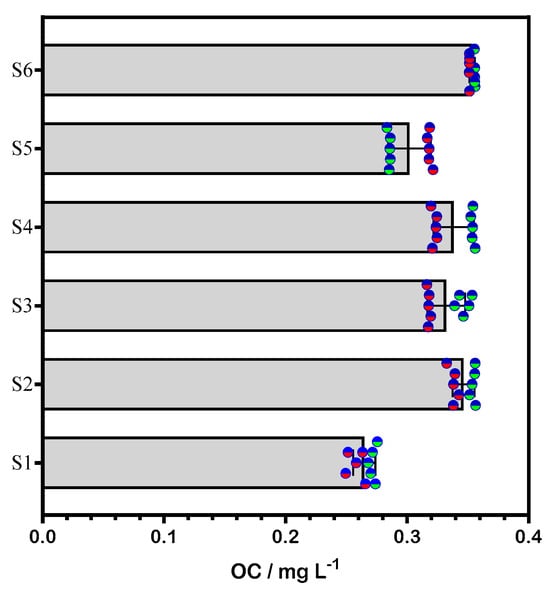
Figure 5.
Quantification of OC using HPLC (blue-green circles) and electroanalysis (blue-red circles) in various sunscreens (S1, S2, S3, S4, S5) and a known amount of OC in swimming pool water samples (S6). The bars represent the mean OC concentration obtained.
From an experimental perspective, the standard addition method effectively minimized matrix effects for both HPLC and electroanalysis. For HPLC, an increase in peak height was observed with rising OC concentration in sunscreens, consistent with previous studies [7,14,15,34]. In the case of electroanalysis using the GCS, the current response increased proportionally with OC concentration, unaffected by the sample composition. A statistical comparison of both methods revealed no significant differences at the 95% confidence level, confirming the reliability of both approaches [35,36,37,38,39].
When a real water matrix was used, no significant variations were found, indicating that the GCS could serve as an effective measuring tool. As shown in Figure 5, OC concentration values obtained from both chromatographic and electroanalytic methods were closely aligned, demonstrating that there were no discernible differences in their applicability for detecting and quantifying OC in sunscreen formulations. Based on these results, DPV analysis with the GCS proves to be a suitable method for determining OC concentration in swimming pool water.
3.2. Applicability of Electroanalysis and Chromatography for Determining OC Concentration During the Electrochemical Treatment of Different Water Matrices
Figure 6a,b illustrate the OC concentration decay over time during the electrochemical treatment of swimming pool water and NaCl solutions (0.002 M), respectively, using a BDD anode at current densities of 5 and 10 mA cm−2. As shown in both figures, the OC concentration measurements obtained by electroanalytic and chromatographic methods are in close agreement, with no significant differences observed between the data sets. The results indicate that OC pollution in water is effectively reduced even at low current densities. However, the decay in OC concentration becomes more pronounced over time when a current density of 10 mA cm−2 is applied. This behavior is consistent with previous studies [5,8,16], which suggest that the removal of OC is more efficient at higher current densities [40]. The results highlight that the extent of OC removal is dependent on the applied current density, with higher values leading to more efficient degradation.
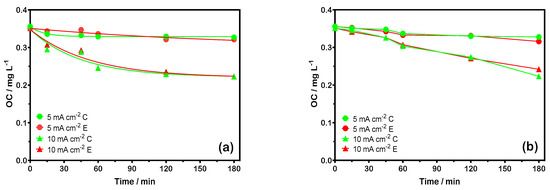
Figure 6.
Analysis of OC degradation at 5 and 10 mA cm−2 using BDD electrolysis via chromatography (C) and electroanalysis (E): (a) swimming pool water and (b) 0.002 M Cl− solutions.
The mechanism behind OC removal from water matrices involves the reaction of OC with electrochemically generated hydroxyl radicals (•OH) at the BDD electrode surface, and other oxidizing species produced by electrochemical processes, such as chloride-based mediators. This finding is supported by the existing literature [41,42], which demonstrates that OC is efficiently degraded through these oxidative processes when higher current densities are applied during electrochemical treatment.
As demonstrated in previous studies [43,44], electrochemical measurements in the presence and absence of chloride in water reveal distinct behaviors. In particular, the potential for the oxygen evolution reaction (OER) shifts toward less positive values when NaCl is added to the solutions. This shift is related to the chloride concentration in the aqueous matrix, which increases the ionic strength and thus the conductivity of the solution. This leads to higher current densities, which benefits electrochemical oxidation (EO) by reducing energy requirements.
Additionally, the observed shift in potential of the polarization curves suggests that active chlorine species [45]) are produced simultaneously with hydroxyl radicals [46]. This occurs under oxygen evolution conditions [46,47], as described in the following equations:
As illustrated in Figure 6, the degradation of OC was enhanced when a higher current density was applied due to the increased production of active chlorine species. The synergistic effect between hydroxyl radicals (•OH) electrogenerated at the anode surface (Equation (12)) and the electrochemically/chemically formed oxidizing species in the bulk solution (Equations (5)–(11)) contributes to the greater degradation of OC.
Considering the concentration of dissolved chloride (Cl−) in the swimming pool water and the electrochemical properties of the BDD anode, it is possible that higher current densities lead to the formation of chlorate (ClO3−) and perchlorate (ClO4−), along with the potential production of halogenated organic compounds. These reactions are feasible at high current densities, as reported by other studies [48]. However, to avoid the formation of these undesired and toxic species, it is crucial to work under controlled galvanostatic conditions. In this study, applying 5 and 10 mA cm−2 prevented the detection of these toxic species, highlighting the importance of selecting an appropriate current density for effective electrochemical treatment of real effluents [49].
4. Conclusions
This study explored the identification and quantification of OC using two analytical techniques: chromatography and electroanalysis. Calibration curves obtained by both methods showed high confidence and precision, indicating that electroanalysis, under the same conditions, is a reliable approach for detecting OC in both synthetic and real water samples —particularly when using a GCS sensor— without interference from other components in the water matrix. OC concentrations in sunscreen products were determined using the standard addition method to eliminate matrix effects. A statistical comparison of the two methods revealed no significant differences at the 95% confidence level. Additionally, OC concentrations were effectively reduced during electrochemical treatment, with minimal differences observed between the results of the two analytical techniques.
Finally, it is important to highlight that the electroanalytical protocol described here offers both advantages and limitations. On the positive side, it eliminates the need for an extraction procedure by employing an organic/inorganic solvent–electrolyte system, facilitating OC detection with a significant limit of detection (LOD). However, further studies are needed to investigate the potential interference from other sunscreen components, OC degradation byproducts, and other inorganic substances present in swimming pool water.
Author Contributions
Conceptualization, E.V.d.S., M.K.S.M. and L.G.A.C.; methodology, L.R.D.B.S. and M.K.S.M.; validation, L.G.A.C., L.R.D.B.S. and M.K.S.M.; formal analysis, L.G.A.C., L.R.D.B.S. and M.K.S.M.; investigation, S.F., L.R.D.B.S. and M.K.S.M.; resources, E.V.d.S. and C.A.M.-H.; data curation, S.F., L.R.D.B.S. and M.K.S.M.; writing—original draft preparation, L.R.D.B.S. and M.K.S.M.; writing—review and editing, S.F., E.V.d.S. and C.A.M.-H.; visualization, E.V.d.S.; supervision, E.V.d.S.; funding acquisition, E.V.d.S. and C.A.M.-H. All authors have read and agreed to the published version of the manuscript.
Funding
This research was funded by Conselho Nacional de Desenvolvimento Científico e Tecnológico, CNPq, (Brazil): 315879/2021-1, 403008/2022-0, 402736/2022-2, 408110/2022-8, 317075/2023-3, 421313/2023-4, 408782/2024-2.
Data Availability Statement
The original contributions presented in this study are included in the article. Further inquiries can be directed at the corresponding authors.
Acknowledgments
M.K.S.M. acknowledges the postdoctoral fellowships awarded by the Human Resources Program of the National Agency for Petroleum, Natural Gas and Biofuels—PRH-ANP/37—along with administrative and technical support.
Conflicts of Interest
Sergio Ferro is employed by Ecas4 Australia Pty Ltd. The company provides in-line electro-chlorination systems (www.ebooster.com.au). However, all authors declare that the research was conducted in the absence of any commercial or financial relationships that could be construed as potential conflicts of interest.
Abbreviations
The following abbreviations are used in this manuscript:
| BDD | Boron-Doped Diamond |
| BR | Britton–Robinson |
| DNA | Deoxyribonucleic acid |
| DPAdSV | Differential Pulse Adsorptive Stripping Voltammetry |
| DPV | Differential Pulse Voltammetry |
| FDA | U.S. Food and Drug Administration |
| HPLC | High Performance Liquid Chromatography |
| IUPAC | International Union of Pure and Applied Chemistry |
| LOD | Limit of Detection |
| LOQ | Limit of Quantification |
| OC | Octocrylene |
| SS | Stainless Steel |
| SWV | Square Wave Voltammetry |
| UV | Ultraviolet |
References
- Medici, A.; Saviano, L.; Siciliano, A.; Libralato, G.; Guida, M.; Previtera, L.; Di Fabio, G.; Zarrelli, A. Octocrylene: From sunscreens to the degradation pathway during chlorination processes: Formation of byproducts and their ecotoxicity assessment. Molecules 2022, 27, 5286. [Google Scholar] [CrossRef] [PubMed]
- De Groot, A.C.; Roberts, D.W. Contact and photocontact allergy to octocrylene: A review. Contact Dermat. 2014, 70, 193–204. [Google Scholar] [CrossRef] [PubMed]
- Carvalhais, A.; Lippa, R.; Oliveira, I.B.; Di Lorenzo, G.; Mieiro, C.; Pacheco, M. Effects of the UV filter octocrylene and its degradation product benzophenone on pacific oyster (Magallana gigas) larvae: A call for reassessment of environmental hazards. Toxics 2025, 13, 177. [Google Scholar] [CrossRef]
- Wu, D.; Zhang, R.; Lu, G.; Lin, Q.; Liu, F.; Li, Y. Degradation of octocrylene using combined ozonation and electrolysis process: Optimization by response surface methodology. Clean Soil Air Water 2017, 45, 1500664. [Google Scholar] [CrossRef]
- Downs, C.A.; Dinardo, J.C.; Stien, D.; Rodrigues, A.M.S.; Lebaron, P. Benzophenone accumulates over time from the degradation of Octocrylene in commercial sunscreen products. Chem. Res. Toxicol. 2021, 34, 1046–1054. [Google Scholar] [CrossRef]
- Oceanological Observatory of Banyuls-sur-Mer (OOB). Available online: https://www.obs-banyuls.fr/en/oob.html (accessed on 27 March 2025).
- Hudson-Davis, M.L.; Wong, G.R.; London-Adeoshun, L.A.; Staake, M.A.; Wu, Y.; Walker, J.A.; Gamallo-Herrera, E.; Gogley, J. Identification and Quantitation of Oxybenzone, Octocrylene, Avobenzone, Octinoxate, Homosalate and Octisalate in Sunscreen Products by High Performance Liquid Chromatography-Diode Array Detection (HPLC-DAD) (CARTS No. IR01925). Available online: https://www.fda.gov/media/169773/download (accessed on 8 May 2025).
- Valdez-Carrillo, M.; Abrell, L.; Ramírez-Hernández, J.; Reyes-López, J.A.; Carreón-Diazconti, C. Pharmaceuticals as emerging contaminants in the aquatic environment of Latin America: A review. Environ. Sci. Pollut. Res. 2020, 27, 44863–44891. [Google Scholar] [CrossRef]
- Monteiro-Riviere, N.A.; Wiench, K.; Landsiedel, R.; Schulte, S.; Inman, A.O.; Riviere, J.E. Safety Evaluation of sunscreen formulations containing titanium dioxide and zinc oxide nanoparticles in UV-B sunburned skin: An in vitro and in vivo study. Toxicol. Sci. 2011, 123, 264–280. [Google Scholar] [CrossRef]
- Fan, Y.; Liu, J.H.; Lu, H.T.; Zhang, Q. Electrochemical behavior and voltammetric determination of paracetamol on nafion/TiO2–graphene modified glassy carbon electrode. Colloids Surf. B Biointerfaces 2011, 85, 289–292. [Google Scholar] [CrossRef]
- Tyszczuk-Rotko, K.; Bȩczkowska, I.; Wójciak-Kosior, M.; Sowa, I. Simultaneous voltammetric determination of paracetamol and ascorbic acid using a boron-doped diamond electrode modified with nafion and lead films. Talanta 2014, 129, 384–391. [Google Scholar] [CrossRef]
- Tefera, M.; Geto, A.; Tessema, M.; Admassie, S. Simultaneous determination of caffeine and paracetamol by square wave voltammetry at poly(4-amino-3-hydroxynaphthalene sulfonic acid)-modified glassy carbon electrode. Food Chem. 2016, 210, 156–162. [Google Scholar] [CrossRef]
- Chapman, D. Water Quality Assessments—A Guide to the Use of Biota, Sediments and Water in Environmental Monitoring; Chapter 2: Strategies for water quality assessment, 2nd ed.; Taylor & Francis: New York, NY, USA, 1996. [Google Scholar]
- Mokh, S.; Nassar, R.; Berry, A.; El Khatib, M.; Doumiati, S.; Taha, M.; Ezzeddine, R.; Al Iskandarani, M. Chromatographic methods for the determination of a broad spectrum of UV filters in swimming pool water. Environ. Sci. Pollut. Res. 2022, 29, 18605–18616. [Google Scholar] [CrossRef] [PubMed]
- Locatelli, M.; Sciascia, F.; Cifelli, R.; Malatesta, L.; Bruni, P.; Croce, F. Analytical methods for the endocrine disruptor compounds determination in environmental water samples. J. Chromatogr. A 2016, 1434, 1–18. [Google Scholar] [CrossRef] [PubMed]
- Sharma, M.; Sharma, A. A review on nature-based sunscreen agents. IOP Conf. Ser. Earth Environ. Sci. 2023, 1110, 012047. [Google Scholar] [CrossRef]
- Gandar, A.; Noguer, T.; Ekomo, V.M.; Rodrigues, A.M.S.; Stien, D.; Calas-Blanchard, C.; Ekomo, M. Spectroelectrochemistry as a new tool for the quantification of UV filters in sun creams. Talanta 2022, 250, 123728. [Google Scholar] [CrossRef]
- Mallah, M.A.; Sherazi, S.T.H.; Bhanger, M.I.; Mahesar, S.A.; Bajeer, M.A. A rapid Fourier-Transform Infrared (FTIR) spectroscopic method for direct quantification of paracetamol content in solid pharmaceutical formulations. Spectrochim. Acta Part A Mol. Biomol. Spectrosc. 2015, 141, 64–70. [Google Scholar] [CrossRef]
- El Bouabi, Y.; Farahi, A.; Labjar, N.; El Hajjaji, S.; Bakasse, M.; El Mhammedi, M.A. Square wave voltammetric determination of paracetamol at chitosan-modified carbon paste electrode: Application in natural water samples, commercial tablets and human urines. Mater. Sci. Eng. C 2016, 58, 70–77. [Google Scholar] [CrossRef]
- Khaskheli, A.R.; Fischer, J.; Barek, J.; Vyskočil, V.; Sirajuddin; Bhanger, M.I. Differential pulse voltammetric determination of paracetamol in tablet and urine samples at a micro-crystalline natural graphite–polystyrene composite film modified electrode. Electrochim. Acta 2013, 101, 238–242. [Google Scholar] [CrossRef]
- Monteiro, M.K.S.; Santos, E.C.M.M.; Silva, D.R.; Martínez-Huitle, C.A.; dos Santos, E.V. Simultaneous determination of paracetamol and caffeine in pharmaceutical formulations and synthetic urine using cork-modified graphite electrodes. J. Solid State Electrochem. 2020, 24, 1789–1800. [Google Scholar] [CrossRef]
- Murugan, E.; Dhamodharan, A. Separate and simultaneous determination of vanillin, theophylline and caffeine using molybdenum disulfide embedded polyaniline/graphitic carbon nitrite nanocomposite modified glassy carbon electrode. Diam. Relat. Mater. 2021, 120, 108684. [Google Scholar] [CrossRef]
- Nguyen, L.D.; Doan, T.C.D.; Huynh, T.M.; Nguyen, V.N.P.; Dinh, H.H.; Dang, D.M.T.; Dang, C.M. An electrochemical sensor based on polyvinyl alcohol/chitosan-thermally reduced graphene composite modified glassy carbon electrode for sensitive voltammetric detection of lead. Sens. Actuators B Chem. 2021, 345, 130443. [Google Scholar] [CrossRef]
- Okutan, M.; Boran, F.; Alver, E.; Asan, A. One-pot synthesis of graphene-ZrO2 nanocomposite: A novel modified glassy carbon electrode for the detection of caffeine in beverage samples. Mater. Chem. Phys. 2022, 280, 125846. [Google Scholar] [CrossRef]
- Medeiros de Araújo, D.; do Nascimento Brito, C.; Denise Sales de Oliveira, S.; Ribeiro da Silva, D.; Martínez-Huitle, C.A.; Flavio Soares Aragão, C. Platinum sensor for quantifying caffeine in drug formulations. Curr. Pharm. Anal. 2014, 10, 231–238. [Google Scholar] [CrossRef]
- Júnior, J.B.G.; Araujo, T.A.; Trindade, M.A.G.; Ferreira, V.S. Electroanalytical determination of the sunscreen agent octocrylene in cosmetic products. Int. J. Cosmet. Sci. 2012, 34, 91–96. [Google Scholar] [CrossRef] [PubMed]
- Horwitz, W. Evaluation of analytical methods used for regulation of foods and drugs. Anal. Chem. 1982, 54, 67A. [Google Scholar] [CrossRef]
- Wood, R. How to validate analytical methods. TrAC Trends Anal. Chem. 1999, 18, 624–632. [Google Scholar] [CrossRef]
- González, A.G.; Herrador, M.A.; Asuero, A.G. Intra-laboratory testing of method accuracy from recovery assays. Talanta 1999, 48, 729–736. [Google Scholar] [CrossRef]
- Sunyer, A.; González-Navarro, A.; Serra-Roig, M.P.; Serrano, N.; Díaz-Cruz, M.S.; Díaz-Cruz, J.M. First application of carbon-based screen-printed electrodes for the voltammetric determination of the organic UV filters oxybenzone and octocrylene. Talanta 2019, 196, 381–388. [Google Scholar] [CrossRef]
- Ferreira, V.S.; Júnior, J.B.G.; Oliveira, C.M.S.C.; Takeuchi, R.M.; Santos, A.L.; Trindade, M.A.G. Voltammetric analysis of sun-block preparations containing octocrylene and its association with 2-hydroxy-4-methoxybenzophenone and octyl methoxycinnamate. Microchem. J. 2013, 106, 378–383. [Google Scholar] [CrossRef]
- Downs, C.A.; Diaz-Cruz, M.S.; White, W.T.; Rice, M.; Jim, L.; Punihaole, C.; Dant, M.; Gautam, K.; Woodley, C.M.; Walsh, K.O.; et al. Beach showers as sources of contamination for sunscreen pollution in marine protected areas and areas of intensive beach tourism in Hawaii, USA. J. Hazard. Mater. 2022, 438, 129546. [Google Scholar] [CrossRef]
- Esbenshade, J.L.; Cardoso, J.C.; Zanoni, M.V.B. Removal of sunscreen compounds from swimming pool water using self-organized TiO2 nanotubular array electrodes. J. Photochem. Photobiol. A Chem. 2010, 214, 257–263. [Google Scholar] [CrossRef]
- Bratkovics, S.; Sapozhnikova, Y. Determination of seven commonly used organic UV filters in fresh and saline waters by Liquid Chromatography-Tandem Mass Spectrometry. Anal. Methods 2011, 3, 2943–2950. [Google Scholar] [CrossRef]
- Karimi-Maleh, H.; Moazampour, M.; Ahmar, H.; Beitollahi, H.; Ensafi, A.A. A Sensitive nanocomposite-based electrochemical sensor for voltammetric simultaneous determination of isoproterenol, acetaminophen and tryptophan. Measurement 2014, 51, 91–99. [Google Scholar] [CrossRef]
- Yu, Q.; Zou, J.; Xiong, Q.; Peng, G.; Gao, F.; Fan, G.; Chen, S.; Lu, L. Electrochemical sensor based on biochar decorated with gold clusters for sensitive determination of acetaminophen. Int. J. Electrochem. Sci. 2022, 17, 220438. [Google Scholar] [CrossRef]
- Lopes Neves, R.A.; Moreira Araujo, F.; Siqueira Pacheco, F.; Chevitarese Azevedo, G.; Costa Matos, M.A.; Camargo Matos, R. Electrochemical determination of sunscreen agents in cosmetics using square wave voltammetry. Electroanalysis 2019, 31, 496–503. [Google Scholar] [CrossRef]
- Da Silva, A.P.; Trindade, M.A.G.; Ferreira, V.S. Polarographic determination of sunscreen agents in cosmetic products in micellar media. Talanta 2006, 68, 679–685. [Google Scholar] [CrossRef]
- Monteiro, M.K.S.; Da Silva, D.R.; Quiroz, M.A.; Vilar, V.J.P.; Martínez-Huitle, C.A.; Dos Santos, E.V. Applicability of cork as novel modifiers to develop electrochemical sensor for caffeine determination. Materials 2021, 14, 37. [Google Scholar] [CrossRef]
- Abdulgani, I.; Escalona-Durán, F.; de Araújo, D.M.; dos Santos, E.V.; Barbosa Segundo, I.D.; Martínez-Huitle, C.A. The role of saline-related species in the electrochemical treatment of produced water using Ti/IrO2-Ta2O5 anode. J. Electroanal. Chem. 2022, 910, 116163. [Google Scholar] [CrossRef]
- Brito, L.R.D.; Ganiyu, S.O.; dos Santos, E.V.; Oturan, M.A.; Martínez-Huitle, C.A. Removal of antibiotic rifampicin from aqueous media by advanced electrochemical oxidation: Role of electrode materials, electrolytes and real water matrices. Electrochim. Acta 2021, 396, 139254. [Google Scholar] [CrossRef]
- Ganiyu, S.O.; Vieira dos Santos, E.; Tossi de Araújo Costa, E.C.; Martínez-Huitle, C.A. Electrochemical advanced oxidation processes (EAOPs) as alternative treatment techniques for carwash wastewater reclamation. Chemosphere 2018, 211, 998–1006. [Google Scholar] [CrossRef]
- Martínez-Huitle, C.A.; Ferro, S.; De Battisti, A. Electrochemical incineration in the presence of halides. Electrochem. Solid-State Lett. 2005, 8, D35. [Google Scholar]
- Martínez-Huitle, C.A.; Ferro, S.; Reyna, S.; Cerro-López, M.; De Battisti, A.; Quiroz, M.A. Electrochemical oxidation of oxalic acid in the presence of halides at boron doped diamond electrode. J. Braz. Chem. Soc. 2008, 19, 150–156. [Google Scholar] [CrossRef]
- Ganiyu, S.O.; Martínez-Huitle, C.A. Nature, mechanisms and reactivity of electrogenerated reactive species at thin-film boron-doped diamond (BDD) electrodes during electrochemical wastewater treatment. ChemElectroChem 2019, 6, 2379–2392. [Google Scholar] [CrossRef]
- Martínez-Huitle, C.A.; Rodrigo, M.A.; Sirés, I.; Scialdone, O. A critical review on latest innovations and future challenges of electrochemical technology for the abatement of organics in water. Appl. Catal. B Environ. 2023, 328, 122430. [Google Scholar] [CrossRef]
- Kapałka, A.; Fóti, G.; Comninellis, C. The importance of electrode material in environmental electrochemistry: Formation and reactivity of free hydroxyl radicals on boron-doped diamond electrodes. Electrochim. Acta 2009, 54, 2018–2023. [Google Scholar] [CrossRef]
- Cañizares, P.; Sáez, C.; Sánchez-Carretero, A.; Rodrigo, M.A. Synthesis of novel oxidants by electrochemical technology. J. Appl. Electrochem. 2009, 39, 2143–2149. [Google Scholar] [CrossRef]
- Lan, Y.; Coetsier, C.; Causserand, C.; Groenen Serrano, K. On the role of salts for the treatment of wastewater containing pharmaceuticals by electrochemical oxidation using a boron doped diamond anode. Electrochim. Acta 2017, 231, 309–318. [Google Scholar] [CrossRef]
Disclaimer/Publisher’s Note: The statements, opinions and data contained in all publications are solely those of the individual author(s) and contributor(s) and not of MDPI and/or the editor(s). MDPI and/or the editor(s) disclaim responsibility for any injury to people or property resulting from any ideas, methods, instructions or products referred to in the content. |
© 2025 by the authors. Licensee MDPI, Basel, Switzerland. This article is an open access article distributed under the terms and conditions of the Creative Commons Attribution (CC BY) license (https://creativecommons.org/licenses/by/4.0/).