Article

Shear Resistance Evolution of Geogrid Reinforced Expansive Soil Under Freeze–Thaw Cycles

1
School of Civil Engineering, Qingdao University of Technology, Qingdao 266520, China
2
BOSTD Geosynthetics Qingdao, Ltd., Qingdao 266000, China
*
Author to whom correspondence should be addressed.
Appl. Sci. 2025, 15(10), 5492; https://doi.org/10.3390/app15105492
Submission received: 10 April 2025 / Revised: 8 May 2025 / Accepted: 9 May 2025 / Published: 14 May 2025

Abstract

:
Expansive soils have significant characteristics of expansion by water absorption, contraction by water loss. Under the freeze–thaw (F-T) cycles, the engineering diseases are more significant, and the serious geotechnical engineering incidents are induced extremely easily. The aim is to investigate the mechanical response characteristics of geogrid-reinforced expansive soils (GRES) under F-T cycles. Based on a series of large-scale temperature-controlled triaxial tests, influencing factors were considered, such as the number of F-T cycles, the geogrid layers, and the confining pressure. The results showed that: (1) Friction between the expansive soil and geogrid and the geogrid’s embedded locking effect indirectly provided additional pressure, limited shear deformation. With the increase in reinforced layers, the stress–strain curve changed from a strain-softening to a strain-hardening type. (2) Elastic modulus, cohesion, and friction angle decreased significantly with increasing number of F-T cycles, whereas dynamic equilibrium was reached after six F-T cycles. (3) The three-layer reinforced specimens showed the best performance of F-T resistance, compared to the plain soil, the elastic modulus reduction amount decreases from 35.7% to 18.3%, cohesion from 24.5% to 14.3%, and friction angle from 7.6% to 4.5%. (4) A modified Duncan–Zhang model with the confining pressure, the F-T cycles, and the geogrid layers was proposed; the predicted values agreed with the measured values by more than 90%, which can be used as a prediction formula for the stress–strain characteristics of GRES under freeze–thaw cycling conditions. The research results can provide important theoretical support for the practical engineering design of GRES in cold regions.

1. Introduction

The world’s permafrost accounts for 24 percent of the land area and is widely distributed, exceeding 50 percent in some countries, such as Norway, Arctic islands, Greenland, and Antarctica, where it is particularly extensive [1]. In China, the permafrost distribution area is large, accounting for about 22% of the country’s land area, and the seasonal permafrost area accounts for about 48%. Under long-term F-T conditions, geotechnical engineering produces irreversible and persistent damage accumulation and leads to numerous engineering problems [2,3,4], for example, slope instability, severe deformation of the roadbed, and damage to retaining walls. Many studies have shown that F-T cycles change the pore structure characteristics of soils, and soil strength, modulus of elasticity, cohesion, and angle of internal friction decrease significantly with an increment of F-T cycles [5,6,7,8,9,10,11].
Expansive soil is a kind of high plasticity clay containing montmorillonite and ilmenite, and other strong hydrophilic clay minerals, which has multi-fracture and strong expansion and contraction, expansion by water absorption, and contraction by water loss. Repeated expansion and contraction deformations are very likely to occur under natural environmental conditions, which leads to the creation of disorganized cracks in the soil body, increasing the deformation of the soil body, and reducing the shear strength of the soil body. Expansive soils are widely distributed in many countries and cause great damage to civil engineering structures [12,13,14]. In the F-T cycle environment, the phase state of water in expansive soil is constantly changing between solid and liquid, and the difference in volume between equal mass ice and water can lead to deformation of the soil. In addition, expansive soils undergo expansion and contraction deformations due to expansion by water absorption and contraction by water loss during changes in the moisture phase state. It causes serious damage to the structural properties of the soil and also has a large impact on the physical and mechanical properties of expansive soils.
F-T cycles have a significant effect on the static and dynamic properties of the soil, which is detrimental to engineering safety issues. Therefore, the study of soil reinforcement techniques is extremely important. In ancient times, simple materials were mixed with soil to form simple reinforced earth materials [15]. Many scholars have used hair, straw, fiber, rubber and other materials to improve the mechanical properties of soils [16,17,18,19,20,21], which was found that the spatial confinement of the soil by the reinforcement material and the friction between the reinforcement and the soil could inhibit the pore enlargement caused by the F-T cycle and improve the F-T resistance of the soil.
Geogrid is widely used to reinforce roadbed, retaining walls, slopes and other projects, because of its uniform overall structure, high nodal tensile strength, high tensile modulus, good resistance to twisting, low strain, good creep resistance, which can restrain the lateral deformation of the soil body and improve the shear strength of the soil body through Friction between the expansive soil and geogrid and geogrid embedded locking effect [22,23,24]. Tiwari and Satyam [25] and Wu et al. [26] found that geogrids were able to increase soil shear strength by unconfined compressive strength tests and triaxial tests. Some scholars investigated the interfacial properties of the reinforced soil and the reinforcement mechanism by pullout tests and direct shear tests [27,28,29]. According to previous studies, the reinforced soil structures exceeded unreinforced soil structures under F-T cycles in indoor modeling tests [30,31].
In summary, expansive soils have the property of expansion by water absorption and contraction by water loss, which further produces irreversible and continuous damage accumulation under the influence of F-T cycles, increasing the risk to engineering. At the same time, geogrids have been widely used and achieved excellent results in actual engineering in cold regions. However, there are very few studies on the mechanical properties of GRES under F-T conditions. In this study, a series of large-scale triaxial tests were conducted to investigate the mechanical properties of GRES and their influencing factors under F-T cycles, and a modified Duncan–Zhang model was proposed to describe its stress–strain relationship.

2. Test Materials and Procedures
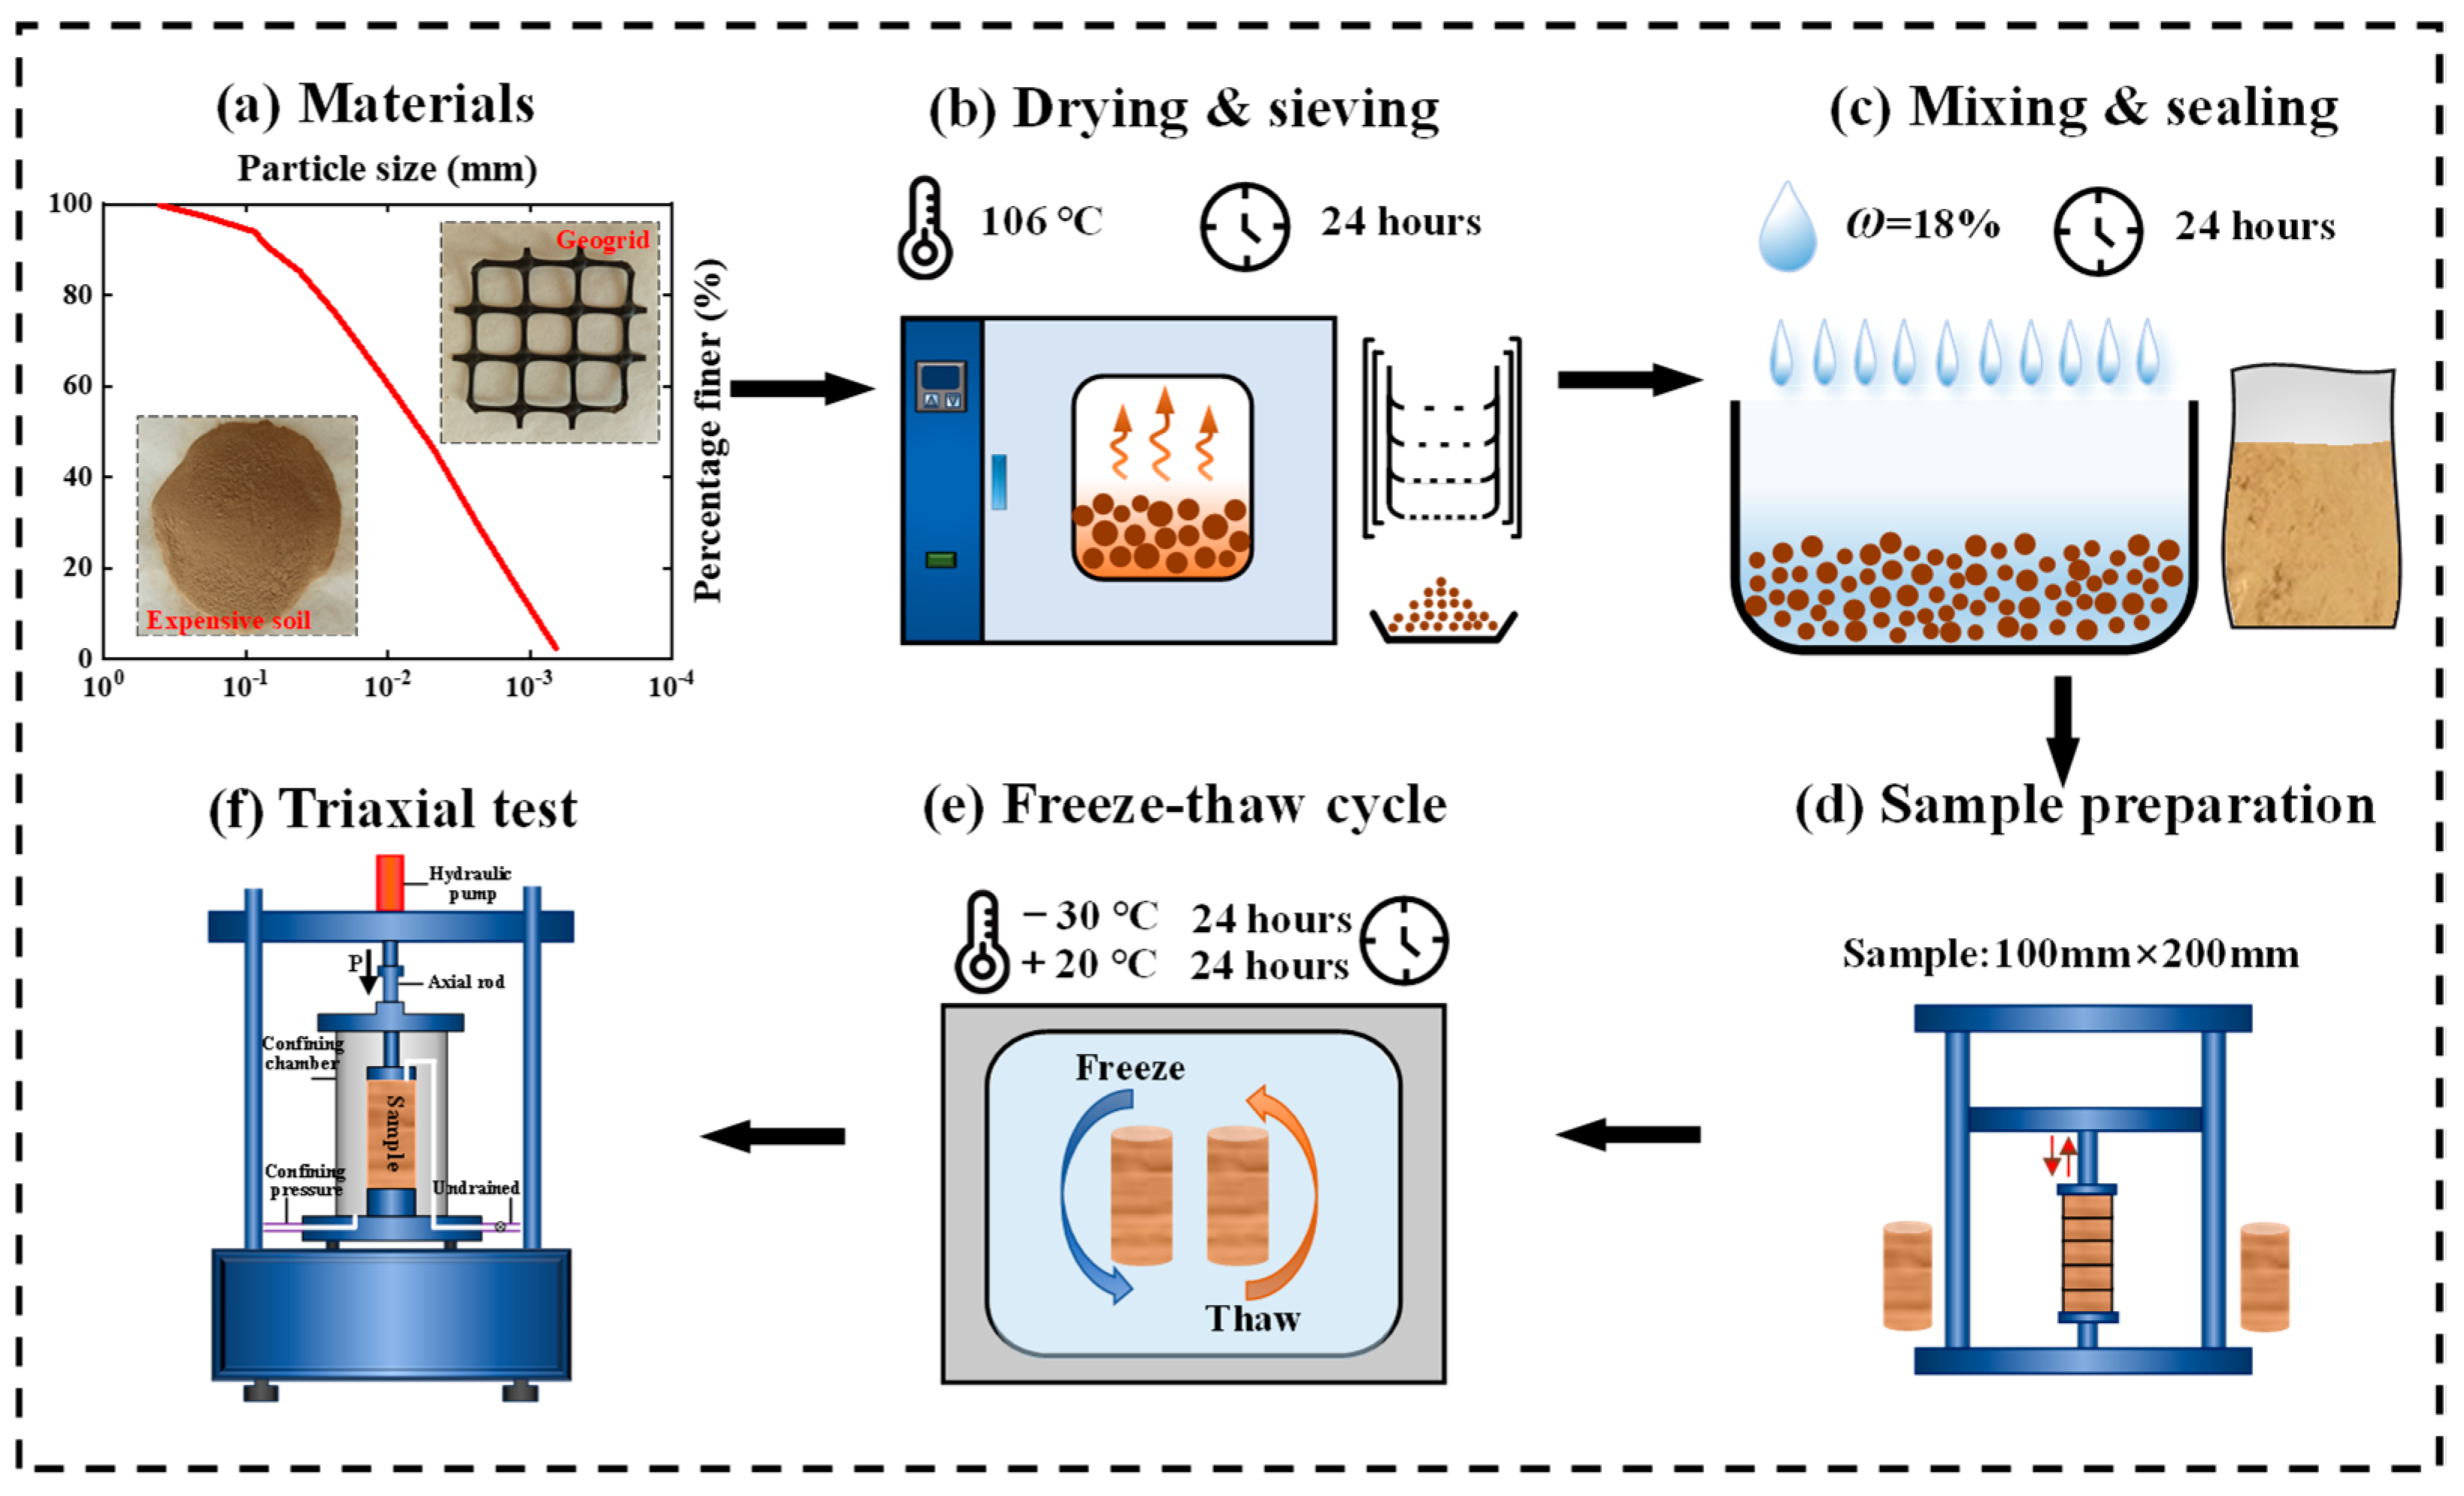
2.1. Materials

In this study, the soil was remolded, expansive soil and yellowish-brown in color. According to the Standard for Geotechnical Test Method [32], the basic physical properties such as grain size distribution, optimum moisture content, natural moisture content, and maximum dry density of the expansive soil were determined as shown in Table 1. The reinforcement material used in the test is polypropylene bi-directional geogrid, and its technical parameters are shown in Table 2, and its technical parameters are shown in Table 2. Expansive soil particle grading curves and materials used in the tests are shown in Figure 1a.

2.2. Test Procedure

2.2.1. Specimen Preparation
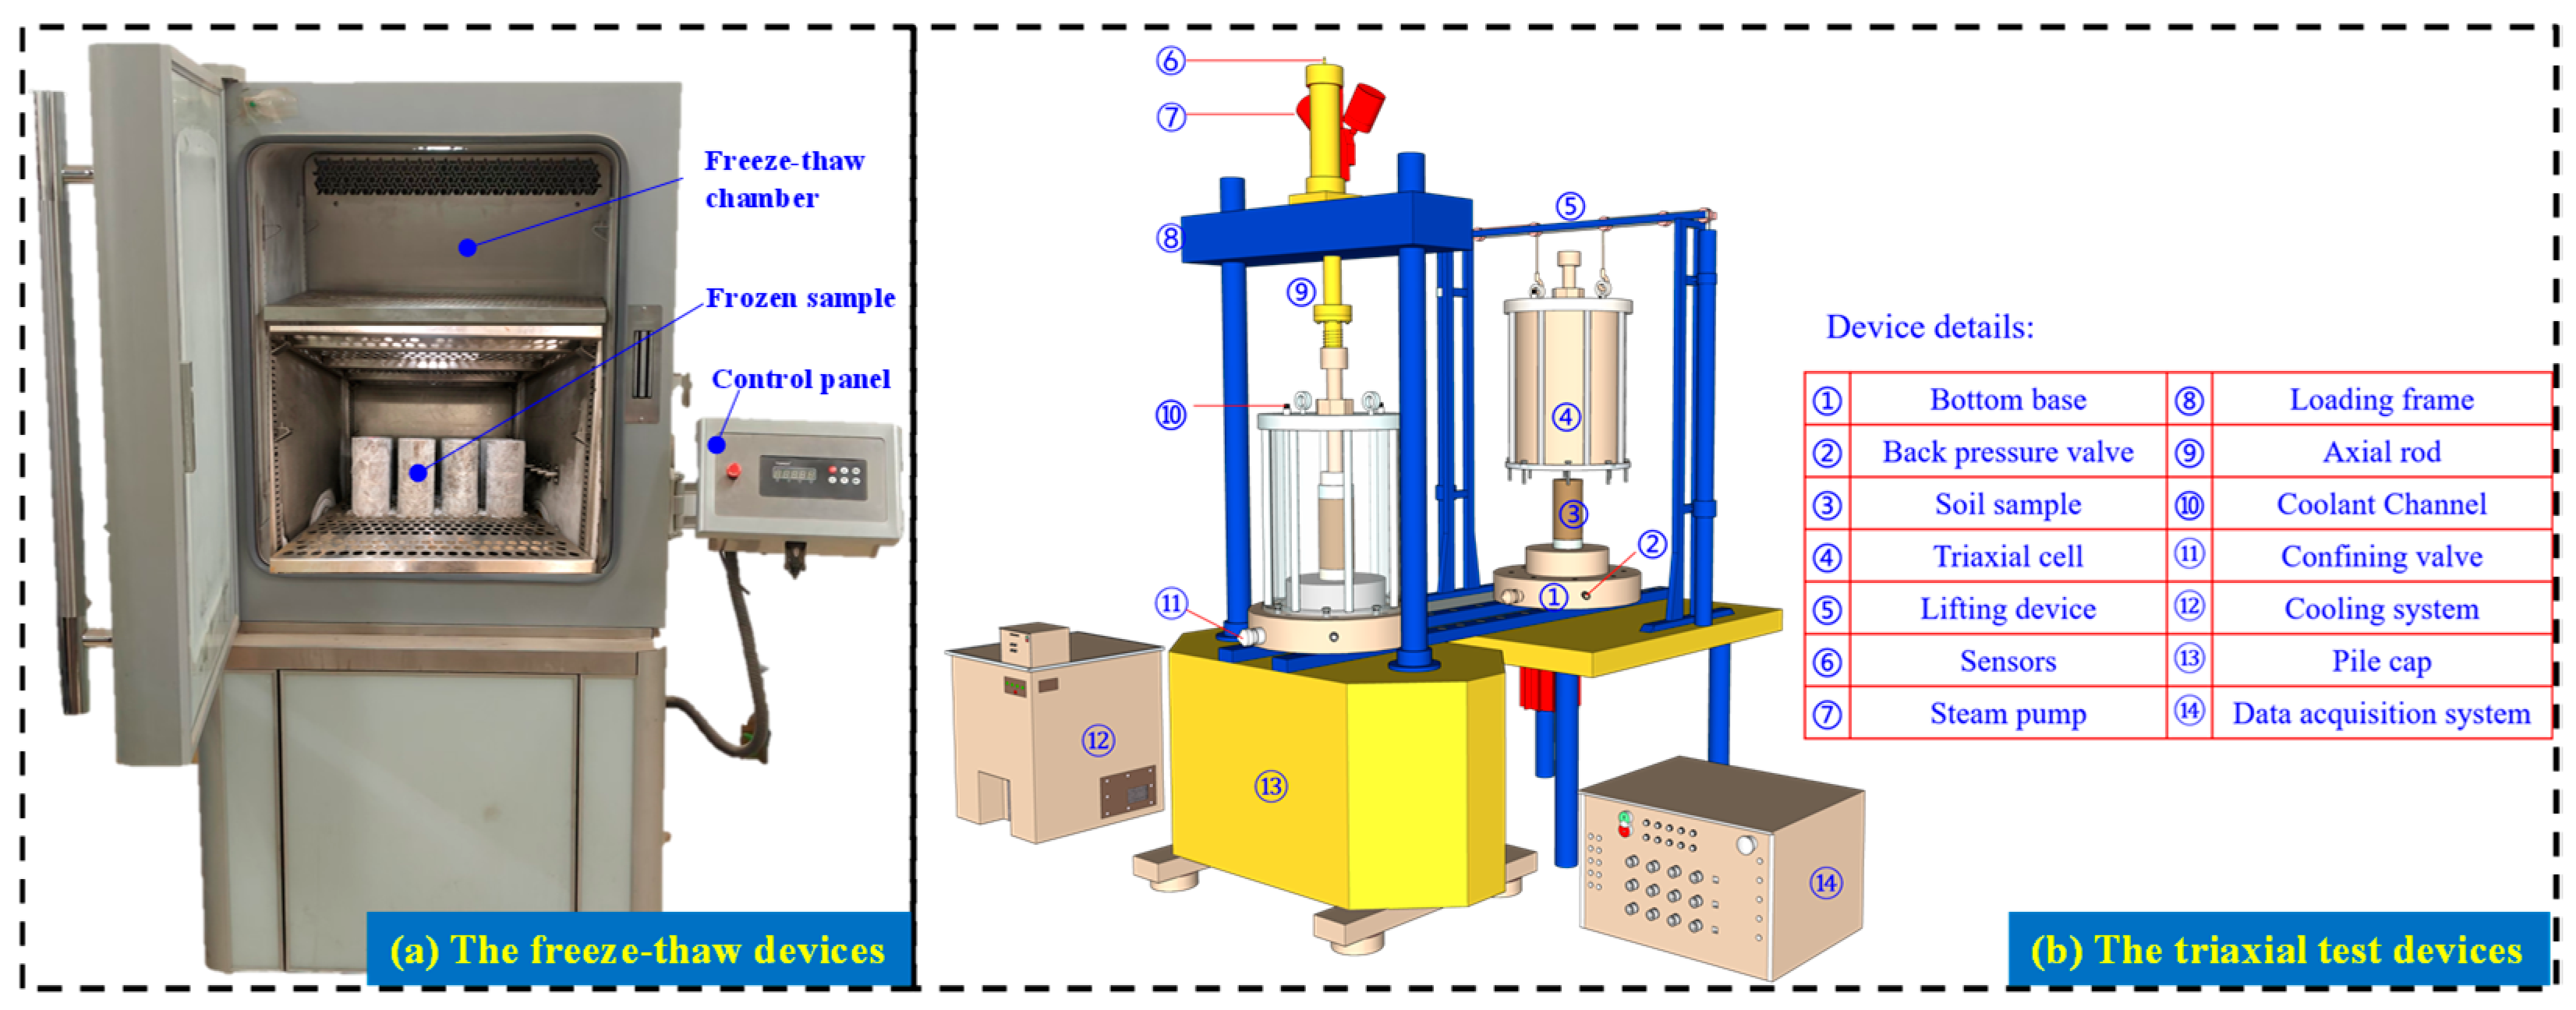
The cylindrical specimens were 100 mm in diameter and 200 mm in height. The geogrid reinforcement layers were embedded horizontally in different layer configurations (0, 1, 3, and 5 layers), and the spatial layout is shown in Figure 2. Prior to sample preparation, the expansive soil was dried at 105 °C for 24 h and then sprayed with distilled water through a gradual process in order to achieve a predetermined moisture content. During the spraying process, the water–soil mixture was stirred and homogenized to prevent localized moisture concentration. The mixed material was then sealed in a humidified container for 24 h of equilibration to ensure uniform moisture distribution. Final compaction was carried out by layering in layers and surface planning between layers to enhance structural integrity, as shown in Figure 1b–d.

2.2.2. F-T Cycle

This test adopts F-T cycle test chamber (TMS9018-250, Zhejiang Tomos Technology Co., LTD, Zhejiang, China) to carry out the F-T cycle of the specimen; the controllable temperature range is from −40 °C to +60 °C, and the temperature accuracy is ±1 °C. According to previous scholars’ freezing and thawing cycle setting temperature [33,34], in order to ensure that the specimen is completely frozen, and considering the large size of the specimen in this test, specimens were firstly frozen at −30 °C for 24 h and then allowed to thaw at 20 °C for 24 h. as shown in Figure 1e. All of these stages were considered as one cycle and sealed with plastic wrap and tape to prevent moisture loss. It can be seen that the maximum number of F-T cycles was about 10 times in previous test, and soil strength reaches a stable state after 5–7 F-T cycles [35,36]. Therefore, the maximum number of F-T cycles of 10 times was chosen in this test, which was carried out with 0, 1, 3, 6, and 10 F-T cycles. F-T cycle test devices are shown in Figure 3a.

2.2.3. Triaxial Test

The dynamic triaxial instrument produced by GDS Company in England is used for this test, as shown in Figure 3b, which is composed of triaxial chamber, loading system, and data collector. The triaxial testing system was configured with an upper limit confining pressure of 4 MPa and peak axial load capacity of 100 kN, featuring a measurement precision of 0.05%. Specimens underwent consolidated undrained (CU) testing protocols comprising two sequential phases: (1) 1 h isotropic consolidation under predetermined confinement stresses, followed by (2) axial shearing at a controlled displacement rate of 0.2 mm/min. The experiment employed automatic termination upon reaching the predefined axial strain threshold of 20%. The number of F-T cycles, reinforcement layers, and the confining pressure were considered in this test, which consisted of 60 specimens. The detailed test program is shown in Table 3.

3. Results and Discussion

3.1. Specimen Damage Pattern

Figure 4 shows the schematic diagram of the reinforcement effect of the specimen and the lateral deformation of the soil reinforced with different layers of geogrids. As shown in Figure 4b, both the plain expansive soil specimens and the reinforced specimens exhibit the typical shear dilatancy deformation, but the dilatancy deformation of the plain expansive soil is more obvious compared to that of the reinforced soil. Friction between the expansive soil and the geogrid and the geogrid’s embedded locking effect indirectly provided additional pressure, limited shear deformation (as shown in Figure 4a,b). For the one and three layers of GRES, the shear dilatancy deformation at the grid location is significantly smaller than at the other locations, which is in good agreement with the results of the previous study [37]. Five layers of GRES were compressed as a whole, with no obvious shear dilatancy deformation, which indicates that the geogrid reinforced impact zone appears to overlap with the increase in geogrid layers. These findings are in good agreement with the results of [38].
This study preliminarily determined that three-layer geogrid reinforcement effect is the most economical and reliable, our future research work will focus on the thickness of the reinforced impact zone through large-scale indoor pullout tests, direct shear tests and on-site tests of the reinforced soil interface, to provide a reliable basis for the application of geogrids in geotechnical engineering.

3.2. Stress–Strain Behavior

Figure 5a–f indicates the stress–strain curves of expansive soil specimens subjected to under confining pressures (100 kPa, 200 kPa, 300 kPa), F-T cycles (0, 1, 3, 6, 10), and geogrid layers (0, 1, 3, 5). As shown in Figure 5a–f:
(1)
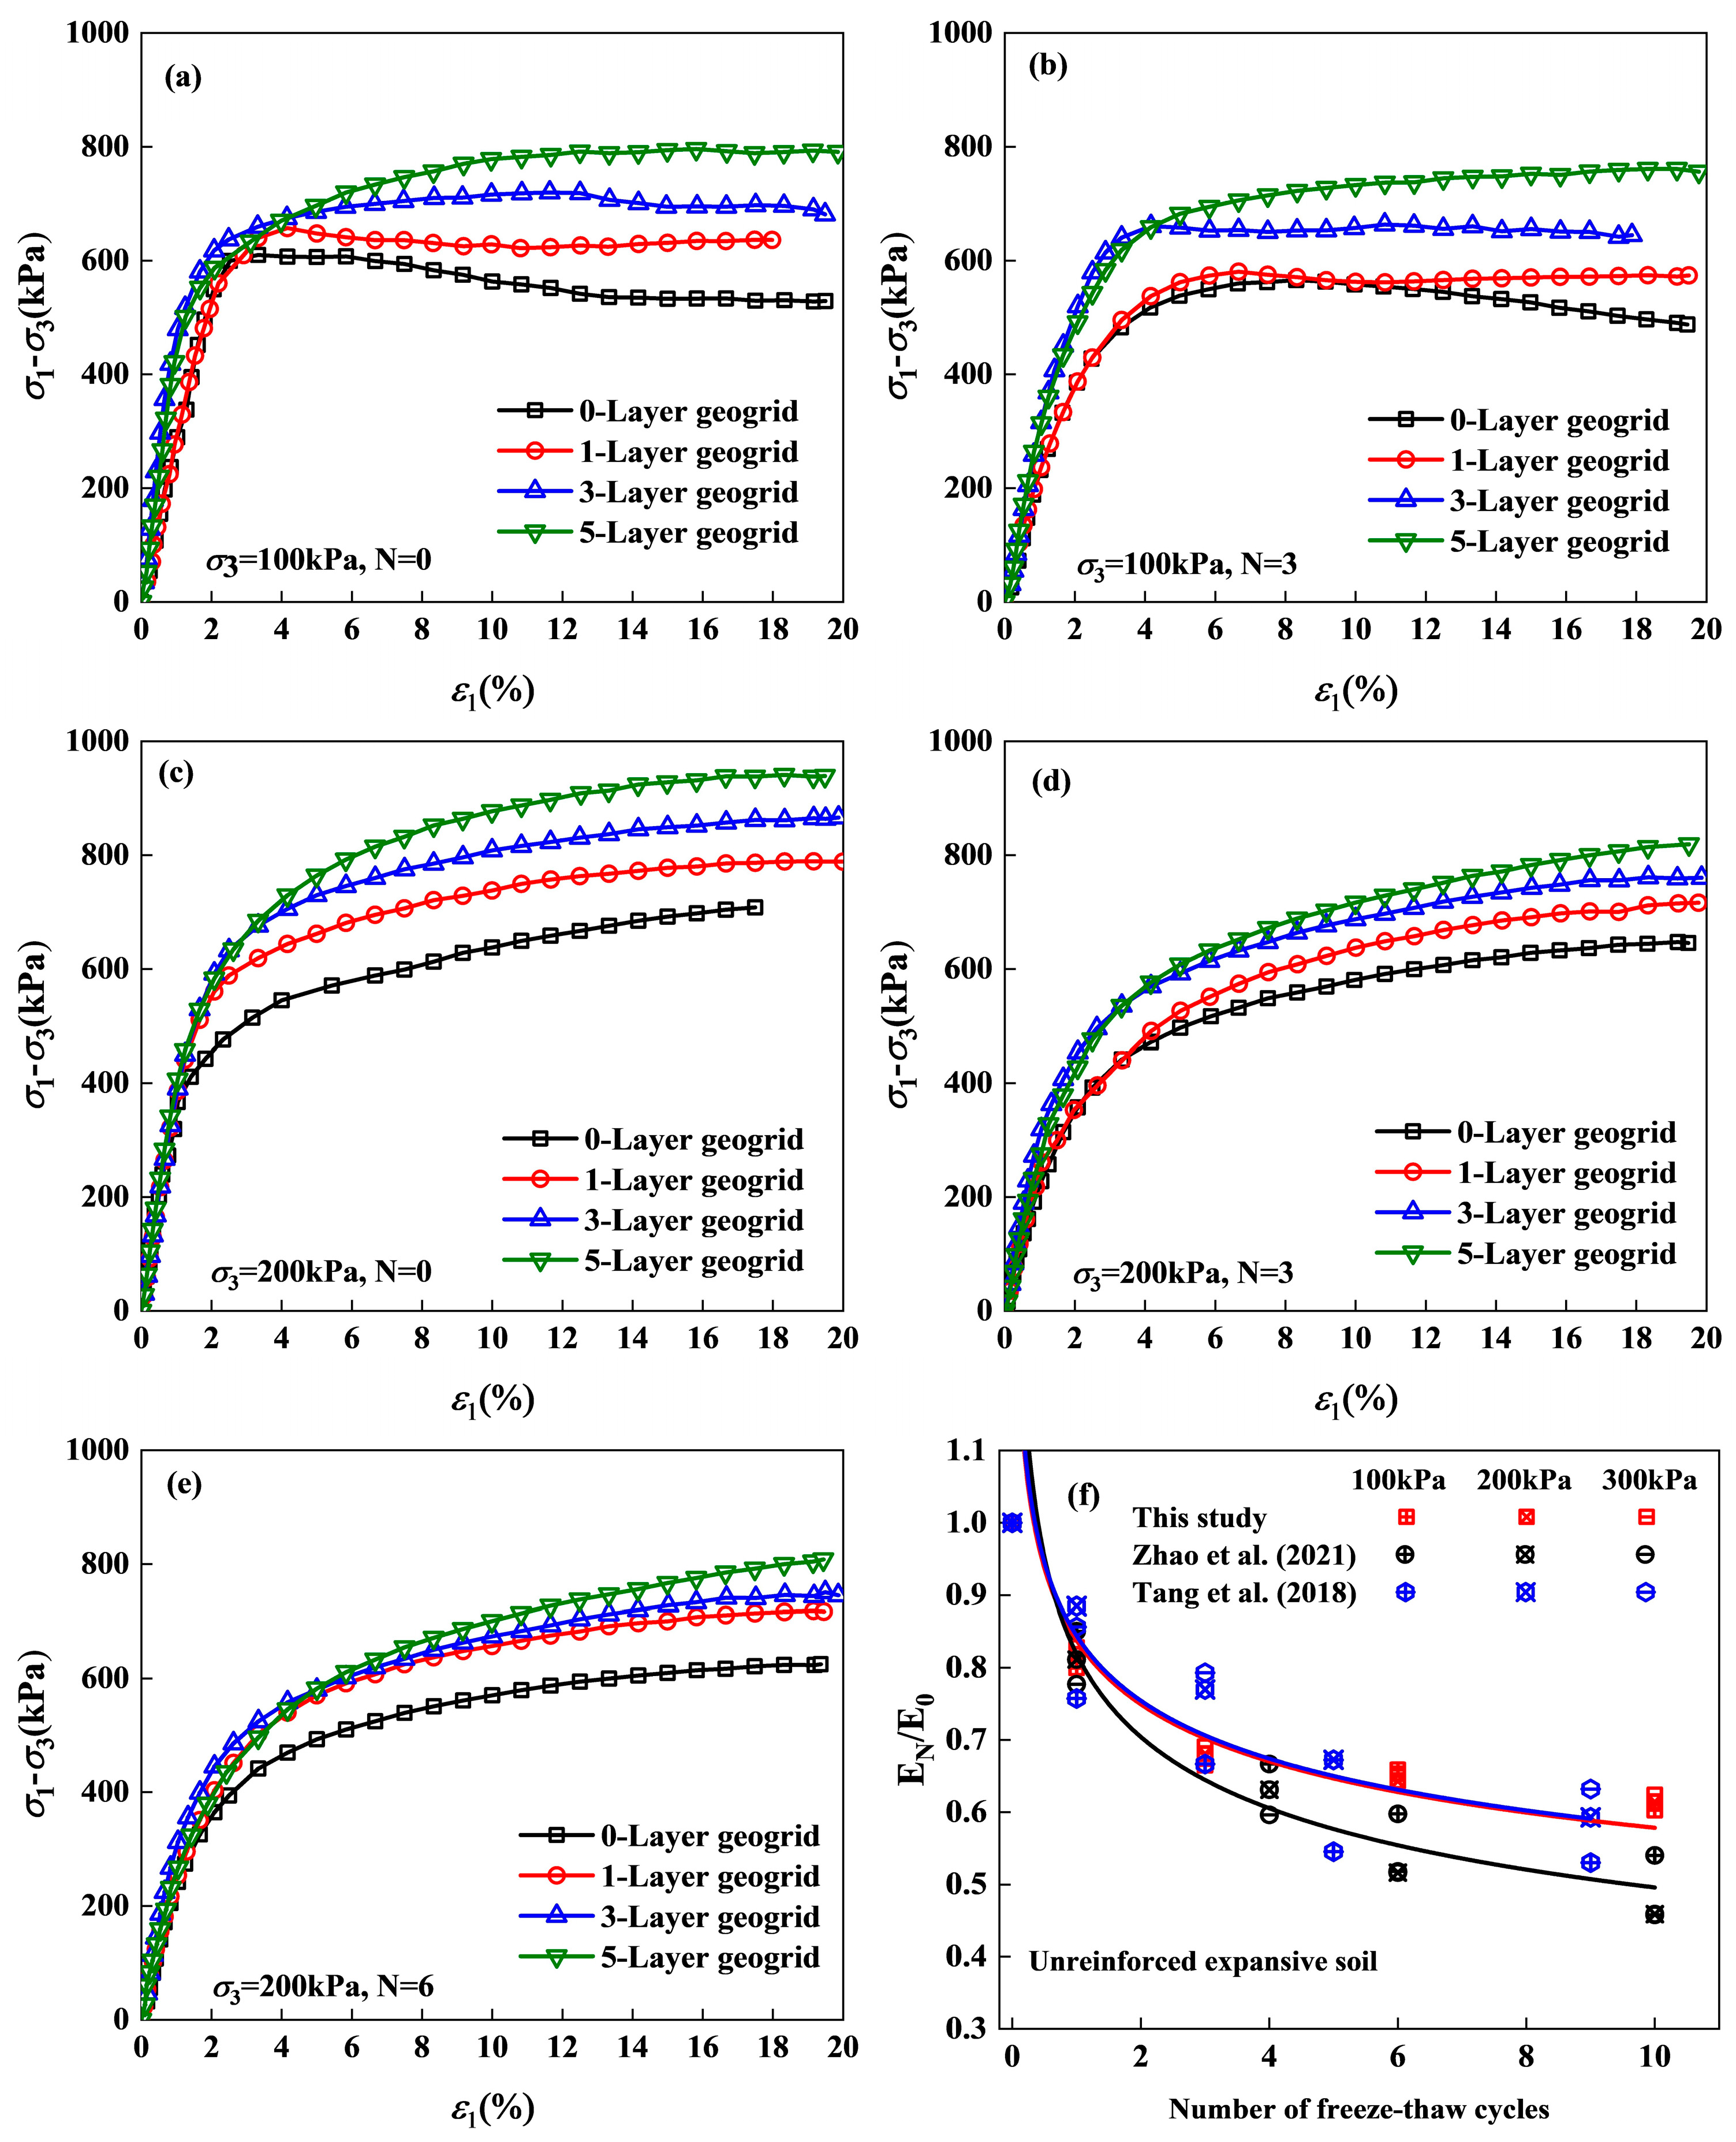
The effect of F-T cycles: F-T cycles destroyed the chain between soil particles, changed the internal structure of the soil, caused an increase in the number and size of pores, small pores linked to form large pores, and reduced the strength of the soil body [40,41]. The strength of the specimens decreased with the increase in the number of freeze–thaw cycles, which was more obvious in unreinforced specimens than in reinforced specimens. Friction between the expansive soil and the geogrid and the geogrid’s embedded locking effect indirectly provided additional pressure, limiting the increase and enlargement of pores. However, the decrease was not obvious after six F-T cycles, and the internal structure of the soil tended to stabilize and reach dynamic equilibrium. Previous studies have shown that the physical and mechanical properties tend to be stabilized after 5–7 F-T cycles [35,36], which is basically consistent with the present study.
(2)
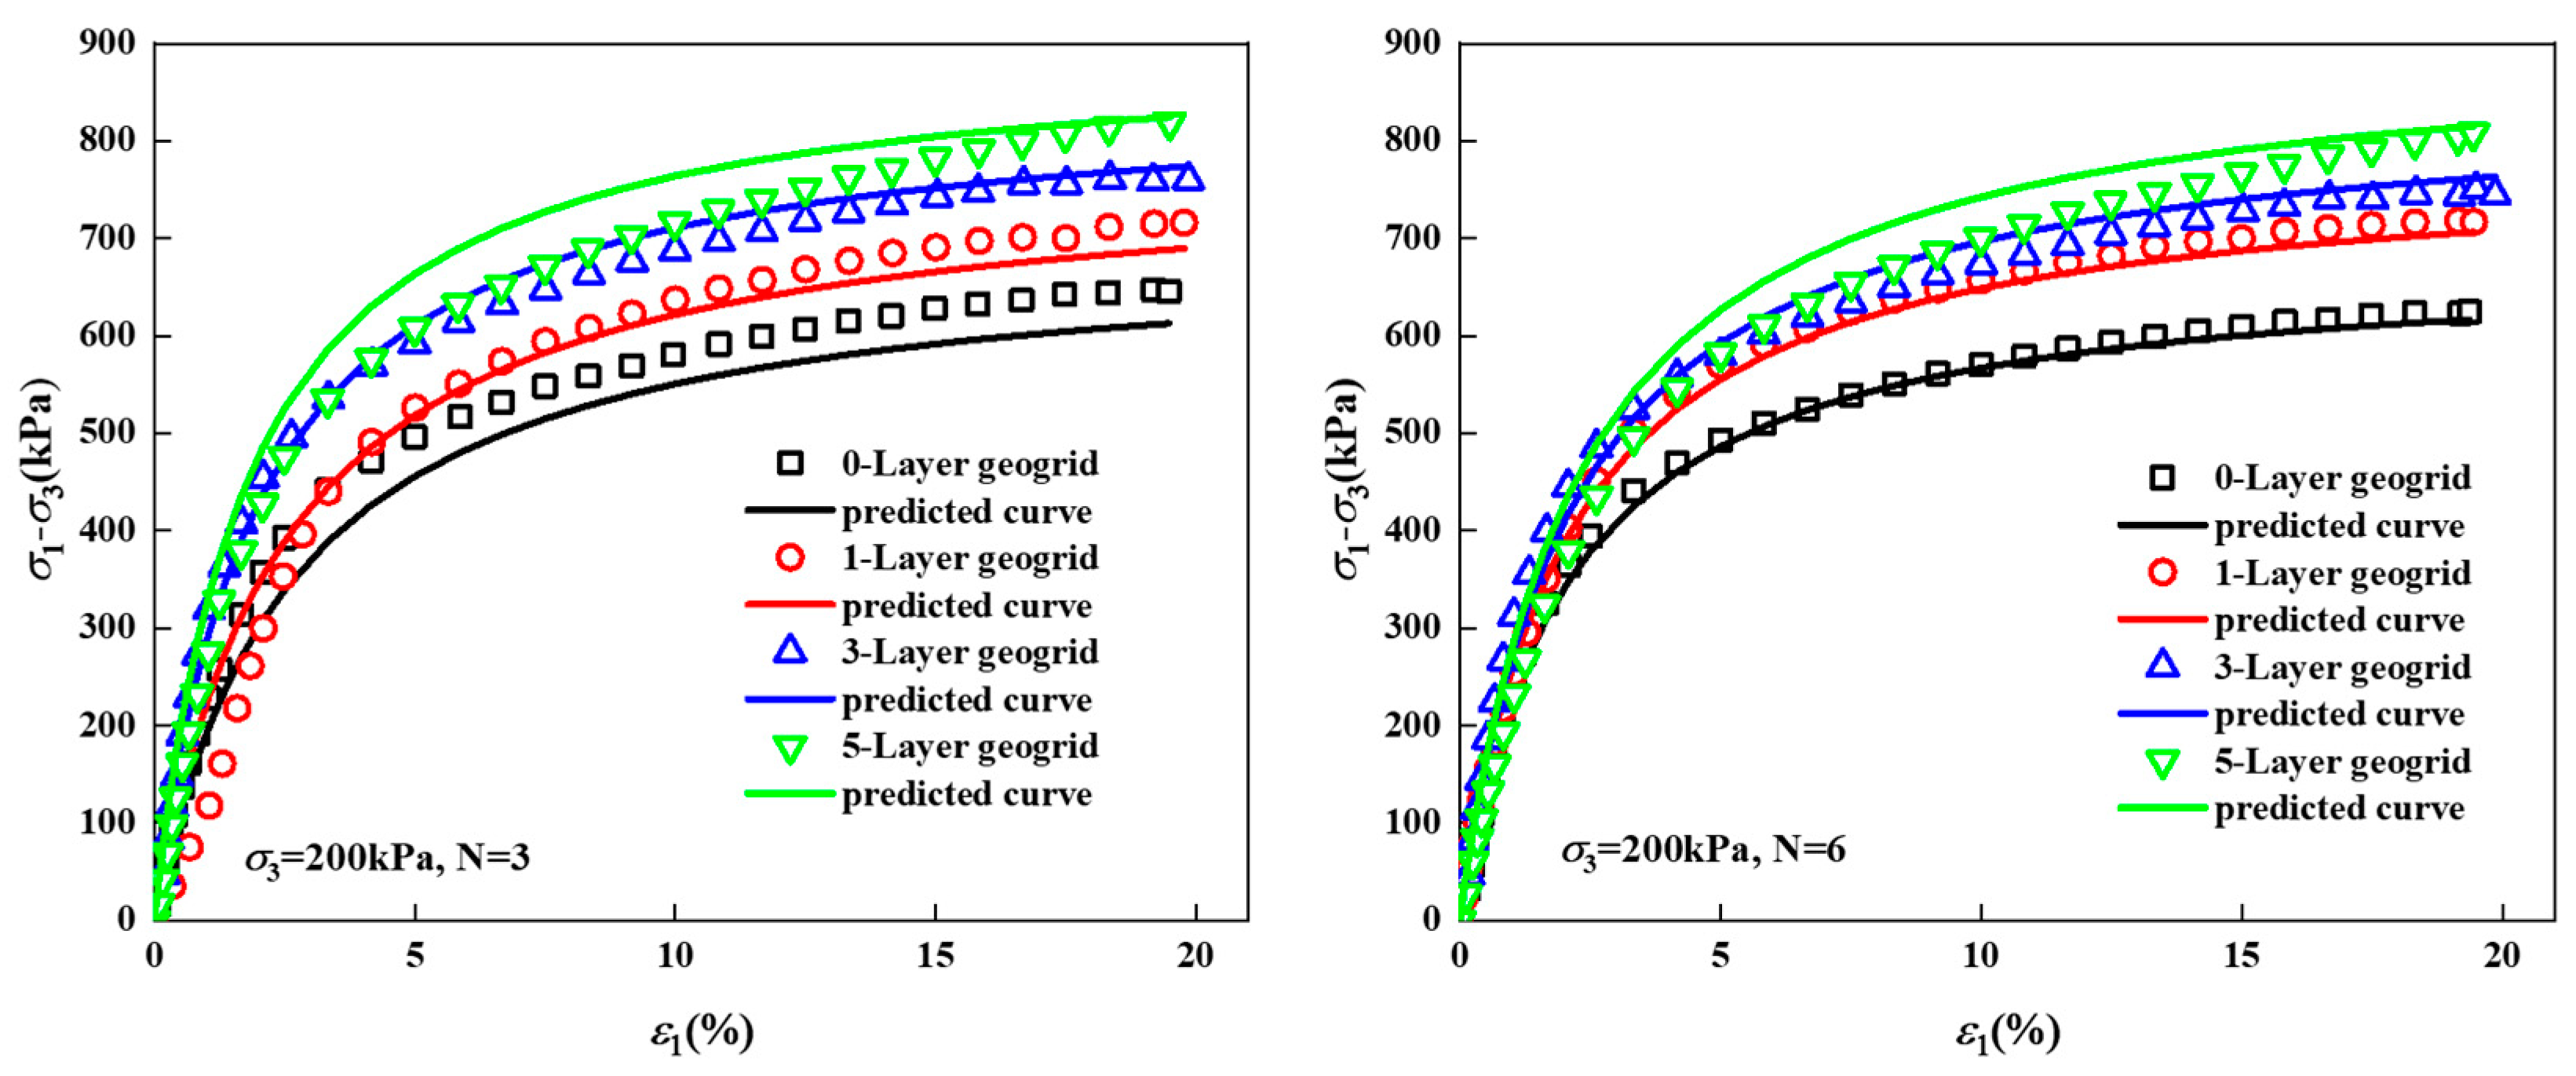
The effect of geogrid layers: With the increase in geogrid layers, the stress–strain curve changed from strain-softening to strain-hardening type. Geogrids create a restraining effect through a three-dimensional reinforcing network. Interfacial friction and mechanical occlusion between geogrid and soils redistribute the stress field, inhibit the localized development of the shear zone, and promote the transformation of the soil body from brittle damage to progressive plastic deformation. Through the synergistic reinforcing effect of multi-layer geogrids, the overall stiffness and ductility of the soil body can be significantly improved, and the freezing–expansion–contraction cyclic damage of expansive soils can be suppressed. Additionally, it was more obvious at low confining pressure, which indicates that the reinforcing effect was better at low confining pressure. The reason for this trend is that the lateral deformation of the specimen is greater at low perimeter pressures than at high perimeter pressures, the relative displacement between the tendons and soils is significant, and the geogrid restrains the soil particles more obviously.
(3)
The effect of confining pressure: When the confining pressure is 100 kPa, the stress–strain curve of the expansive soil specimens exhibited strain-softening. When the confining pressure is 200 kPa, the stress–strain curve of the expansive soil specimens exhibits strain hardening. At high confining pressures, soil particles reorganize, cracks close, and soil strength is increased [42].
(4)
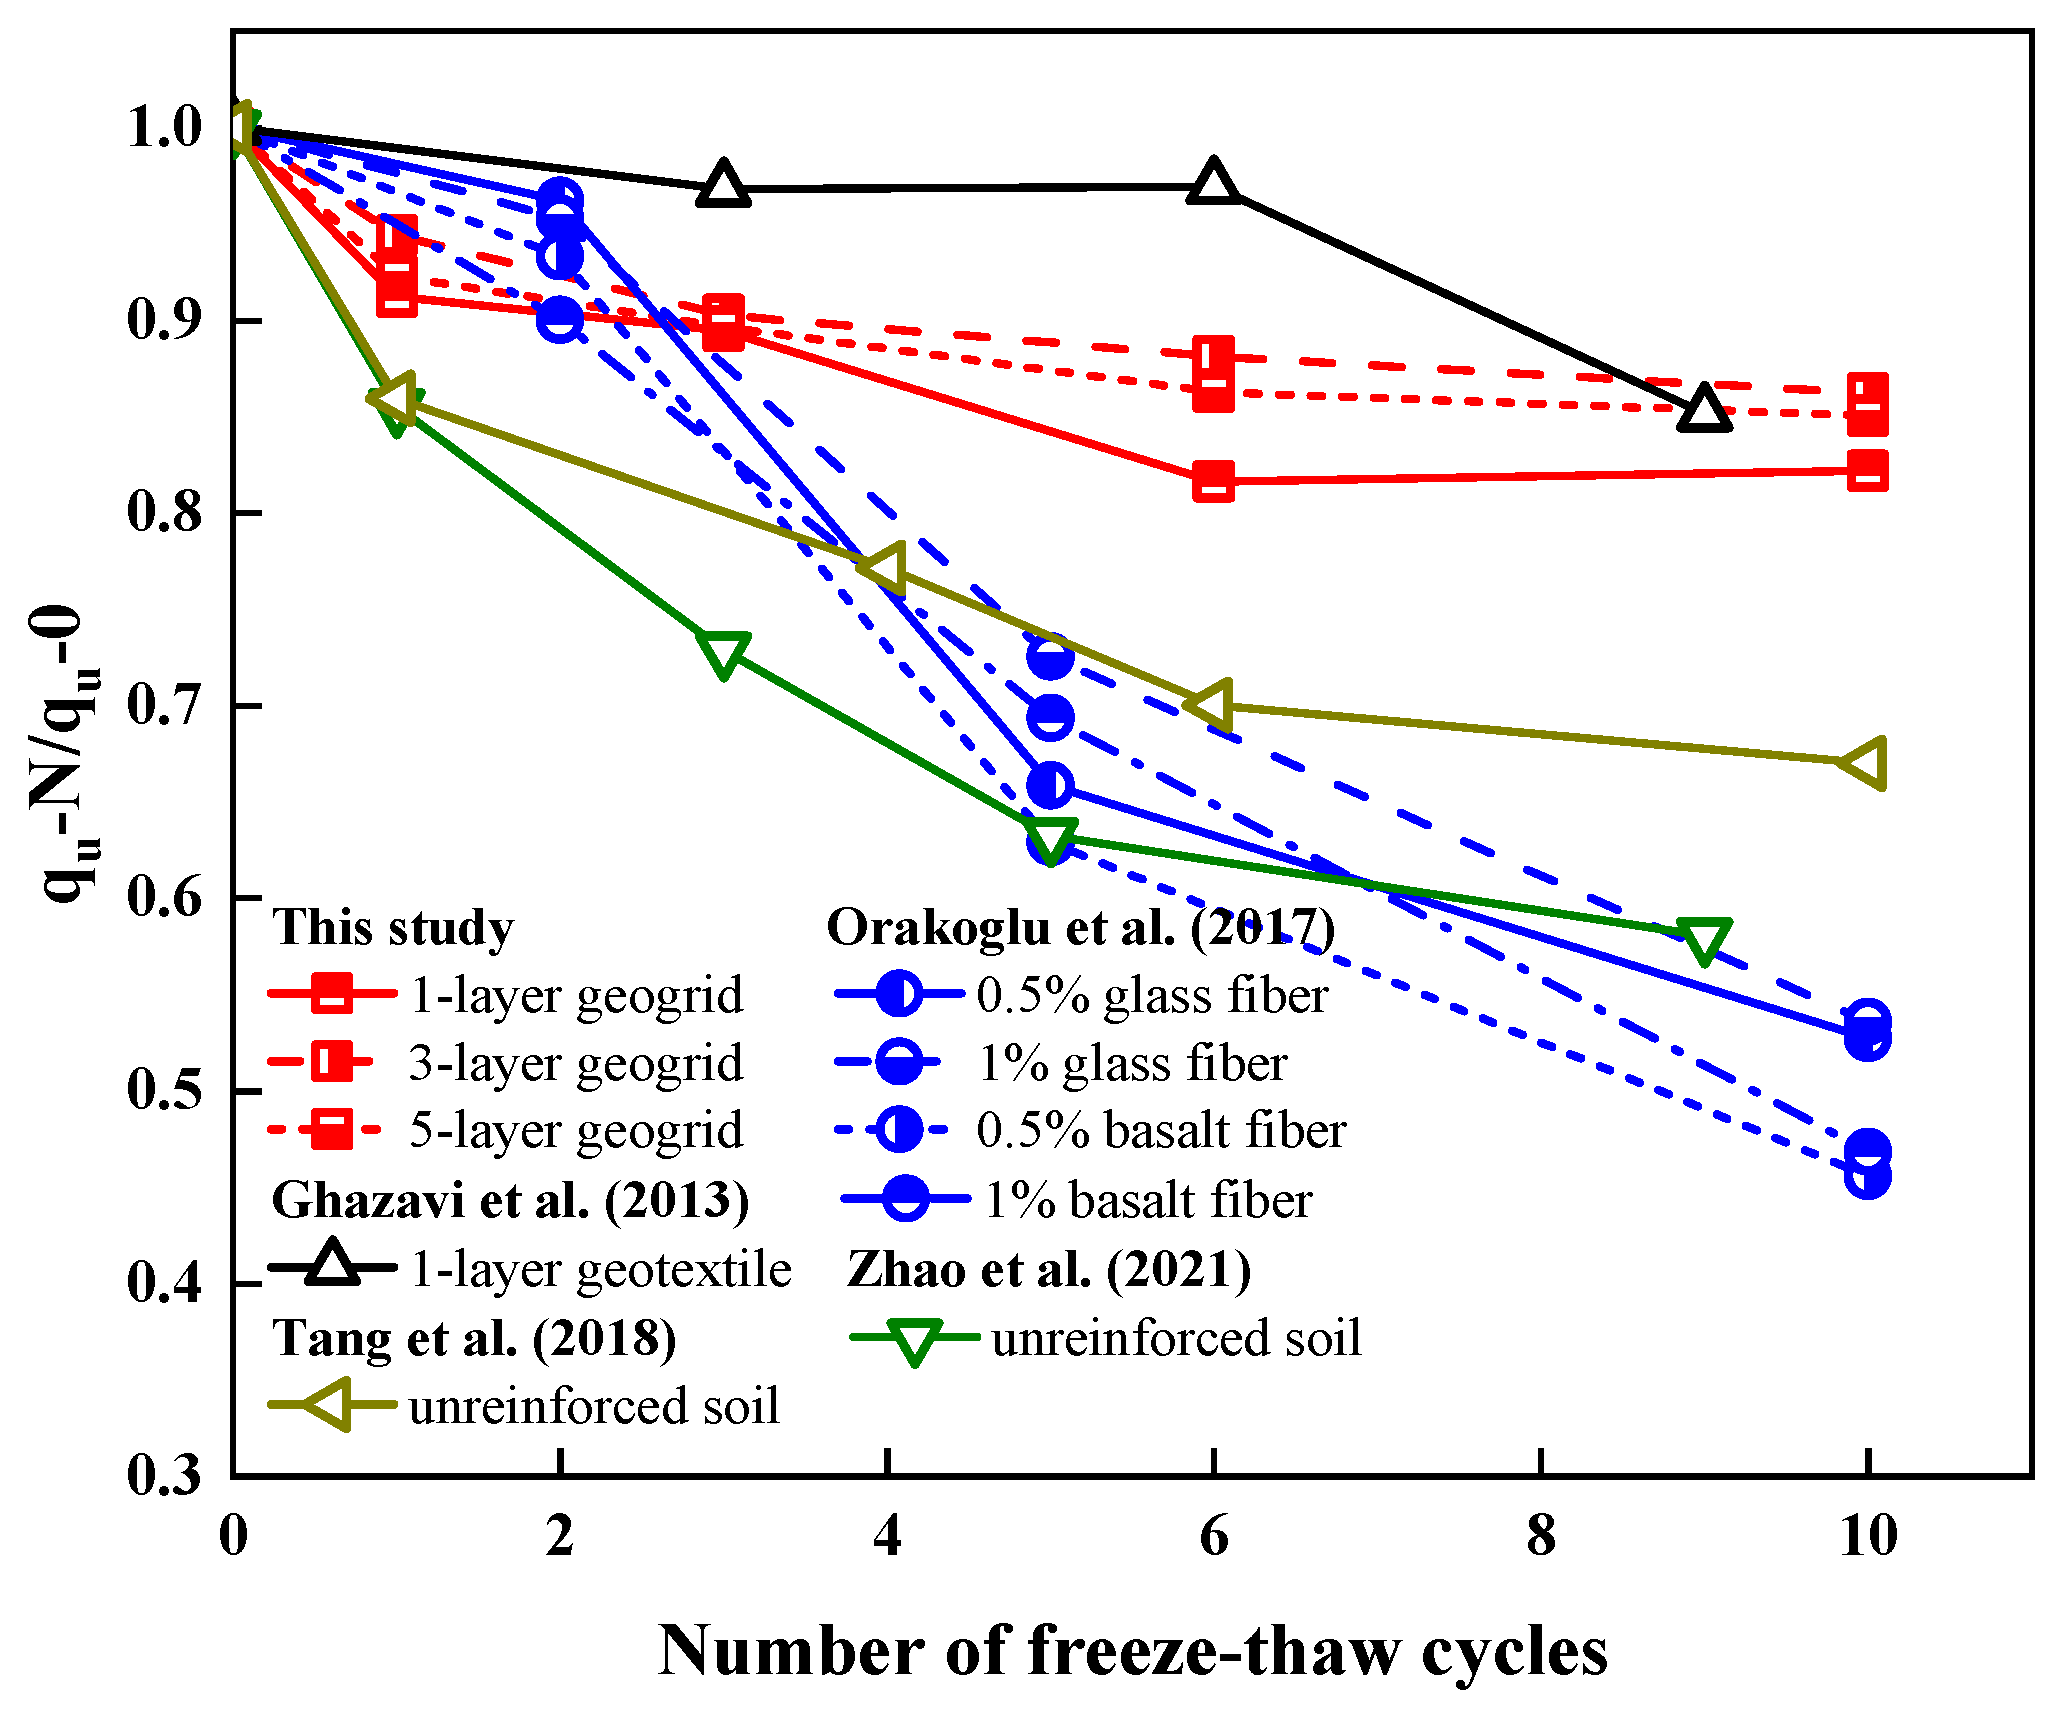
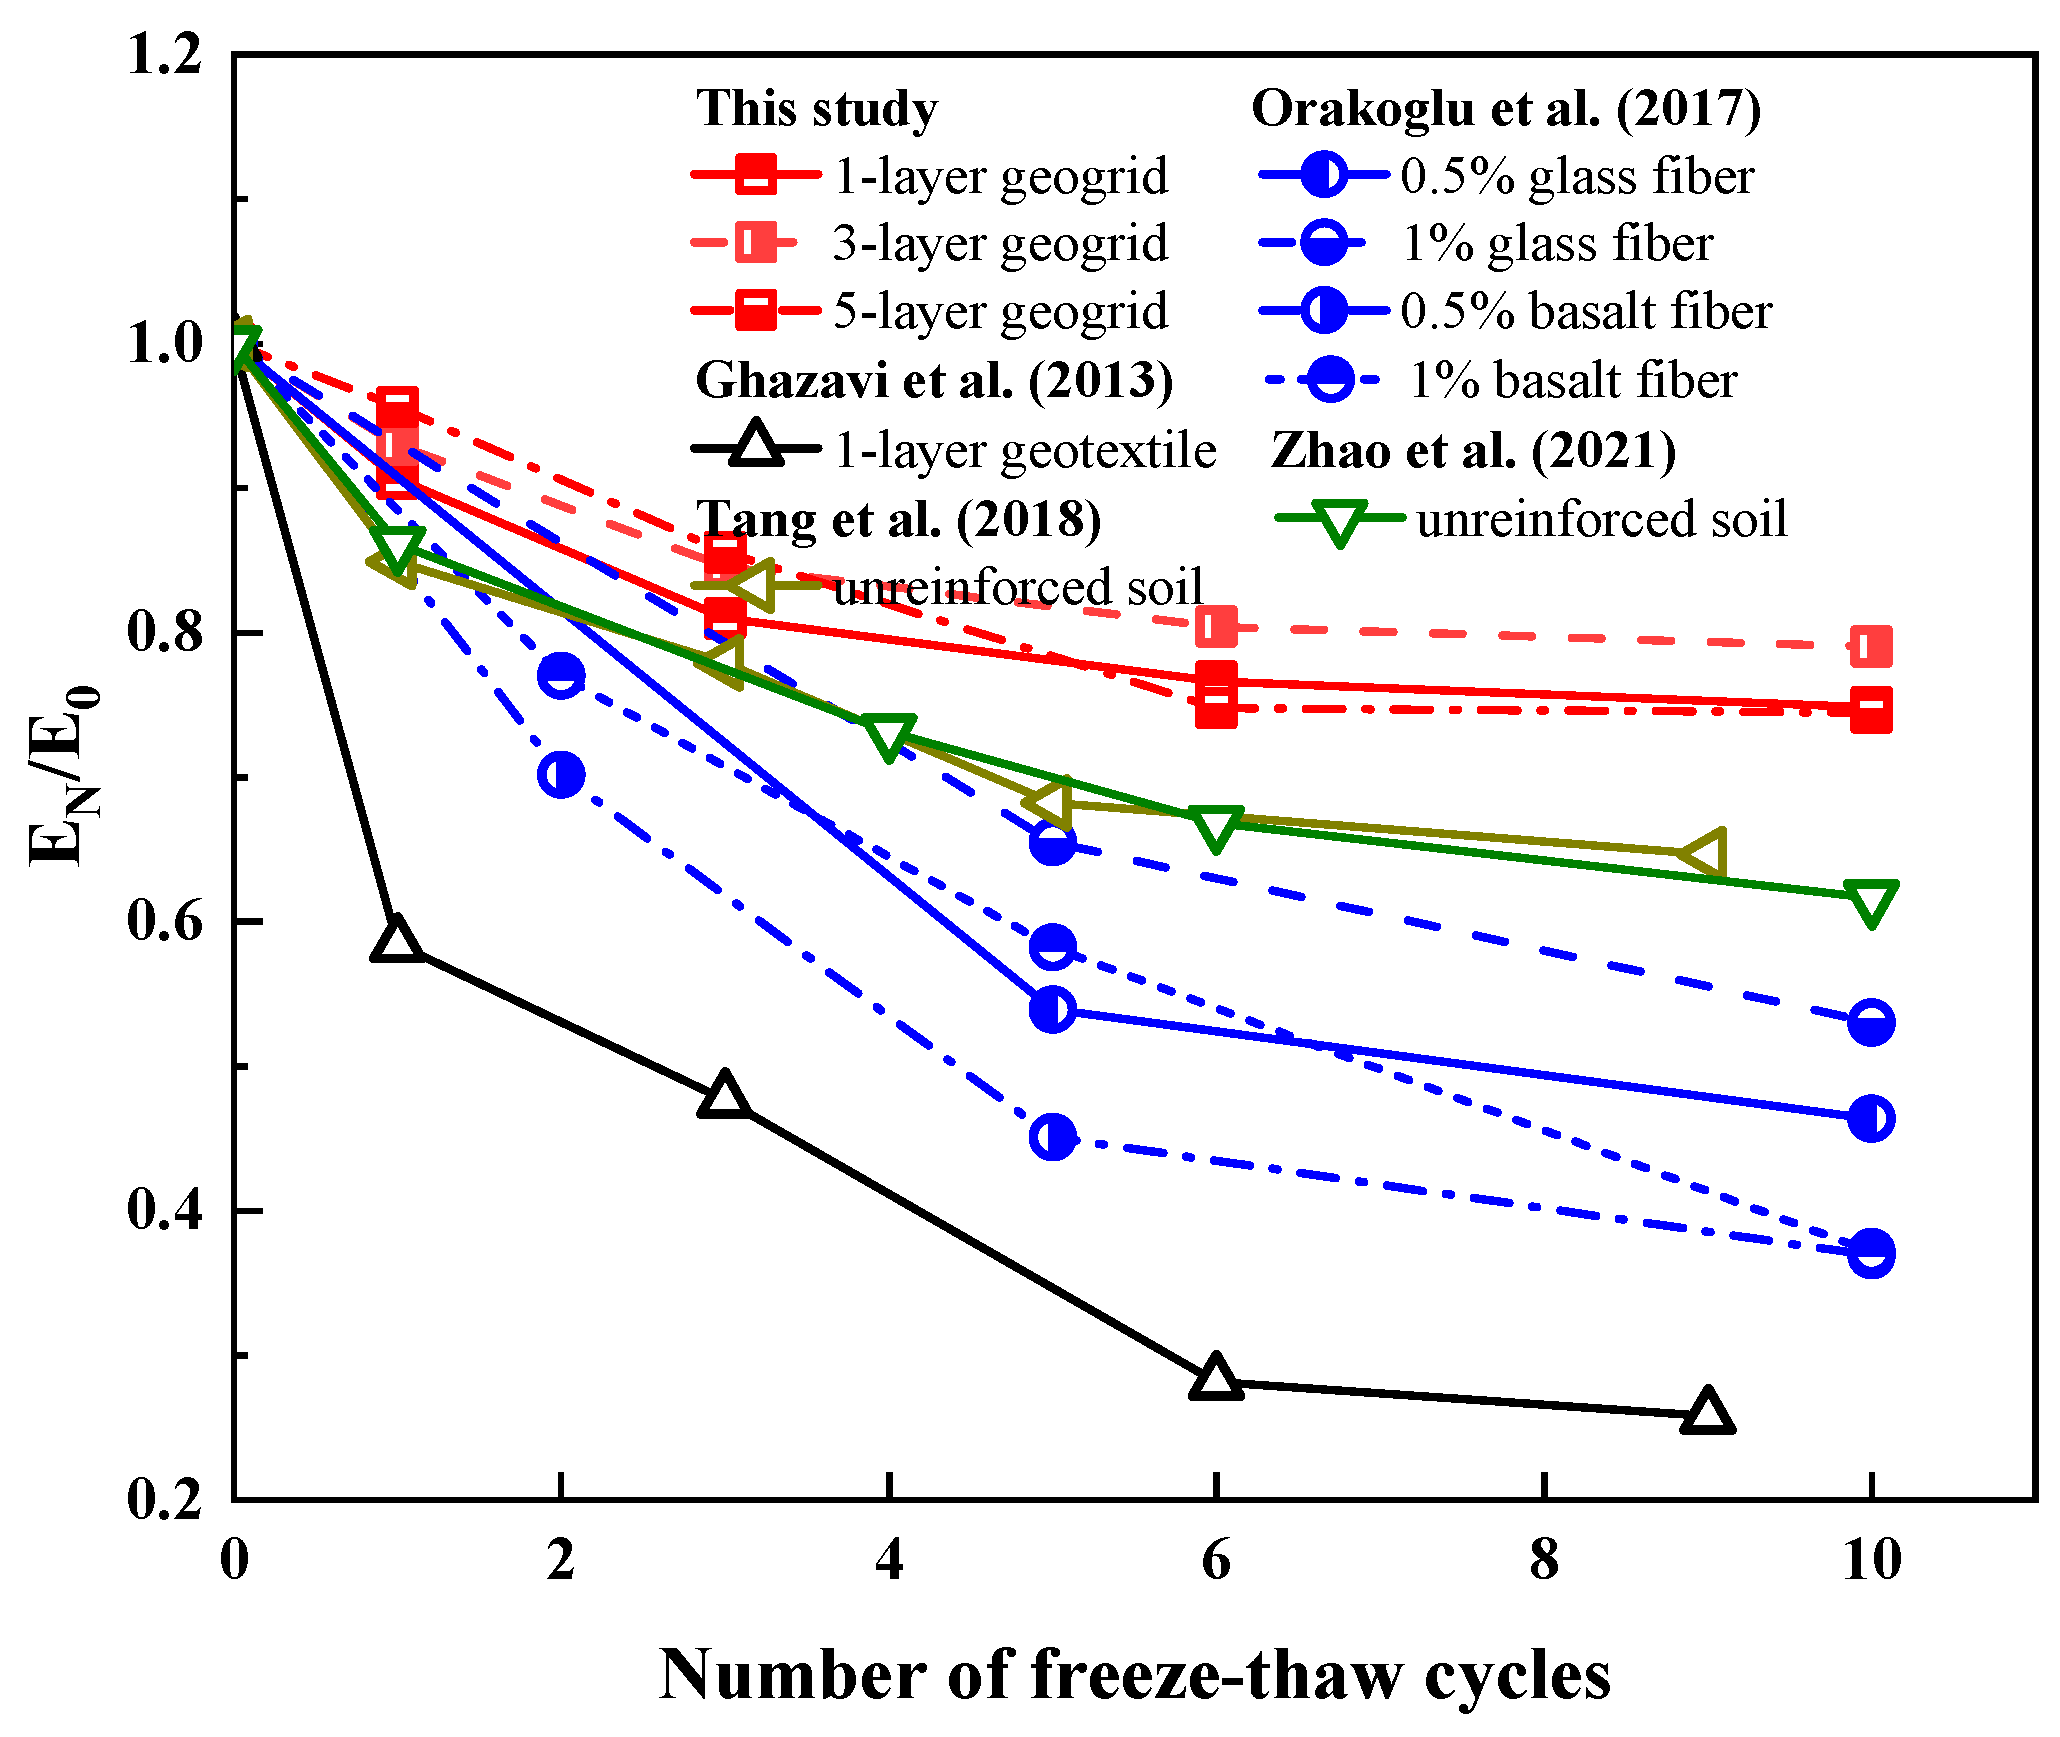
Compared to previous studies: The correlation between elastic modulus and freeze–thaw cycle frequency in untreated expansive soil is quantitatively characterized in Figure 5f, compared to Tang et al. [9] and Zhao et al. [39]. The elastic modulus is normalized for easy comparison. Figure 5f demonstrates strong congruence between the current experimental data and established findings from prior investigations, thereby validating the methodological reliability of this study.

3.3. Shear Strength

The shear strength determination protocol followed these criteria: (a) For specimens exhibiting strain-softening behavior in their stress–strain response, the peak deviatoric stress was designated as the shear strength parameter; (b) In cases of strain-hardening characteristics, the maximum deviatoric stress recorded at 15% axial strain was adopted as the representative shear strength value.
Figure 6 illustrates the normalized shear strength evolution under F-T cycles, where the dimensionless parameter represents the strength ratio between F-T-exposed specimens and their untreated counterparts sharing identical geosynthetic reinforcement configurations. As shown in Figure 6: (1) The normalized shear strength exhibited a decay trend with F-T cycles, the decrease was obvious in 1–3 F-T cycles, and smaller and stabilized in 6–10 F-T cycles, which indicated that the internal structural reorganization of the specimen reached a dynamic equilibrium after 6 F-T cycles. These are in good agreement with the findings of [35,36]. (2) The higher the confining pressure, the more obvious the effect of reinforcement. Take six F-T cycle and three-layer geogrid reinforced specimens as an example, with 100 kPa confining pressure, the shear strength of the three-layer geogrid reinforced specimen decreased by 15.1%, with 300 kPa confining pressure, it decreased by 10%. (3) Compared with the plain specimens, the geogrid-reinforced specimens were more stable under the influence of F-T cycles. When the confining pressure was 200 kPa, the shear strength of plain specimens decreased linearly with the number of F-T cycles, while the shear strength of geogrid-reinforced specimens slowed down after three F-T cycles and increased slightly after six freeze–thaw cycles.
Figure 7 shows the normalized shear strength ( q u N / q u 0 ) in the present paper compared to the previous studies [9,34,39,43]. q u N is the shear strength after F-T cycles. q u 0 is the shear strength before F-T cycles. It gives the variation of normalized shear strength of reinforced soil for different reinforcing materials under the F-T cycles, including geogrids, geotextiles, glass fibers, and basalt fibers. Overall, the normalized shear strength of the reinforced soils decreased with the increasing F-T cycles, but there were significant differences in the magnitude of the decrease. The geogrid-reinforced soil showed a stable behavior with the smallest decrease, a larger decrease after the one F-T cycle, a significant slowdown after the three and six F-T cycles, and a slight upward trend after the ten F-T cycles. Geotextile also shows a better reinforcing effect; it has many small holes; the tendon soil contact area is large and resulting in high friction. In addition, small holes are more obvious to embed a locking effect in the fine-grained soil. Our future works will continue to investigate the reinforced effect of grid aperture (bi-directional geogrids) and cross rib spacing (uni-directional geogrids) under F-T conditions. The shear strength of the geogrid-reinforced specimen was reduced by 14.6% after the six F-T cycles and 15.5% after the ten F-T cycles. However, the normalized shear strength of fiber-reinforced soils decreased significantly with increasing number of F-T cycles. Also, the shear strength of the glass-fiber-reinforced specimen was reduced by 30.75% after the five F-T cycles; this decreasing trend was 33.8% for the basalt-fiber-reinforced specimen, 46.9%, and 53.8% after the 10 F-T cycles. It is obvious that the reinforcement effect of geogrids or geotextiles is significantly better than that of fibers (glass fibers, basalt fibers) in F-T conditions. They have different mechanisms of reinforcement influence: for geogrids or geotextiles, friction and embedded locking effect indirectly provide additional pressure, and limit shear deformation to achieve the reinforcement effect; for fibers, mainly due to friction and local space constraints [44].

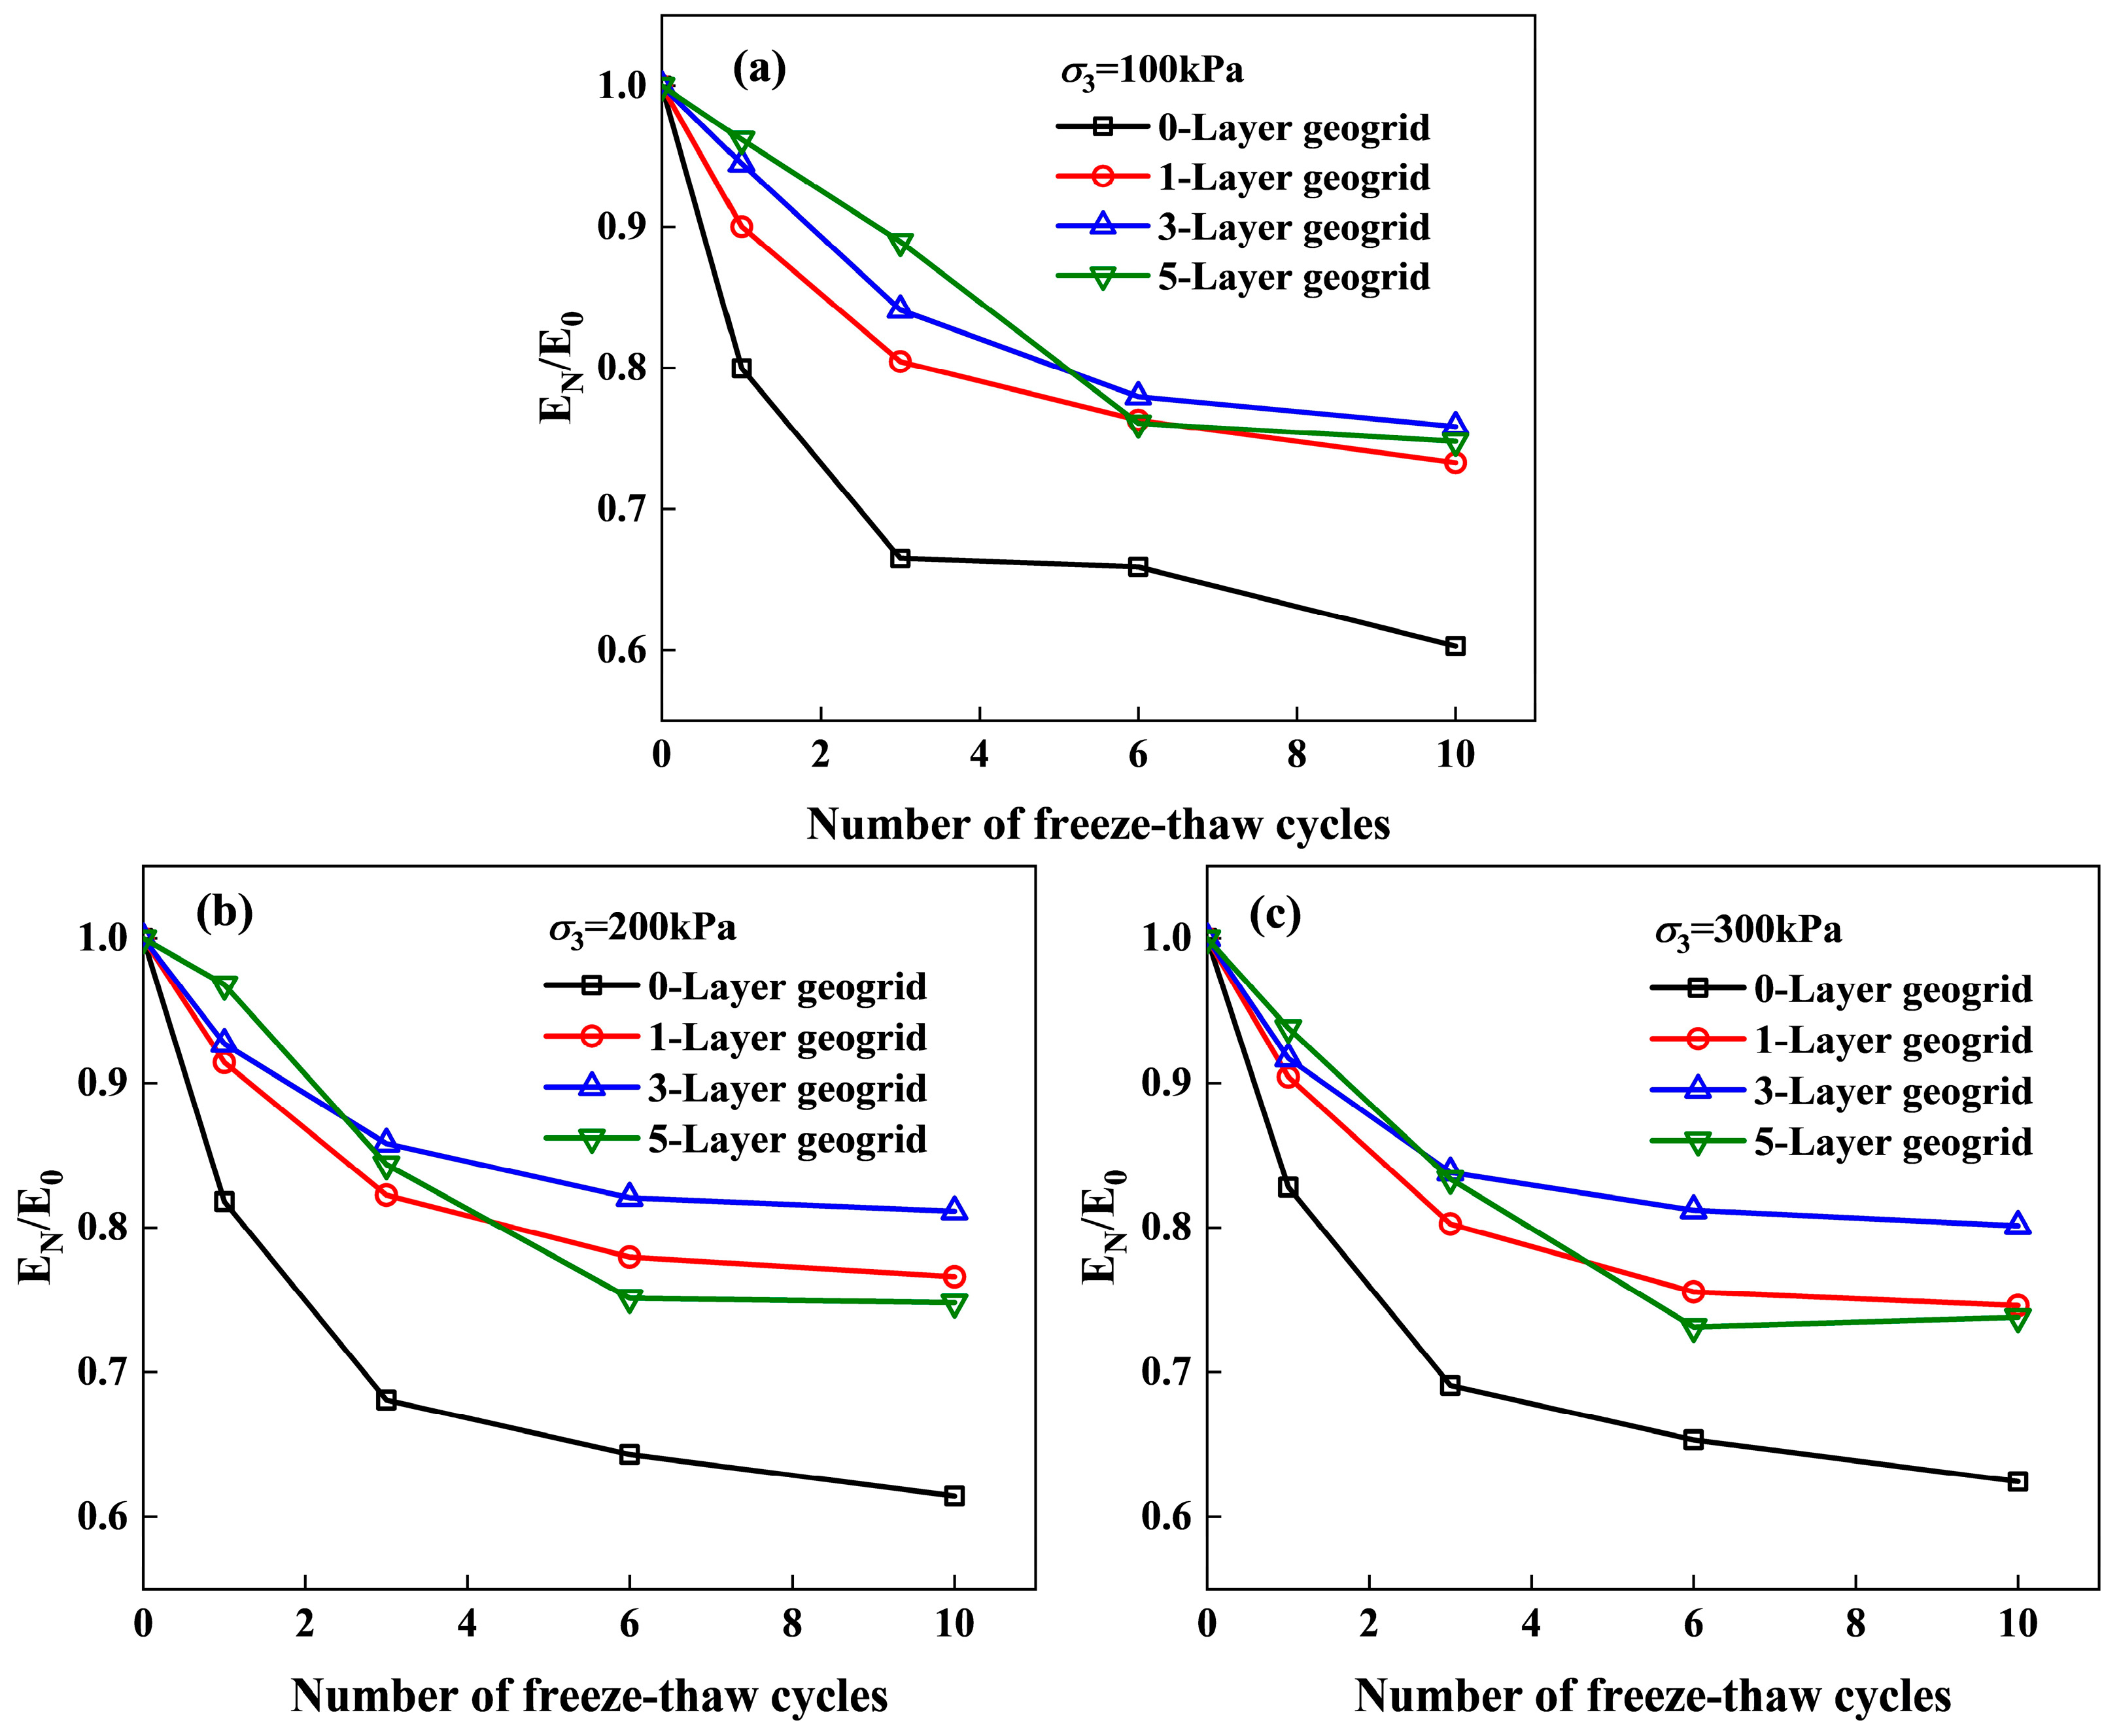
3.4. Elastic Modulus

The elastic modulus, a fundamental geotechnical parameter characterizing soil stiffness, is operationally defined as the secant modulus corresponding to 1% axial strain [9,39,45]; this is mathematically expressed as Equation (1):
E = Δ σ Δ ε = ( σ 1 σ 3 ) 1 % ε 1.1 %
where E is elastic modulus; ( σ 1 σ 3 ) 1 % is the deviator stress at 1% axial strain; ε 1.1 % is the axial strain of 1%.
Figure 8 illustrates the normalized elastic modulus evolution under F-T cycles, where the dimensionless parameter represents the modulus ratio between F-T-exposed specimens and their untreated counterparts sharing identical geosynthetic reinforcement configurations. As shown in Figure 8, the elastic modulus first decreased and then tended to stabilize with the increase in F-T cycles. The decrease was obvious after 1–3 F-T cycles and tended to stabilize to reach dynamic equilibrium after 6 F-T cycles. These are in good agreement with the findings of [9,39]. Under F-T conditions, high confining pressure exhibited more steadily than low confining pressure. The effect of F-T cycles on the plain expansive soils was more significant than that of GRES, which indicated that geogrids improved the F-T resistance of expansive soils. After the six F-T cycles, the elastic modulus decreased by about 35.7%, 23.3%, 18.3%, and 23.5% for 0-, 1-, 3-, and 5-layer GRES.
Figure 9 shows the normalized elastic modulus ( E N / E 0 ) in the present paper compared to the previous studies [9,34,39,43], E N is the shear strength after F-T cycles. E 0 is the shear strength before F-T cycles, which included the variation patterns of normalized elastic modulus of geogrids, geotextiles, glass fibers, basalt fibers, and unreinforced soils with the number of F-T cycles. As demonstrated in Figure 9, the normalized elastic modulus of both unreinforced and reinforced soils exhibited a progressive decline with F-T cycles. After six F-T cycles, the normalized elastic modulus reached a constant value; thus, the specimens obtained a new dynamic stability. Take the last two freeze–thaw cycle increments as an example, the average decrease in the normalized elastic modulus of GRES was 1.5% (6–10 F-T cycles), geotextile-reinforced soil was 8.28% (6–9 F-T cycles), fiber-reinforced soil was 21.8% (5–10 F-T cycles), and the normalized elastic modulus of GRES increased slightly. In addition, compared to other reinforcing materials, geogrids showed a better reinforcing effect, and this difference increases with the increase in the number of F-T cycles, which is caused by the difference in the reinforcing mechanism.

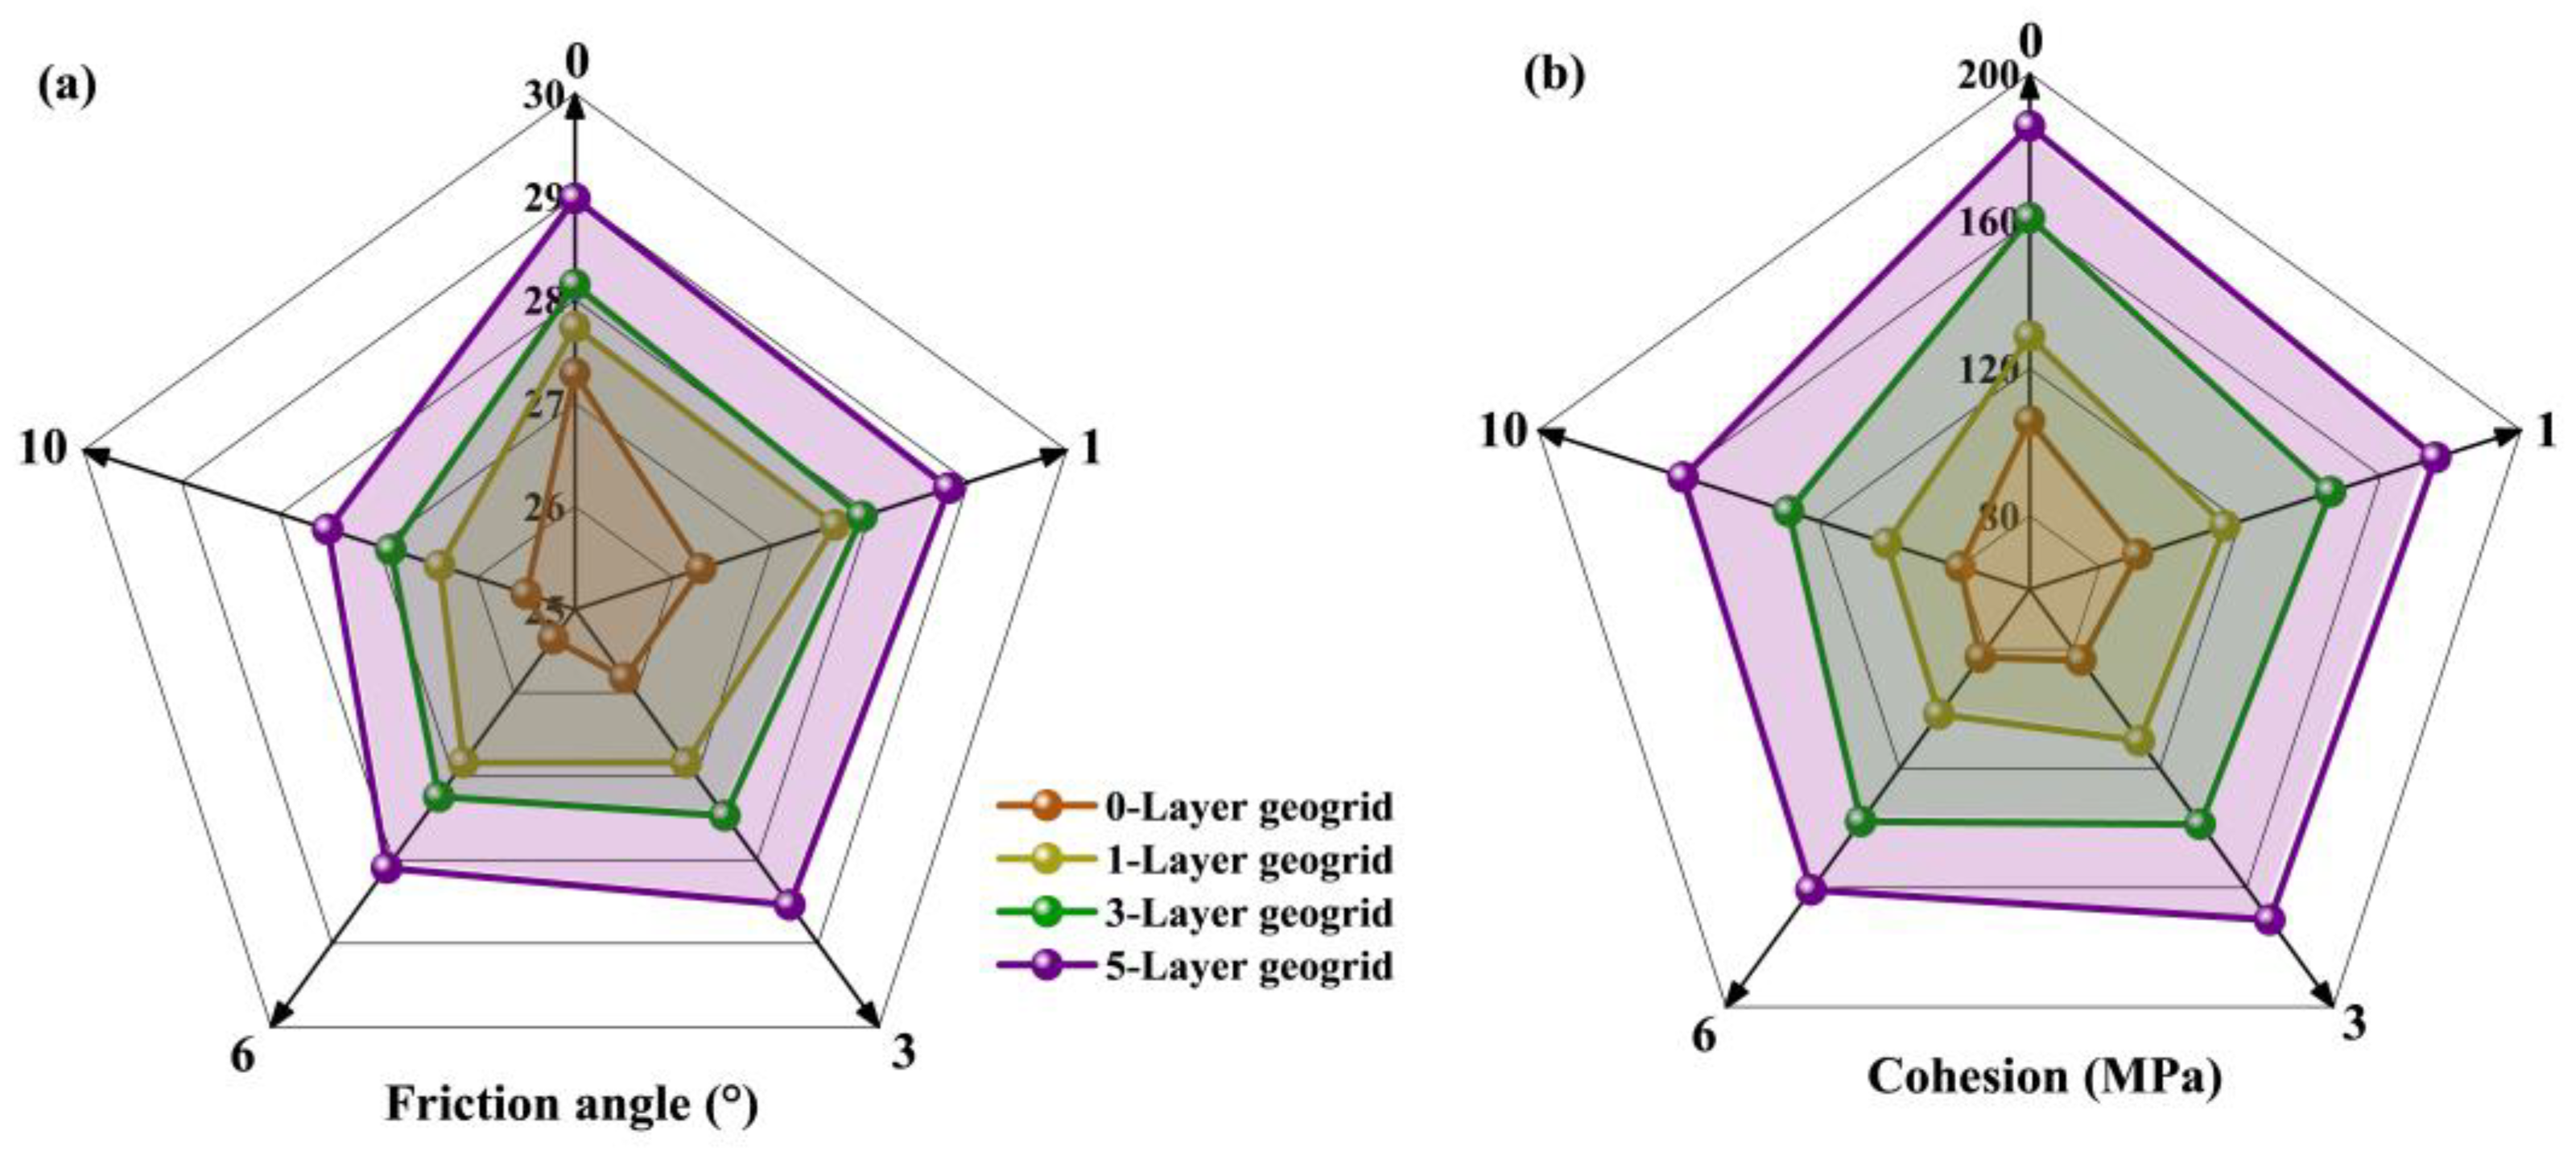
3.5. Friction Angle and Cohesion

Friction angle and cohesion are two important parameters of soil shear strength. They can be used to assess the stability and bearing capacity of soils and are critical to the design and construction of geotechnical engineering. The Mohr–Coulomb circle theory was used to plot the Mohr stress circle and strength envelope to obtain the angle of internal friction and cohesion. The variation patterns of internal friction angle and cohesion with the increase in the number of F-T cycles are given in Figure 10.
As can be seen in Figure 10a, the friction angle of the unreinforced soil and reinforced soil decreased with the increase in the number of F-T cycles, whereas the friction angle of the unreinforced soil decreased significantly, and that of the reinforced soil was relatively stable, which is basically in agreement with the previous study [28,43]. With the increment of reinforced layers, the friction angle increased, and that for freeze–thaw specimens was more pronounced compared to unfrozen–thawed specimens. The findings indicated that the reinforced soils exhibit better resistance to freezing and thawing. After the sixth F-T cycle, the friction angle decreased by about 7.6%, 5.9%, 4.5%, and 5.1% for 0-, 1-, 3-, and 5-layer GRES. During freeze–thaw cycles, the mineral skeleton adjacent to ice lenses and the freezing front was subjected to compression. The size of the particles was reduced, the surface was smoother, and the friction between the particles was reduced. However, geogrids could restrain the soil surrounding particles and provide additional confinement on a macroscopic scale. This phenomenon can be the reason of friction angle decrease, and the geogrid reinforced soils exhibit better performance during freeze–thaw cycles.
According to Figure 10b, the cohesion of the unreinforced and reinforced soils decreased with the increase in the number of F-T cycles, but the reinforced soils behaved more stably. After the sixth F-T cycle, the cohesion decreased by about 24.5%, 21%, 14.3%, 14.5% for 0-, 1-, 3-, and 5-layer GRES. Thus, reinforced soils have better freeze–thaw resistance than unreinforced soils. After freeze–thaw cycles, the pore space increases and the distance between soil particles increases, which may be the main reason for the decrease in cohesion. Geogrids are able to limit the development of cracks around them and therefore show better resistance to freezing and thawing.

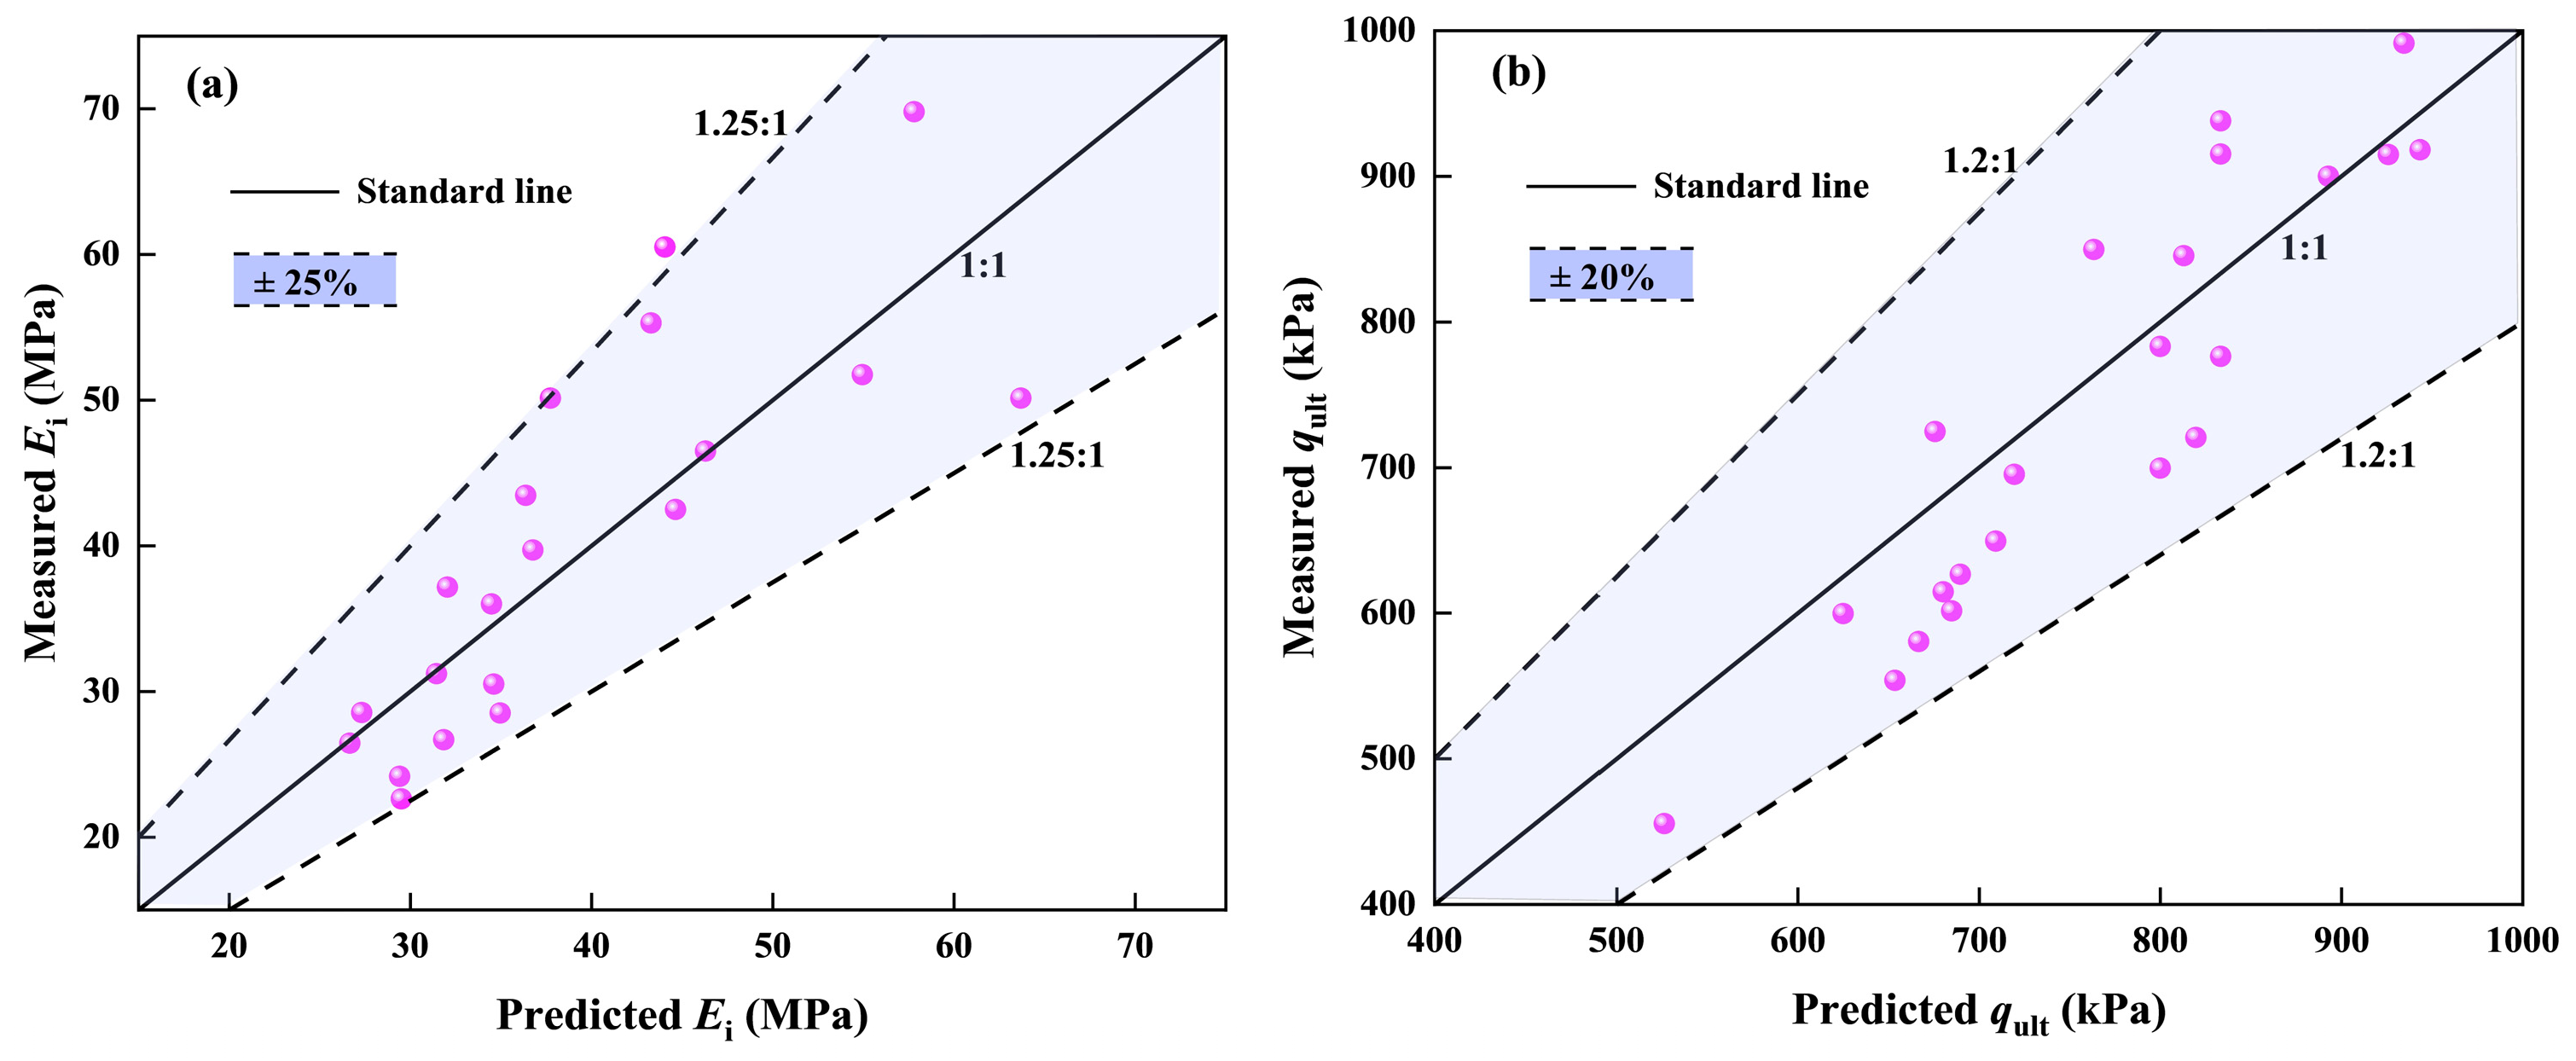
3.6. Establishment and Validation of the Empirical Formula

Based on test results, the stress–strain curve of geogrid-reinforced expansive soil showed the characteristic of strain hardening, which was a typical hyperbolic form, extremely similar to the nonlinear elasticity model proposed by Duncan-Chang [46]. The nonlinear elasticity model expression is Equation (2).
( σ 1 σ 3 ) = ε 1 a + b ε 1
where ( σ 1 σ 3 ) is the deviator stress; ε 1 is the axial strain; a and b are model parameters. a is the reciprocal of the initial elastic modulus, see Equation (3); b is the reciprocal of the ultimate strength, see Equation (4). Therefore, the empirical equations considering each factor for the initial elastic modulus and ultimate strength can be investigated separately, and then the Duncan–Zhang modified model shown in Equation (2) can be developed.
E i = 1 a
( σ 1 σ 3 ) u l t = 1 b
ε 1 ( σ 1 σ 3 ) = a + b ε 1
Equation (2) is transformed to obtain Equation (5), which shows that ε 1 / ( σ 1 σ 3 ) and ε 1 are linearly related. The ε 1 / ( σ 1 σ 3 ) ε 1 curves are drawn according to the test results. The intercept a and slope b were obtained by linear fitting of the ε 1 / ( σ 1 σ 3 ) ε 1 curves, Combined with Equations (3) and (4), the initial elastic modulus and ultimate strength of geogrid-reinforced expansive soils were obtained, and the results are shown in Table 4. R 2 were all above 0.99, and the fitting results were good. Then, the variation patterns of initial elastic modulus and ultimate strength considering each factor are discussed separately.
Multiple factors govern the initial elastic modulus and ultimate strength of soils, including mineralogical composition, fabric configuration, soil type, confining pressure, temperature, deviatoric stress. In this paper, the initial modulus of elasticity and the ultimate strength can be expressed as a function of confining pressure, the number of F-T cycles, and number of geogrid reinforced layers, see Equations (6) and (7).
E i = β 1 × f ( σ 3 ) × f ( N ) × f ( C )
( σ 1 σ 3 ) u l t = β 2 × f ( σ 3 ) × f ( N ) × f ( C )
where β 1 and β 2 are model parameters, f ( σ 3 ) is the function of confining pressure, f ( N ) is the function of number of F-T cycles, f ( C ) is the function of number of geogrid reinforced layers.
Based on Equations (6) and (7), the expressions of initial elastic modulus and ultimate strength under different conditions are given, as shown in Equations (8) and (9).
E i = 23.56 × N 0.13 × 1.18 C × σ 3 P a 0.38
( σ 1 σ 3 ) u l t = 98.45 × N 0.15 × ( 5.5 + 0.64 C ) × σ 3 P a 0.61
where P a (101.3 kPa) is the atmospheric pressure, σ 3 is confining pressure, N is number of F-T cycles, C is number of geogrid reinforced layers.
Figure 11 shows measured and predicted values of the initial elastic modulus and ultimate strength. It is worth mentioning that the initial elastic modulus and ultimate strength predicted by Equations (8) and (9) are in good agreement with the test values, with the inaccuracy of the initial elastic modulus within 25%, and the inaccuracy of the ultimate strength within 20%. This indicates that Equations (8) and (9) can be used as a prediction formula for the initial elastic modulus and ultimate strength for GRES.
Substituting Equations (3), (4), (8), and (9) into Equation (2), the Duncan–Zhang modified model describing the mechanical properties of GRES under freeze–thaw cycling conditions can be obtained, and is expressed as Equation (10).
( σ 1 σ 3 ) = ε 1 1 E i + ε 1 ( σ 1 σ 3 ) u l t E i = 23.56 × N 0.13 × 1.18 C × σ 3 P a 0.38 ( σ 1 σ 3 ) u l t = 98.45 × N 0.15 × ( 5.5 + 0.64 C ) × σ 3 P a 0.61
The deviatoric stress–strain curve of GRES subjected to F-T cycles was calculated by Equation (10), as shown in Figure 12. Compared to the experimental data, the predicted curves were well fitted to the test values, and the stress–strain deviations at the peak points were within 5.1%. The Duncan–Zhang modified model can be used as a prediction formula for the stress–strain characteristics of GRES under freeze–thaw cycling conditions. The research results can provide important theoretical support for the practical engineering design of GRES in cold regions.

4. Conclusions

In this study, the mechanical behaviors of GRES were investigated through a series of large-scale triaxial tests, and the effects of the confining pressures (100 kPa, 200 kPa and 300 kPa), geogrid reinforced layers (0-, 1-, 3-, and 5-layer geogrid arrangements) and number of F-T cycles (0, 1, 3, 6, and 10) on the shear strength parameters were evaluated and discussed. Through systematic investigation of the laboratory measurements, key outcomes emerge as follows:
(1)
The dilatancy deformation of the expanded soils was effectively limited by geogrids, which was significantly smaller compared to the plain expanded soil. The geogrid reinforced impact zone appeared to overlap with the increase in geogrid layers when the geogrid layers exceeded three layers.
(2)
Friction between the expansive soil and the geogrid and the geogrid-embedded locking effect indirectly provided additional pressure, limited shear deformation. With the increase in reinforced layers, the stress–strain curve changed from strain-softening to strain-hardening type.
(3)
The elastic modulus first decreased and then tended to stabilize with the increase in F-T cycles; the decrease was obvious after 1–3 F-T cycles and tended to stabilize to reach dynamic equilibrium after 6 F-T cycles. After the six F-T cycles, the elastic modulus decreased by about 35.7%, 23.3%, 18.3%, and 23.5% for 0-, 1-, 3-, and 5-layer GRES.
(4)
The friction angle and cohesion decreased with the increment of F-T cycles and increased with the increment of geogrid layers. After the six F-T cycles, the cohesion decreased by about 24.5%, 21%, 14.3%, 14.5% for 0-, 1-, 3-, and 5-layer GRES, and 7.6%, 5.9%, 4.5%, and 5.1% of the friction angle.
(5)
A modified Duncan–Zhang model with the confining pressure, the F-T cycles, and the geogrid layers was proposed; the predicted values agreed with the measured values by more than 90%, which can be used as a prediction formula for the stress–strain characteristics of GRES under freeze–thaw cycling conditions. The research results can provide important theoretical support for the practical engineering design of GRES in cold regions.

Author Contributions

Conceptualization, Z.Y.; data curation, writing—original draft, J.L.; data curation, project administration, R.Z.; supervision, W.S.; project administration, S.Y. All authors have read and agreed to the published version of the manuscript.

Funding

This research was funded by the National Natural Science Foundation of China, grant number 42372327, and the National Natural Science Foundation of China, grant number 42177153.

Institutional Review Board Statement

Not applicable.

Informed Consent Statement

Not applicable.

Data Availability Statement

The data presented in this study are available on request from the corresponding author.

Conflicts of Interest

Author Shaopeng Yuan was employed by the company BOSTD Geosynthetics Qingdao. The remaining authors declare that the research was conducted in the absence of any commercial or financial relationships that could be construed as a potential conflict of interest.

References

  1. Gavrilova, M. Climate and permafrost. Permafr. Periglac. Process. 1993, 4, 99–111. [Google Scholar] [CrossRef]
  2. Genc, D.; Ashlock, J.C.; Cetin, B.; Ceylan, H.; Cetin, K.; Horton, R. Comprehensive in-situ freeze-thaw monitoring under a granular-surfaced road system. Transp. Geotech. 2022, 34, 100758. [Google Scholar] [CrossRef]
  3. Koerner, R.M.; Koerner, G.R. A data base, statistics and recommendations regarding 171 failed geosynthetic reinforced mechanically stabilized earth (MSE) walls. Geotext. Geomembr. 2013, 40, 20–27. [Google Scholar] [CrossRef]
  4. Yang, B.C.; Qin, Z.P.; Zhou, Q.P.; Li, H.W.; Li, L.; Yang, X.S. Pavement damage behaviour of urban roads in seasonally frozen saline ground regions. Cold Reg. Sci. Technol. 2020, 174, 103035. [Google Scholar] [CrossRef]
  5. Jia, J.; Wei, H.Y.; Yang, D.H.; Wu, Y.C. The Impact of Freeze-Thaw Cycles on the Shear and Microstructural Characteristics of Compacted Silty Clay. Buildings 2023, 13, 2308. [Google Scholar] [CrossRef]
  6. Liu, J.K.; Chang, D.; Yu, Q.M. Influence of freeze-thaw cycles on mechanical properties of a silty sand. Eng. Geol. 2016, 210, 23–32. [Google Scholar] [CrossRef]
  7. Qi, J.; Vermeer, P.A.; Cheng, G. A review of the influence of freeze-thaw cycles on soil geotechnical properties. Permafr. Periglac. Process. 2006, 17, 245–252. [Google Scholar] [CrossRef]
  8. Qi, J.L.; Ma, W.; Song, C.X. Influence of freeze-thaw on engineering properties of a silty soil. Cold Reg. Sci. Technol. 2008, 53, 397–404. [Google Scholar] [CrossRef]
  9. Tang, L.; Cong, S.Y.; Geng, L.; Ling, X.Z.; Gan, F.D. The effect of freeze-thaw cycling on the mechanical properties of expansive soils. Cold Reg. Sci. Technol. 2018, 145, 197–207. [Google Scholar] [CrossRef]
  10. Zhang, Y.G.; Liu, S.H.; Deng, G.; Fang, B.X.; Zhang, Y.Y.; Lu, Y. Effect of freeze-thaw cycles on mechanical behavior of clay-gravel mixtures. J. Mt. Sci. 2022, 19, 3615–3626. [Google Scholar] [CrossRef]
  11. Zhou, Z.W.; Ma, W.; Zhang, S.J.; Mu, Y.H.; Li, G.Y. Effect of freeze-thaw cycles in mechanical behaviors of frozen loess. Cold Reg. Sci. Technol. 2018, 146, 9–18. [Google Scholar] [CrossRef]
  12. Estabragh, A.R.; Moghadas, M.; Javadi, A.A. Effect of different types of wetting fluids on the behaviour of expansive soil during wetting and drying. Soils Found. 2013, 53, 617–627. [Google Scholar] [CrossRef]
  13. Khemissa, M.; Mahamedi, A. Cement and lime mixture stabilization of an expansive overconsolidated clay. Appl. Clay Sci. 2014, 95, 104–110. [Google Scholar] [CrossRef]
  14. Seco, A.; Ramírez, F.; Miqueleiz, L.; García, B. Stabilization of expansive soils for use in construction. Appl. Clay Sci. 2011, 51, 348–352. [Google Scholar] [CrossRef]
  15. Li, G.X. From “Xi-rang” to geosynthetics. Chin. J. Geotech. Eng. 2013, 35, 144–149. [Google Scholar]
  16. Fan, K.; Pei, Q.; Liu, L.; Han, Z.; Zou, W. Strength and microstructure of a lignin fiber-reinforced expansive soil in cold regions. Geosynth. Int. 2022, 29, 622–629. [Google Scholar] [CrossRef]
  17. Liu, C.; Lv, Y.R.; Yu, X.J.; Wu, X. Effects of freeze-thaw cycles on the unconfined compressive strength of straw fiber-reinforced soil. Geotext. Geomembr. 2020, 48, 581–590. [Google Scholar] [CrossRef]
  18. Sun, Z.X.; Wang, R.C.; Yang, Z.N.; Lv, J.H.; Shi, W.; Ling, X.Z. Dynamic Behavior of Rubber Fiber-Reinforced Expansive Soil under Repeated Freeze-Thaw Cycles. Polymers 2024, 16, 2817. [Google Scholar] [CrossRef] [PubMed]
  19. Yang, Z.N.; Sun, Z.X.; Ling, X.Z.; Cai, G.J.; Wang, R.C.; Meng, X. Influence of Mixing Rubber Fibers on the Mechanical Properties of Expansive Clay under Freeze-Thaw Cycles. Appl. Sci. 2024, 14, 5437. [Google Scholar] [CrossRef]
  20. Yarbasi, N. Effect of Freeze-Thaw on Compressive Strength of Clayey Soils Reinforced with Wool. J. Nat. Fibers 2022, 19, 382–393. [Google Scholar] [CrossRef]
  21. Zhang, L.F.; Hu, Z.Q.; Li, H.R.; She, H.C.; Wang, X.L.; Han, X.N.; Yang, X. Mechanical Properties and Mesostructure Evolution of Fibre-Reinforced Loess under Freeze-Thaw Cycles. Adv. Civ. Eng. 2023, 2023, 3847003. [Google Scholar] [CrossRef]
  22. Lai, Y.M.; Zhang, S.M.; Yu, W.B. A new structure to control frost boiling and frost heave of embankments in cold regions. Cold Reg. Sci. Technol. 2012, 79–80, 53–66. [Google Scholar] [CrossRef]
  23. Li, C.; Vennapusa, P.K.R.; Ashlock, J.; White, D.J. Mechanistic-based comparisons for freeze-thaw performance of stabilized unpaved roads. Cold Reg. Sci. Technol. 2017, 141, 97–108. [Google Scholar] [CrossRef]
  24. Wang, D.R.; Wang, S.L.; Tighe, S.; Bhat, S.; Yin, S.D. Construction of Geosynthetic-Reinforced Pavements and Evaluation of Their Impacts. Appl. Sci. 2023, 13, 10327. [Google Scholar] [CrossRef]
  25. Tiwari, N.; Satyam, N. An experimental study on strength improvement of expansive subgrades by polypropylene fibers and geogrid reinforcement. Sci. Rep. 2022, 12, 6685. [Google Scholar] [CrossRef] [PubMed]
  26. Wu, M.T.; Liu, F.C.; Yang, J. Stress-strain-strength behavior of geosynthetic reinforced rubber-sand mixtures. Acta Geotech. 2023, 18, 4835–4846. [Google Scholar] [CrossRef]
  27. Bai, Q.Y.; Liu, J.; Wang, Y.; Du, H.Y.; Wang, B. Experimental Investigation of Interface Characteristics between Geogrid and Coarse-Grained Soil in a Seasonally Frozen Area. Appl. Sci. 2022, 12, 10187. [Google Scholar] [CrossRef]
  28. Meng, Y.; Xu, C.; Yang, Y.; Du, C.X.; Jia, B.; Zhao, C.X. Study on the mechanism of freeze-thaw cycles on the shear strength of geogrid-sand interface. Cold Reg. Sci. Technol. 2024, 225, 104275. [Google Scholar] [CrossRef]
  29. Wang, Z.J.; Jacobs, F.; Ziegler, M. Visualization of load transfer behaviour between geogrid and sand using PFC2D. Geotext. Geomembr. 2014, 42, 83–90. [Google Scholar] [CrossRef]
  30. Cui, F.; Xiao, C.; Han, J.; Gao, S.; Tian, W. Performance of laboratory geogrid-reinforced retaining walls under freeze-thaw cycles. Geosynth. Int. 2022, 29, 81–98. [Google Scholar] [CrossRef]
  31. Xiao, C.Z.; Cui, F.L.; Ding, L.Q.; Wang, F.; Tian, W.L. Temperature Distributions in Geogrid-Reinforced Soil Retaining Walls Subjected to Seasonal Freeze-Thaw Cycles. Int. J. Geomech. 2022, 22, 04022234. [Google Scholar] [CrossRef]
  32. GB/T 50123-2019; Standard for geotechnical testing method. Ministry of Housing and Urban-Rural Development of the People’s Republic of China: Beijing, China, 2019.
  33. Kravchenko, E.; Liu, J.K.; Niu, W.W.; Zhang, S.J. Performance of clay soil reinforced with fibers subjected to freeze-thaw cycles. Cold Reg. Sci. Technol. 2018, 153, 18–24. [Google Scholar] [CrossRef]
  34. Orakoglu, M.E.; Liu, J. Effect of freeze-thaw cycles on triaxial strength properties of fiber-reinforced clayey soil. KSCE J. Civ. Eng. 2017, 21, 2128–2140. [Google Scholar] [CrossRef]
  35. Ghazavi, M.; Roustaie, M. The influence of freeze–thaw cycles on the unconfined compressive strength of fiber-reinforced clay. Cold Reg. Sci. Technol. 2010, 61, 125–131. [Google Scholar] [CrossRef]
  36. Roustaei, M.; Eslami, A.; Ghazavi, M. Effects of freeze–thaw cycles on a fiber reinforced fine grained soil in relation to geotechnical parameters. Cold Reg. Sci. Technol. 2015, 120, 127–137. [Google Scholar] [CrossRef]
  37. Wang, X.; Guo, M.; Hu, B. Triaxial testing study of expansive soil reinforced with geogrid. Rock Soil Mech. 2011, 32, 1649–1653. [Google Scholar] [CrossRef]
  38. Cui, K.; Zhang, D.J.; Li, Q.L.; Yang, S.C.; Zhang, H.D. Experimental investigation on the accumulated strain of coarse-grained soil reinforced by geogrid under high-cycle cyclic loading. Geotext. Geomembr. 2023, 51, 233–244. [Google Scholar] [CrossRef]
  39. Zhao, G.T.; Han, Z.; Zou, W.L.; Wang, X.Q. Evolution of mechanical behaviours of an expansive soil during drying-wetting, freeze–thaw, and drying-wetting-freeze–thaw cycles. Bull. Eng. Geol. Environ. 2021, 80, 8109–8121. [Google Scholar] [CrossRef]
  40. Han, X.N.; Hu, Z.Q.; Li, H.R.; Yin, Y.; Zhang, B.B.; Zhang, L.F. Study on the mechanical properties and microstructural evolution of loess under different wet-dry and freeze-thaw coupled cycling paths. Case Stud. Constr. Mater. 2024, 21, e03924. [Google Scholar] [CrossRef]
  41. Zou, W.L.; Han, Z.; Zhao, G.T.; Fan, K.W.; Vanapalli, S.K.; Wang, X.Q. Effects of cyclic freezing and thawing on the shear behaviors of an expansive soil under a wide range of stress levels. Environ. Earth Sci. 2022, 81, 77. [Google Scholar] [CrossRef]
  42. Wang, D.Y.; Ma, W.; Niu, Y.H.; Chang, X.X.; Wen, Z. Effects of cyclic freezing and thawing on mechanical properties of Qinghai–Tibet clay. Cold Reg. Sci. Technol. 2007, 48, 34–43. [Google Scholar] [CrossRef]
  43. Ghazavi, M.; Roustaei, M. Freeze–thaw performance of clayey soil reinforced with geotextile layer. Cold Reg. Sci. Technol. 2013, 89, 22–29. [Google Scholar] [CrossRef]
  44. Wei, L.; Chai, S.X.; Xue, M.L.; Wang, P.; Li, F. Structural damage and shear performance degradation of fiber-lime-soil under freeze-thaw cycling. Geotext. Geomembr. 2022, 50, 845–857. [Google Scholar] [CrossRef]
  45. Li, L.; Shao, W.; Li, Y.; Cetin, B. Effects of climatic factors on mechanical properties of cement and fiber reinforced clays. Geotech. Geol. Eng. 2015, 33, 537–548. [Google Scholar] [CrossRef]
  46. Duncan, J.M.; Chang, C.-Y. Nonlinear analysis of stress and strain in soils. J. Soil Mech. Found. Div. 1970, 96, 1629–1653. [Google Scholar] [CrossRef]
Figure 1. Test procedure.
Applsci 15 05492 g001
Figure 2. Geogrid arrangement for triaxial tests.
Applsci 15 05492 g002
Figure 3. (a) F-T devices (TMS9018-250) and (b) triaxial test devices (GDS).
Applsci 15 05492 g003
Figure 4. (a) Reinforcement mechanism; (b) diagram of specimen reinforcement effect; (c) shear deformation of reinforced soil with different layers of geogrids.
Applsci 15 05492 g004
Figure 5. Stress–strain curves of the unreinforced and reinforced specimens, (a) σ 3 = 100 kPa, N = 0; (b) σ 3 = 100 kPa, N = 3; (c) σ 3 = 200 kPa, N = 0; (d) σ 3 = 200 kPa, N = 3; (e) σ 3 = 200 kPa, N = 6; (f) correlation between elastic modulus and freeze–thaw cycle [9,39].
Applsci 15 05492 g005
Figure 6. Variation of normalized shear strength versus F-T cycles in this study (a) σ 3 = 100 kPa; (b) σ 3 = 200 kPa; (c) σ 3 = 300 kPa.
Applsci 15 05492 g006
Figure 7. Normalized shear strength in present paper compared to the previous studies [9,34,39,43].
Applsci 15 05492 g007
Figure 8. Variation of normalized elastic modulus versus F-T cycles in this study, (a) σ 3 = 100 kPa; (b) σ 3 = 200 kPa; (c) σ 3 = 300 kPa.
Applsci 15 05492 g008
Figure 9. Normalized elastic modulus in present paper compared to the previous studies [9,34,39,43].
Applsci 15 05492 g009
Figure 10. Variation of friction angle (a) and cohesion versus (b) F-T cycles.
Applsci 15 05492 g010
Figure 11. Measured and predicted values of initial elastic modulus (a) and ultimate strength (b).
Applsci 15 05492 g011
Figure 12. Comparison between the experimental data and predicted results.
Applsci 15 05492 g012
Table 1. Basic index properties of the tested expansive soil.
Natural
Moisture
Content/%
Optimal
Moisture
Content/%
Saturated
Moisture
Content/%
Dry Density
/(g/cm³)
Free Swelling Rate/%Cohesion
/MPa
Friction
Angle/°
5.671834.81.69011.527.3
Table 2. Mechanical properties of the geogrid material.
MaterialElongation/%Grid Size
/ mm   × mm
Elastic
Modulus/GPa
Tensile Strength/(KN/m)
LongitudinalTransversal
polypropylene≤1020 × 20652525
Table 3. Triaxial test program.
Test
Condition
F-T (N)Geogrid LayersConfining Pressure/kPaLoading Rate/mm∙min−1
CU0/1/3/6/100/1/3/5100/200/3000.2
Table 4. Initial elastic modulus and ultimate strength.
Sample NumberF-TGeogrid LayersConfining Pressure/kPa E i /MPa ( σ 1 σ 3 ) u l t /kPa R 2
GRES-10320063.69925.90.999
GRES-2137.74892.90.999
GRES-3336.36833.30.999
GRES-4636.768130.999
GRES-51032.058000.999
GRES-63020026.45719.40.999
GRES-7131.21773.30.999
GRES-8336.36833.30.999
GRES-9544.05917.40.999
GRES-1010310027.32601.590.994
GRES-1120032.05801.250.999
GRES-1230043.36961.580.999
Disclaimer/Publisher’s Note: The statements, opinions and data contained in all publications are solely those of the individual author(s) and contributor(s) and not of MDPI and/or the editor(s). MDPI and/or the editor(s) disclaim responsibility for any injury to people or property resulting from any ideas, methods, instructions or products referred to in the content.

