
Structural Behaviour of Concrete Deep Beams Reinforced with Aluminium Alloy Bars

Abstract
1. Introduction
2. Analysis of AA RC Beams
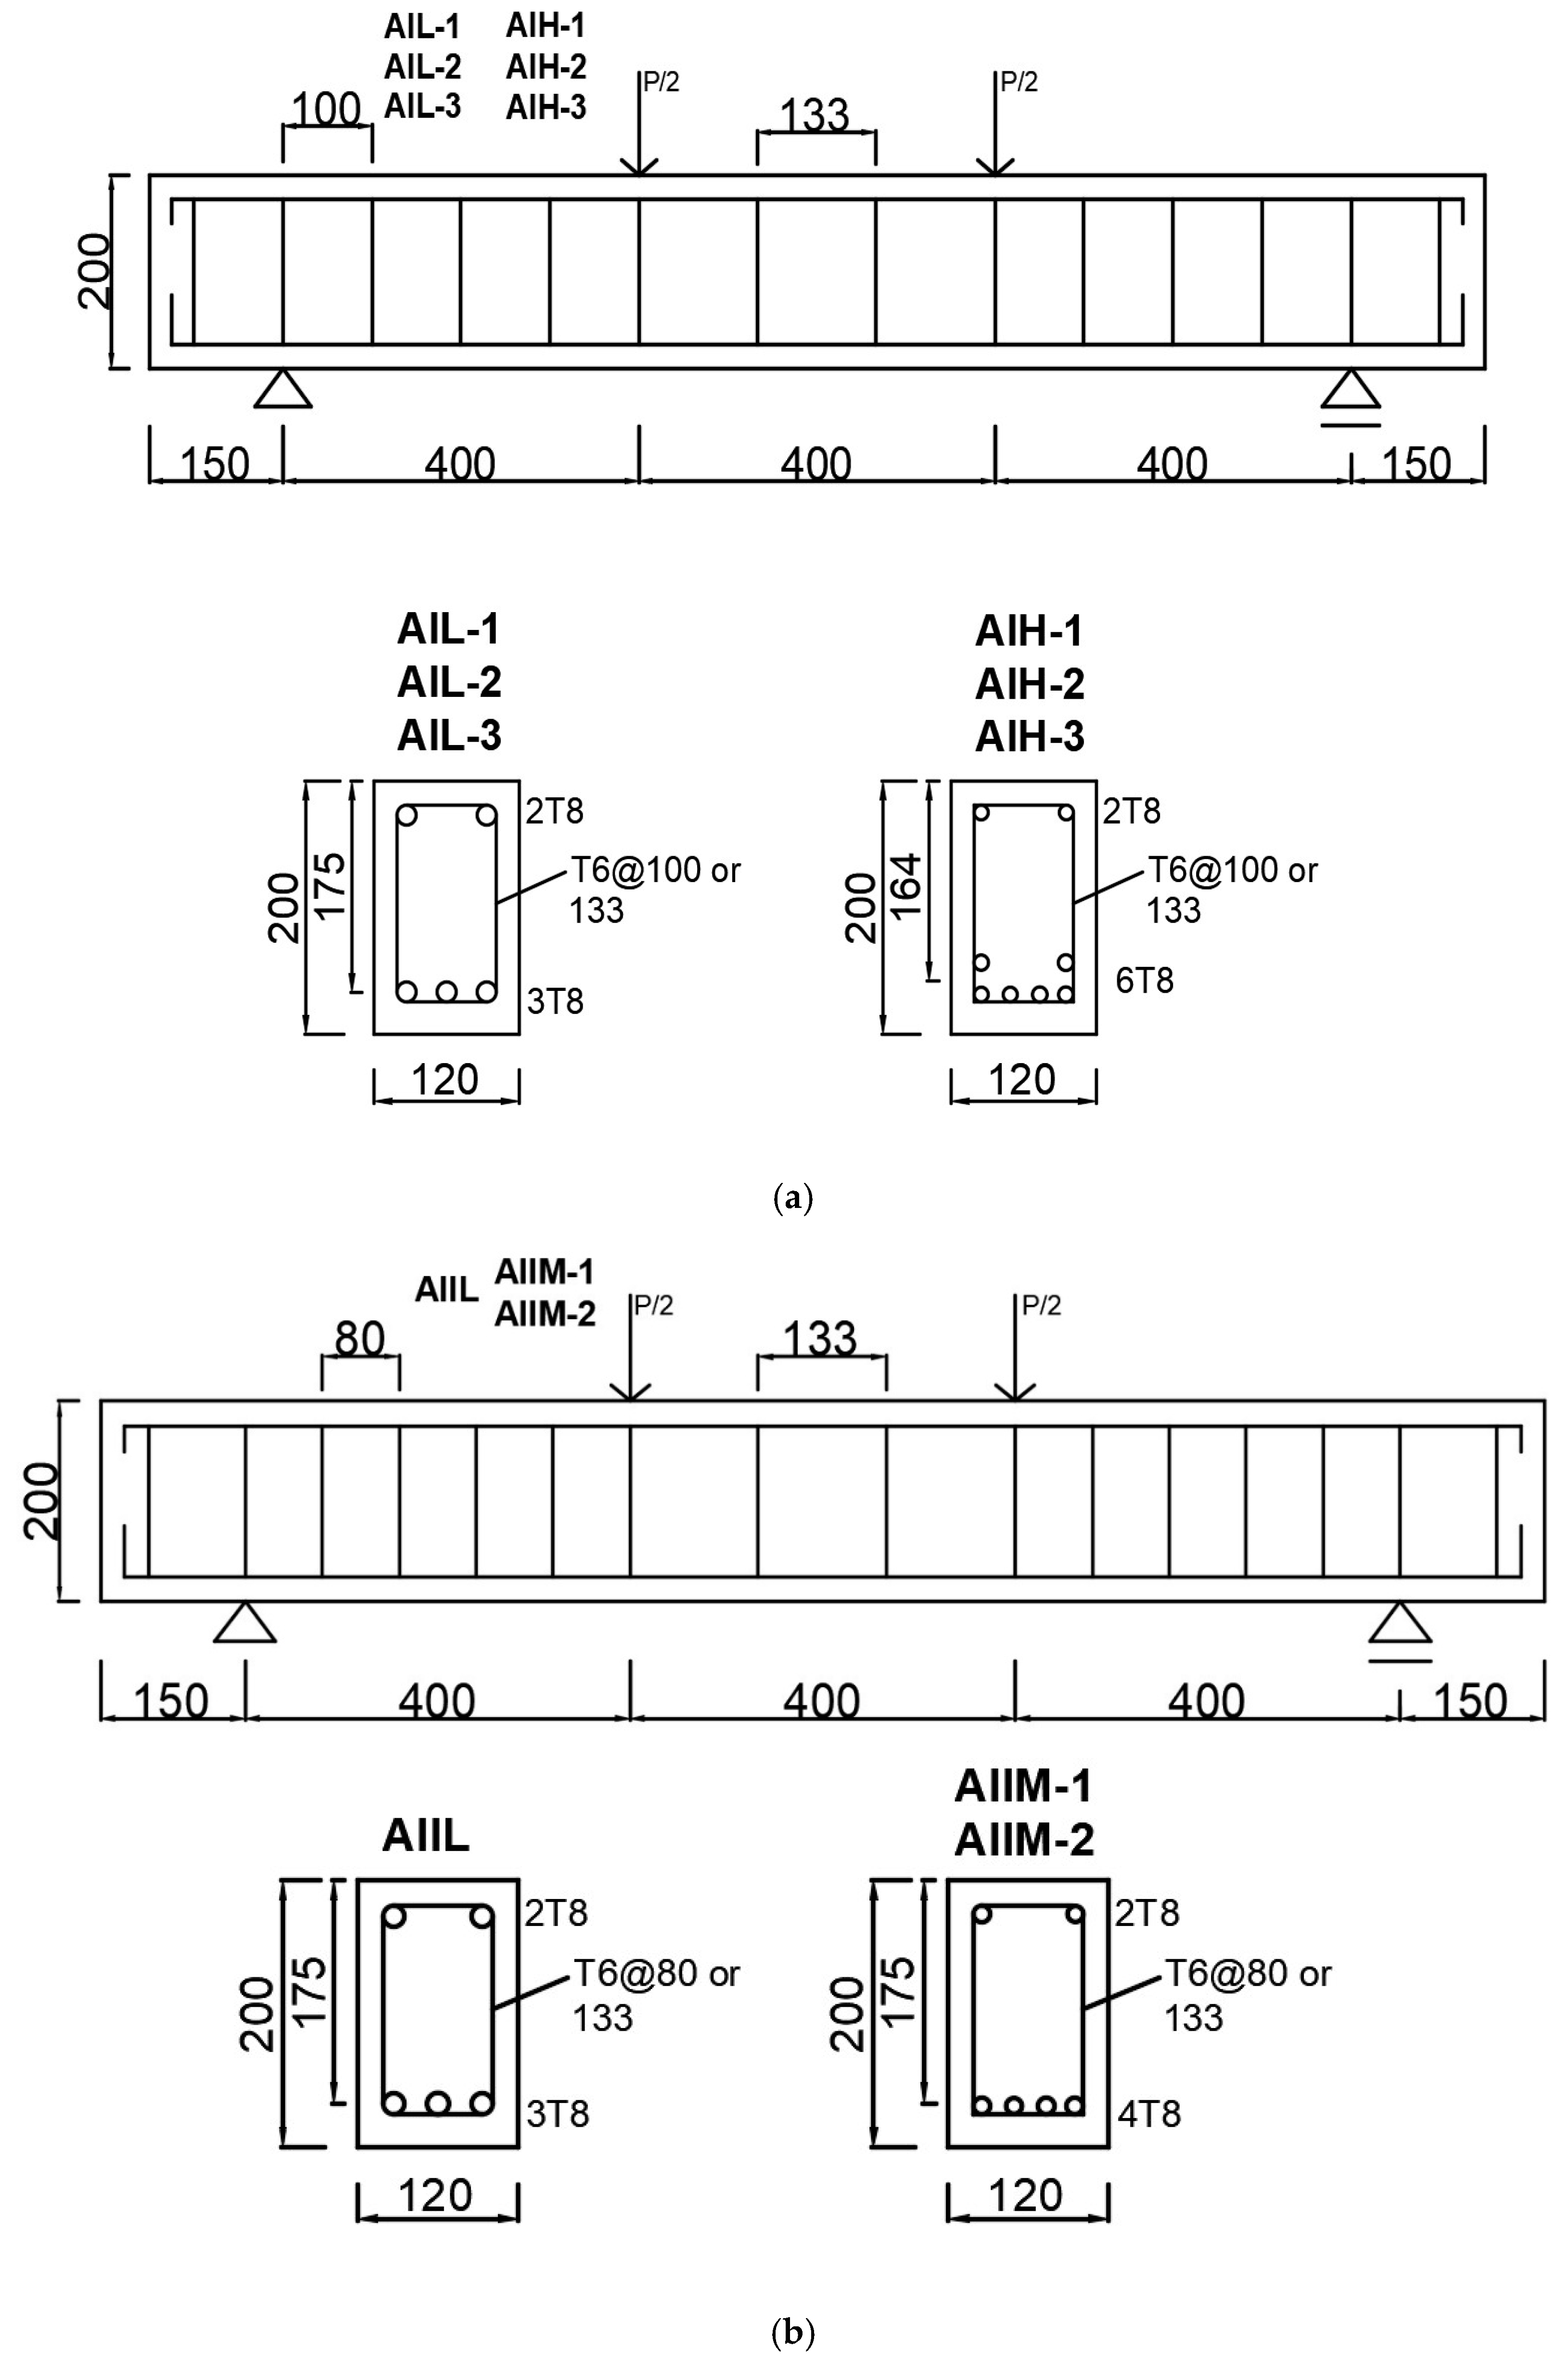
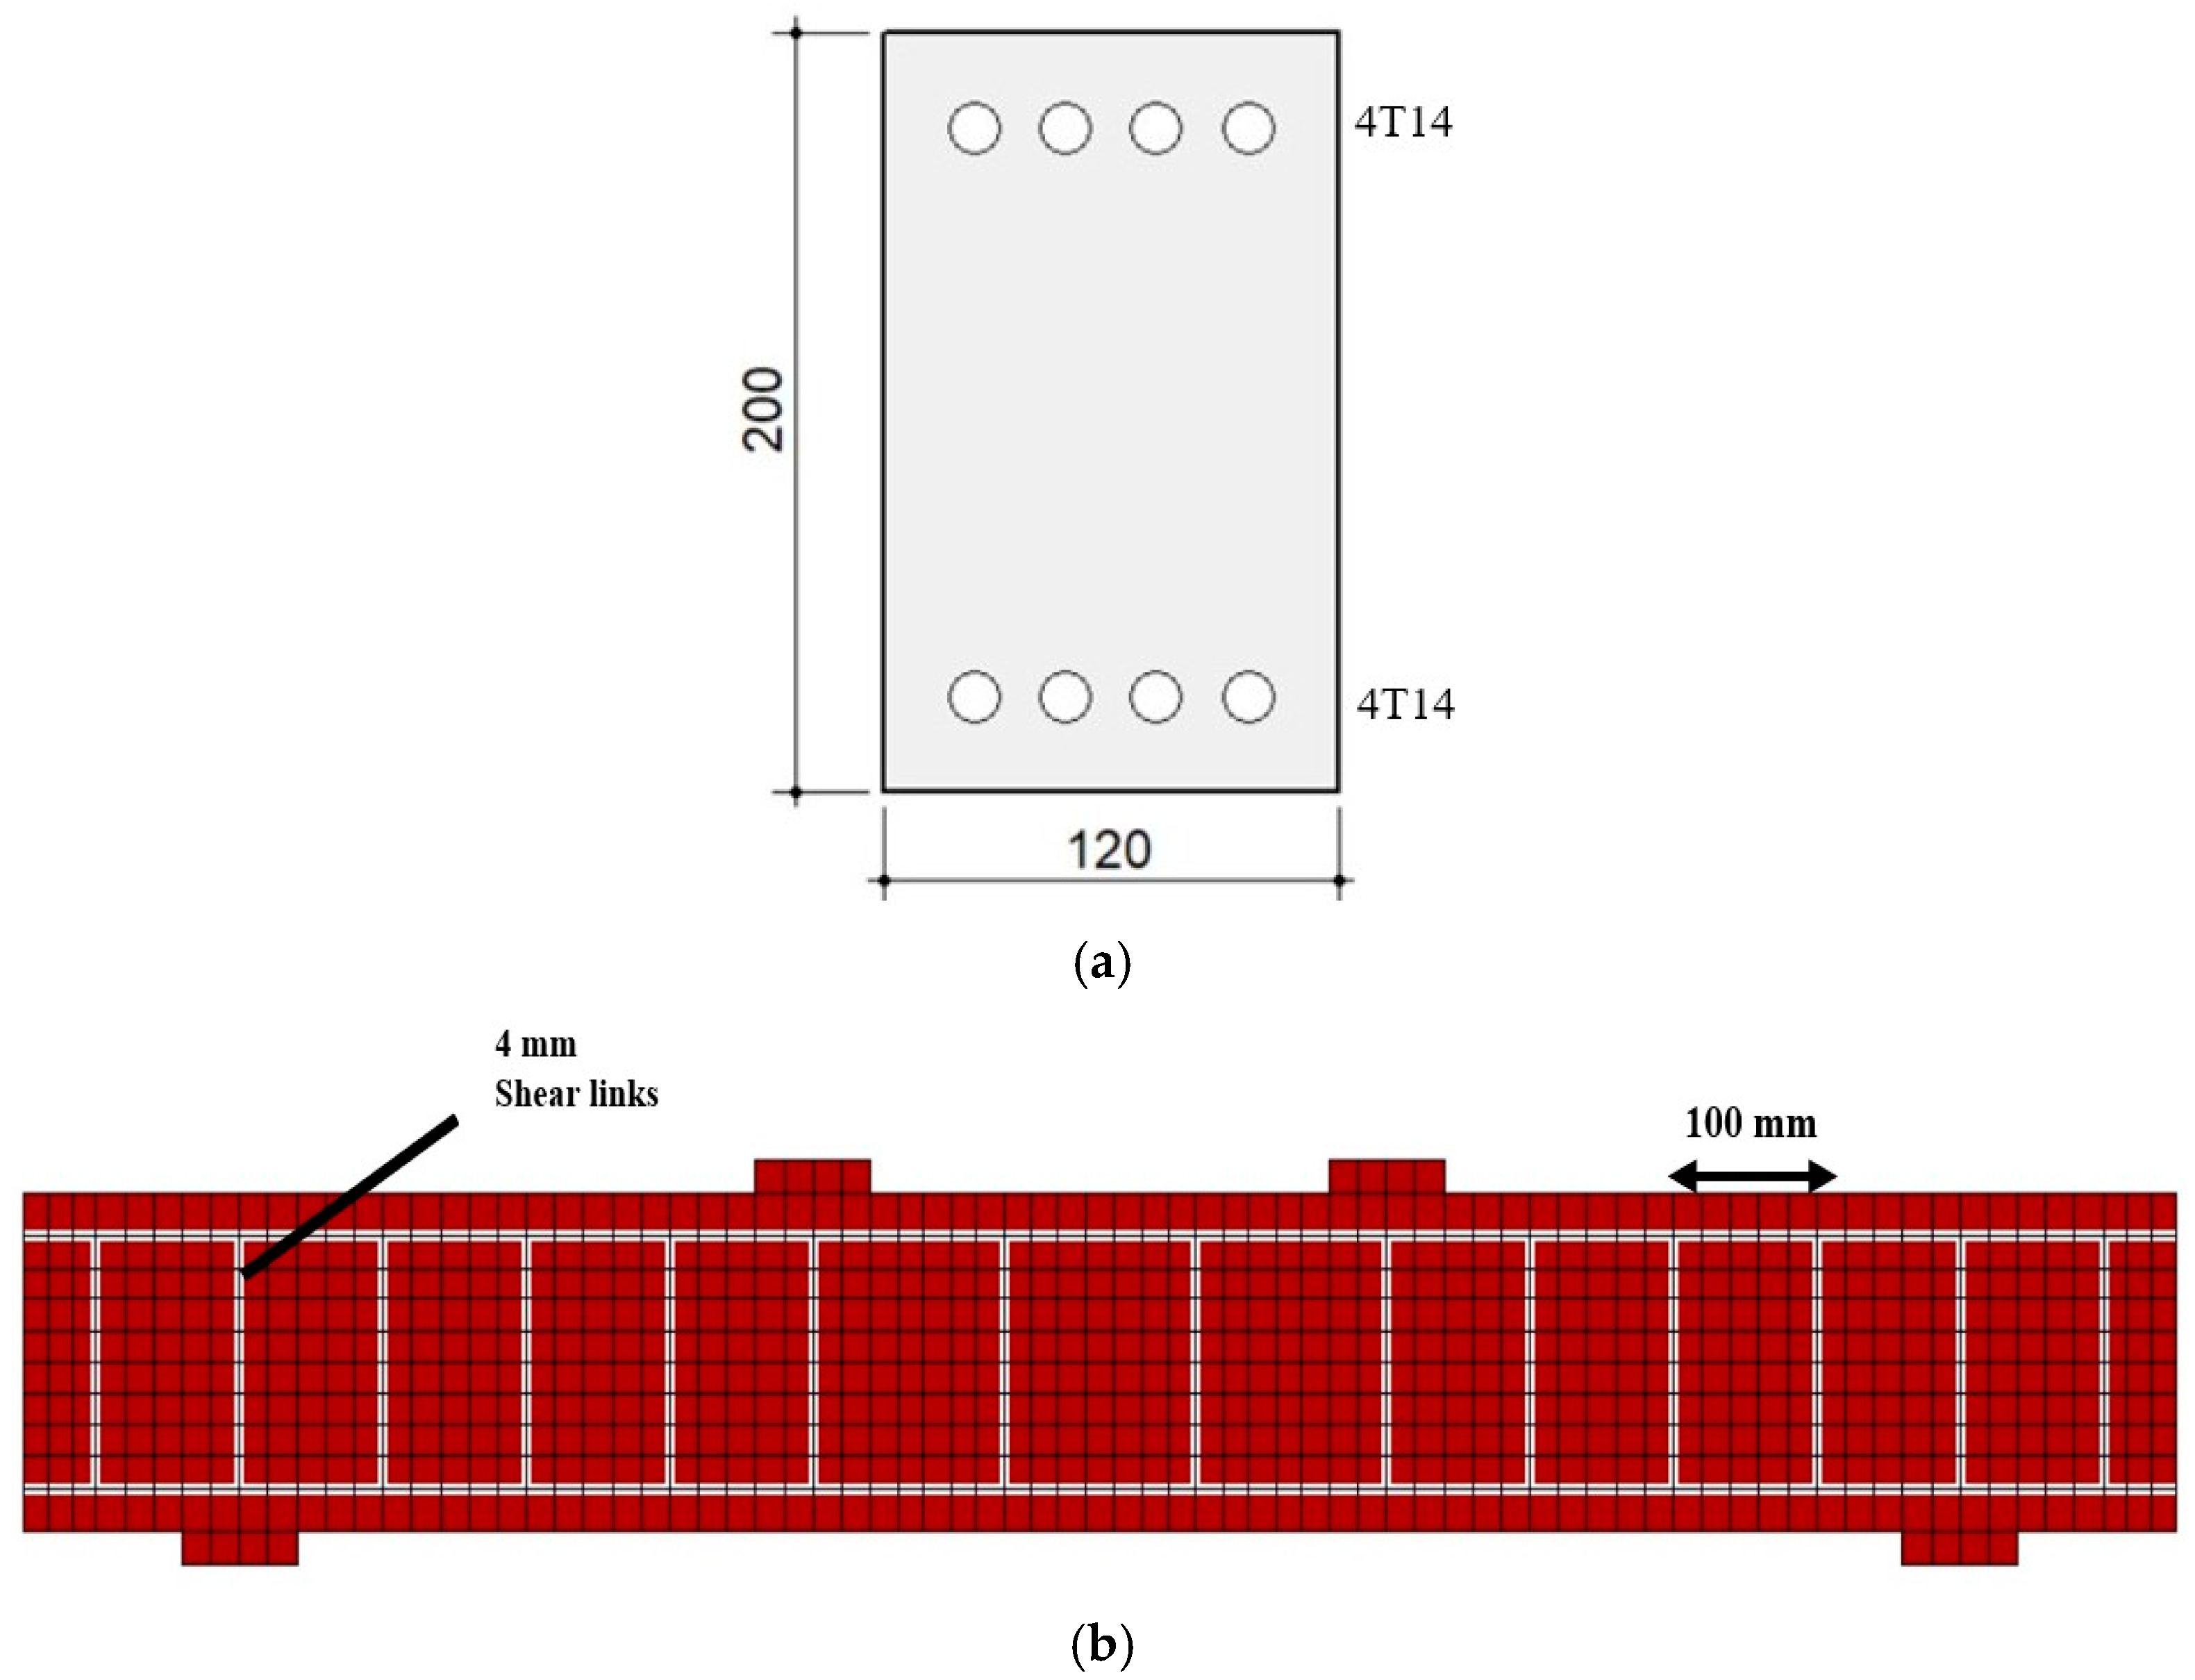
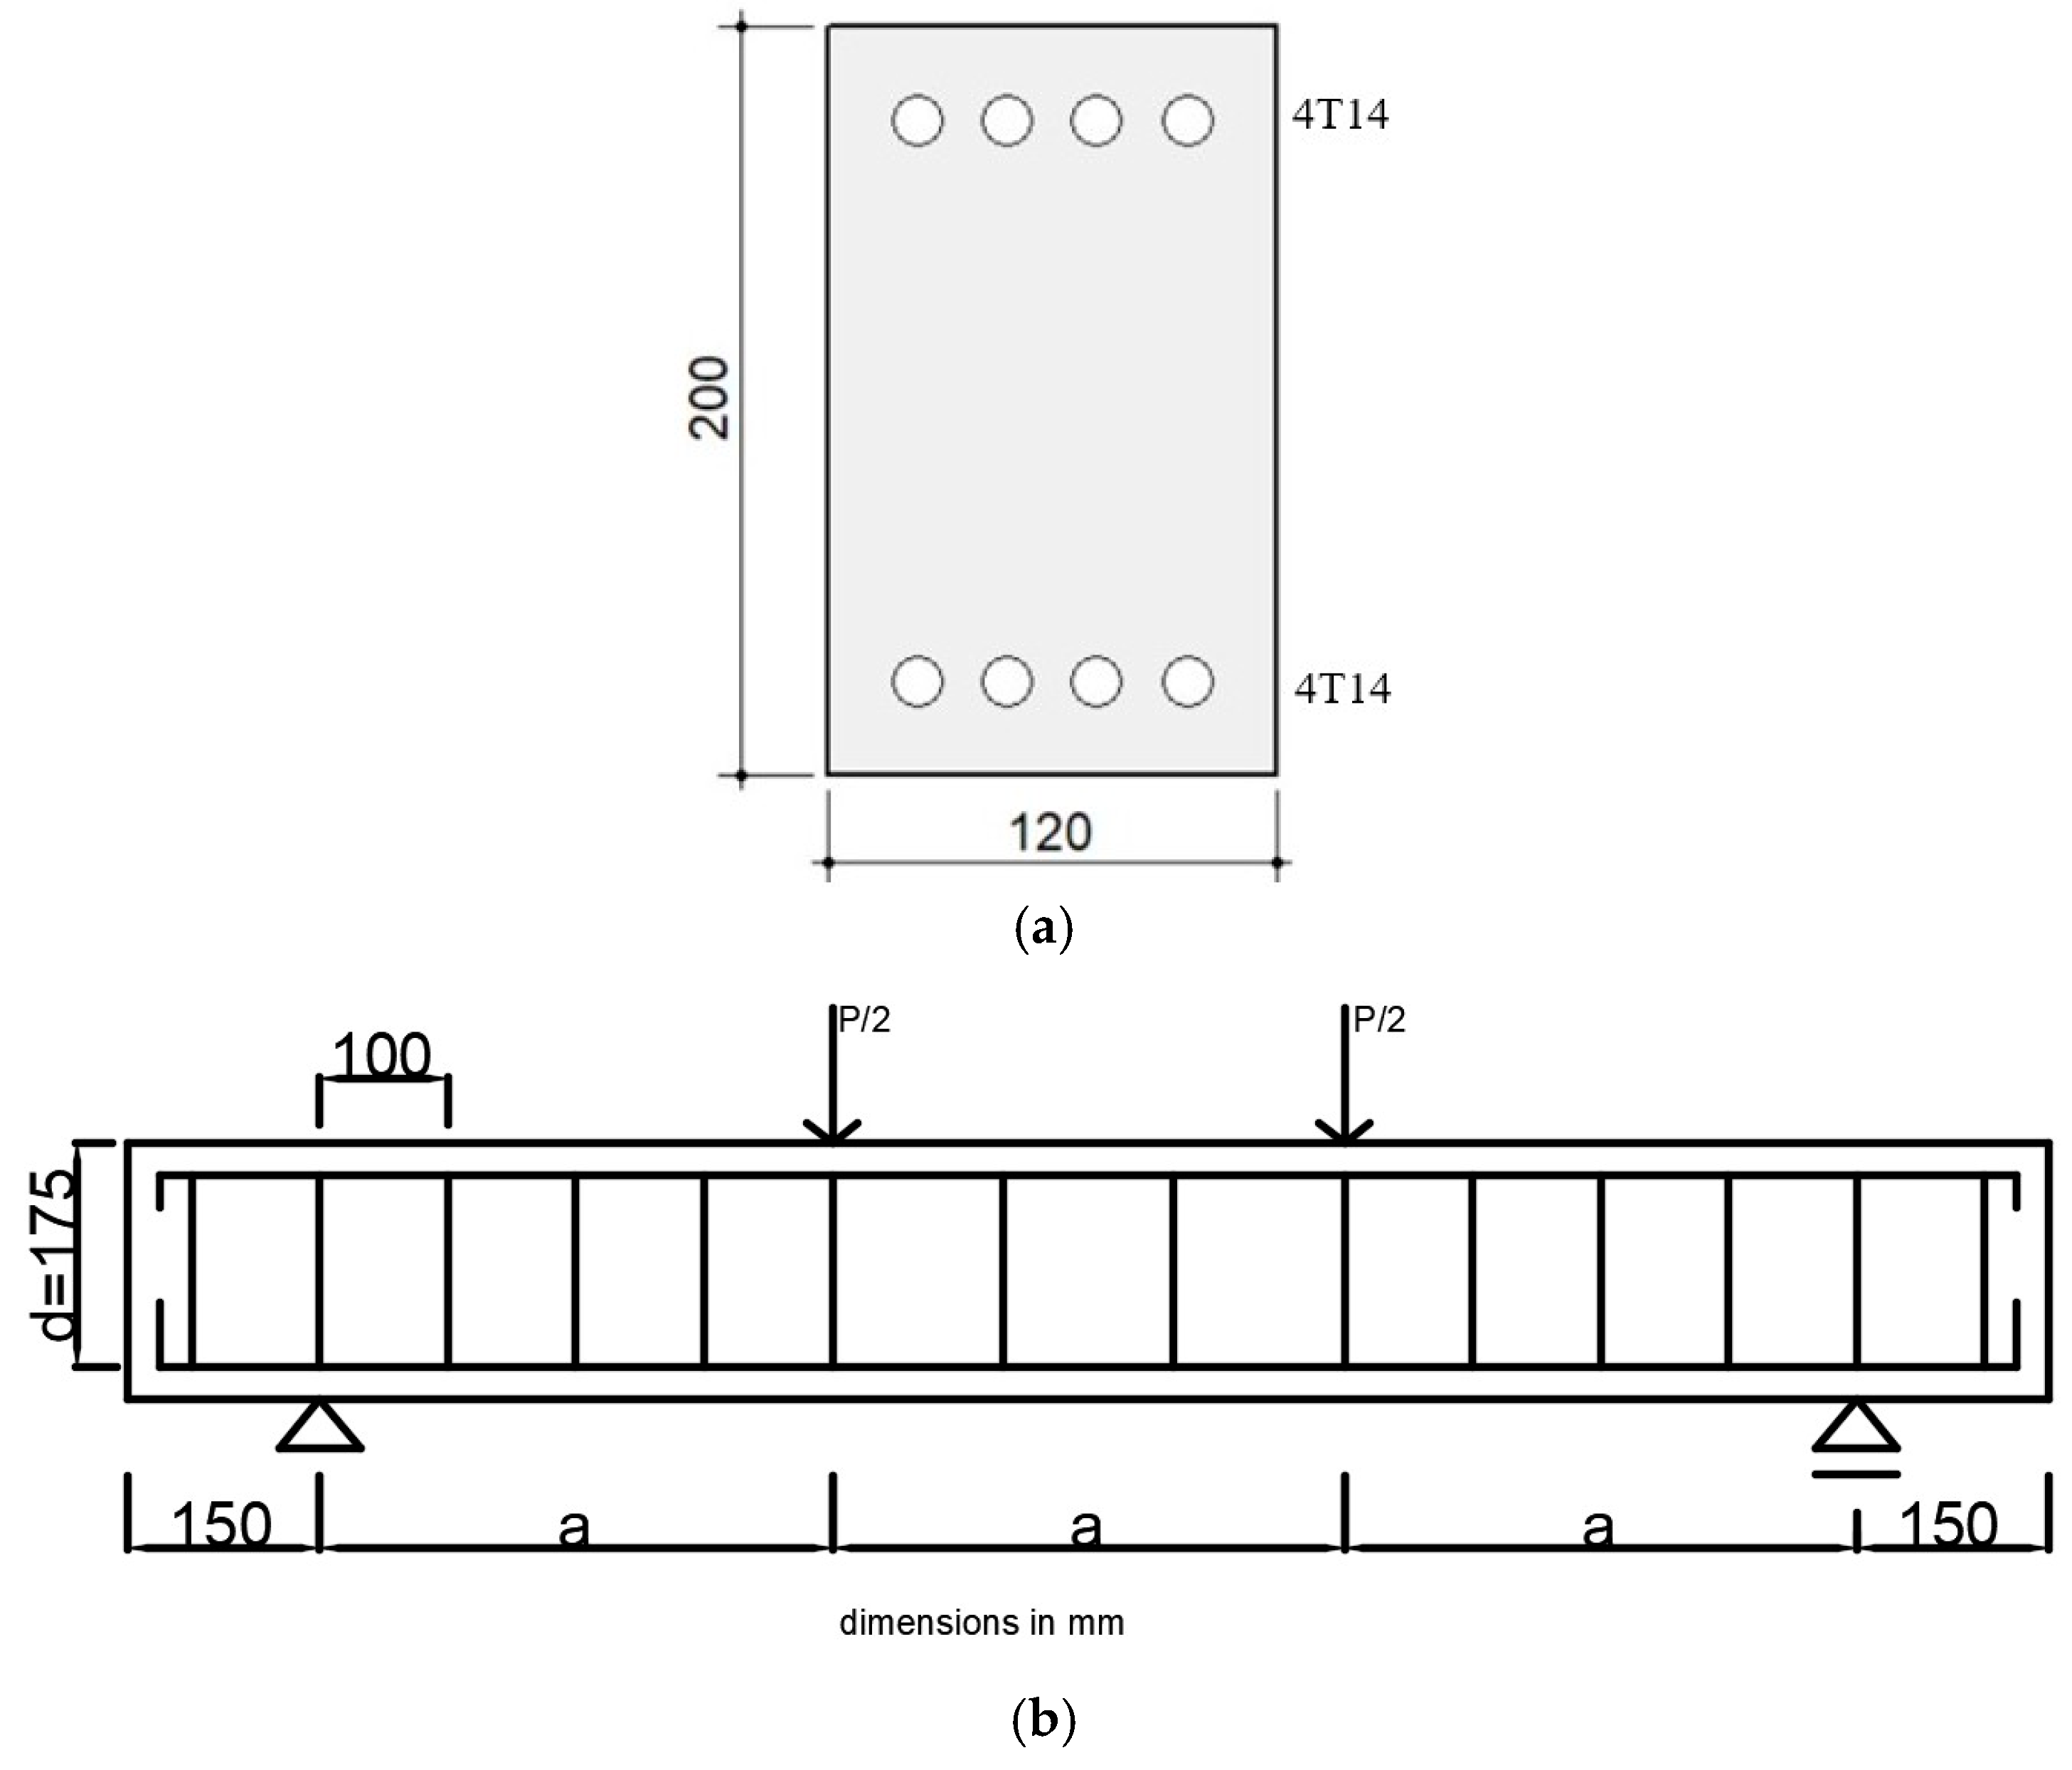
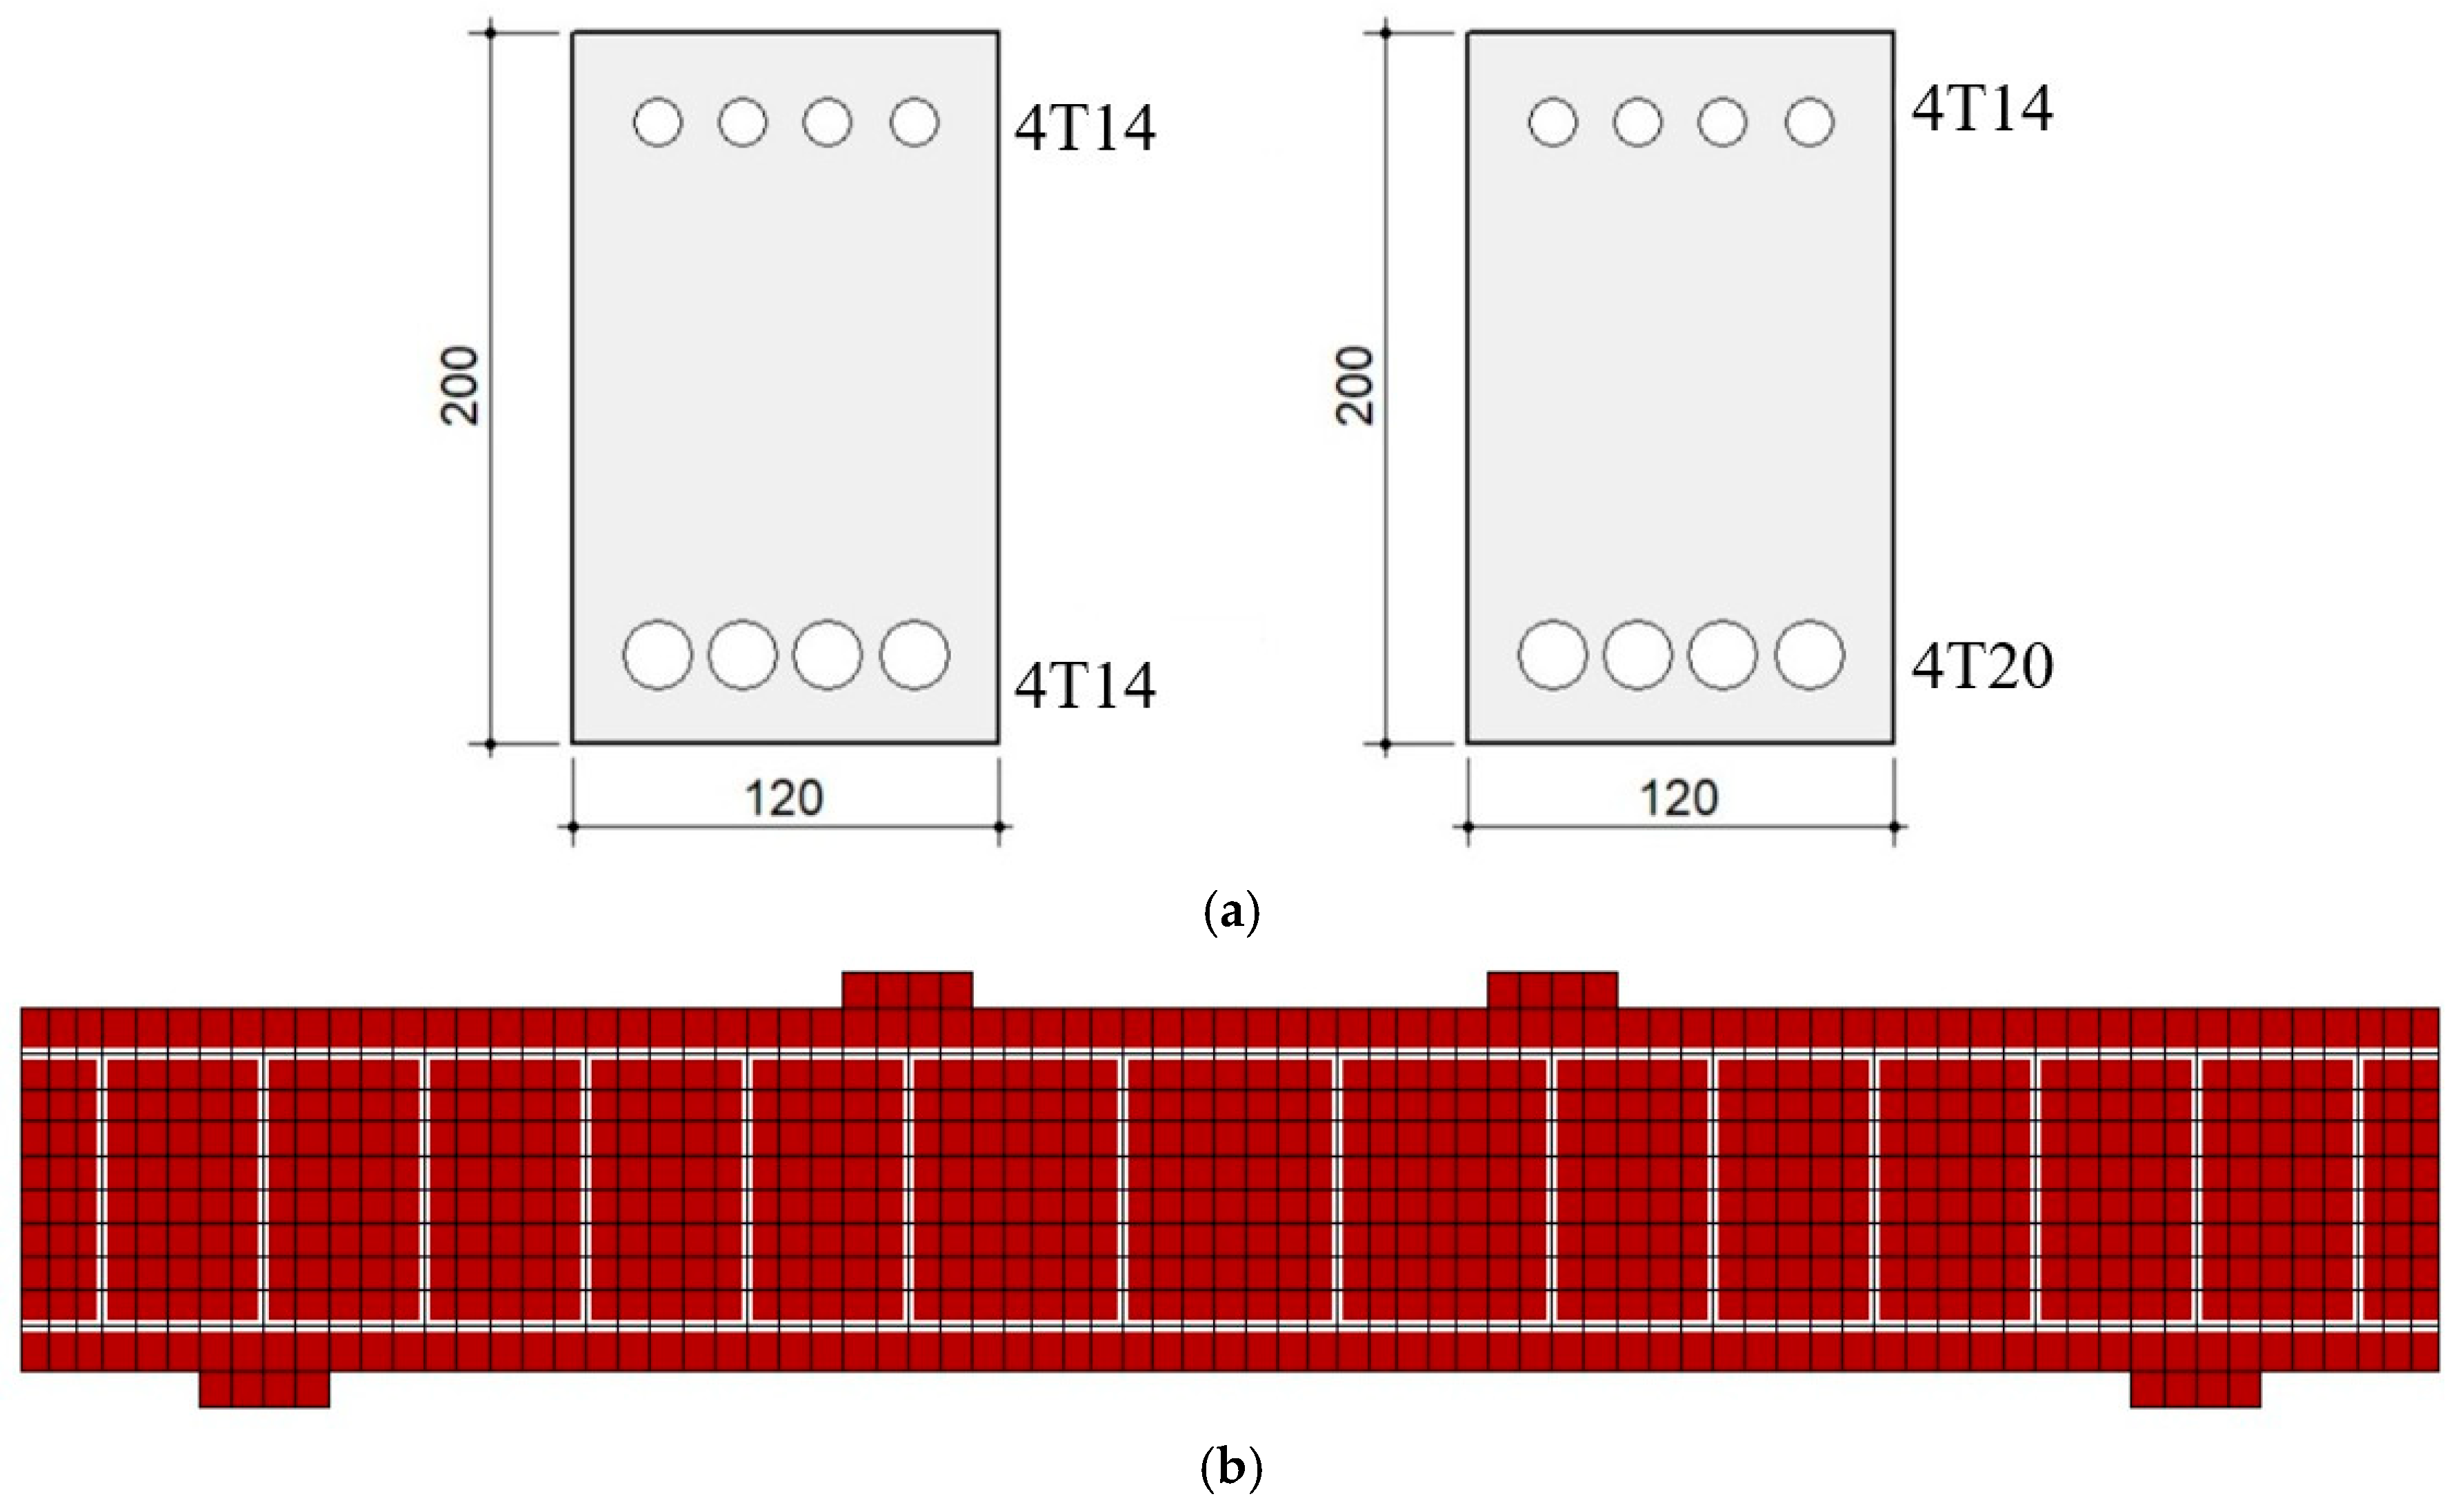
2.1. Description of Specimens
2.2. FE Model
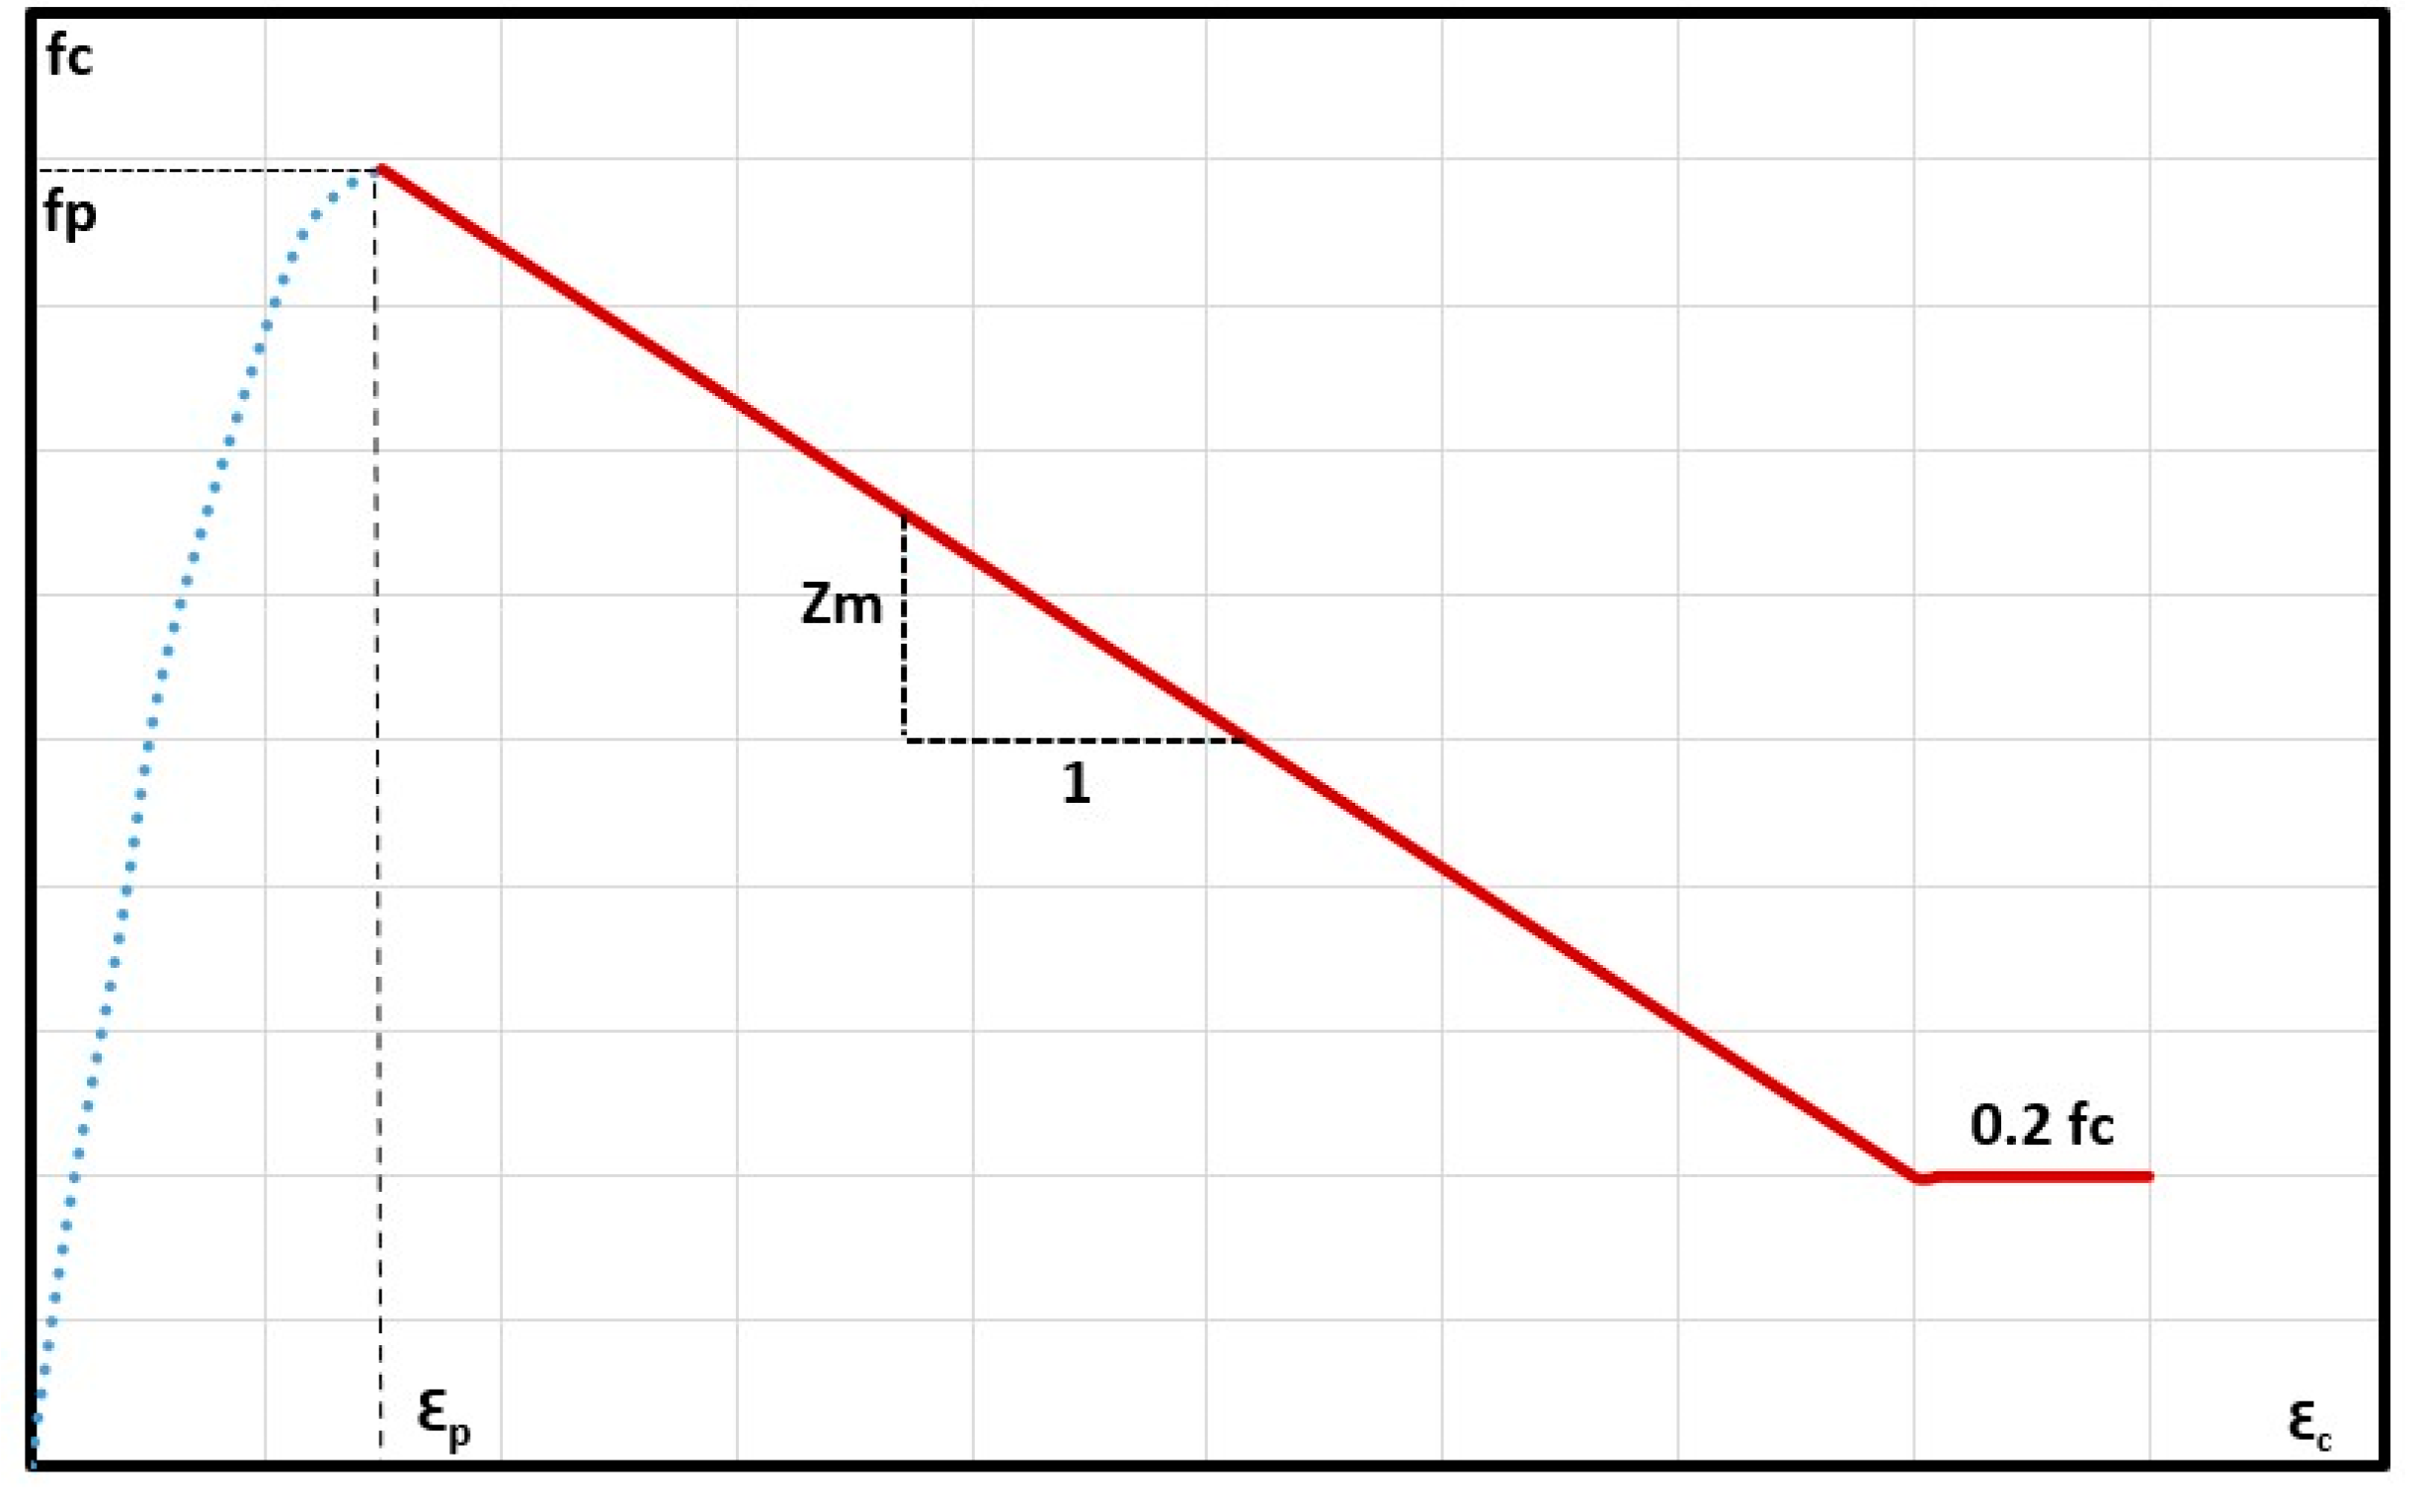
2.2.1. Material Model
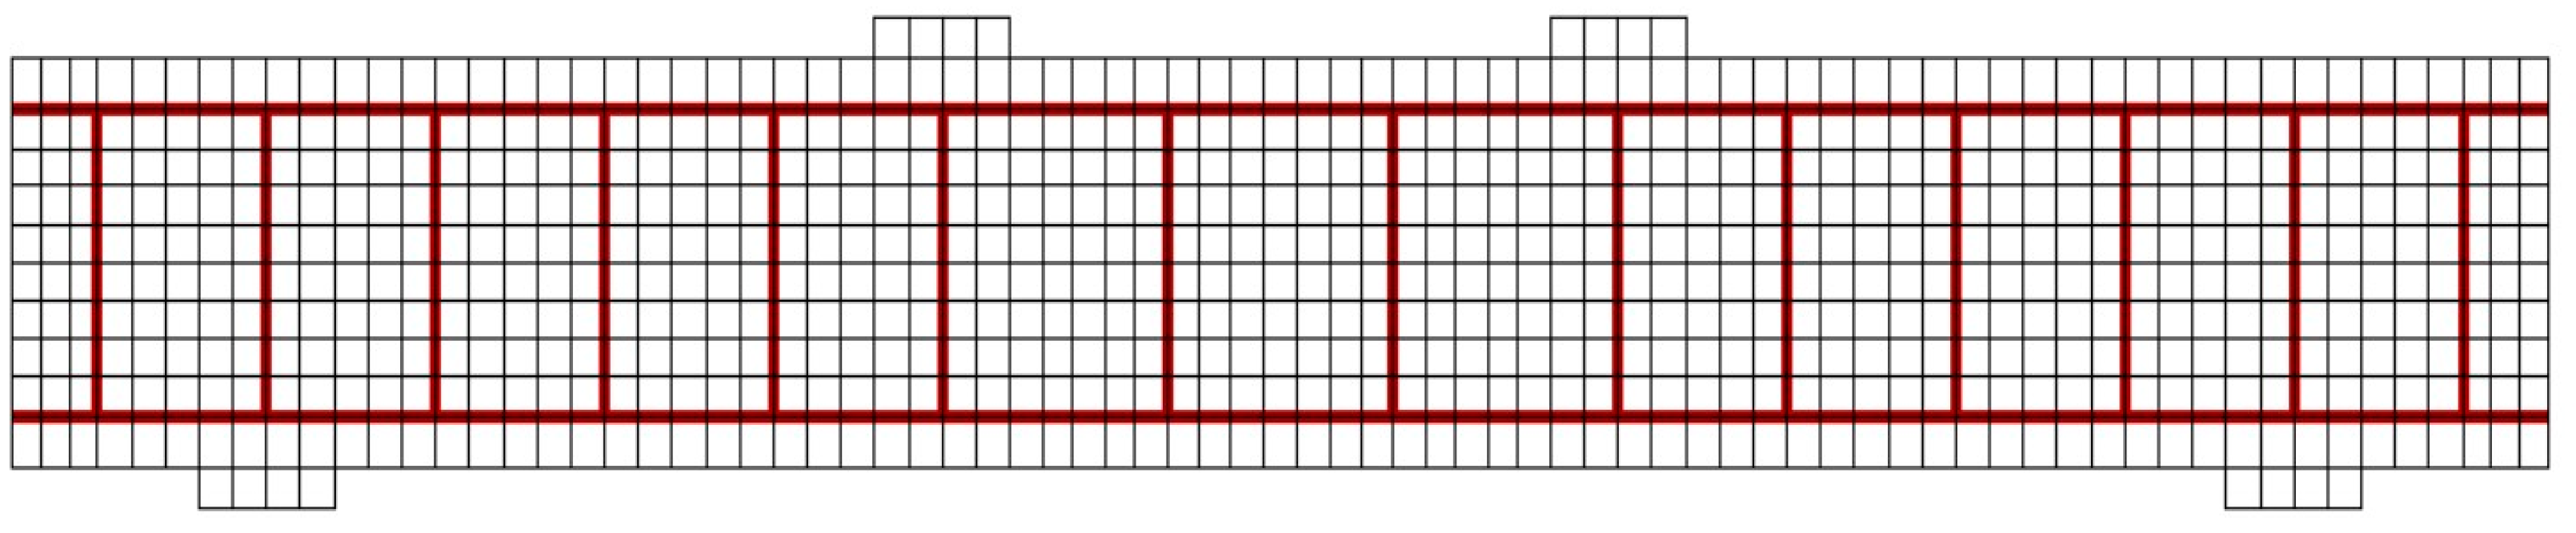
2.2.2. Geometrical Details of FE Model
2.3. Solution
3. Results and Discussion
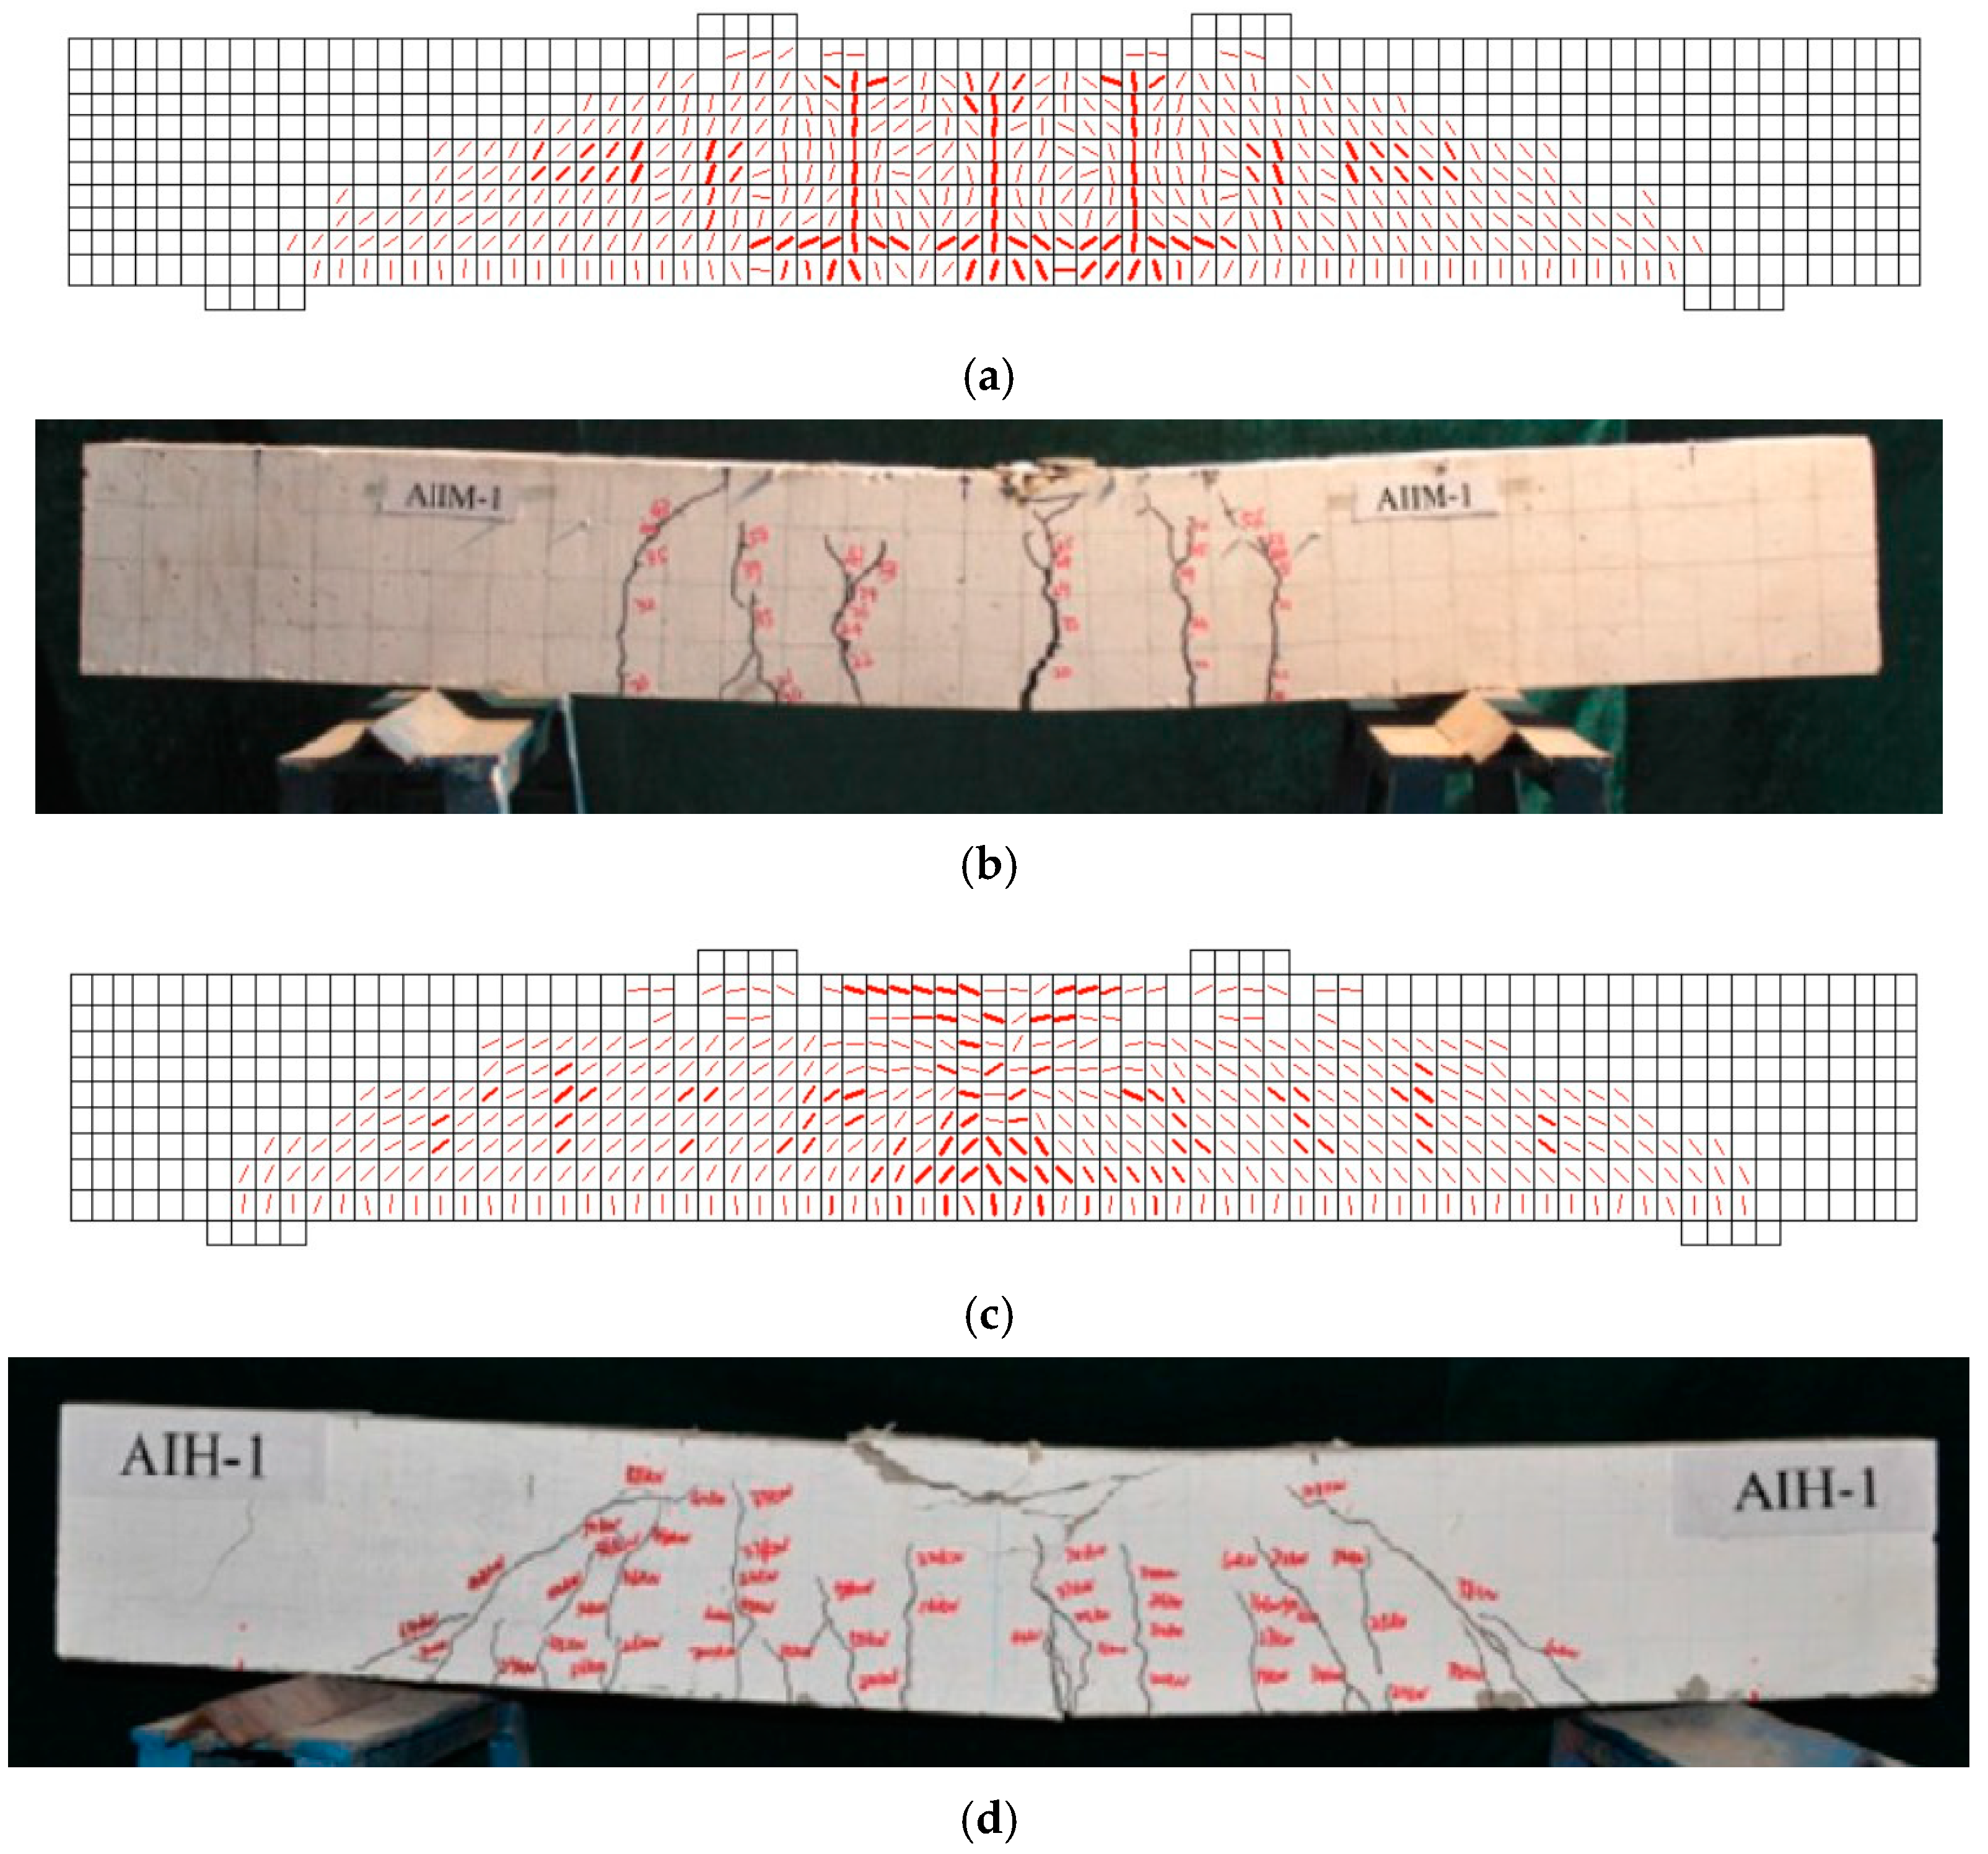
3.1. Validation
3.2. Parametric Study
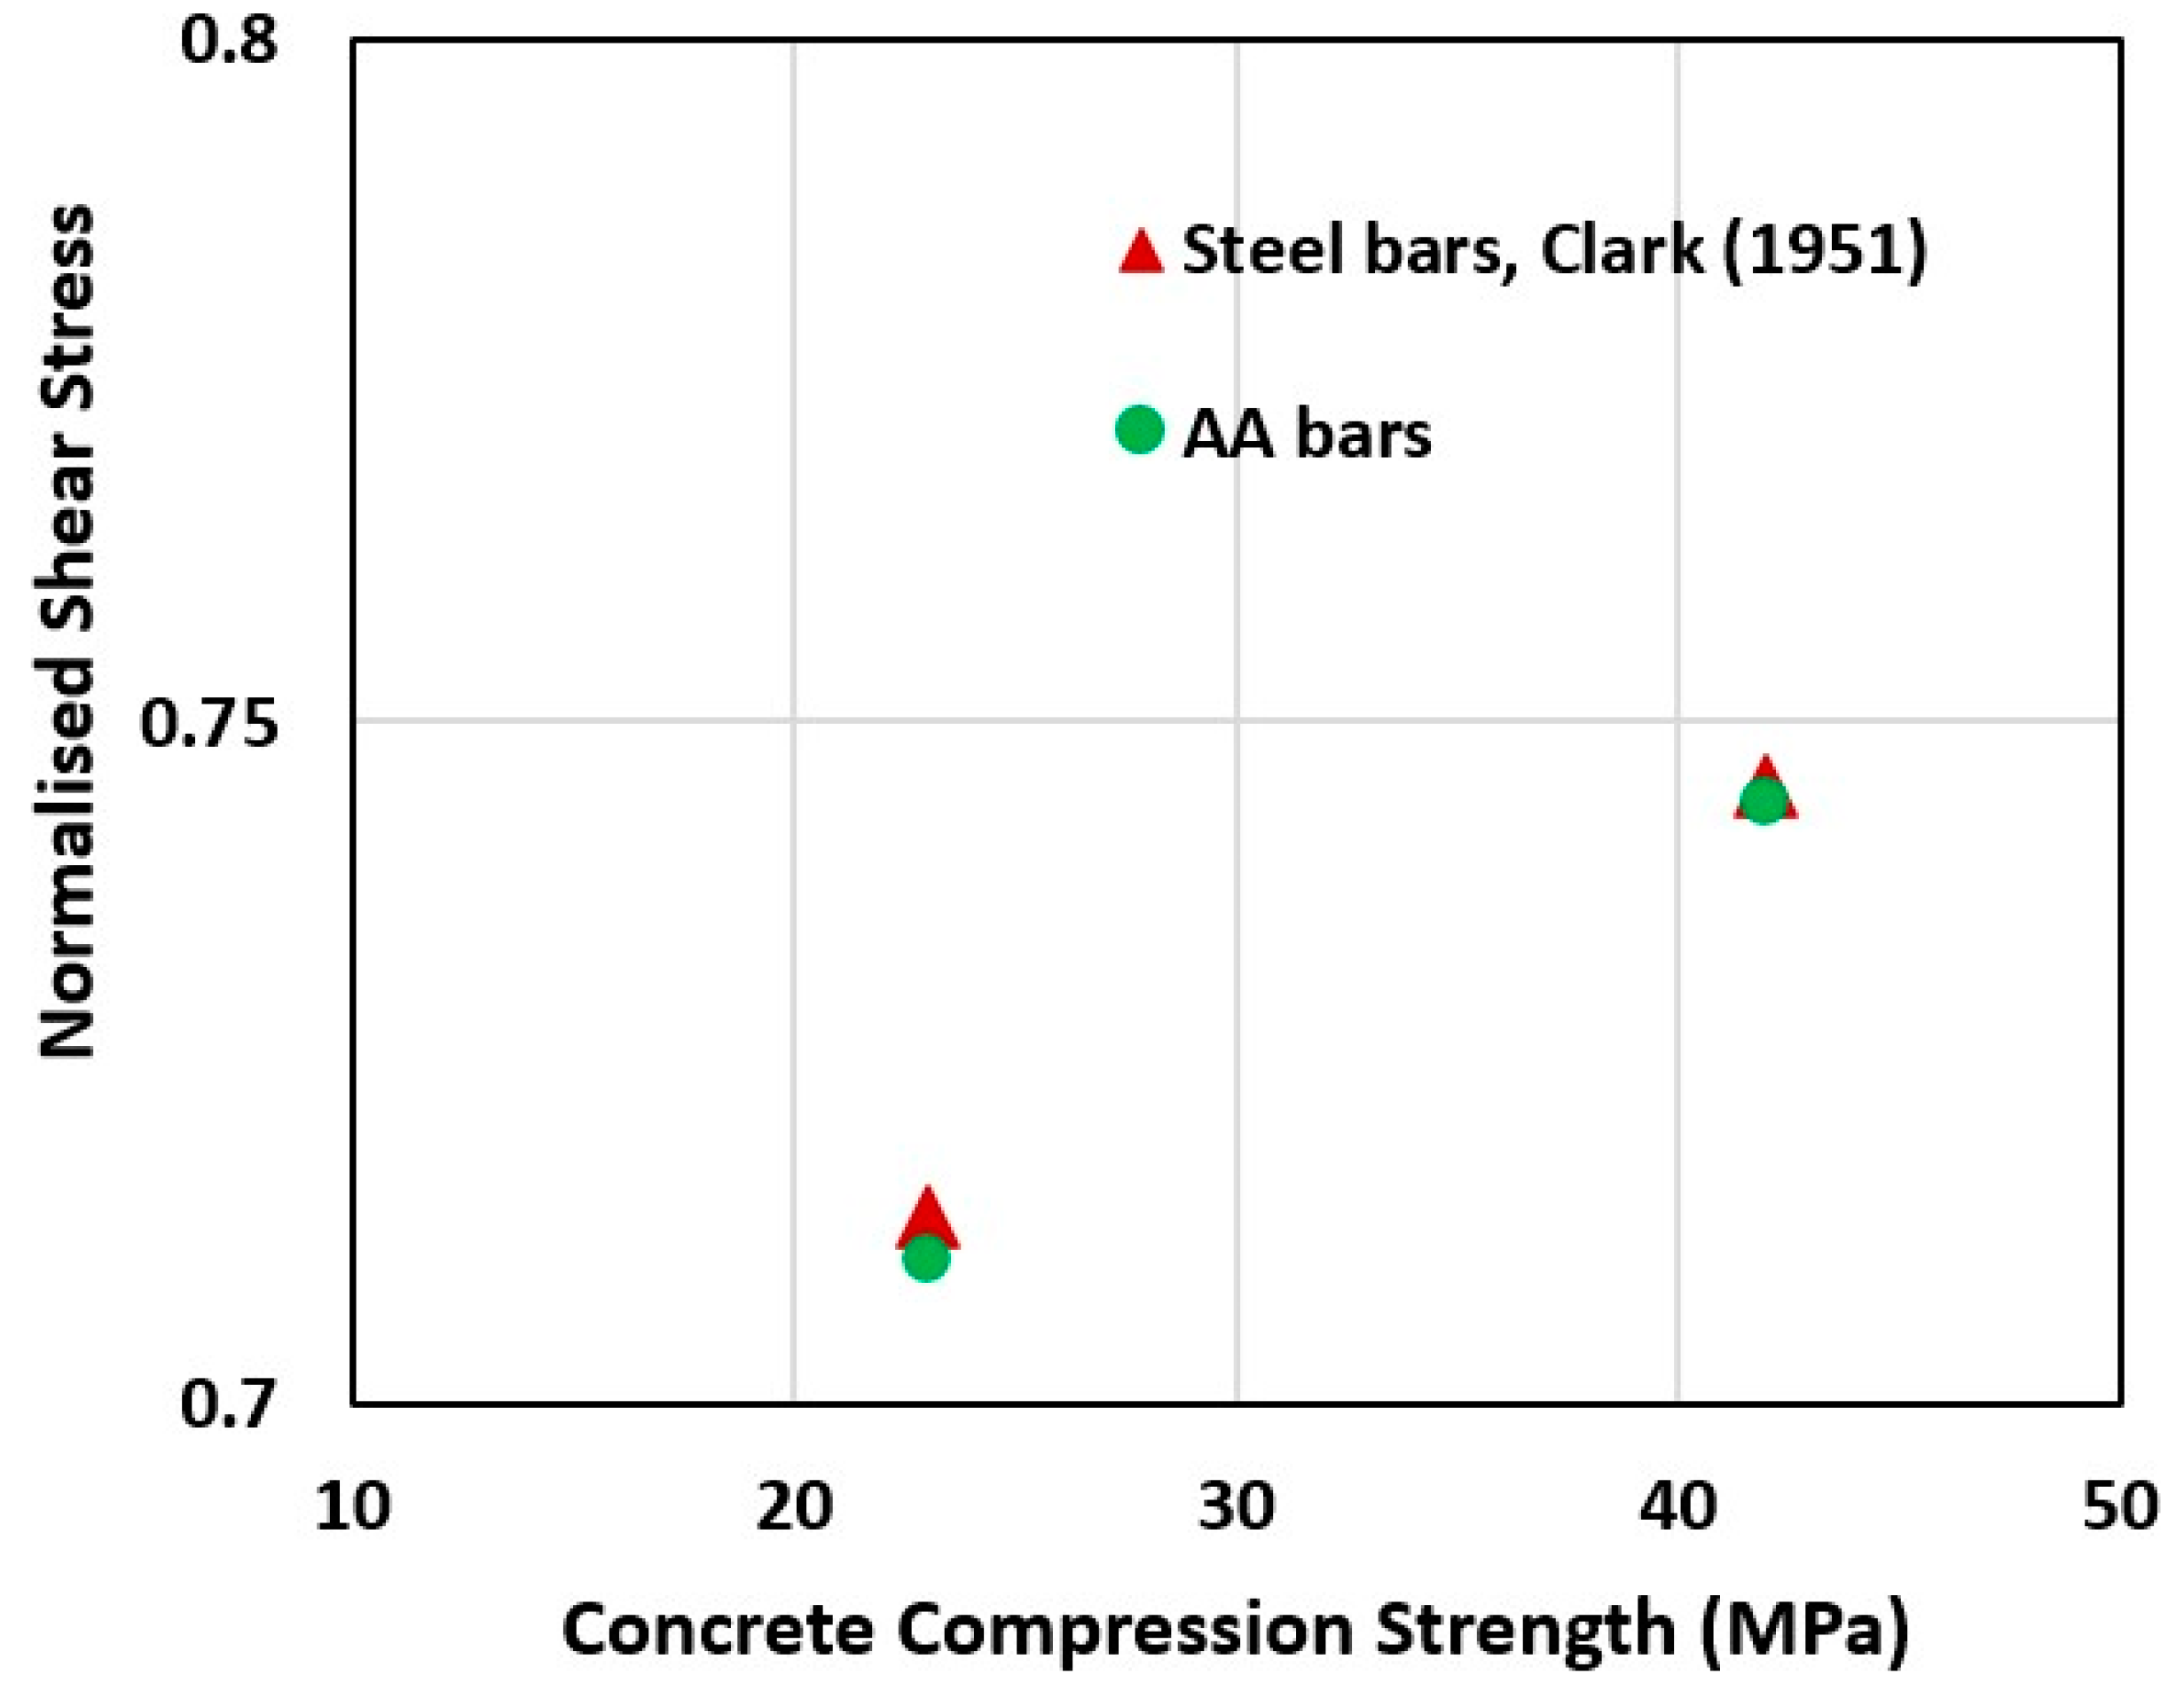
3.2.1. Concrete Strength
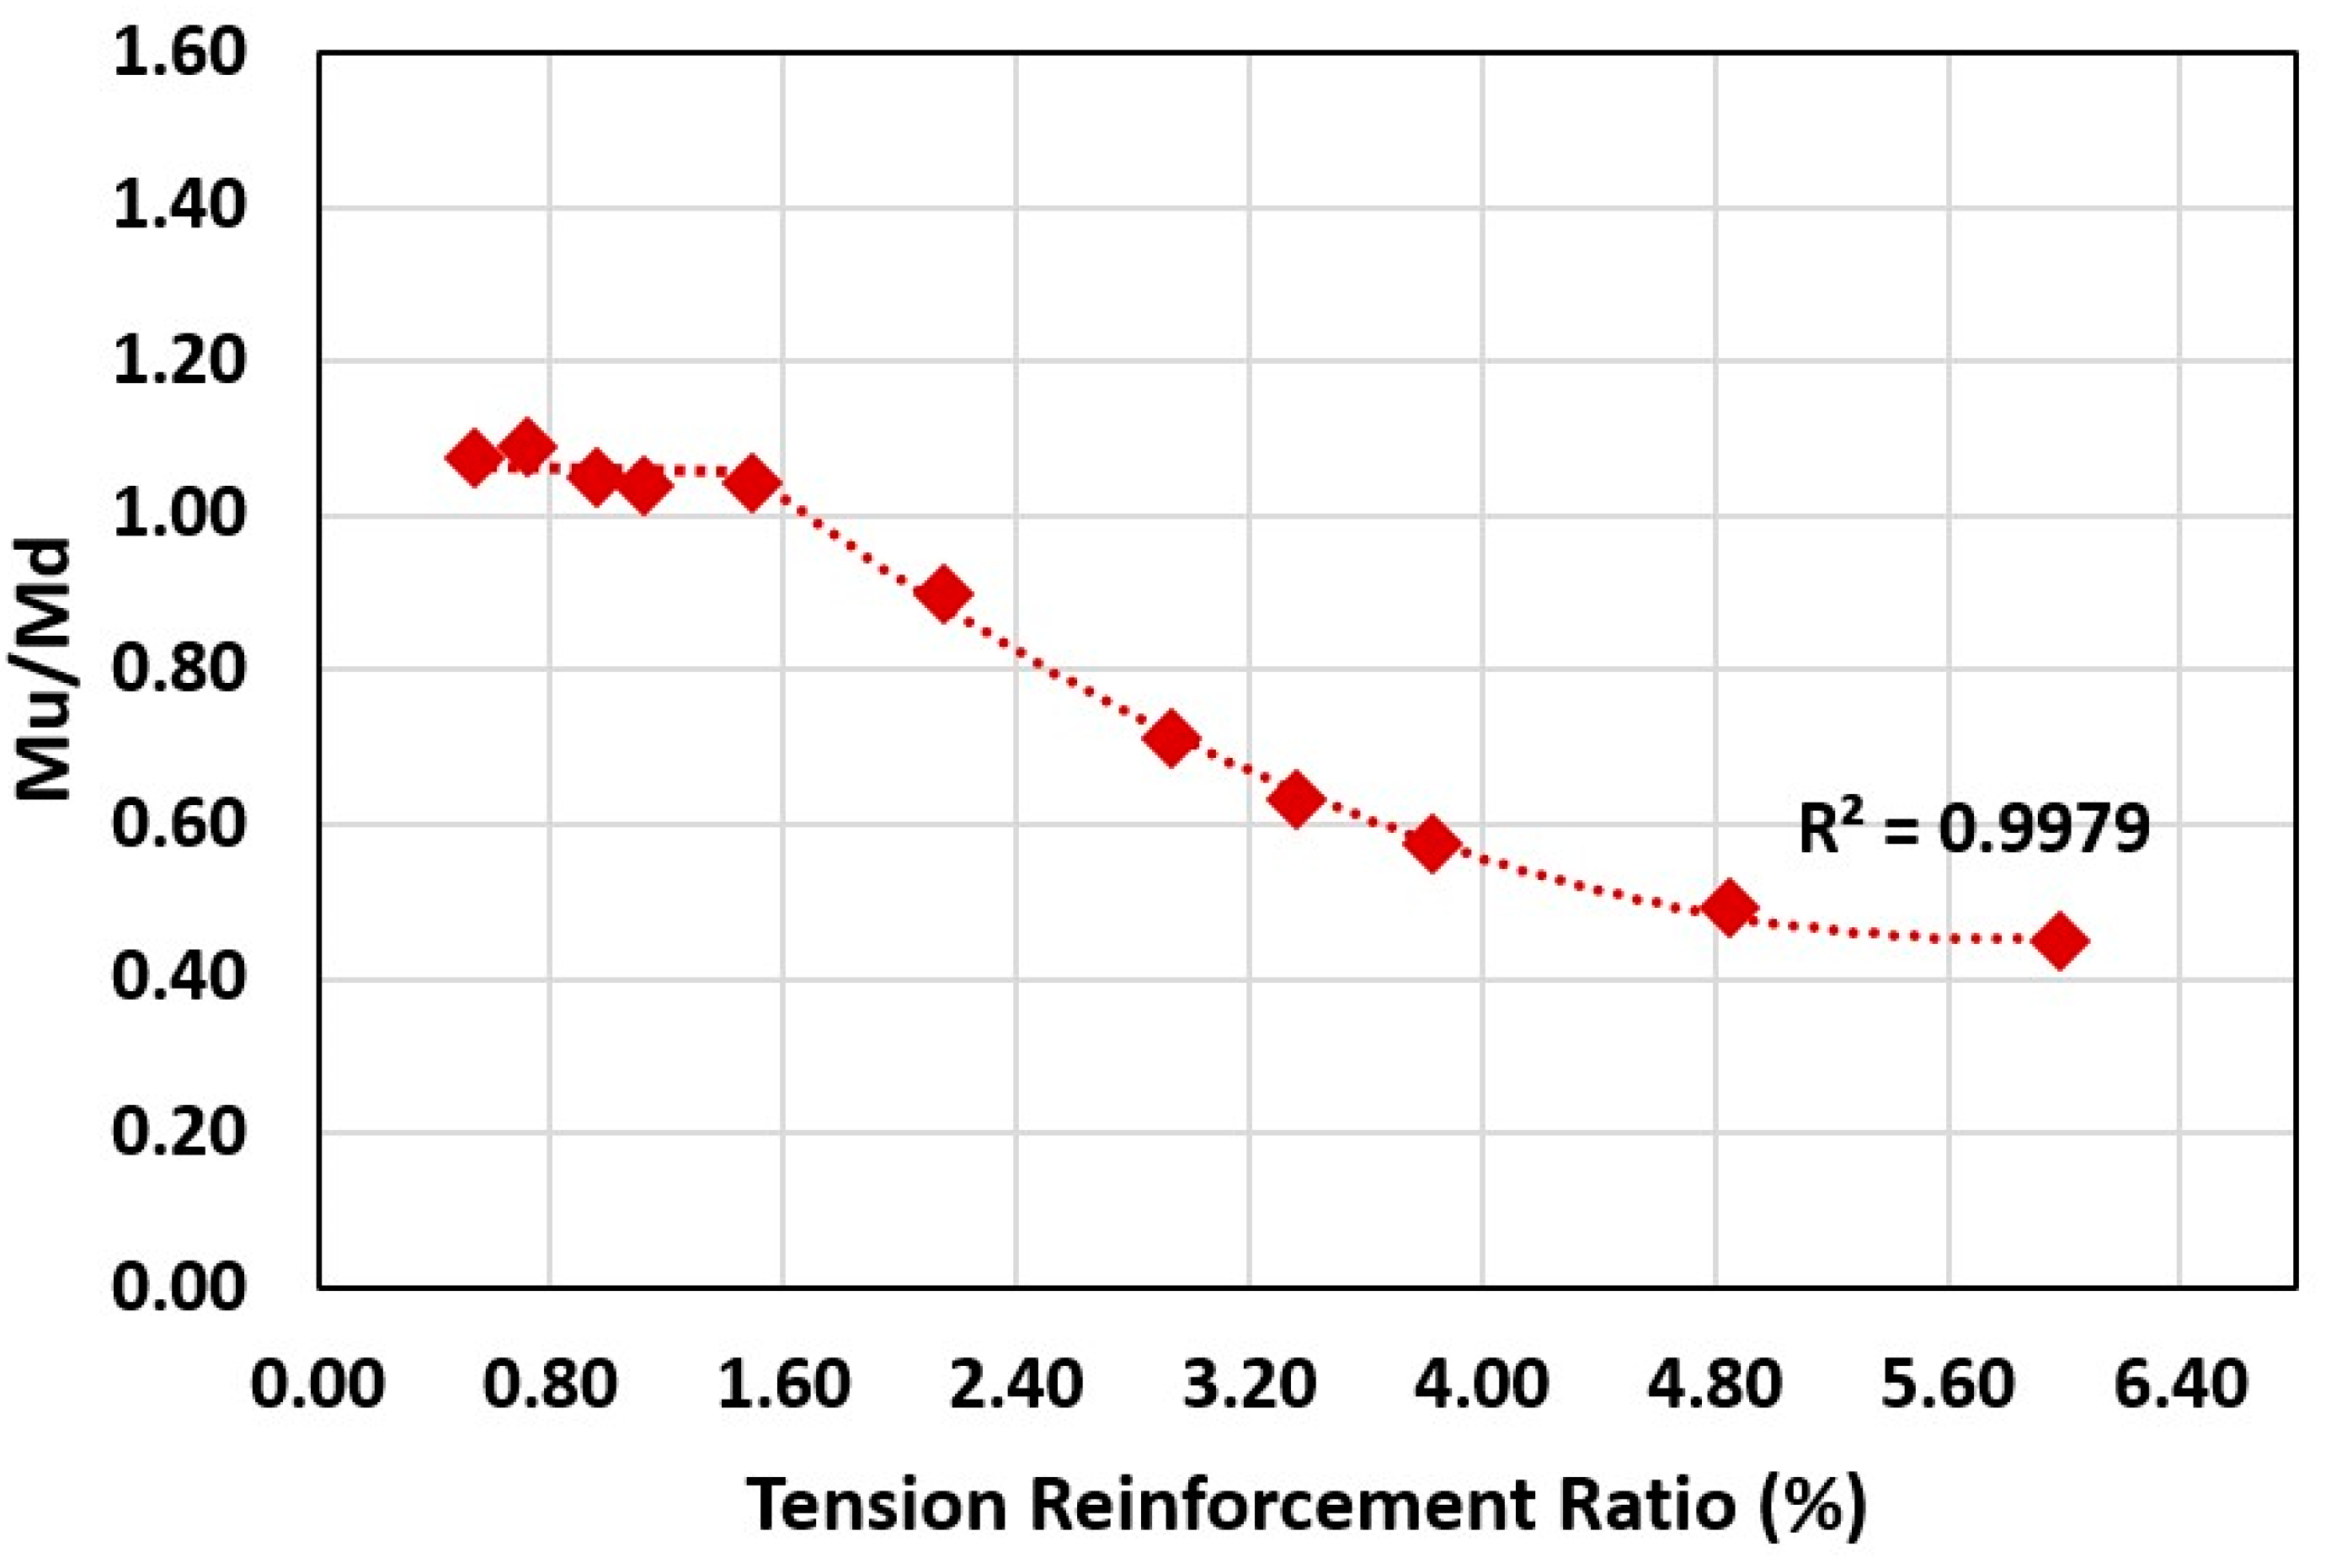
3.2.2. Tension Reinforcement Ratio
3.2.3. Size Effect
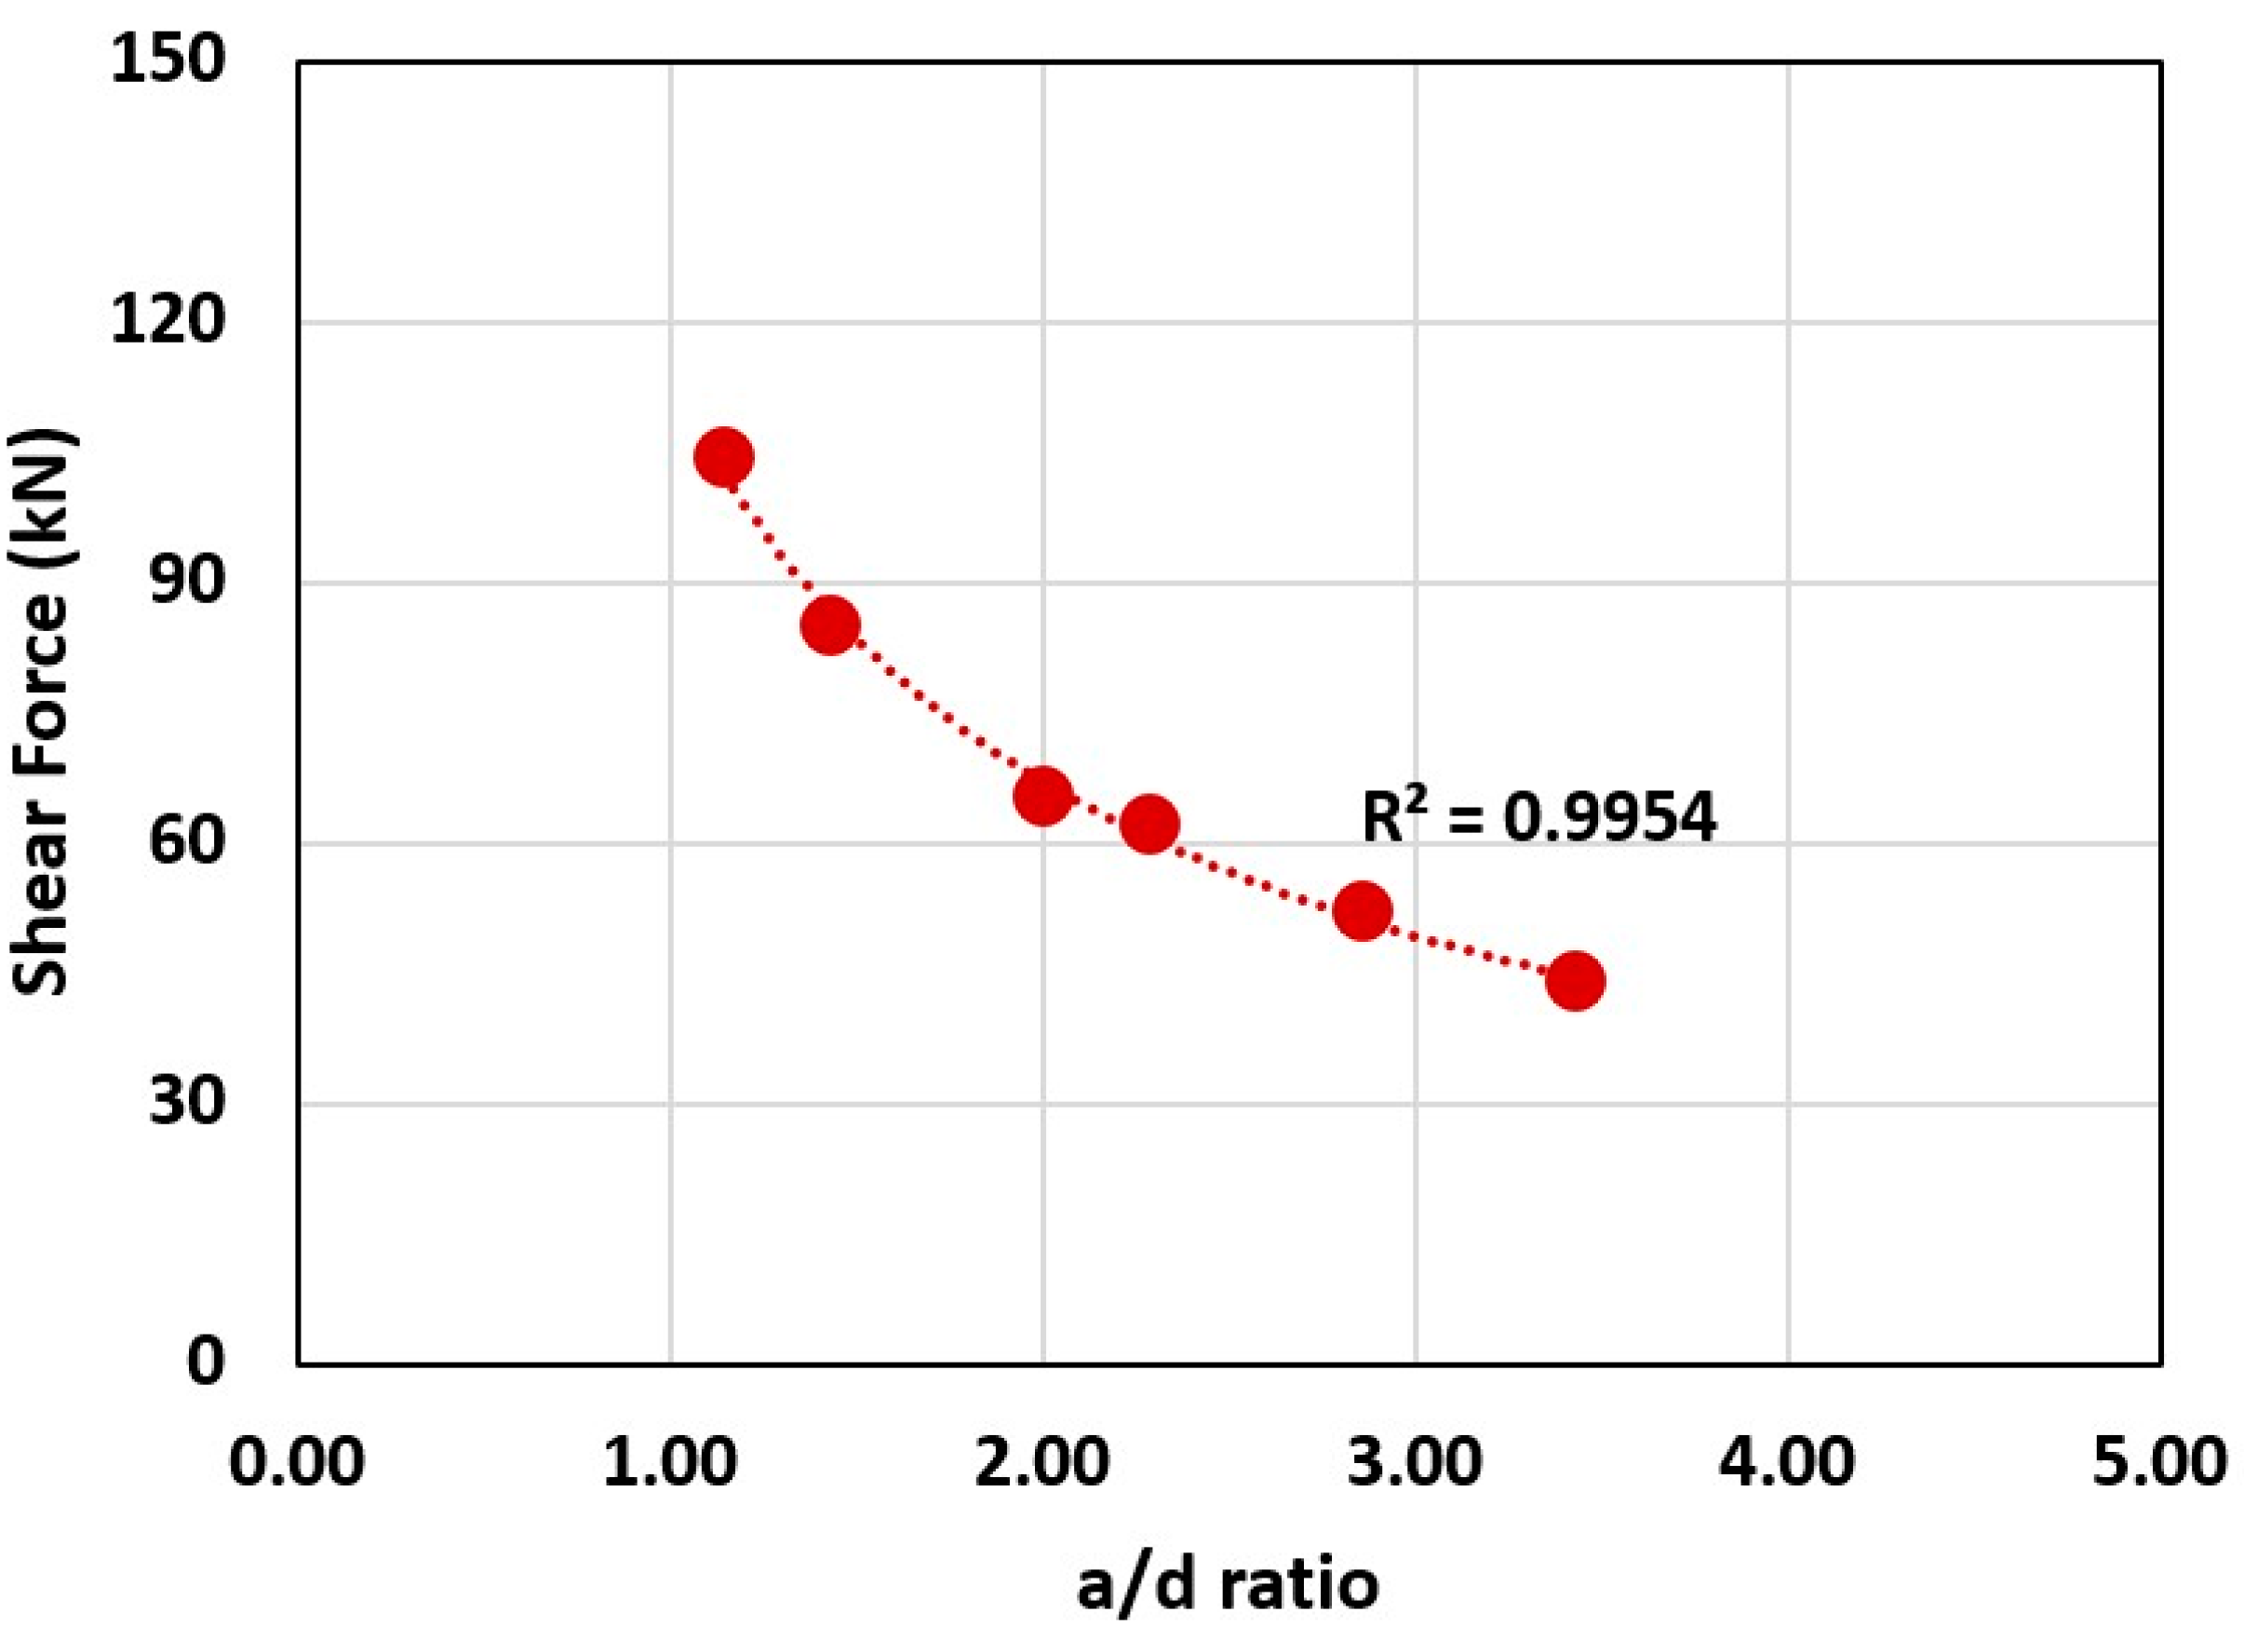
3.2.4. a/d Ratio
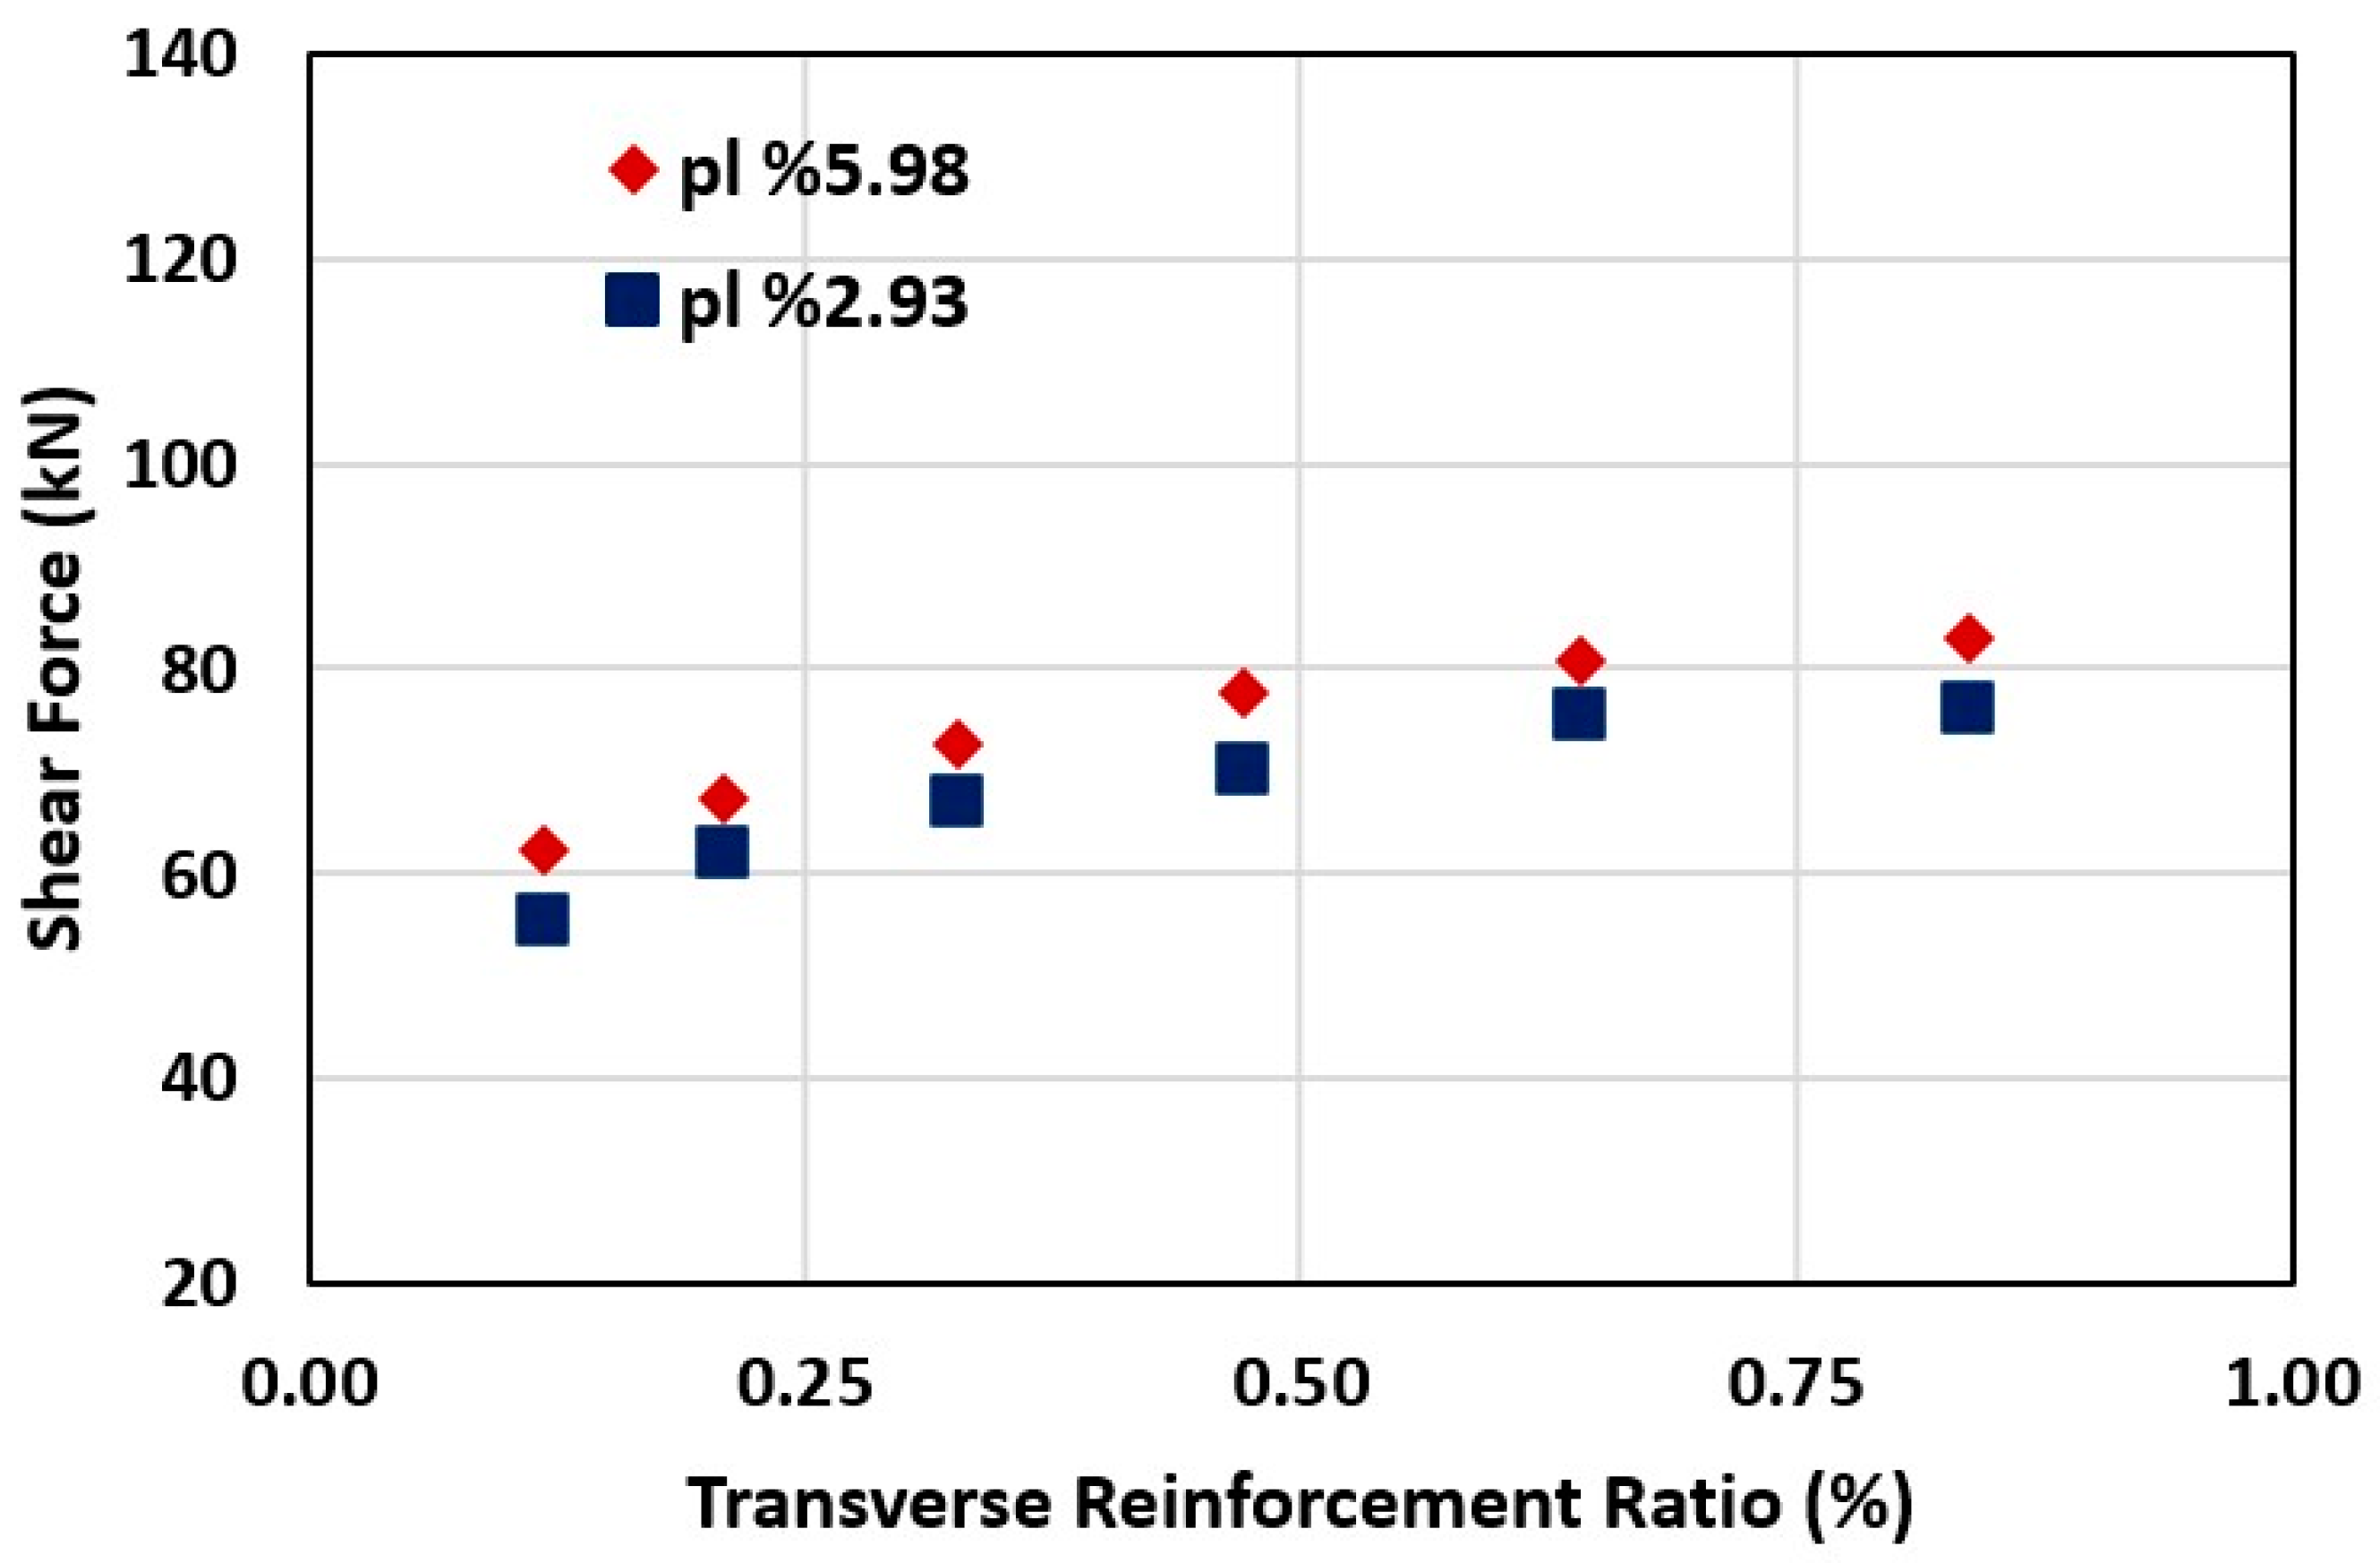
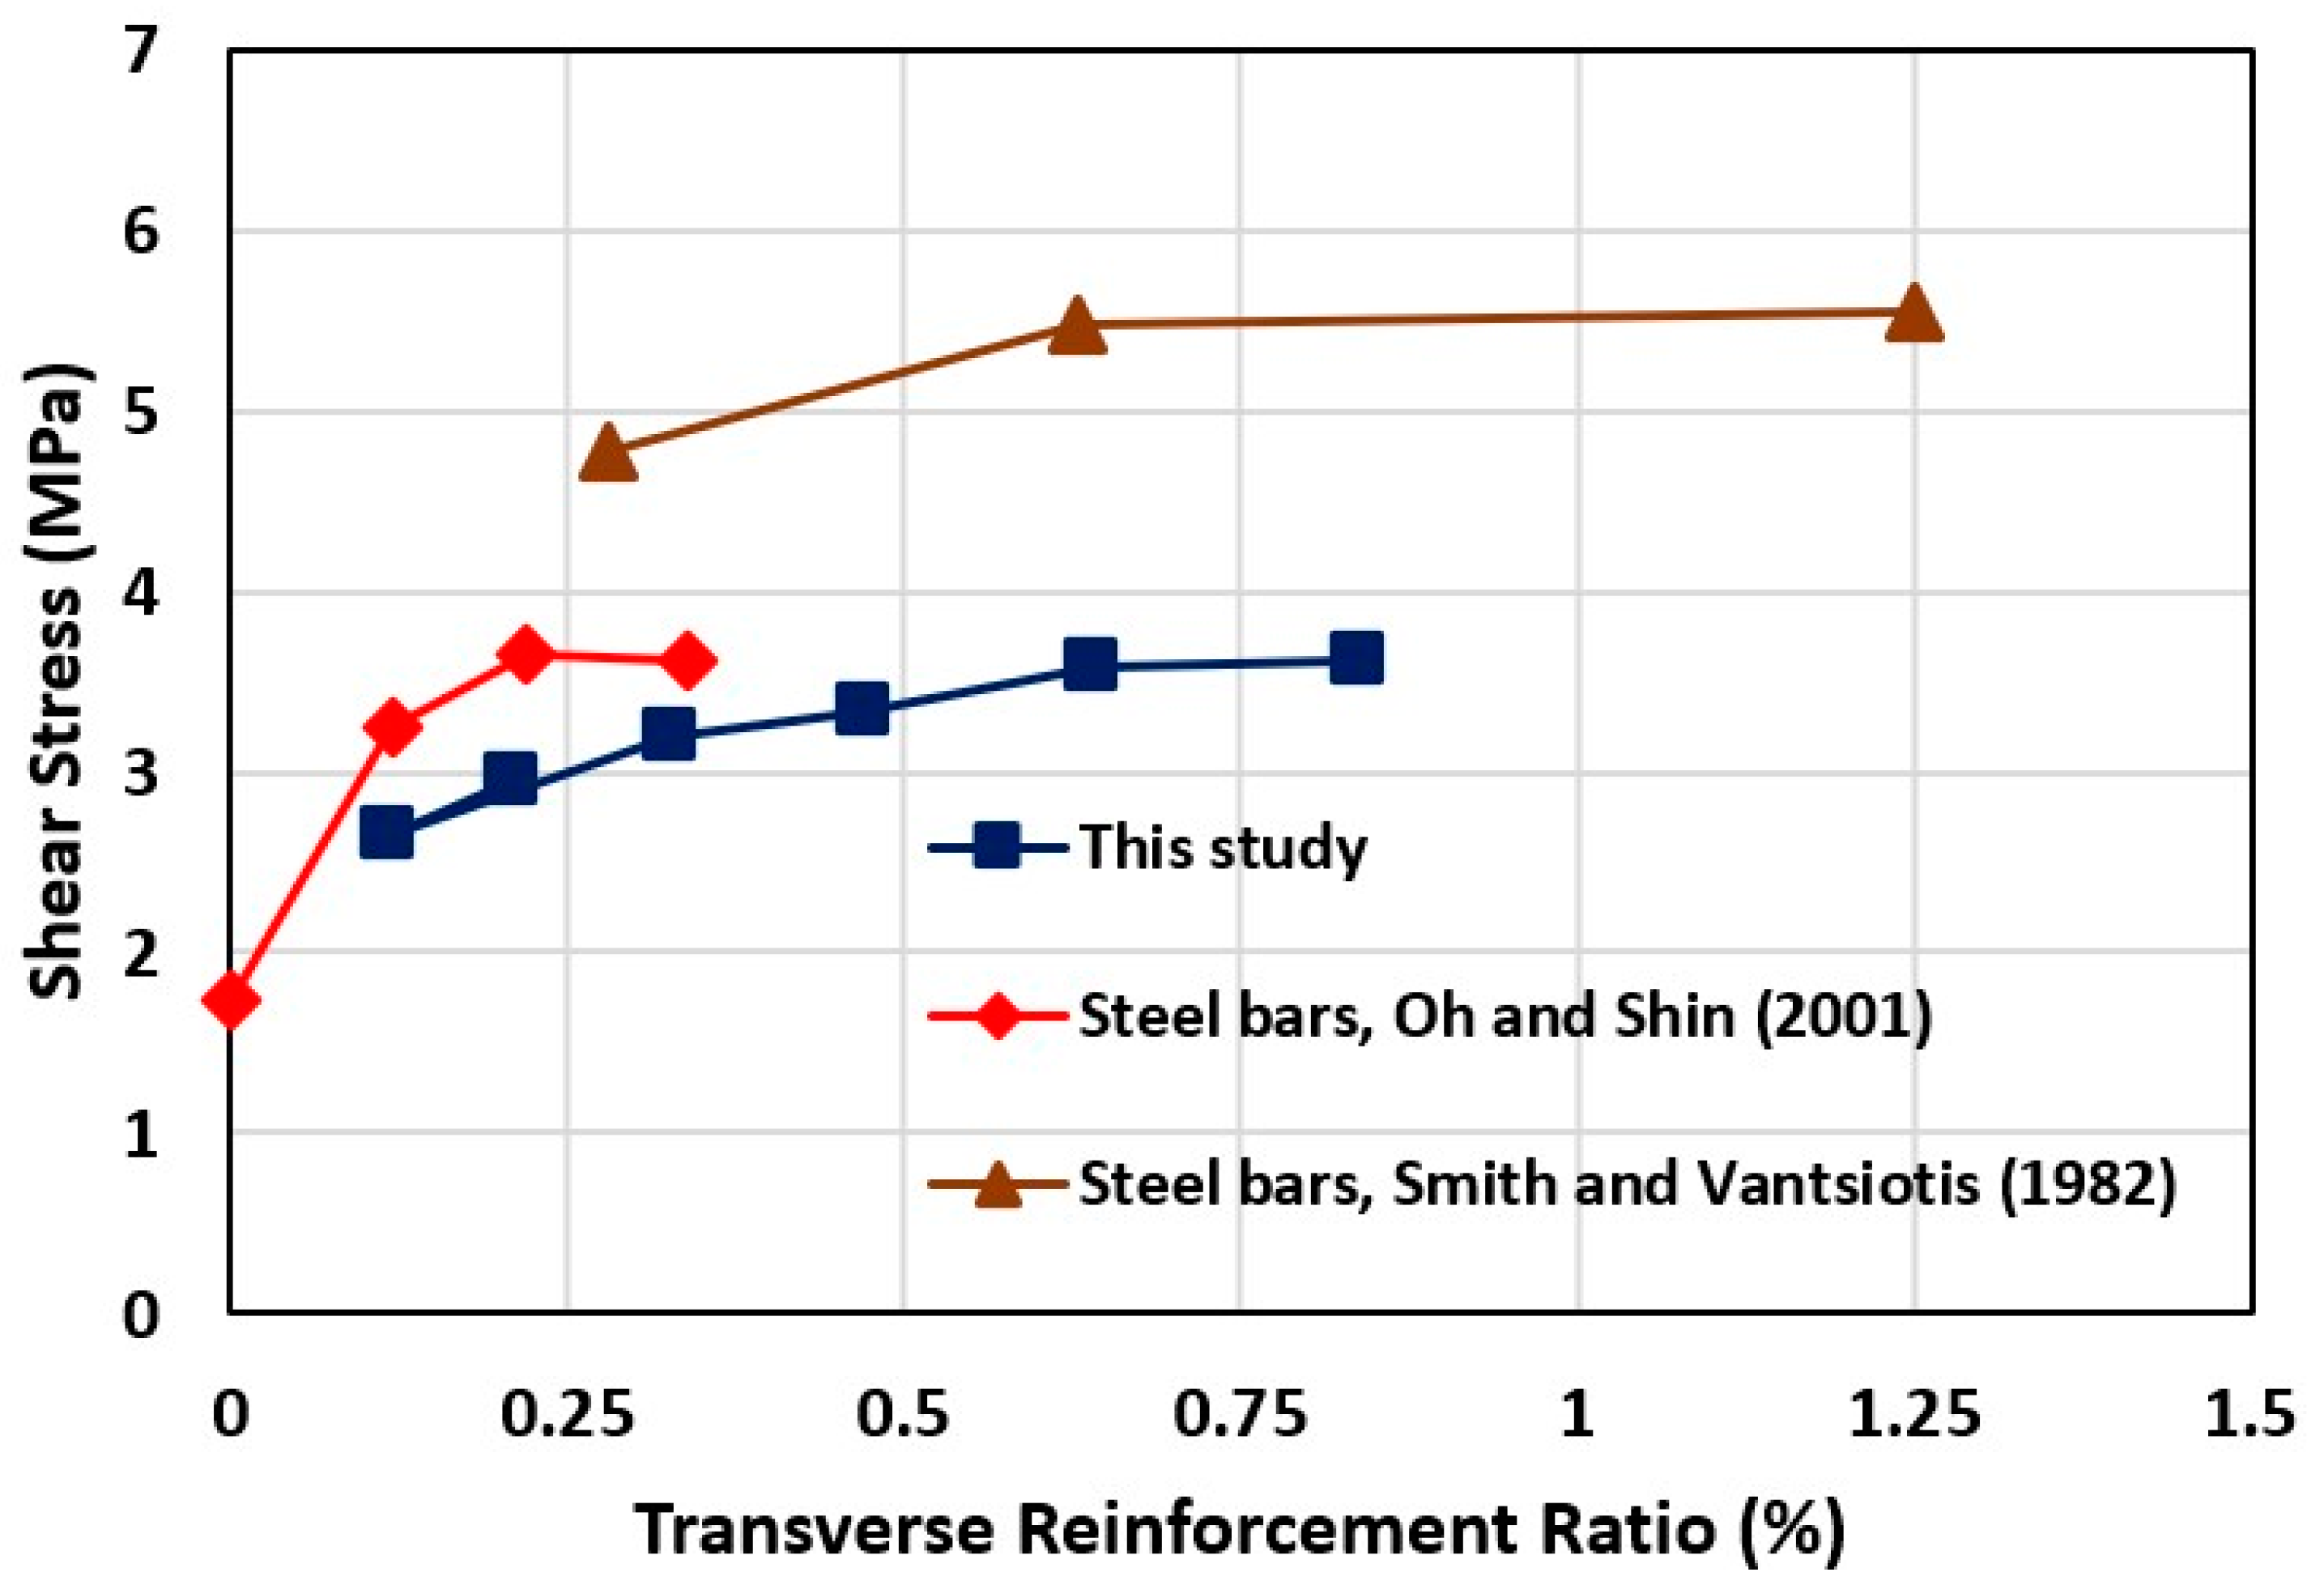
3.2.5. Transverse Reinforcement Ratio
4. Design Models
5. Conclusions
- The FE model based on the theoretical background of DSFM [33], which is a developed form of the MCFT [34], was built for AA RC beams. The FE model accurately reproduces the experimental results reported by Xing and Ozbulut [4] with a mean value of 1.00. The FE model can be utilised for the further design of AA RC deep beams.
- The findings indicated a clear trend in which shear force capacity increased with concrete compressive strength, confirming that higher compressive strength enhanced the resistance of AA RC beams to shear-induced cracking and failure. The shear force capacity increased from 124.1 kN to 181.4 kN, with increasing concrete compression strength from 20 MPa to 40 MPa.
- The failure mode and structural response of AA RC beams were exhibited to be altered by both an increase and a decrease in the tension reinforcement ratio, suggesting a strong relationship between the reinforcement ratio and failure mode.
- The findings on the effect of beam size designated that there was an inverse relationship between shear strength and the effective depth. The shear strength decreased from 2.95 MPa to 2.1 MPa as the effective depth increased from 175 mm to 350 mm.
- The inverse correlation between the shear force and a/d ratio was also obtained. A reduction in the a/d ratio from 3.43 to 1.14 instigated an increase in shear force from 43.9 kN to 104.4 kN. This was also aligned with the fundamental shear mechanism in RC beams [32], where increasing the a/d ratio typically instigated a reduction in shear force capacity because of the transition from a shear to a flexure failure mode.
- An increase in transverse reinforcement ratio from 0.12% to 0.84% instigated an enhancement in shear force capacity from 55.6 kN to 76 kN and from 62.2 kN to 83 kN for the AA RC deep beams with a tension reinforcement ratio of 2.93% and 5.98%, respectively.
- Both the design code of ACI 318 [57] and the design model developed by Mau and Hsu [56] predicted the shear force capacities of AA RC deep beams accurately, with an error of 3%. The standard deviations were 0.19 and 0.12, respectively. The design model developed by Mau and Hsu [56] for beams reinforced with steel bars offers a more balanced approach and can be adapted to AA RC beams. Further validation against experimental data is required to confirm its broader applicability.
- Xing and Ozbulut’s [4] research examining AA RC deep beams was limited. Therefore, this study has provided insight into further investigations on AA RC beams. The main advantage of AA bars is corrosion resistance, and this property can also be improved by considering coating applications. For instance, AA bars offer an alternative to steel bars in situations where RC structures are exposed to a corrosive environment. Moreover, the behaviour of AA RC beams was found to be similar to that of RC beams reinforced with steel bars in the cases where the main parameters affected the structural behaviour, such as concrete strength, size, a/d ratio, and transverse reinforcement ratio. AA bars can also act as an alternative to FRP bars when ductility is needed. Furthermore, the initial cost of FRP bars can be high [4,13,14,15]. It should be noted that further experimental studies are required to understand the full-scale behaviour of AA RC in both deep and slender beams. The bond behaviour can also be improved by coating applications and examined by conducting bond-slip tests.
Funding
Institutional Review Board Statement
Informed Consent Statement
Data Availability Statement
Conflicts of Interest
References
- Dirar, S.; Lees, J.M.; Morley, C.T. Precracked RC T-beams repaired in shear with prestressed CFRP straps. ACI Struct. J. 2013, 110, 855–866. [Google Scholar]
- Issa, M.S.; Metwally, I.M.; Elzeiny, S.M. Influence of fibers on flexural behavior and ductility of concrete beams reinforced with GFRP rebars. Eng. Struct. 2011, 33, 1754–1763. [Google Scholar] [CrossRef]
- Sogut, K.; Dirar, S.; Theofanous, M.; Faramarzi, A.; Nayak, A.N. Effect of transverse and longitudinal reinforcement ratios on the behaviour of RC T-beams shear strengthened with embedded FRP BARS. Compos. Struct. 2021, 262, 113622. [Google Scholar] [CrossRef]
- Xing, G.; Ozbulut, O.E. Flexural performance of concrete beams reinforced with aluminum alloy bars. Eng. Struct. 2016, 126, 53–67. [Google Scholar] [CrossRef]
- Teng, J.G.; Chen, J.F.; Smith, S.T.; Lam, L. Behaviour and strength of FRP strengthened RC structures: A State-of-the-art Review. Proc. Inst. Civ. Eng.—Struct. Build. 2003, 156, 51–62. [Google Scholar] [CrossRef]
- Pešić, N.; Pilakoutas, K. Concrete beams with externally bonded flexural FRP reinforcement: Analytical investigation of debonding Failure. Compos. Part B Eng. 2003, 34, 327–338. [Google Scholar] [CrossRef]
- Wu, H.C.; Eamon, C.D. Strengthening of Concrete Structures Using Fiber Reinforced Polymers (FRP): Design, Construction and Practical Applications; Woodhead Publishing: Sawston, UK, 2017. [Google Scholar]
- Abbood, I.S.; Odaa, S.A.; Hasan, K.F.; Jasim, M.A. Properties evaluation of fiber reinforced polymers and their constituent materials used in structures—A review. Mater. Today Proc. 2021, 43, 1003–1008. [Google Scholar] [CrossRef]
- Triantafillou, T.C. Shear strengthening of reinforced concrete beams using epoxy bonded FRP composites. ACI Struct. J. 1998, 95, 107–115. [Google Scholar]
- Dirar, S.; Caro, M.; Sogut, K.; Quinn, A. Experimental behaviour, FE modelling and design of large-scale reinforced concrete deep beams shear-strengthened with embedded fibre reinforced polymer bars. Structures 2024, 67, 106938. [Google Scholar] [CrossRef]
- Caro, M.; Dirar, S.; Quinn, A.; Yapa, H. Shear strengthening of existing reinforced concrete beams with embedded bars—An overview. Proc. Inst. Civ. Eng.—Struct. Build. 2023, 176, 439–452. [Google Scholar] [CrossRef]
- Dirar, S.; Sogut, K.; Caro, M.; Rahman, R.; Theofanous, M.; Faramarzi, A. Effect of shear span-to-effective depth ratio and FRP material type on the behaviour of RC T-beams strengthened in shear with embedded FRP bars. Eng. Struct. 2025, 332, 120105. [Google Scholar] [CrossRef]
- Renic, T.; Kišicek, T. Ductility of Concrete Beams Reinforced with FRP Rebars. Buildings 2021, 11, 424. [Google Scholar] [CrossRef]
- Ahmed, E.A.; Benmokrane, B.; Sansfaçon, M. Design, construction, and performance of the La Chancelière Parking Garage’s concrete flat slabs reinforced with GFRP bars. J. Compos. Constr. 2017, 21, 05016001. [Google Scholar] [CrossRef]
- Attia, M.M.; Olwan, M.M.; Amoush, E.; Aamer, S.R.R.H.A.; Eita, M.A. Behavior of hybrid natural fiber reinforced polymers bars under uniaxial tensile strength and pull-out loads with UHPC. Case Stud. Constr. Mater. 2024, 21, e03442. [Google Scholar] [CrossRef]
- Castro, H.; Rodríguez, C.; Belzunce, F.J.; Canteli, A.F. Mechanical properties and corrosion behaviour of stainless steel reinforcing bars. J. Mater. Process. Technol. 2003, 143–144, 134–137. [Google Scholar] [CrossRef]
- García-Alonso, M.C.; Escudero, M.L.; Miranda, J.M.; Vega, M.I.; Capilla, F.; Correia, M.J.; Salta, M.; Bennani, A.; González, J.A. Corrosion behaviour of new stainless steels reinforcing bars embedded in concrete. Cem. Concr. Res. 2007, 37, 1463–1471. [Google Scholar] [CrossRef]
- Merisalu, M.; Aarik, L.; Kozlova, J.; Mändar, H.; Tarre, A.; Sammelselg, V. Effective corrosion protection of aluminum alloy AA2024-T3 with novel thin nanostructured oxide coating. Surf. Coat. Technol. 2021, 411, 126993. [Google Scholar] [CrossRef]
- Al-Furjan, M.S.H.; Hajmohammad, M.H.; Shen, X.; Rajak, D.K.; Kolahchi, R. Evaluation of tensile strength and elastic modulus of 7075-T6 aluminum alloy by adding SiC reinforcing particles using vortex casting method. J. Alloys Compd. 2021, 886, 161261. [Google Scholar] [CrossRef]
- Christudasjustus, J.; Larimian, T.; Esquivel, J.; Gupta, S.; Darwish, A.A.; Borkar, T.; Gupta, R.K. Aluminum alloys with high elastic modulus. Mater. Lett. 2022, 320, 132292. [Google Scholar] [CrossRef]
- Kaufman, J.G. Properties of Aluminum Alloys: Fatigue Data and the Effects of Temperature, Product Form, and Processing; ASM International: Materials Park, OH, USA, 2008. [Google Scholar]
- Amirtharaj, J.; Mariappan, M. Exploring the potential uses of aluminium metal matrix composites (AMMCs) as alternatives to steel bar in Reinforced Concrete (RC) structures-A state of art review. J. Build. Eng. 2023, 80, 108085. [Google Scholar] [CrossRef]
- You, X.; Xing, Z.; Jiang, S.; Zhu, Y.; Lin, Y.; Qiu, H.; Nie, R.; Yang, J.; Hui, D.; Chen, W.; et al. A review of research on aluminum alloy materials in structural engineering. Dev. Built Environ. 2024, 17, 100319. [Google Scholar] [CrossRef]
- Chen, Z.; Xu, W.; Zhou, J. Mechanical performance of marine concrete filled CFRP-aluminum alloy tube columns under axial compression: Experiment and finite element analysis. Eng. Struct. 2022, 272, 114993. [Google Scholar] [CrossRef]
- Montuori, R.; Nastri, E.; Piluso, V.; Pisapia, A. Ultimate behaviour of aluminium alloy I-beams: New experimental tests and European codification. Thin-Walled Struct. 2023, 191, 111038. [Google Scholar] [CrossRef]
- Wen, Q.; Ren, Z. Structural analysis of a large aluminum alloy truss double-arch bridge. Structures 2021, 29, 924–936. [Google Scholar] [CrossRef]
- Xing, G.; Chang, Z.; Ozbulut, O.E. Behavior and failure modes of reinforced concrete beams strengthened with NSM GFRP or aluminum alloy bars. Struct. Concr. 2018, 19, 1023–1035. [Google Scholar] [CrossRef]
- Xing, G.; Chang, Z.; Ozbulut, O.E. Feasibility of using aluminum alloy bars as near-surface mounted reinforcement for flexural strengthening of reinforced concrete beams. Struct. Concr. 2020, 21, 1557–1576. [Google Scholar] [CrossRef]
- Xing, G.; Al-Dhabyani, M.A.; Al-Shakhada, N.A.; Li, X. Experimental and numerical investigations on the behavior and failure mechanism of RC beams strengthened with near-surface mounted high-strength aluminum alloy bars. J. Struct. Eng. 2021, 147, 04021208. [Google Scholar] [CrossRef]
- Xing, G.H.; Chen, X.; Huang, J.; Zhang, Y.; Ozbulut, O.E.; Chang, Z.-Q. Reinforced concrete beams strengthened in flexure with near-surface mounted 7075 aluminum alloy bars. J. Struct. Eng. 2022, 148, 04021242. [Google Scholar] [CrossRef]
- Wang, H.; Xing, G.; Zhao, J.; Wen, F. Seismic behavior of RC columns strengthened with near-surface-mounted aluminum alloy bars and CFRP wraps. Eng. Struct. 2022, 268, 114742. [Google Scholar] [CrossRef]
- Kani, G.N.J. The riddle of shear failure and its solution. ACI J. Proc. 1964, 61, 441–468. [Google Scholar]
- Vecchio, F.J. Disturbed stress field model for reinforced concrete: Formulation. ASCE J. Struct. Eng. 2000, 126, 1070–1077. [Google Scholar] [CrossRef]
- Vecchio, F.J.; Collins, M.P. The modified compression field theory for reinforced concrete elements subjected to shear. ACI Struct. J. 1986, 83, 219–231. [Google Scholar]
- Wong, P.S.; Vecchio, F.J.; Trommels, H. VecTor2 & FormWorks User’s Manual, 2nd ed.; University of Toronto: Toronto, ON, Canada, 2013. [Google Scholar]
- Hognestad, E.; Hanson, N.W.; McHenry, D. Concrete stress distribution in ultimate stress design. ACI J. 1955, 27, 455–479. [Google Scholar]
- Scott, B.D.; Park, R.; Priestley, M.J.N. Stress-strain behavior of concrete confined by overlapping hoops at low and high strain rates. ACI J. 1982, 79, 13–27. [Google Scholar]
- Vecchio, F.J.; Collins, M.P. Compression response of cracked reinforced concrete. ASCE J. Struct. Eng. 1993, 119, 3590–3610. [Google Scholar] [CrossRef]
- CEB-FIP. CEB-FIP Model Code 1990; Thomas Telford Services Ltd.: London, UK, 1993. [Google Scholar]
- Qapo, M.; Dirar, S.; Jemaa, Y. Finite element parametric study of reinforced concrete beams shear-strengthened with embedded FRP bars. Compos. Struct. 2016, 149, 93–105. [Google Scholar] [CrossRef]
- Godat, A.; Chaallal, O.; Neale, K.W. Nonlinear finite element models for the embedded through-section FRP shear-strengthening method. Comput. Struct. 2013, 119, 12–22. [Google Scholar] [CrossRef]
- Ibrahim, N.; Elkholy, S.; Godat, A.; El-Kholy, A. Implementation of modified compression field theory to simulate the behavior of fiber-reinforced polymer shear-strengthened reinforced concrete beams under monotonic loading. Buildings 2023, 13, 898. [Google Scholar] [CrossRef]
- Palermo, D.; Vecchio, F.J. Simulation of cyclically loaded concrete structures based on the finite-element method. J. Struct. Eng. 2007, 133, 728–738. [Google Scholar] [CrossRef]
- Bažant, Z.P.; Oh, B.H. Crack band theory for fracture of concrete. Matériaux Constr. 1983, 16, 155–177. [Google Scholar] [CrossRef]
- Clark, A.P. Diagonal tension in reinforced concrete beams. ACI J. 1951, 48, 145–156. [Google Scholar]
- Kani, G.N.J. How Safe are our large reinforced concrete beams? ACI J. Proc. 1967, 64, 128–141. [Google Scholar]
- Bažant, Z.P.; Kim, J.K. Size effect in shear failure of longitudinally reinforced beams. ACI J. Proc. 1984, 81, 456–468. [Google Scholar]
- Bažant, Z.P. Fracturing truss model: Size effect in shear failure of reinforced concrete. J. Eng. Mech. 1997, 123, 1276–1288. [Google Scholar] [CrossRef]
- Zhang, N.; Tan, K.H. Size effect in RC deep beams: Experimental investigation and STM verification. Eng. Struct. 2007, 29, 3241–3254. [Google Scholar] [CrossRef]
- Sogut, K.; Dirar, S.; Theofanous, M.; Faramarzi, A. Size Effect in Shear-Deficient Reinforced Concrete T-beams Strengthened with Embedded FRP Bars. In Proceedings of the 14th International Symposium on Fiber-Reinforced Polymer Reinforcement for Concrete Structures, (FRPRCS-14), Belfast, UK, 4–7 June 2019. [Google Scholar]
- Sogut, K. FRP Shear Strengthening of Concrete Beams. Ph.D. Thesis, University of Birmingham, Birmingham, UK, 2022. [Google Scholar]
- Tetta, Z.C.; Koutas, L.N.; Bournas, D.A. Shear strengthening of concrete members with TRM jackets: Effect of shear span-to-depth ratio, material and amount of external reinforcement. Compos. Part B Eng. 2018, 137, 184–201. [Google Scholar] [CrossRef]
- Oh, J.K.; Shin, S.W. Shear strength of reinforced high-strength concrete deep beams. ACI Struct. J. 2001, 98, 164–173. [Google Scholar]
- Smith, K.; Vantsiotis, A. Shear strength of deep beams. ACI J. Proc. 1982, 79, 201–213. [Google Scholar]
- Ismail, K.S. Shear Behaviour of Reinforced Concrete Deep Beams. Ph.D. Thesis, University of Sheffield, Sheffield, UK, 2016. [Google Scholar]
- Mau, S.T.; Hsu, T.T.C. Formula for the shear strength of deep beams. ACI Struct. J. 1989, 86, 516–523. [Google Scholar]
- ACI Committee 318. Building Code Requirements for Structural Concrete (ACI 318-19) and Commentary; American Concrete Institute: Farmington Hills, MI, USA, 2019. [Google Scholar]


| Specimen [4] | Concrete Strength (MPa) | 6 mm AA bar | 8 mm AA bar | |
|---|---|---|---|---|
| AIL-1 | 22.6 | Yield strength (MPa) | 314.2 | 362.1 |
| AIL-2 | 24.3 | Tensile strength (MPa) | 344.1 | 378.9 |
| AIL-3 | 24.3 | Elastic modulus (MPa) | 67,700 | 68,300 |
| AIH-1 | 24.3 | Strain corresponding | 0.46 | 0.53 |
| AIH-2 | 22.6 | to yield strength (%) | ||
| AIH-3 | 22.6 | Strain corresponding | 2.05 | 2.84 |
| AIIM-1 | 48.5 | to tensile strength (%) | ||
| AIIM-2 | 40.8 | |||
| AIIL | 40.8 |
| Specimen | PExp. (kN) | δExp. (mm) | PFE (kN) | δFE (mm) | PFE/PExp |
|---|---|---|---|---|---|
| AIL-1 | 46.3 | ≥15 | 47.6 | ≥15 | 1.03 |
| AIL-3 | 50 | ≥18 | 47.7 | ≥18 | 0.95 |
| AIH-1 | 88 | ≥30 | 81.7 | 9.2 | 0.93 |
| AIH-3 | 86 | 12.6 | 80.4 | 10.4 | 0.93 |
| AIIM-1 | 65.2 | ≥20 | 68.4 | ≥20 | 1.05 |
| AIIM-2 | 63.9 | ≥20 | 66.3 | ≥20 | 1.04 |
| AIIL | 50.4 | ≥15 | 52.7 | ≥15 | 1.05 |
| Mean | 1.00 | ||||
| Standard Deviation | 0.05 |
| Specimen | bw (mm) | d (mm) | h (mm) | fc (MPa) | As (mm2) | Aw (mm2) | s (mm) | d′ (mm) | dv (mm) | a (mm) | a/d | ph | pv | fyh (MPa) | fyv (MPa) |
|---|---|---|---|---|---|---|---|---|---|---|---|---|---|---|---|
| ID-1 | 120 | 175 | 200 | 20 | 616 | 25 | 100 | 25 | 150 | 400 | 2.29 | 2.93 | 0.21 | 362.1 | 314.2 |
| ID-2 | 120 | 175 | 200 | 30 | 616 | 25 | 100 | 25 | 150 | 400 | 2.29 | 2.93 | 0.21 | 362.1 | 314.2 |
| ID-3 | 120 | 175 | 200 | 40 | 616 | 25 | 100 | 25 | 150 | 400 | 2.29 | 2.93 | 0.21 | 362.1 | 314.2 |
| ID-4 | 120 | 175 | 200 | 20 | 707 | 25 | 100 | 25 | 150 | 400 | 2.29 | 3.37 | 0.21 | 362.1 | 314.2 |
| ID-5 | 120 | 175 | 200 | 20 | 804 | 25 | 100 | 25 | 150 | 400 | 2.29 | 3.83 | 0.21 | 362.1 | 314.2 |
| ID-6 | 120 | 175 | 200 | 20 | 1018 | 25 | 100 | 25 | 150 | 400 | 2.29 | 4.85 | 0.21 | 362.1 | 314.2 |
| ID-7 | 120 | 175 | 200 | 20 | 1257 | 25 | 100 | 25 | 150 | 400 | 2.29 | 5.98 | 0.21 | 362.1 | 314.2 |
| ID-8 | 120 | 175 | 200 | 20 | 452 | 25 | 100 | 25 | 150 | 400 | 2.29 | 2.15 | 0.21 | 362.1 | 314.2 |
| ID-9 | 172 | 250 | 286 | 20 | 1256 | 57 | 143 | 36 | 214 | 572 | 2.29 | 2.92 | 0.23 | 362.1 | 314.2 |
| ID-10 | 240 | 350 | 400 | 20 | 2463 | 101 | 200 | 50 | 300 | 800 | 2.29 | 2.93 | 0.21 | 362.1 | 314.2 |
| ID-11 | 120 | 175 | 200 | 20 | 616 | 25 | 100 | 25 | 150 | 200 | 1.14 | 2.93 | 0.21 | 362.1 | 314.2 |
| ID-12 | 120 | 175 | 200 | 20 | 616 | 25 | 100 | 25 | 150 | 250 | 1.43 | 2.93 | 0.21 | 362.1 | 314.2 |
| ID-13 | 120 | 175 | 200 | 20 | 616 | 25 | 100 | 25 | 150 | 350 | 2.00 | 2.93 | 0.21 | 362.1 | 314.2 |
| ID-14 | 120 | 175 | 200 | 20 | 616 | 14 | 100 | 25 | 150 | 400 | 2.29 | 2.93 | 0.12 | 362.1 | 314.2 |
| ID-15 | 120 | 175 | 200 | 20 | 616 | 39 | 100 | 25 | 150 | 400 | 2.29 | 2.93 | 0.33 | 362.1 | 314.2 |
| ID-16 | 120 | 175 | 200 | 20 | 616 | 57 | 100 | 25 | 150 | 400 | 2.29 | 2.93 | 0.47 | 362.1 | 314.2 |
| ID-17 | 120 | 175 | 200 | 20 | 616 | 77 | 100 | 25 | 150 | 400 | 2.29 | 2.93 | 0.64 | 362.1 | 314.2 |
| ID-18 | 120 | 175 | 200 | 20 | 616 | 101 | 100 | 25 | 150 | 400 | 2.29 | 2.93 | 0.84 | 362.1 | 314.2 |
| ID-19 | 120 | 175 | 200 | 20 | 1257 | 25 | 100 | 25 | 150 | 400 | 2.29 | 5.99 | 0.21 | 362.1 | 314.2 |
| ID-20 | 120 | 175 | 200 | 20 | 1257 | 14 | 100 | 25 | 150 | 400 | 2.29 | 5.99 | 0.12 | 362.1 | 314.2 |
| ID-21 | 120 | 175 | 200 | 20 | 1257 | 39 | 100 | 25 | 150 | 400 | 2.29 | 5.99 | 0.33 | 362.1 | 314.2 |
| ID-22 | 120 | 175 | 200 | 20 | 1257 | 57 | 100 | 25 | 150 | 400 | 2.29 | 5.99 | 0.47 | 362.1 | 314.2 |
| ID-23 | 120 | 175 | 200 | 20 | 1257 | 77 | 100 | 25 | 150 | 400 | 2.29 | 5.99 | 0.64 | 362.1 | 314.2 |
| ID-24 | 120 | 175 | 200 | 20 | 1257 | 101 | 100 | 25 | 150 | 400 | 2.29 | 5.99 | 0.84 | 362.1 | 314.2 |
| Specimen | V, FE (kN) | V, ACI318 (kN) | V, Mau and Hsu (kN) | V, ACI318/V, FE | V, Mau and Hsu/V, FE |
|---|---|---|---|---|---|
| ID-1 | 62.0 | 62.3 | 56.6 | 1.00 | 0.91 |
| ID-2 | 78.4 | 93.4 | 77.2 | 1.19 | 0.98 |
| ID-3 | 90.7 | 124.6 | 97.4 | 1.37 | 1.07 |
| ID-4 | 63.0 | 62.5 | 56.6 | 0.99 | 0.90 |
| ID-5 | 63.9 | 62.6 | 56.6 | 0.98 | 0.89 |
| ID-6 | 66.3 | 62.9 | 56.6 | 0.95 | 0.85 |
| ID-7 | 67.5 | 63.2 | 56.6 | 0.94 | 0.84 |
| ID-8 | 58.4 | 62.0 | 56.6 | 1.06 | 0.97 |
| ID-9 | 106.2 | 132.7 | 119.1 | 1.25 | 1.12 |
| ID-10 | 176.7 | 249.2 | 226.9 | 1.41 | 1.28 |
| ID-11 | 104.4 | 66.0 | 94.8 | 0.63 | 0.91 |
| ID-12 | 85.0 | 65.2 | 77.8 | 0.77 | 0.92 |
| ID-13 | 65.4 | 63.2 | 61.2 | 0.97 | 0.93 |
| ID-14 | 55.6 | 62.3 | 49.8 | 1.12 | 0.90 |
| ID-15 | 67.0 | 62.3 | 64.5 | 0.93 | 0.96 |
| ID-16 | 70.2 | 62.3 | 73.0 | 0.89 | 1.04 |
| ID-17 | 75.3 | 62.3 | 81.8 | 0.83 | 1.09 |
| ID-18 | 76.0 | 62.3 | 90.9 | 0.82 | 1.20 |
| ID-19 | 67.5 | 63.2 | 56.7 | 0.94 | 0.84 |
| ID-20 | 62.2 | 63.2 | 49.8 | 1.02 | 0.80 |
| ID-21 | 72.5 | 63.2 | 64.5 | 0.87 | 0.89 |
| ID-22 | 77.6 | 63.2 | 73.0 | 0.81 | 0.94 |
| ID-23 | 80.9 | 63.2 | 81.8 | 0.78 | 1.01 |
| ID-24 | 83.0 | 63.2 | 90.9 | 0.76 | 1.10 |
| Mean = | 0.97 | 0.97 | |||
| Standard Dev. = | 0.19 | 0.12 |
Disclaimer/Publisher’s Note: The statements, opinions and data contained in all publications are solely those of the individual author(s) and contributor(s) and not of MDPI and/or the editor(s). MDPI and/or the editor(s) disclaim responsibility for any injury to people or property resulting from any ideas, methods, instructions or products referred to in the content. |
© 2025 by the author. Licensee MDPI, Basel, Switzerland. This article is an open access article distributed under the terms and conditions of the Creative Commons Attribution (CC BY) license (https://creativecommons.org/licenses/by/4.0/).
Share and Cite
Sogut, K. Structural Behaviour of Concrete Deep Beams Reinforced with Aluminium Alloy Bars. Appl. Sci. 2025, 15, 5453. https://doi.org/10.3390/app15105453
Sogut K. Structural Behaviour of Concrete Deep Beams Reinforced with Aluminium Alloy Bars. Applied Sciences. 2025; 15(10):5453. https://doi.org/10.3390/app15105453
Chicago/Turabian StyleSogut, Kagan. 2025. "Structural Behaviour of Concrete Deep Beams Reinforced with Aluminium Alloy Bars" Applied Sciences 15, no. 10: 5453. https://doi.org/10.3390/app15105453
APA StyleSogut, K. (2025). Structural Behaviour of Concrete Deep Beams Reinforced with Aluminium Alloy Bars. Applied Sciences, 15(10), 5453. https://doi.org/10.3390/app15105453