
The Development of an Optimized Impact Pad for a Six-Strand Tundish Using CFD Simulations

 ,
,  ,
,  , , , , and
Abstract
1. Introduction
2. Materials and Methods
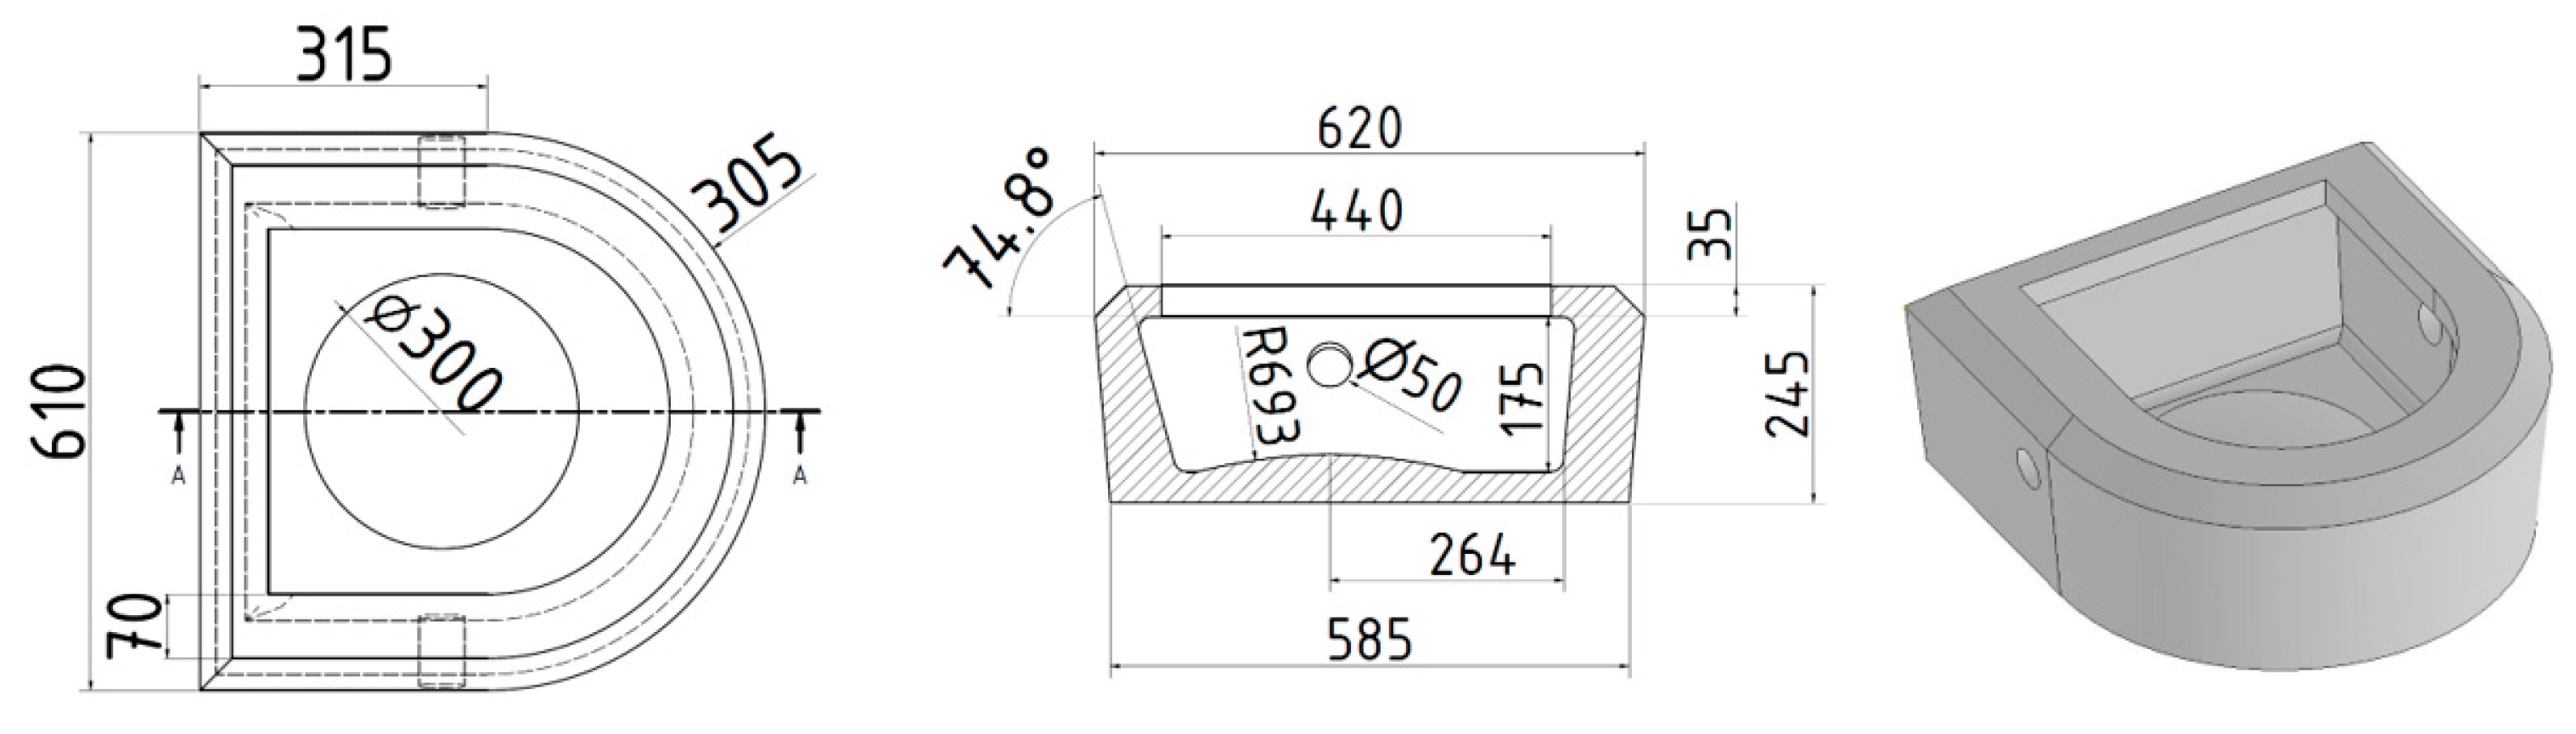
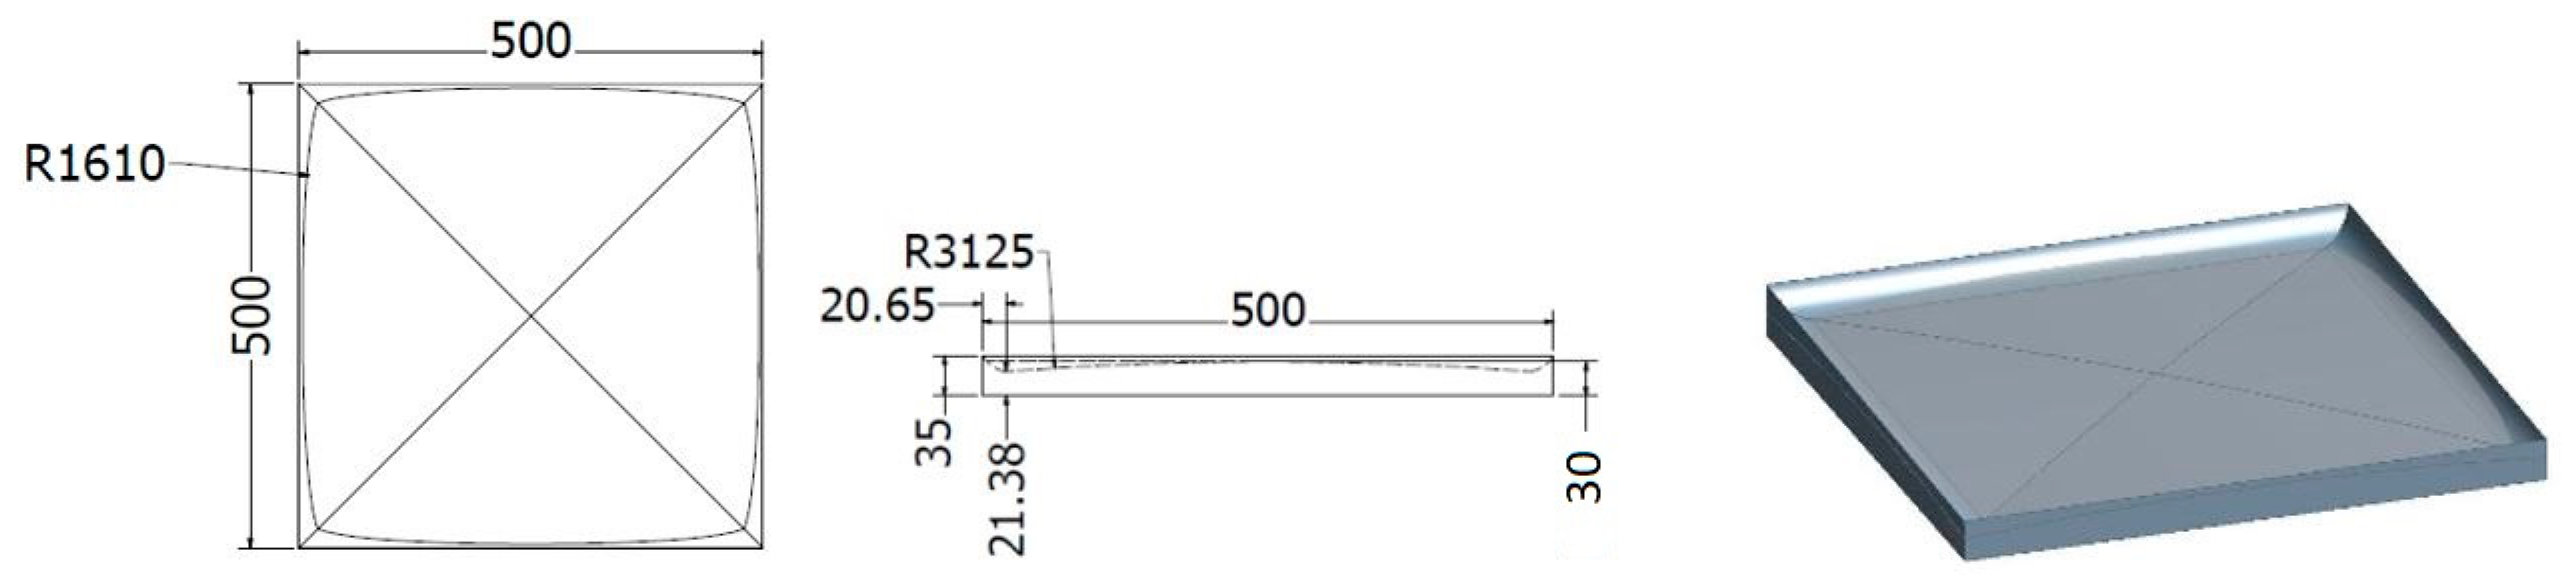
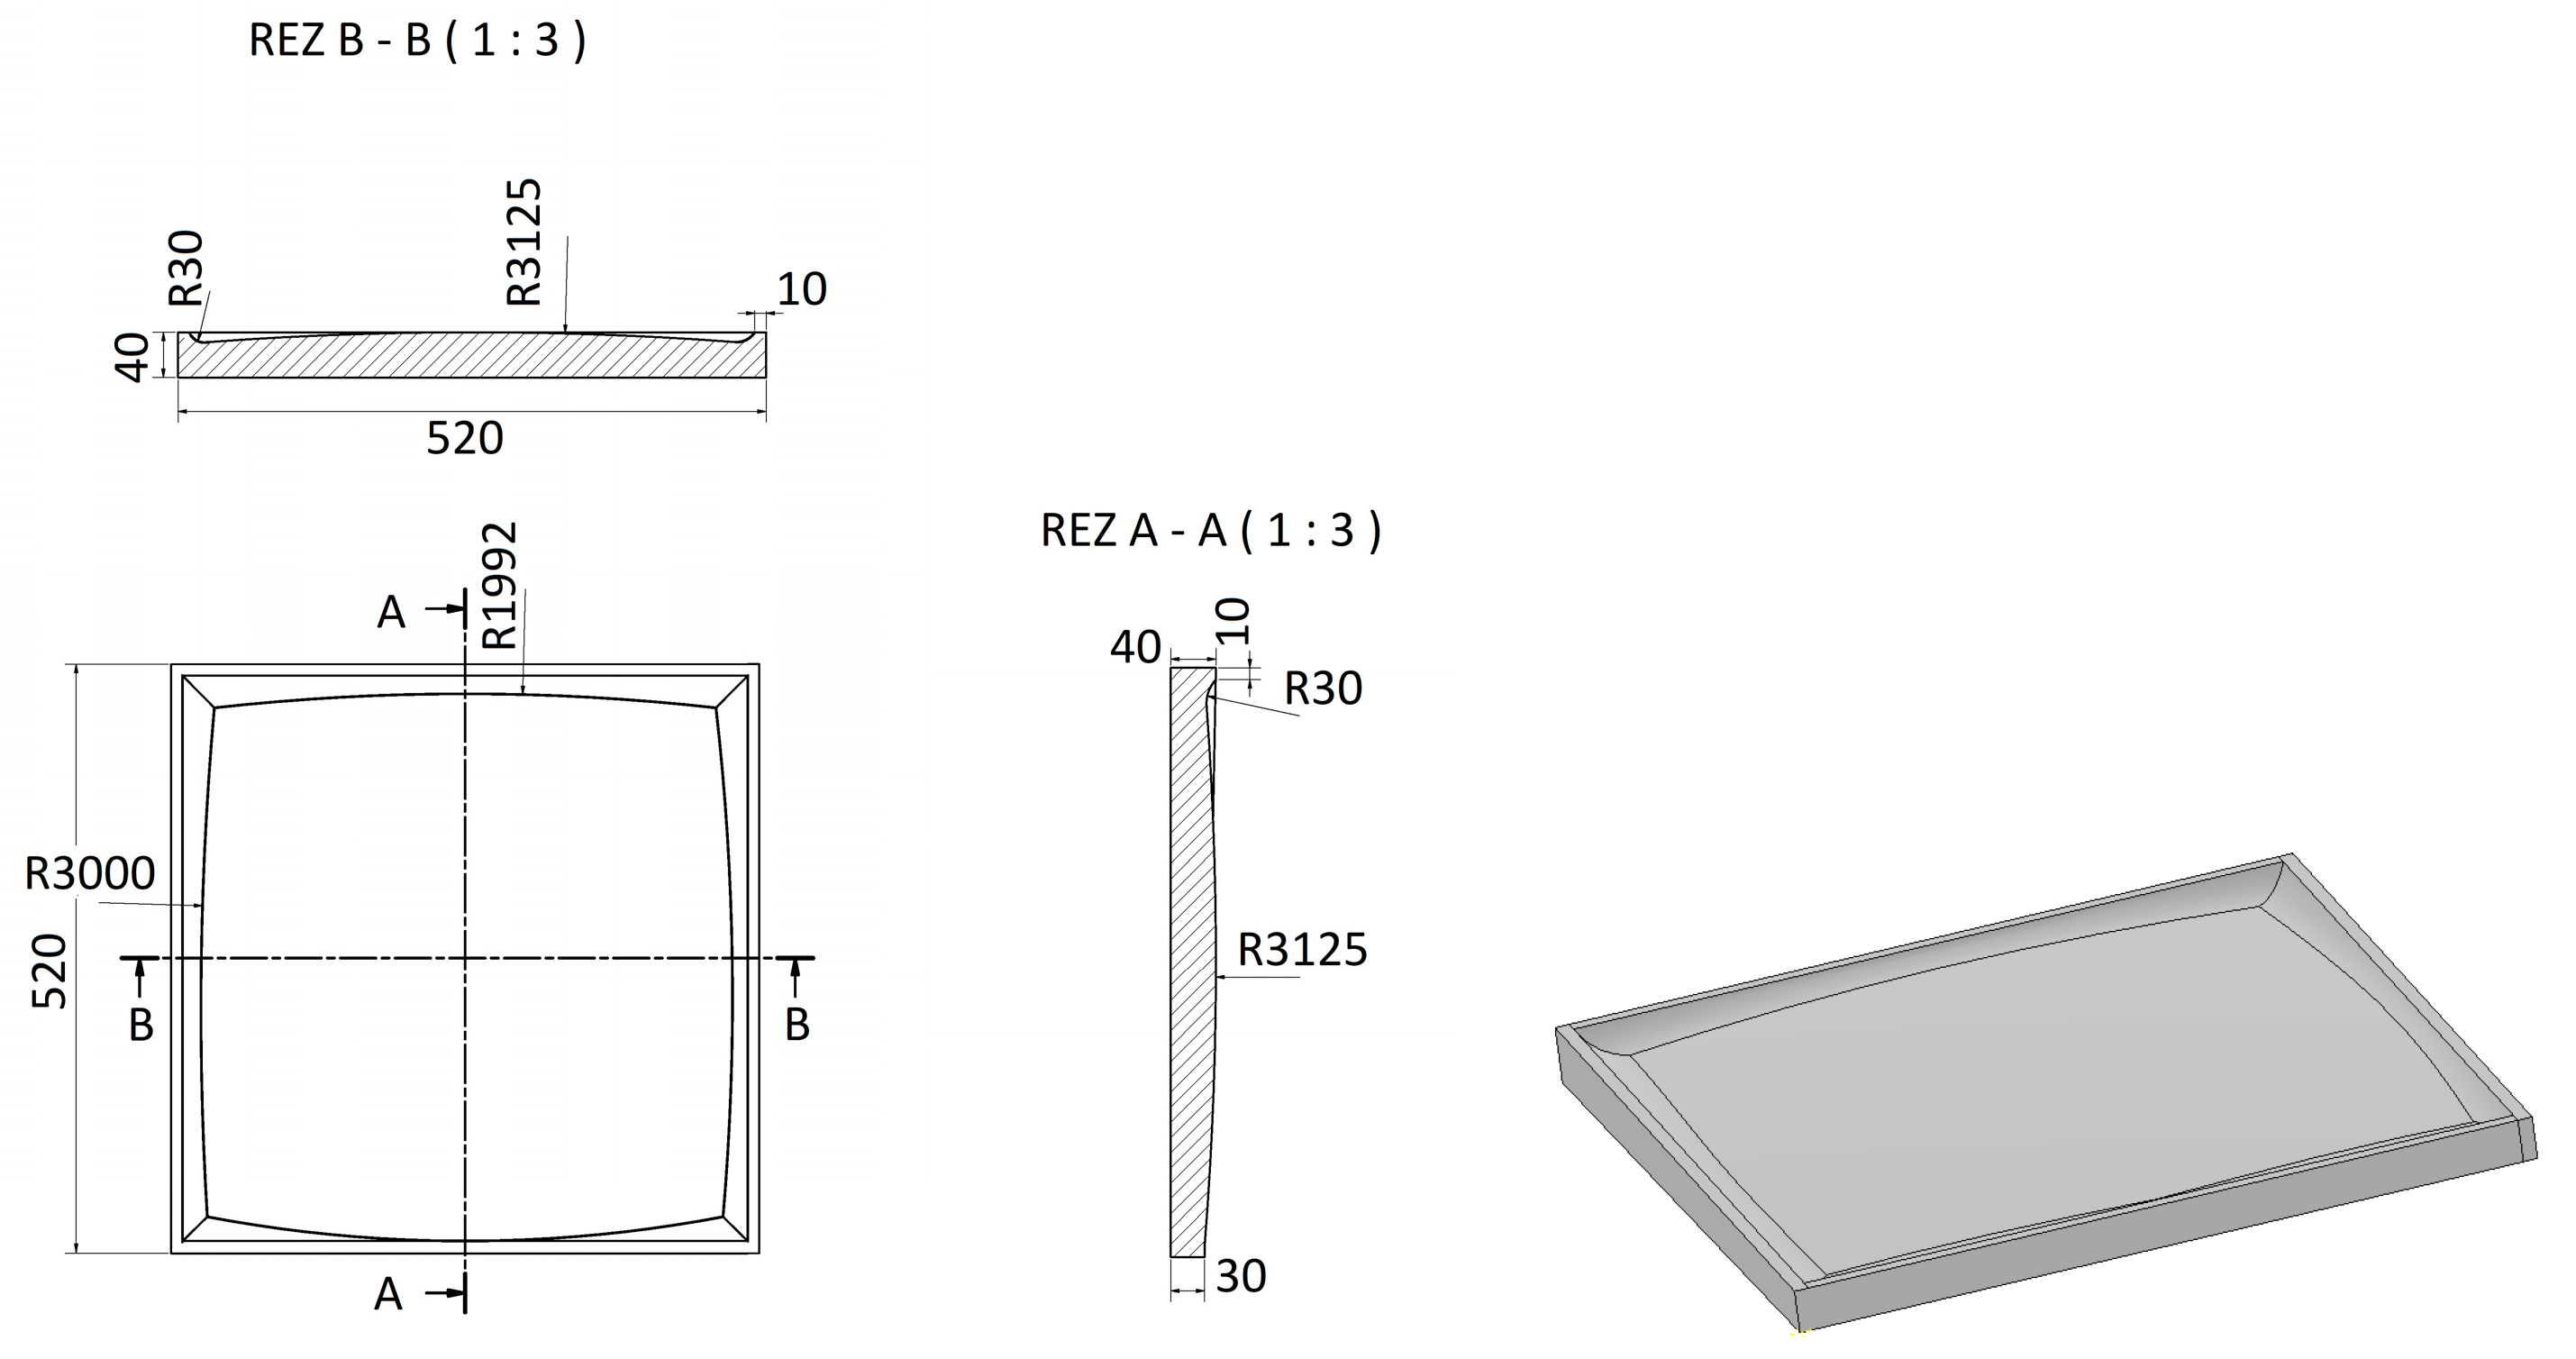
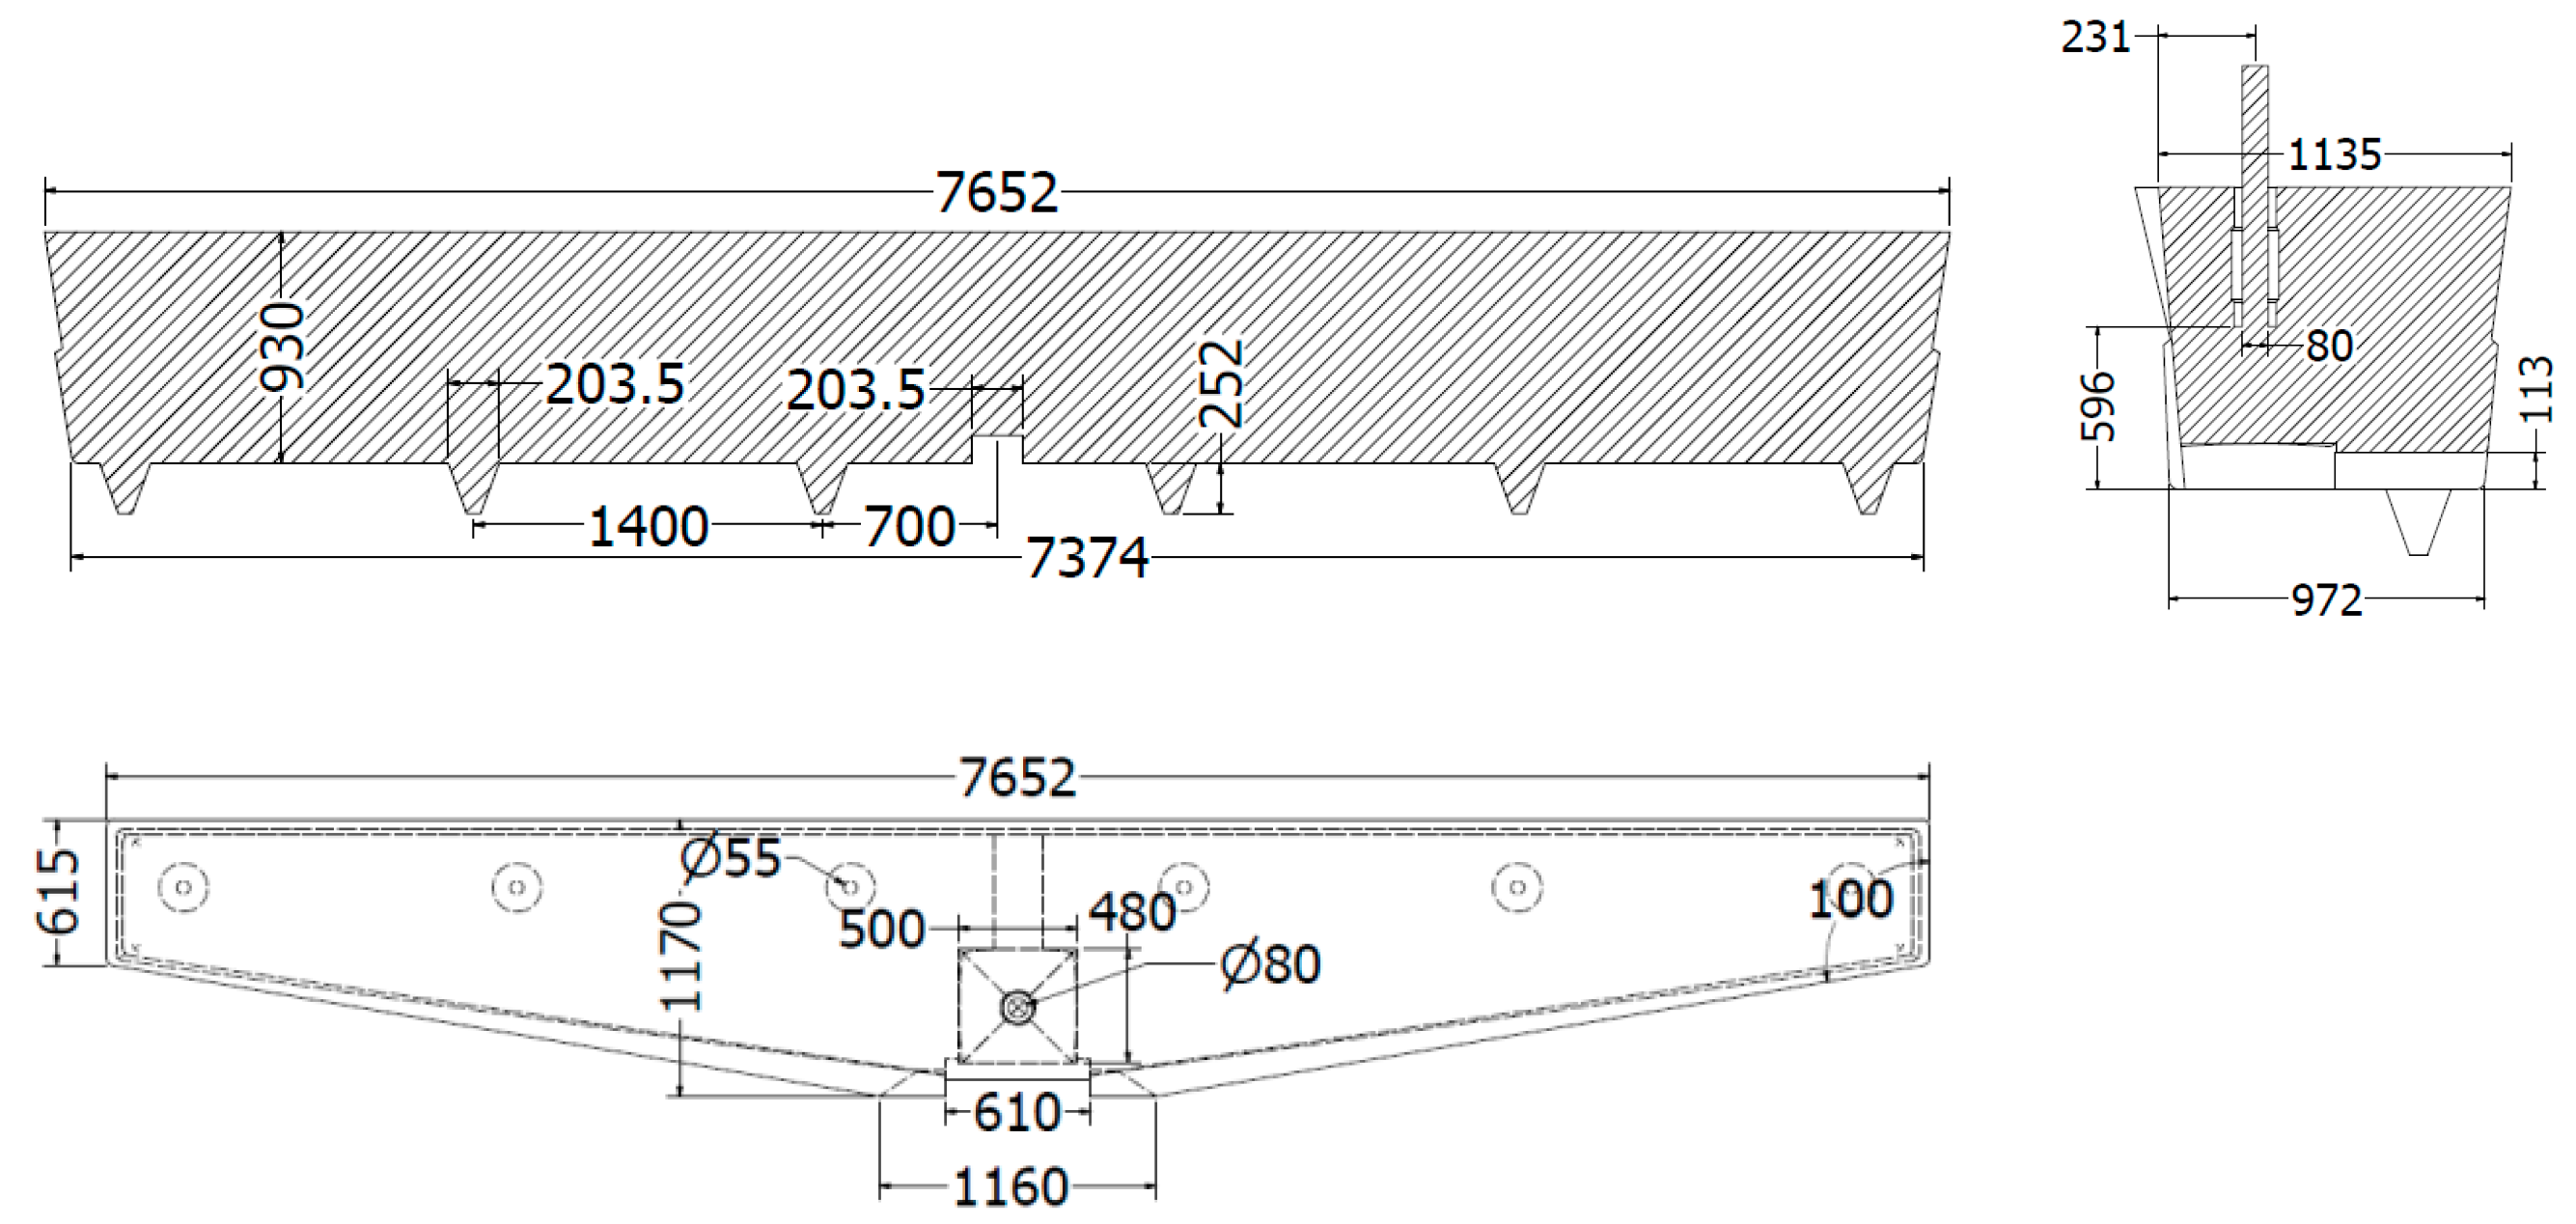
Description of Impact Pads
3. Numerical Modeling
3.1. Description of the CFD Model
- is the plug volume, measured in [m3];
- is the minimum residence time, measured in [s];
- is the theoretical mean residence time, measured in [s].
- V is the tundish volume, measured in [m3];
- Q is the volumetric flow rate [m3·s−1].
- is the dead zone volume, measured in [m3];
- is the real mean residence time flow in the equipment [s] (8).
- is the mixed volume, measured in [m3].
3.2. Particle Transport Model
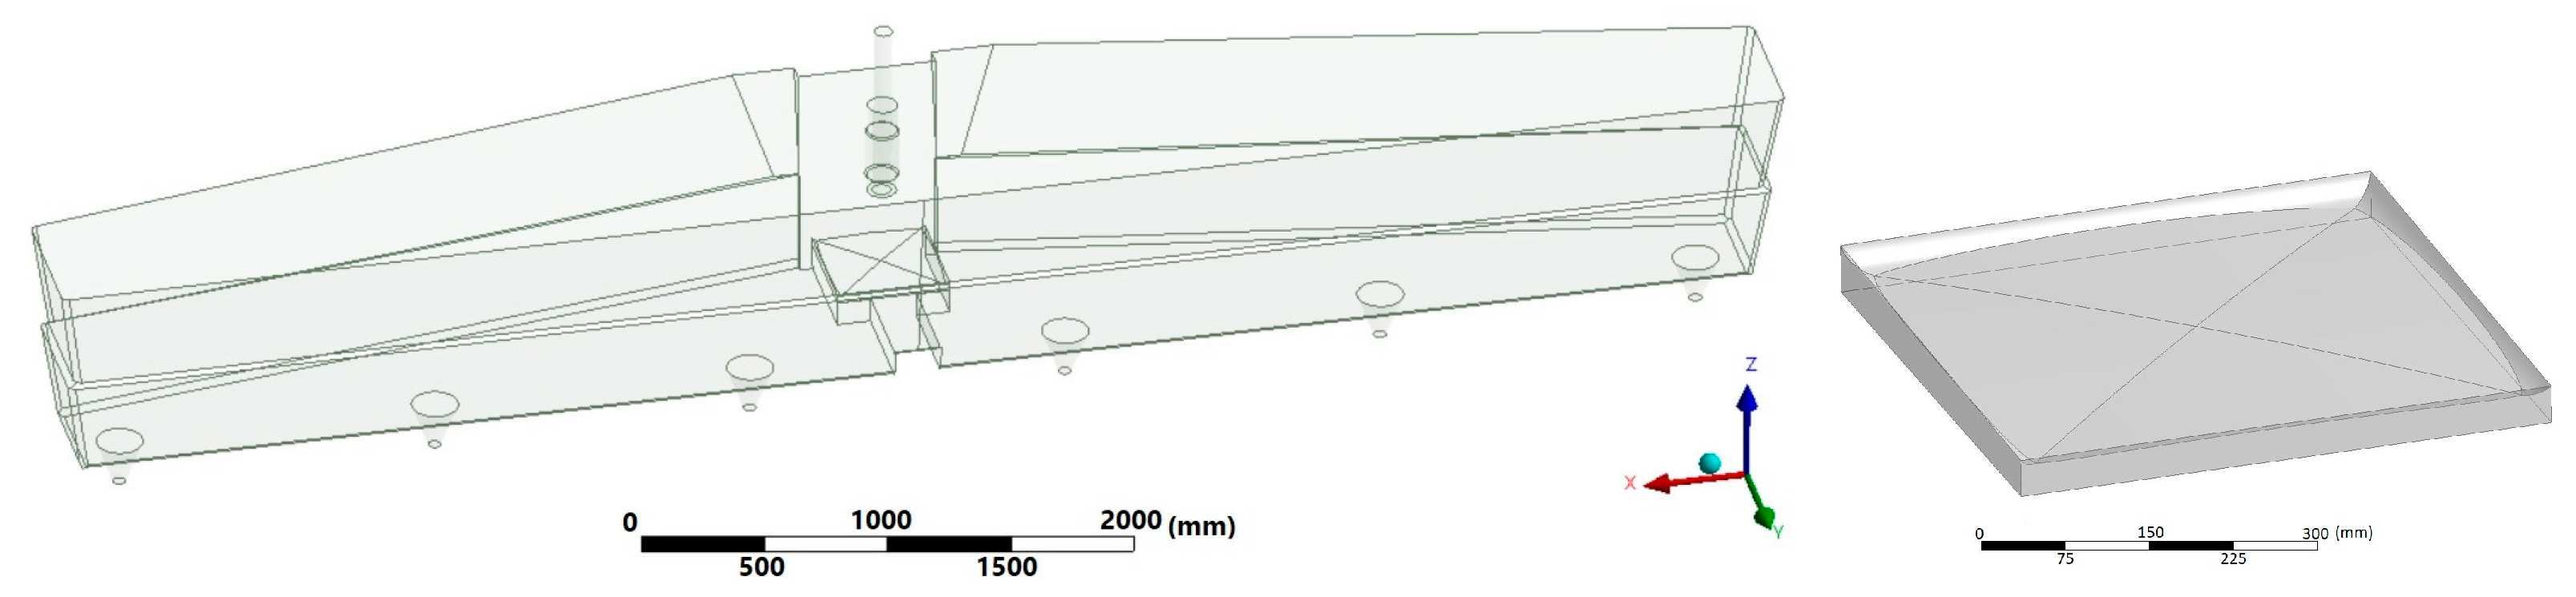
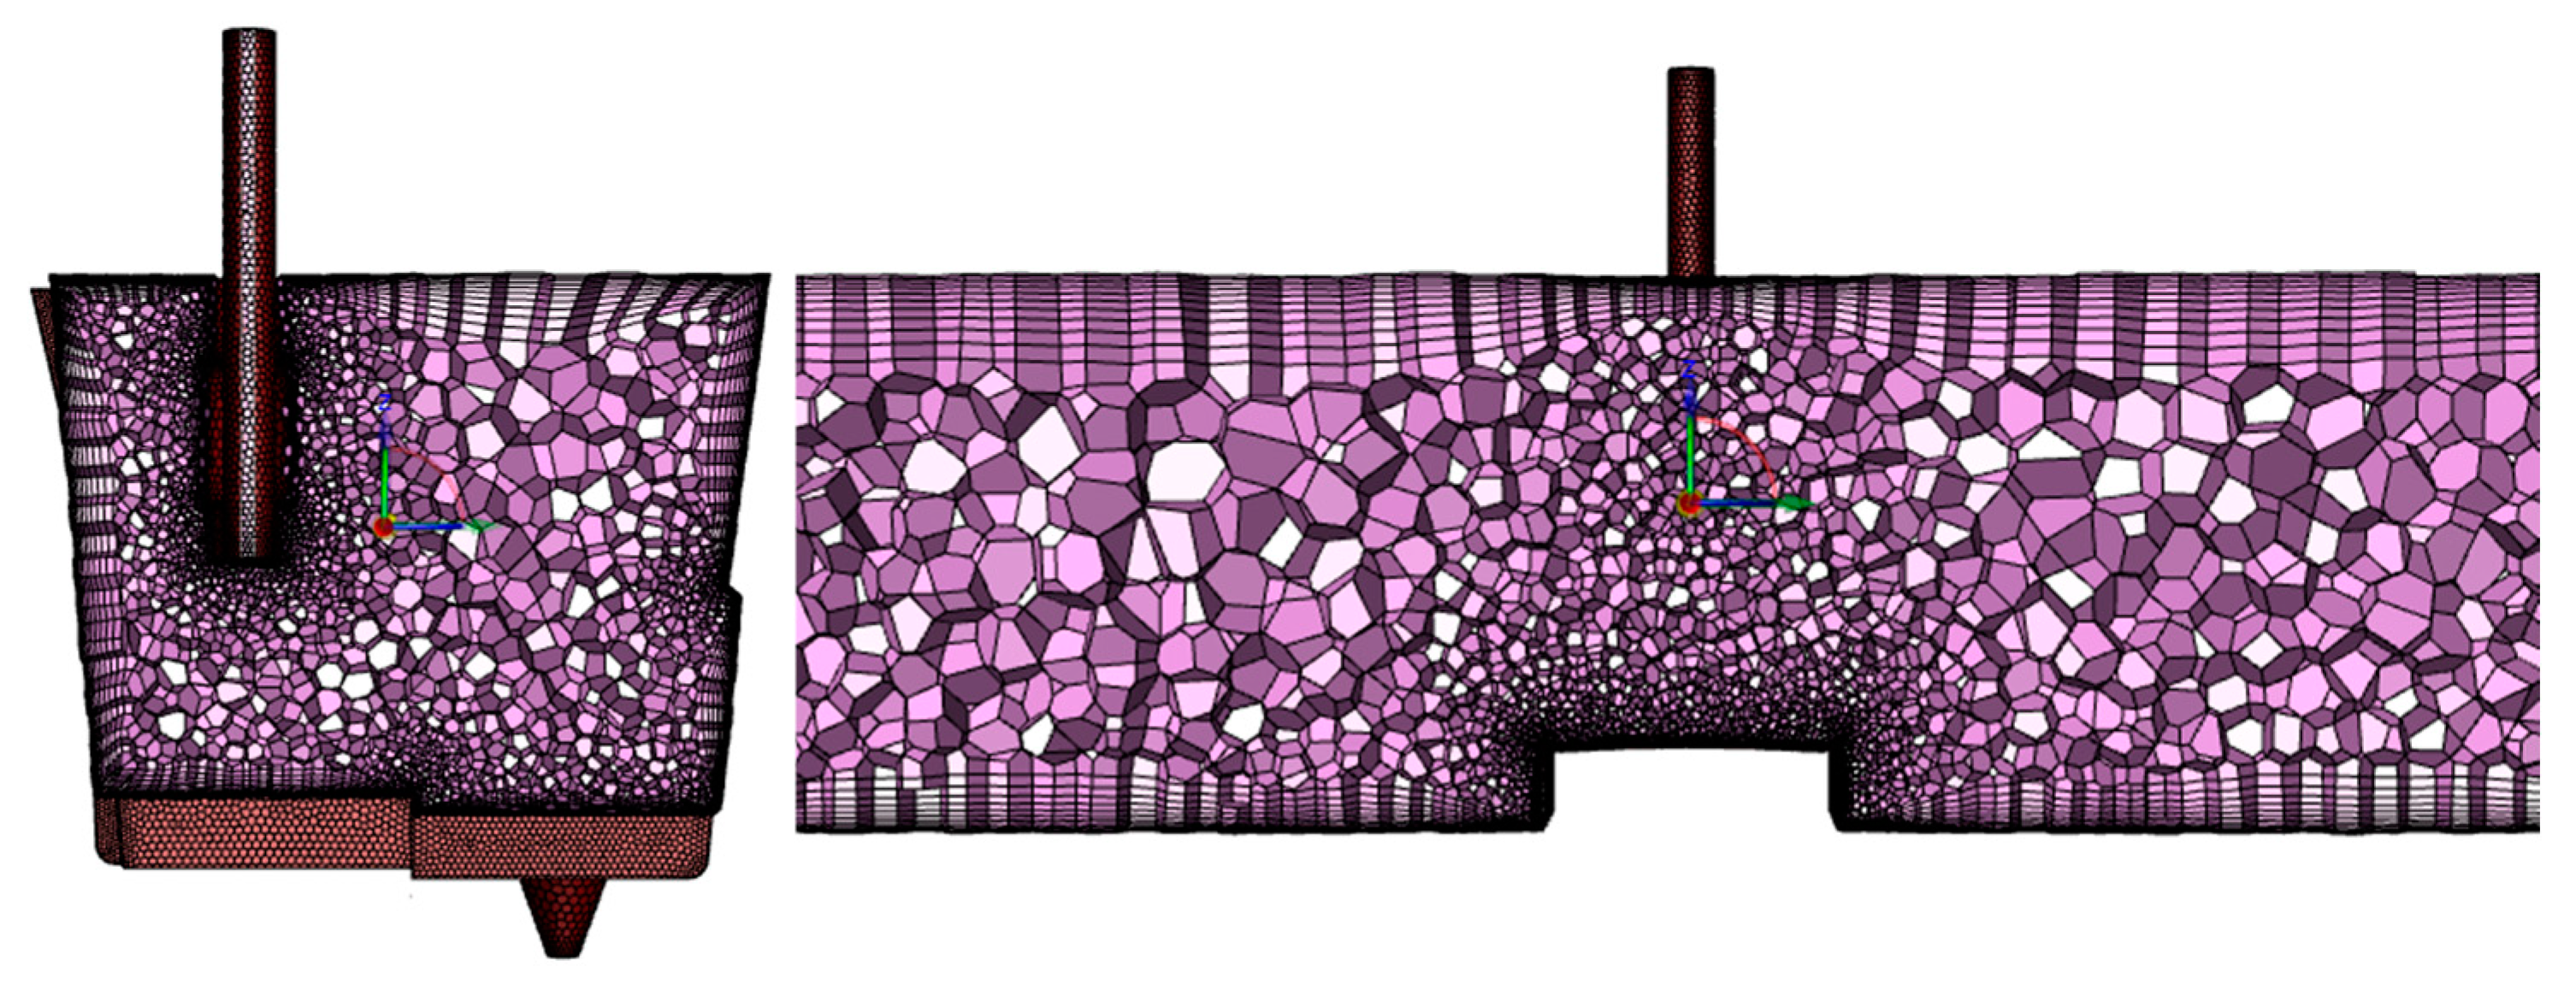
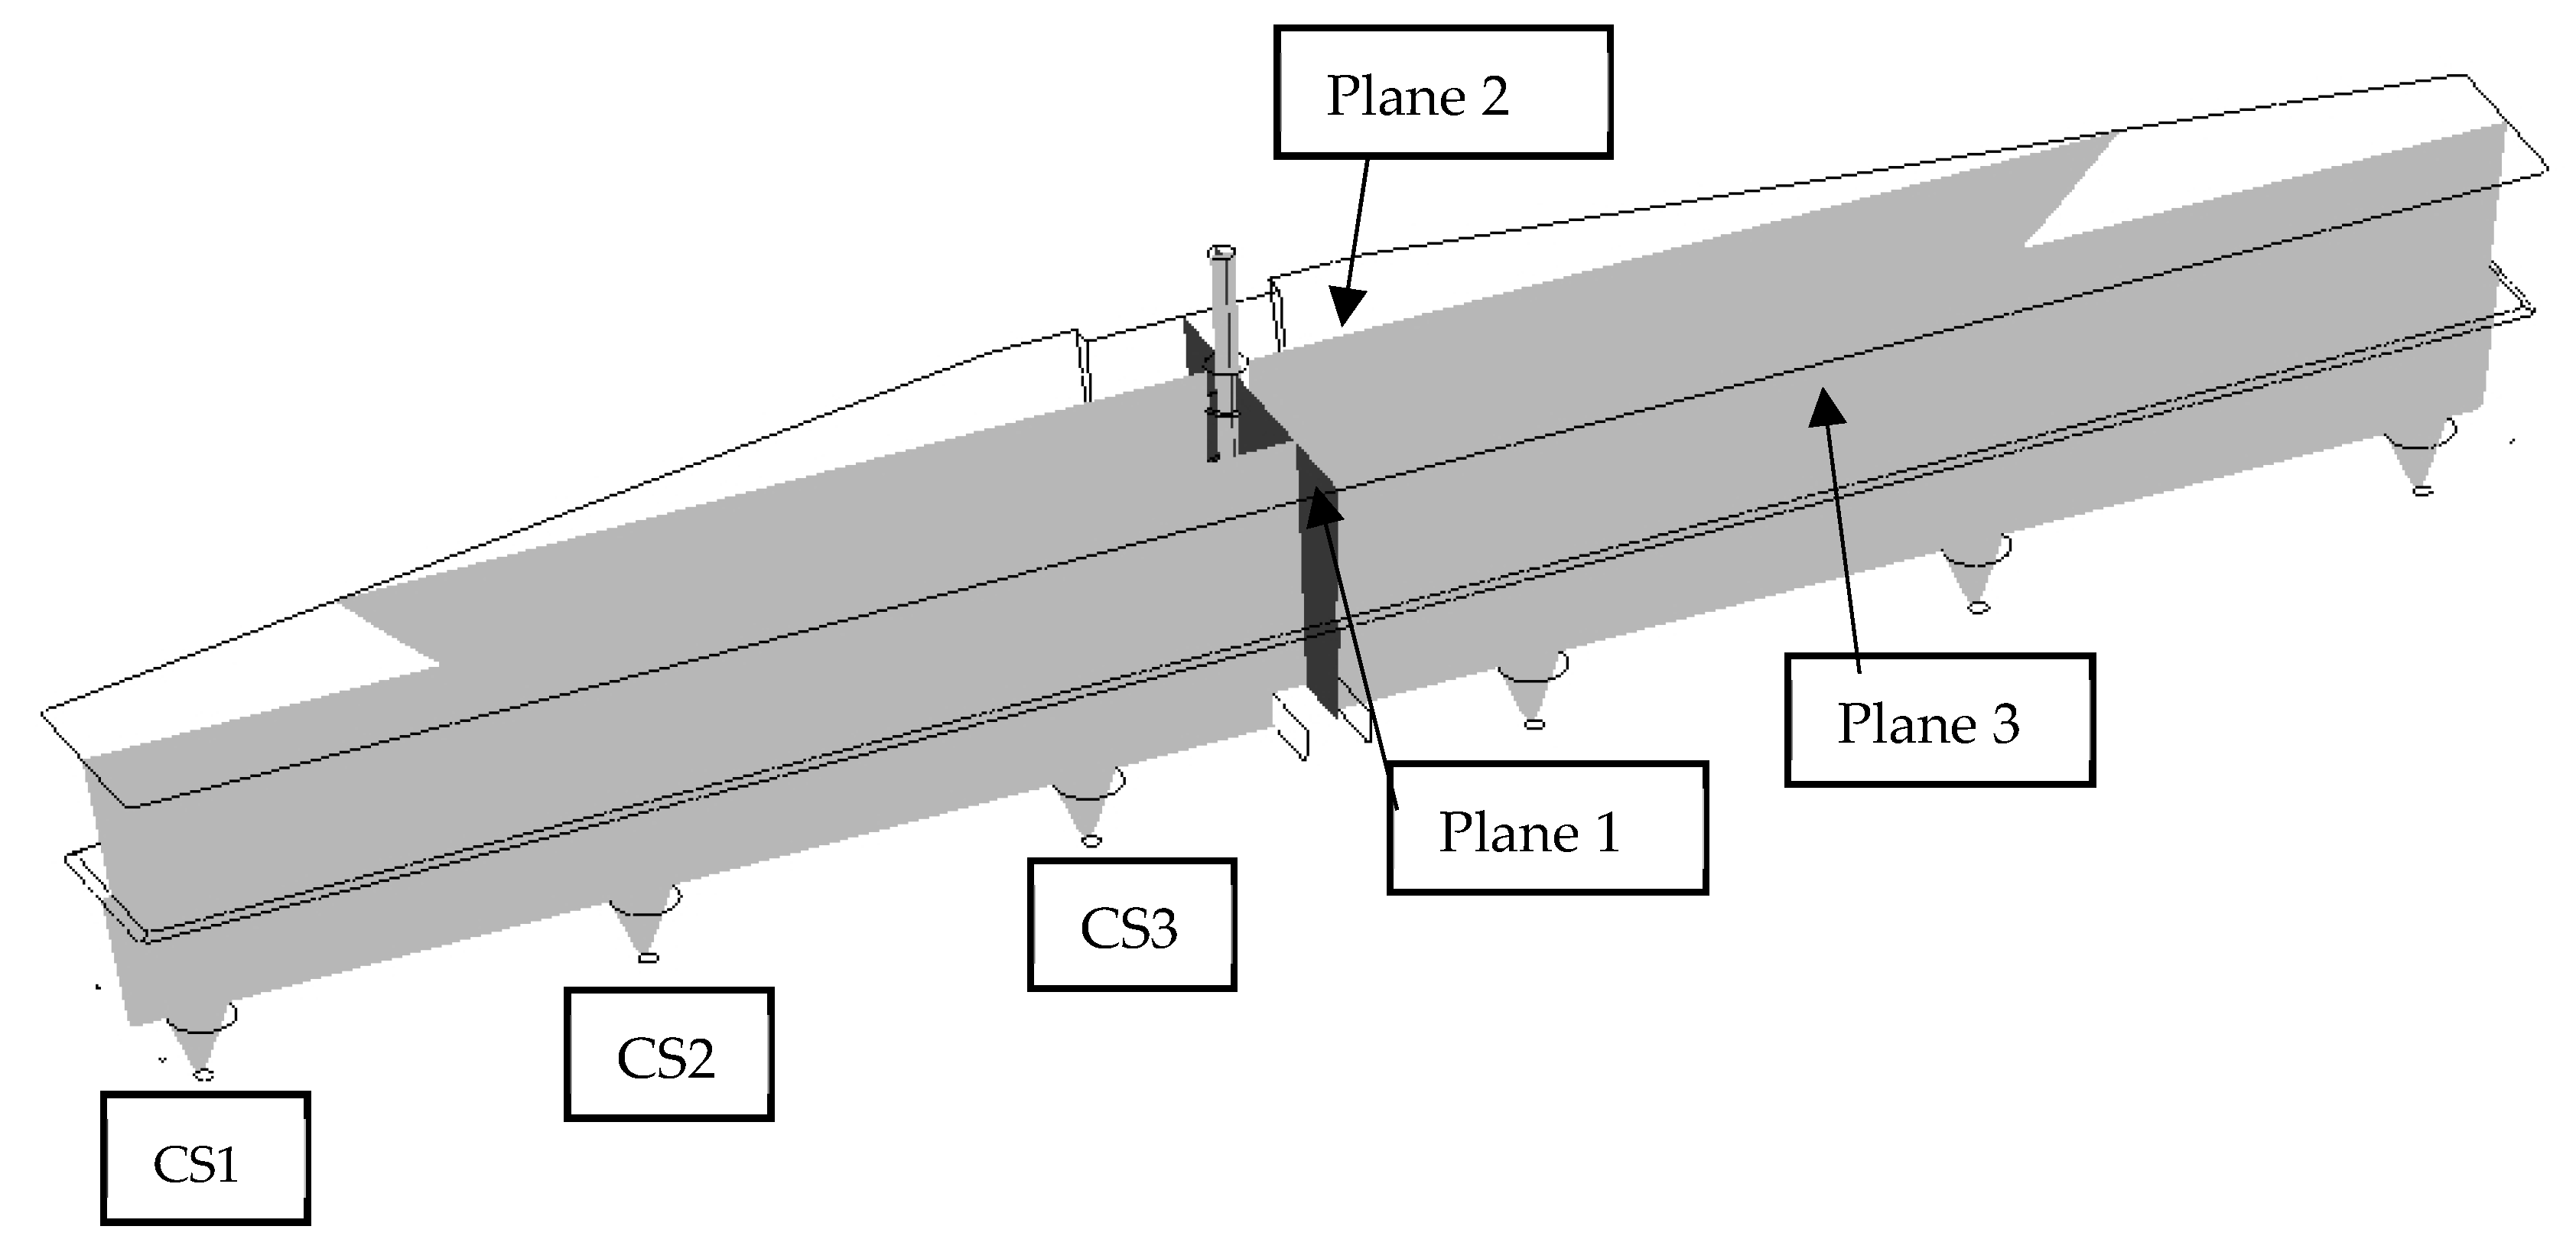
3.3. Geometry, Computational Mesh, and Boundary Conditions
4. Evaluation and Discussion
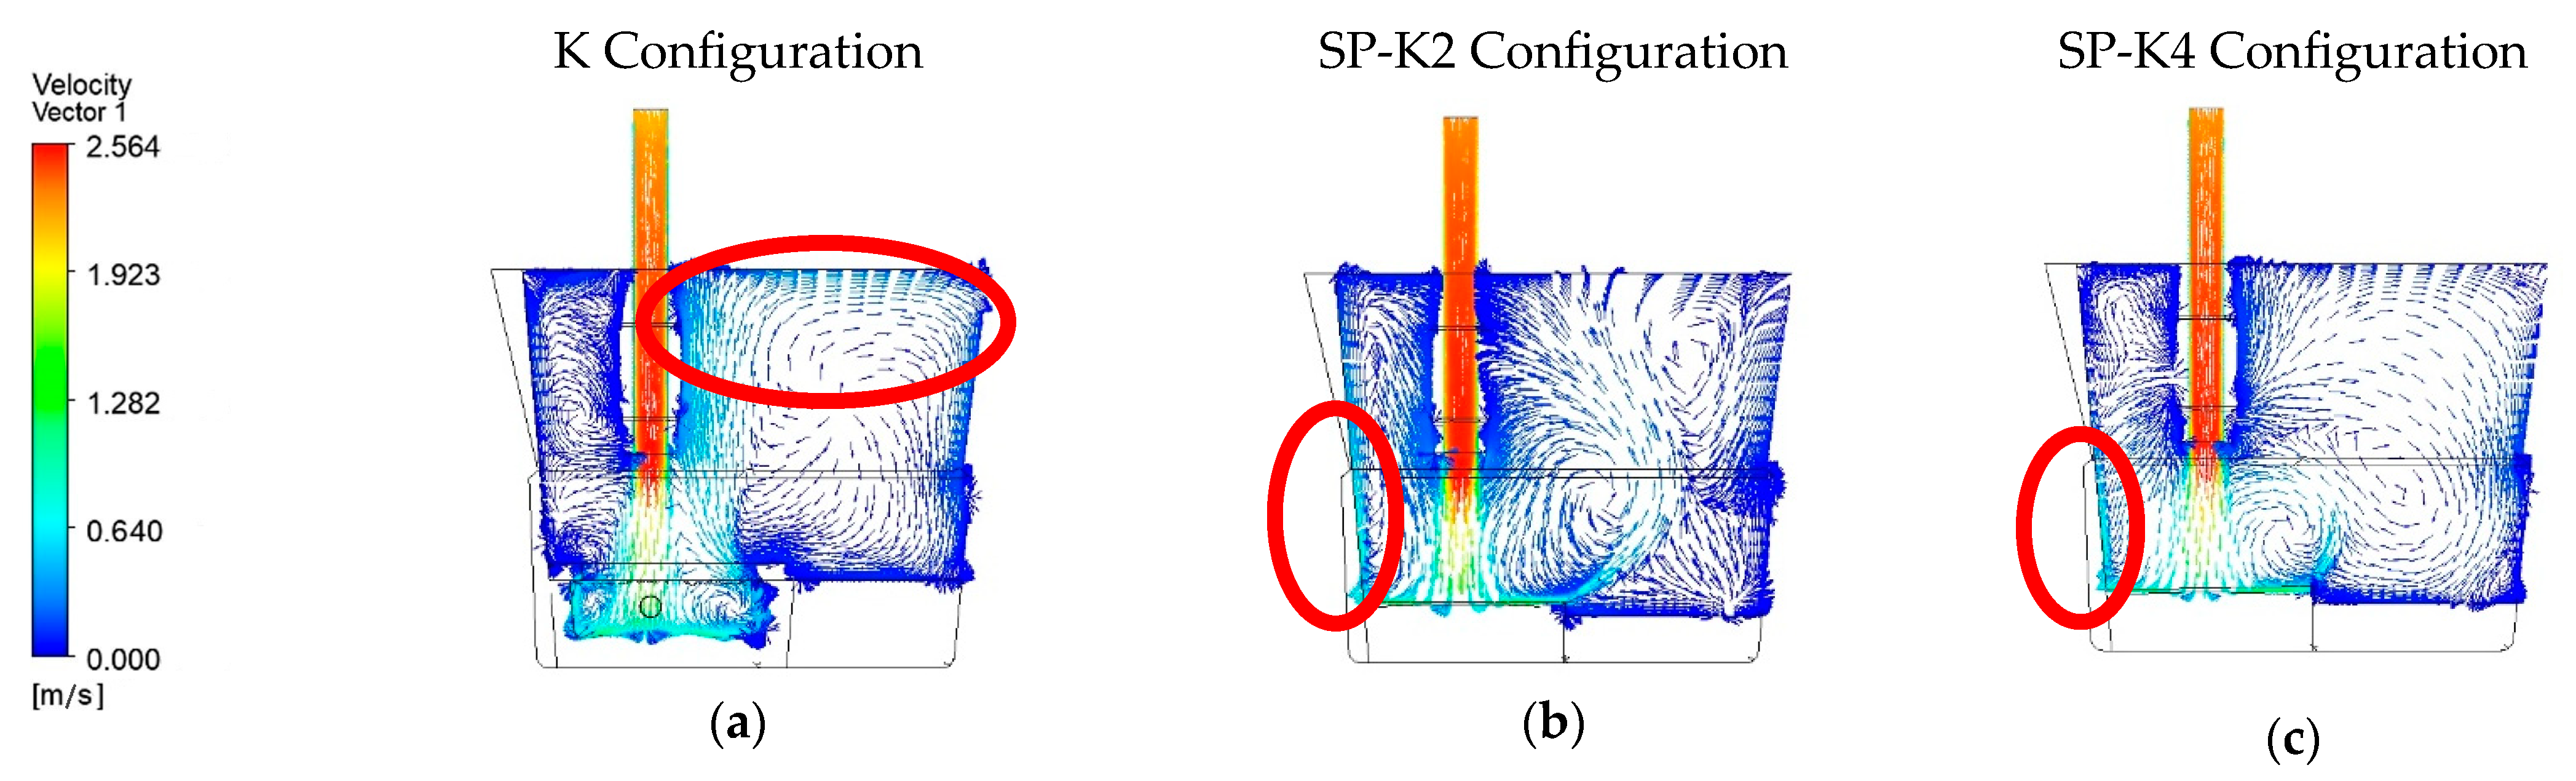
4.1. Flow Characteristic Evaluation
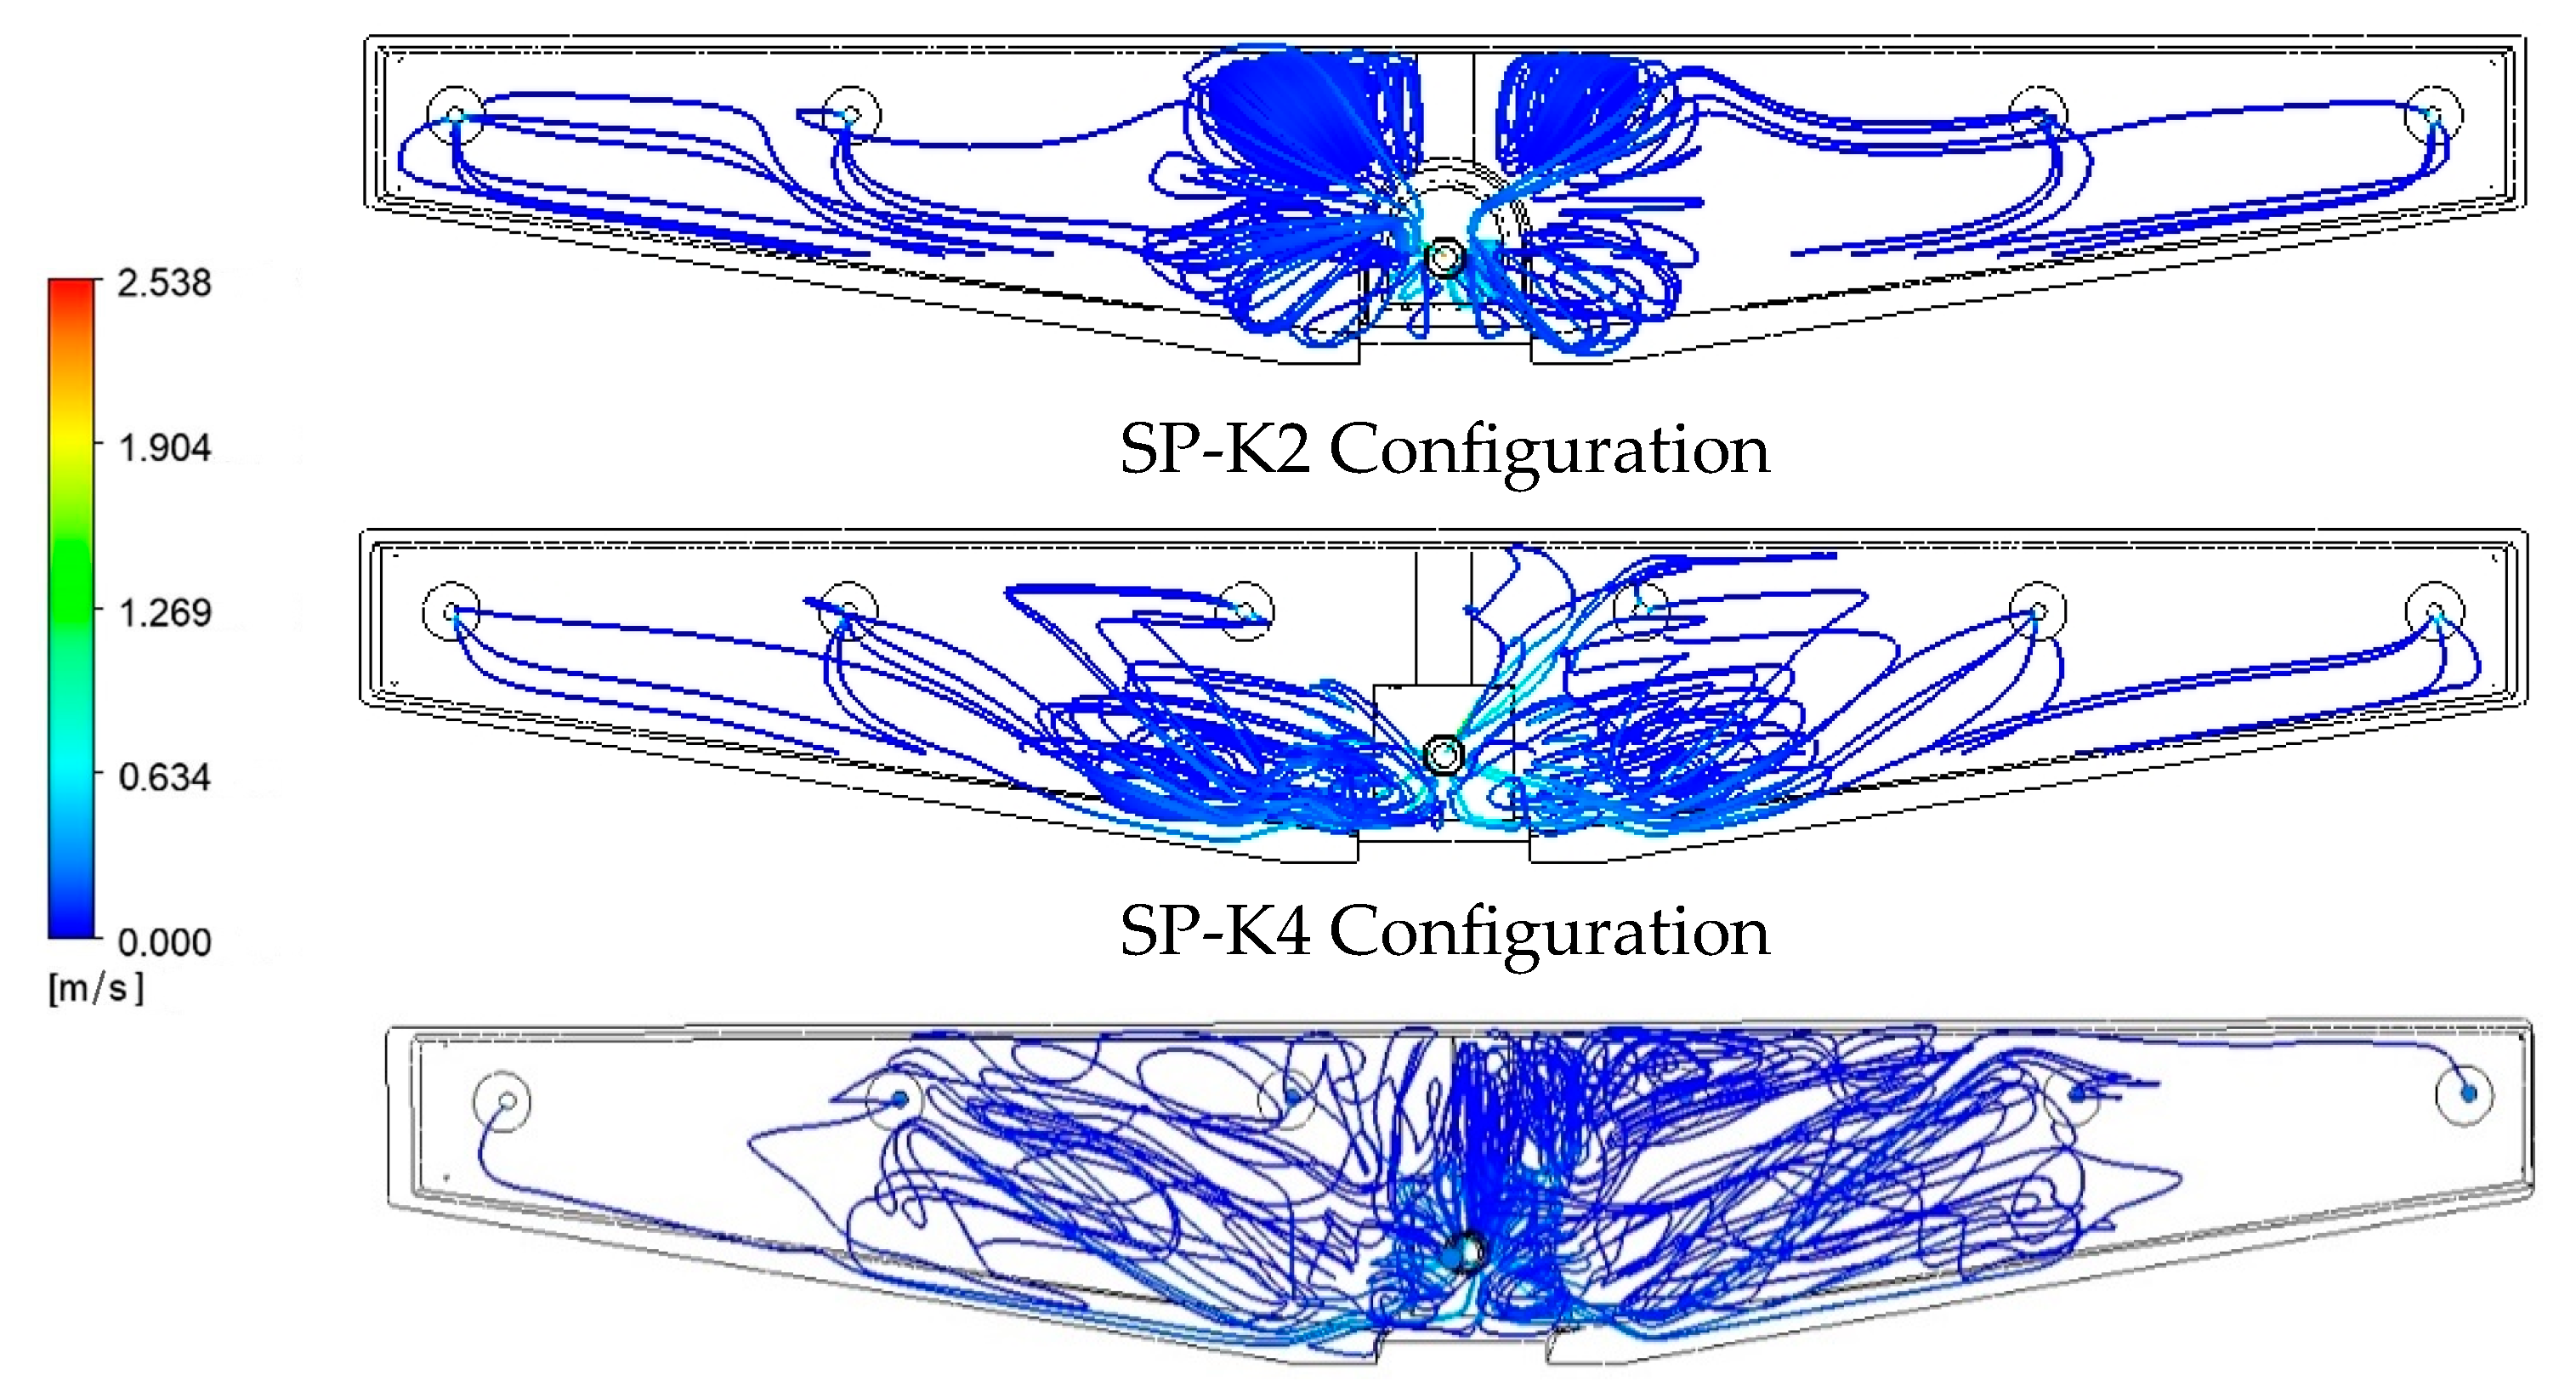
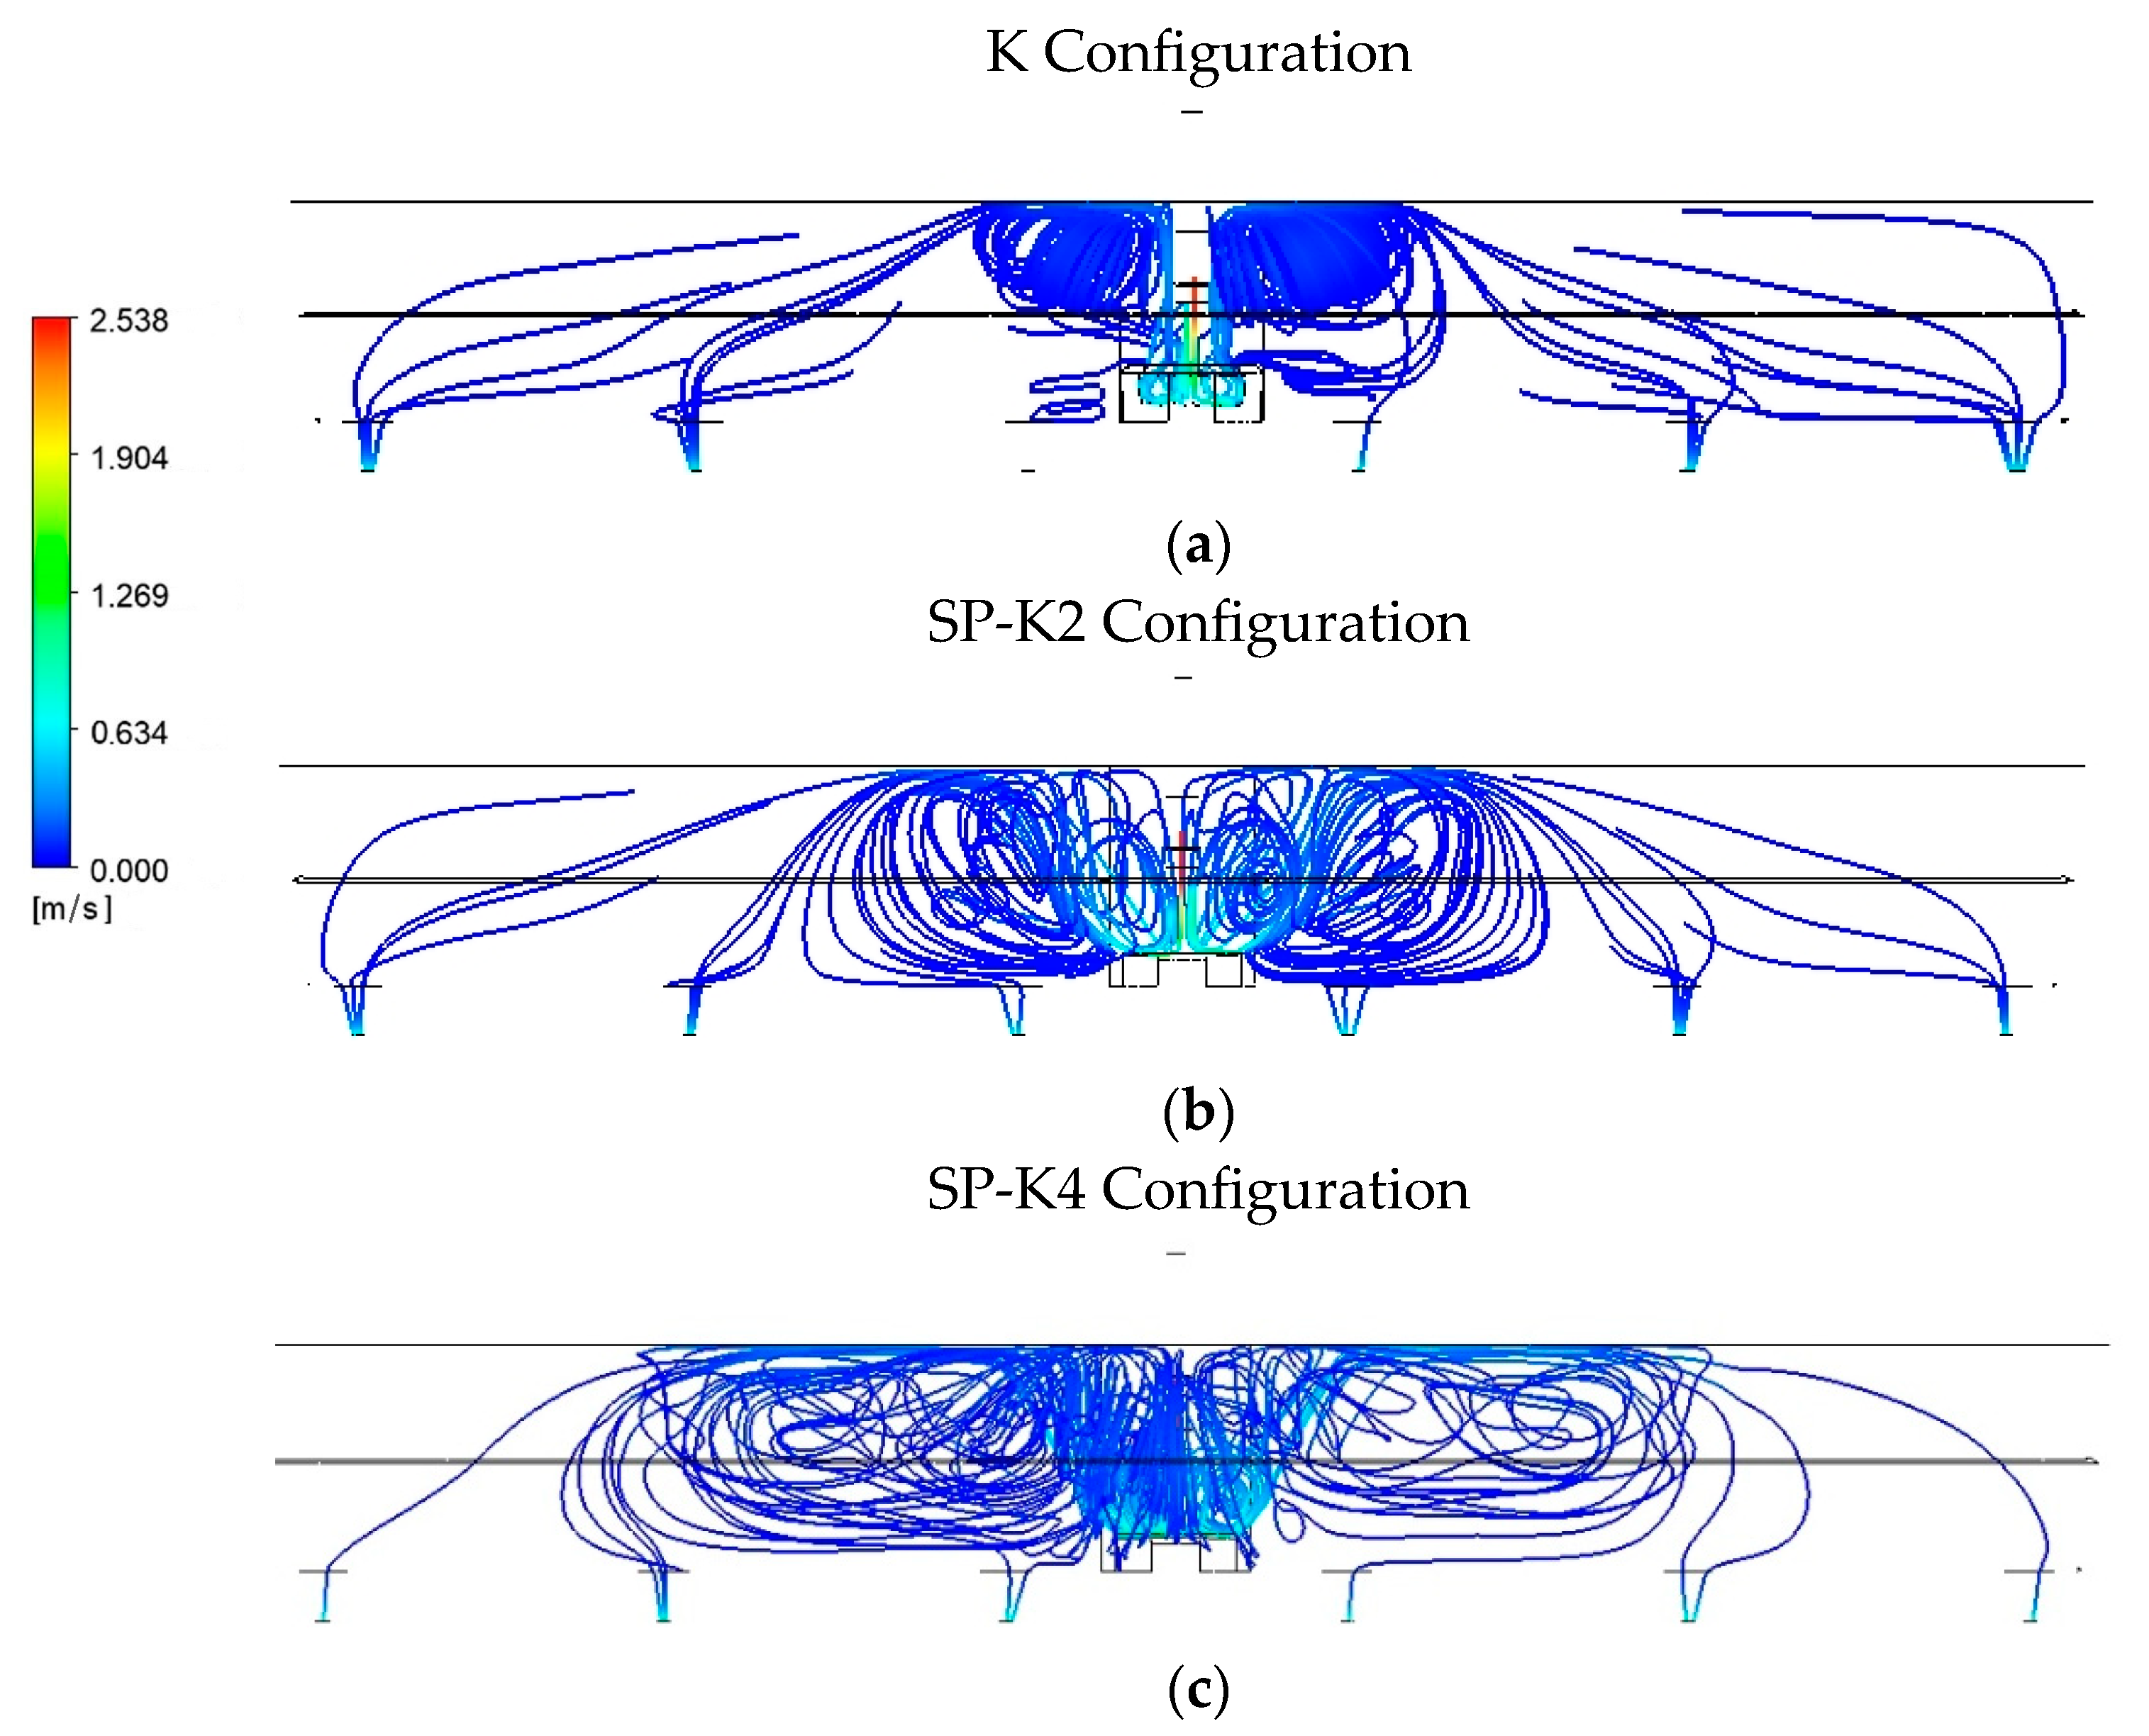
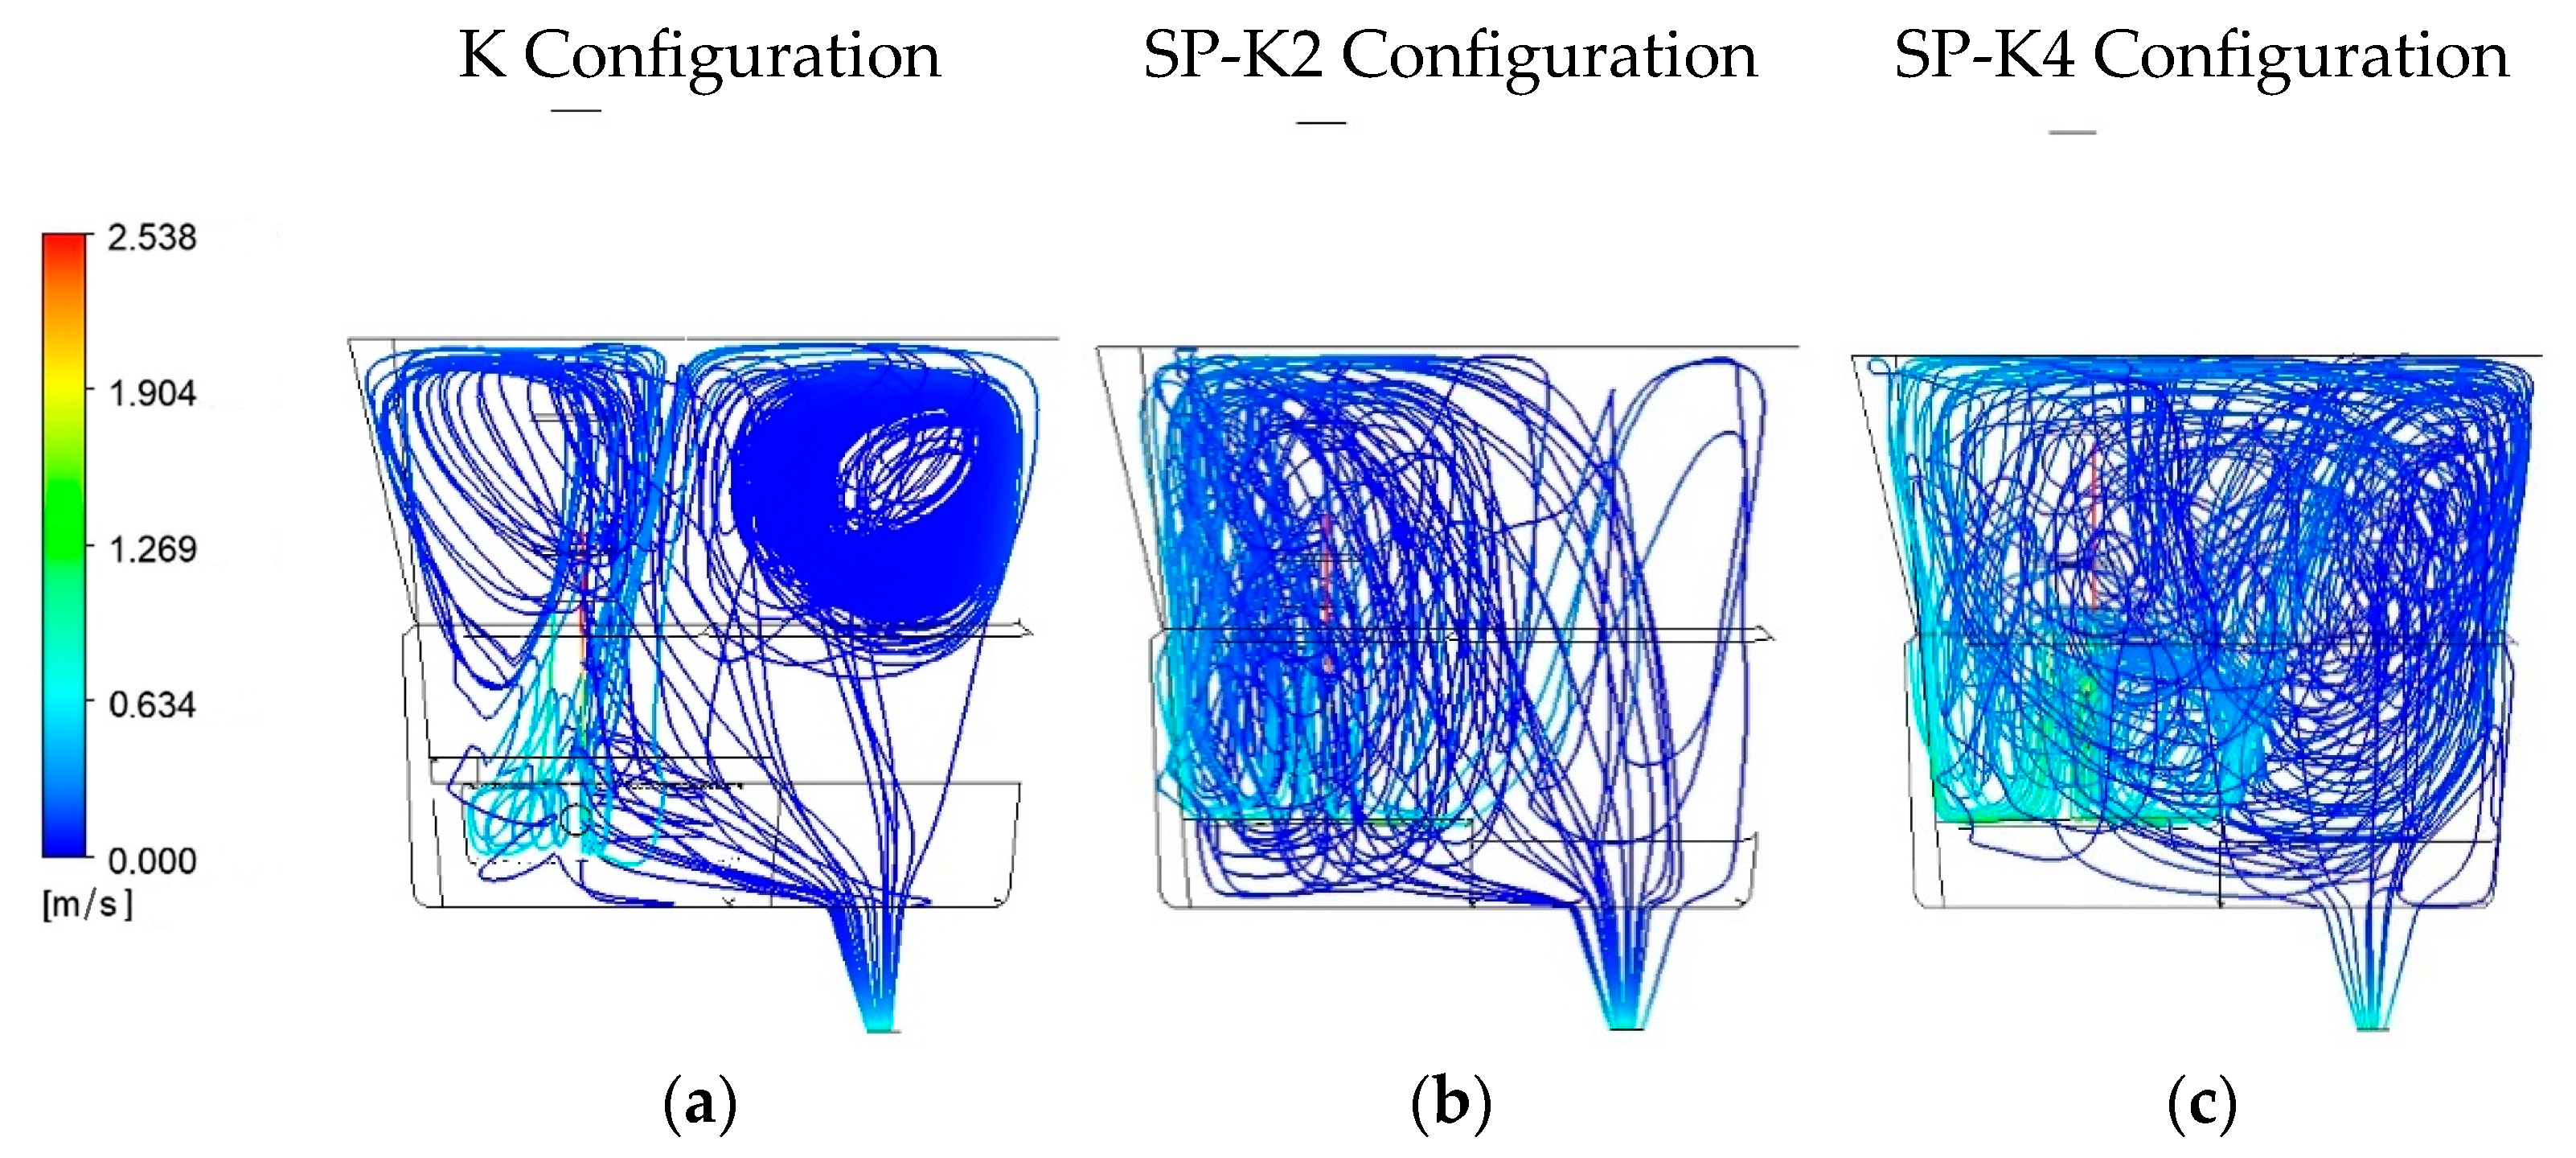
4.2. Streamlines
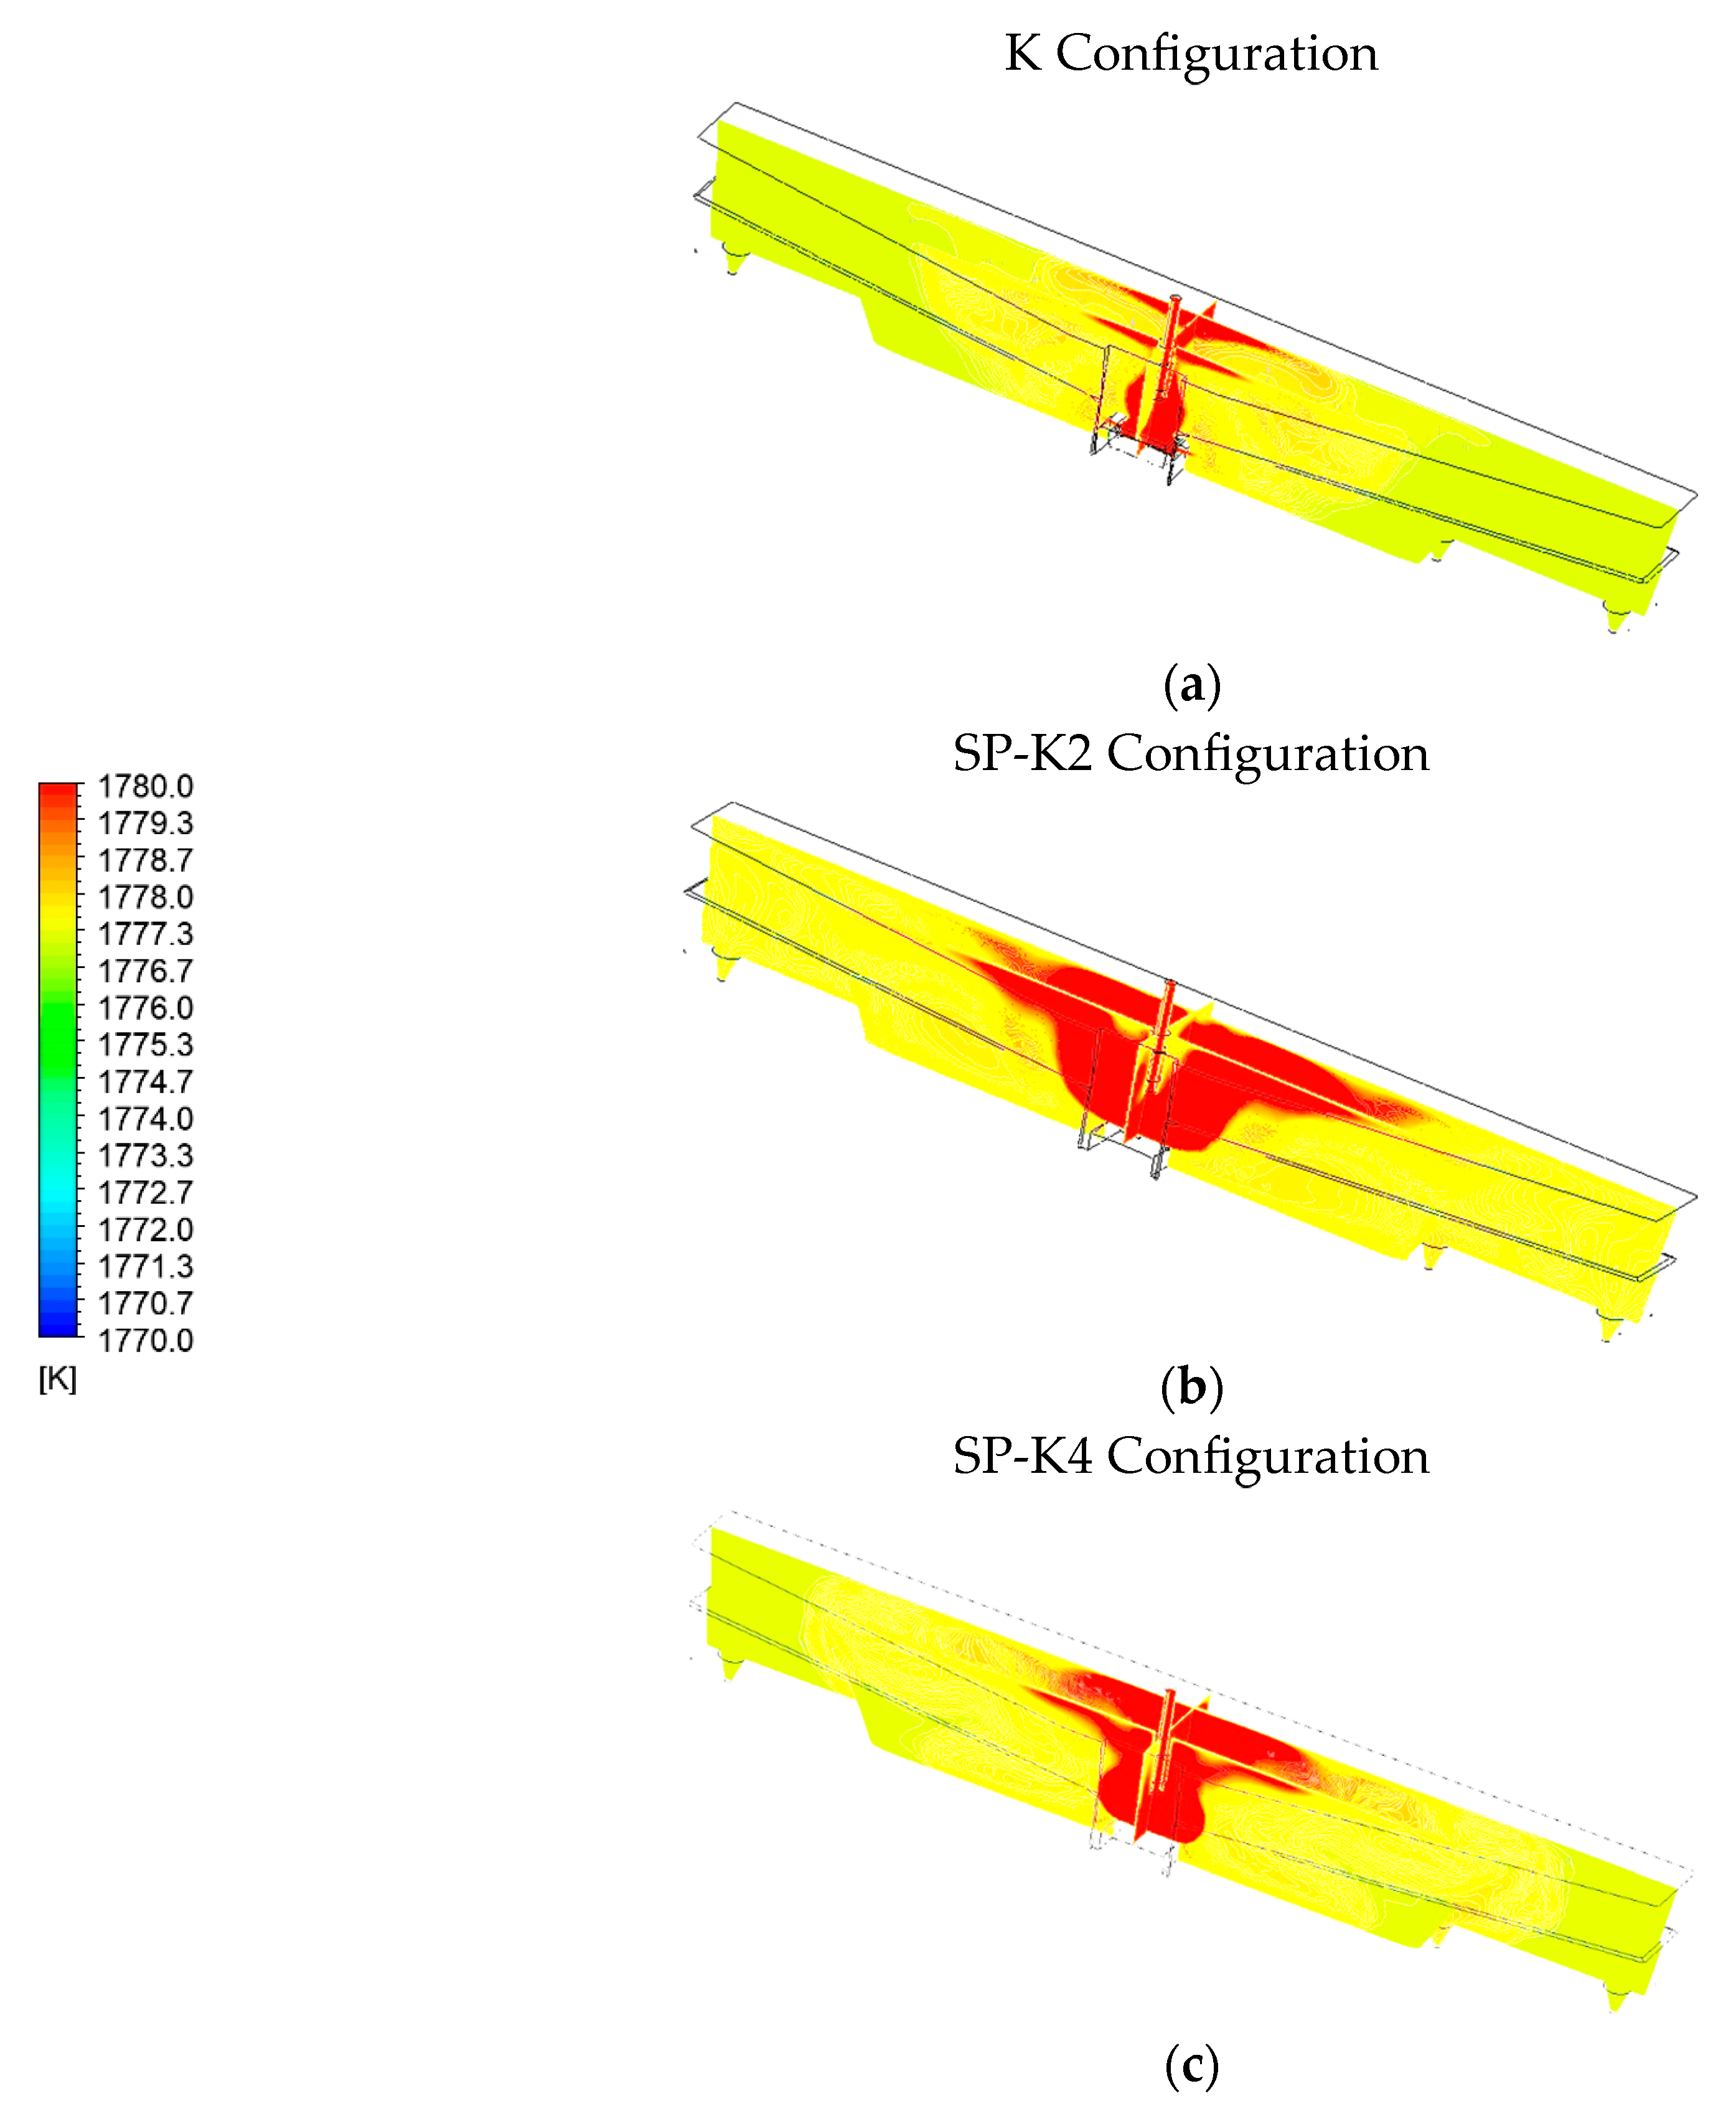
4.3. Heat Transfer
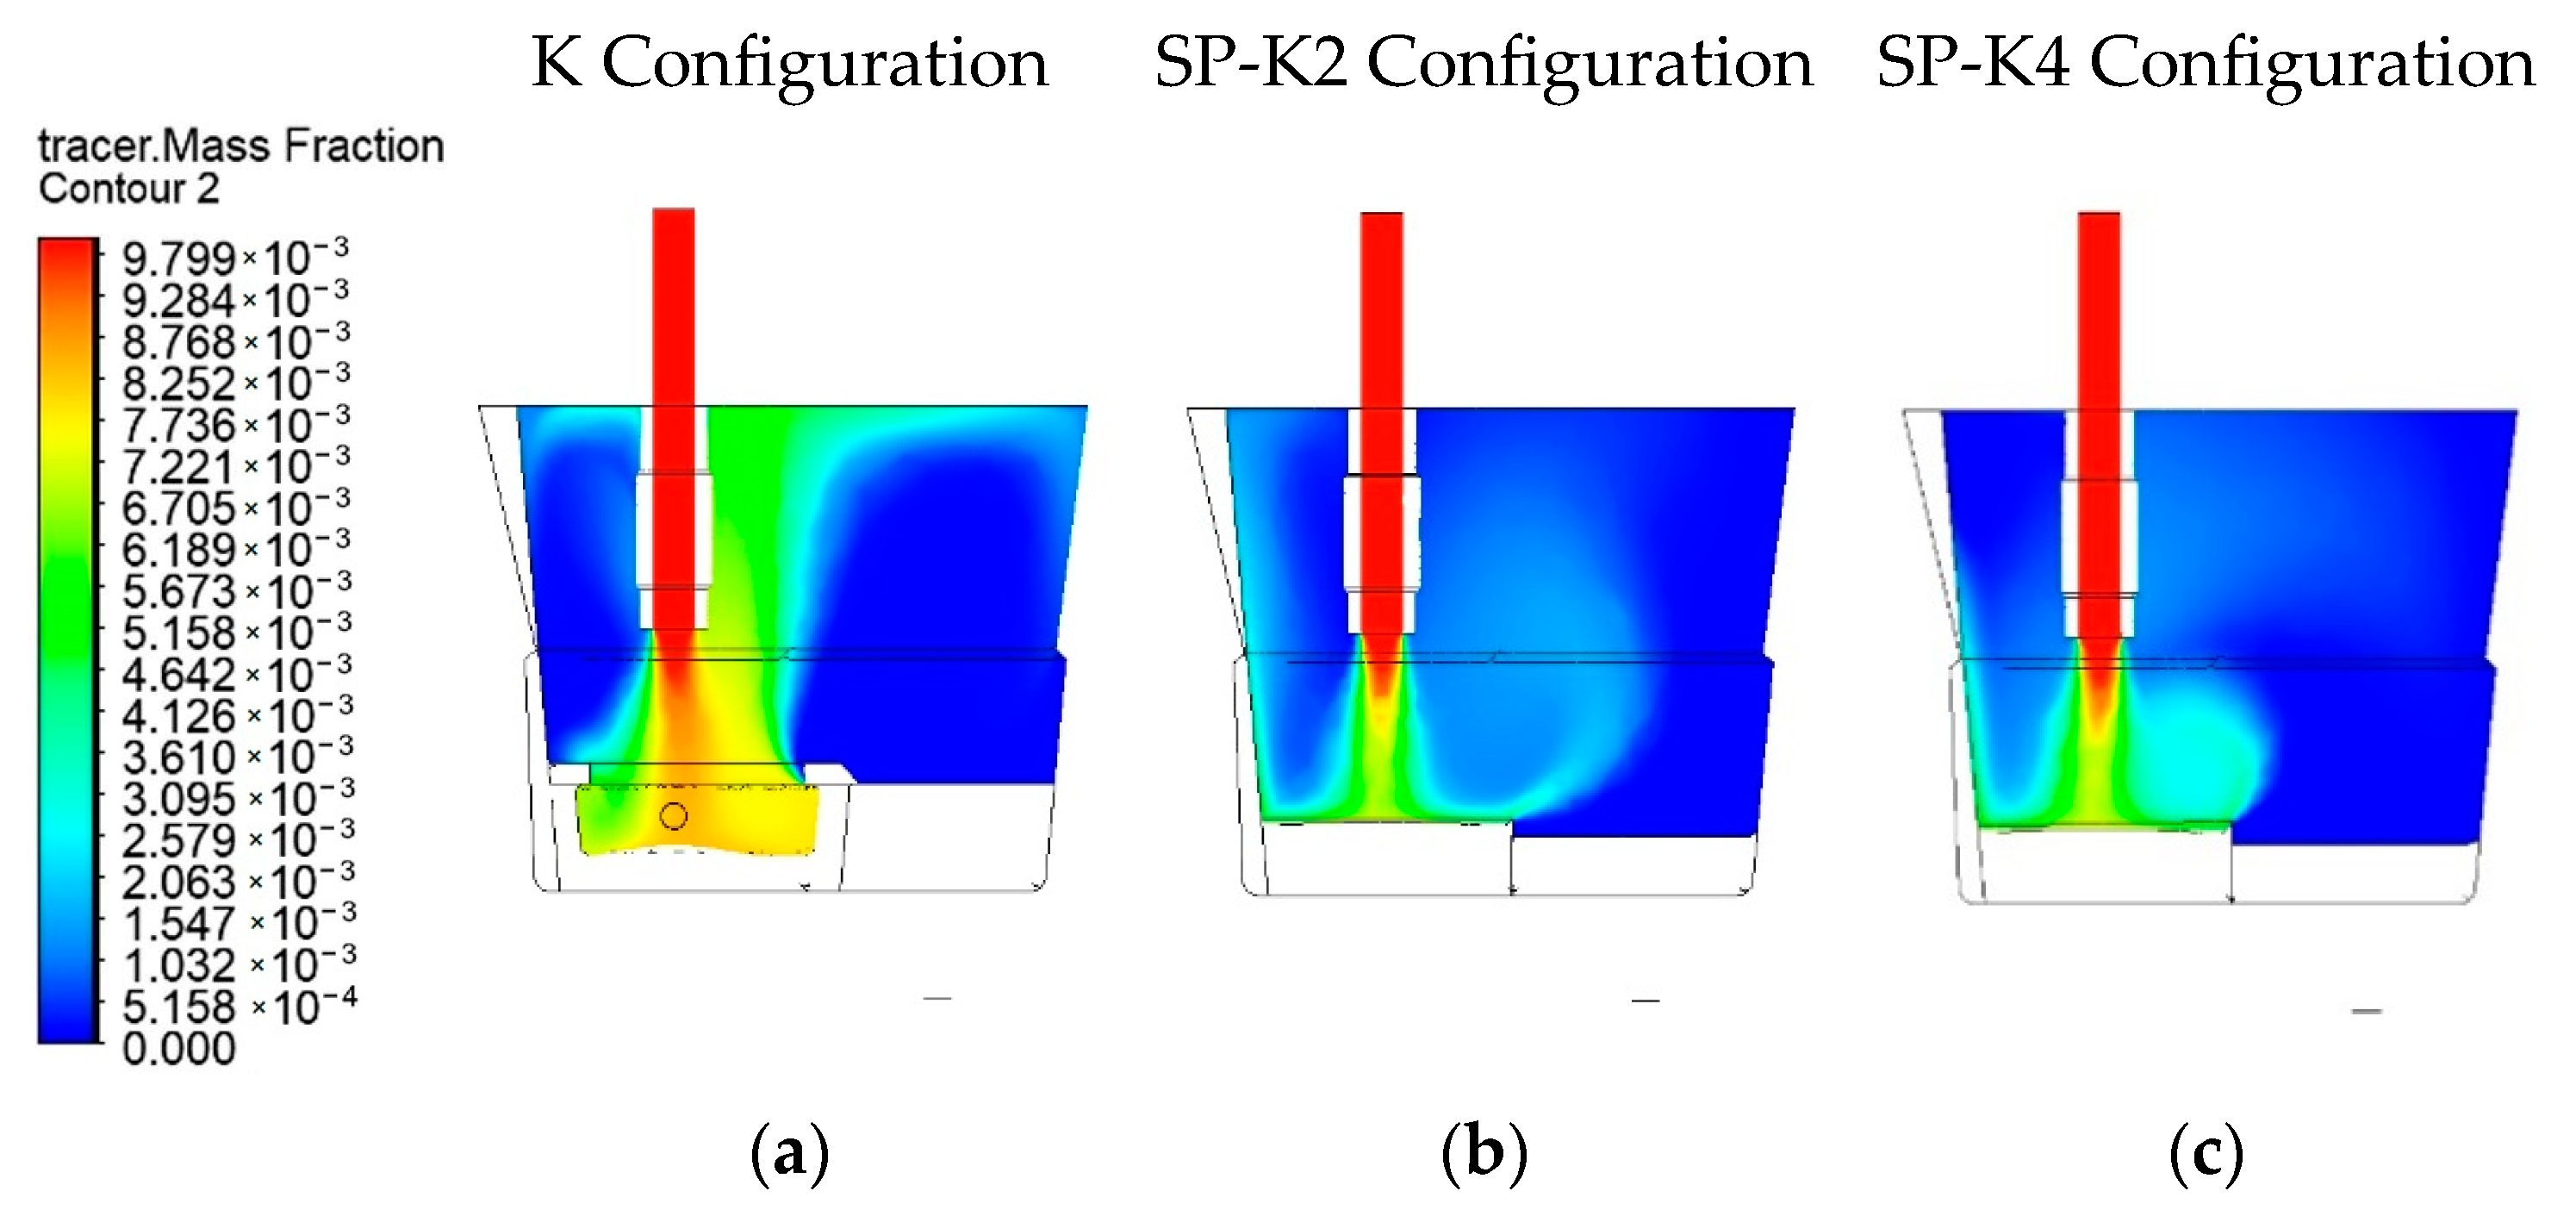
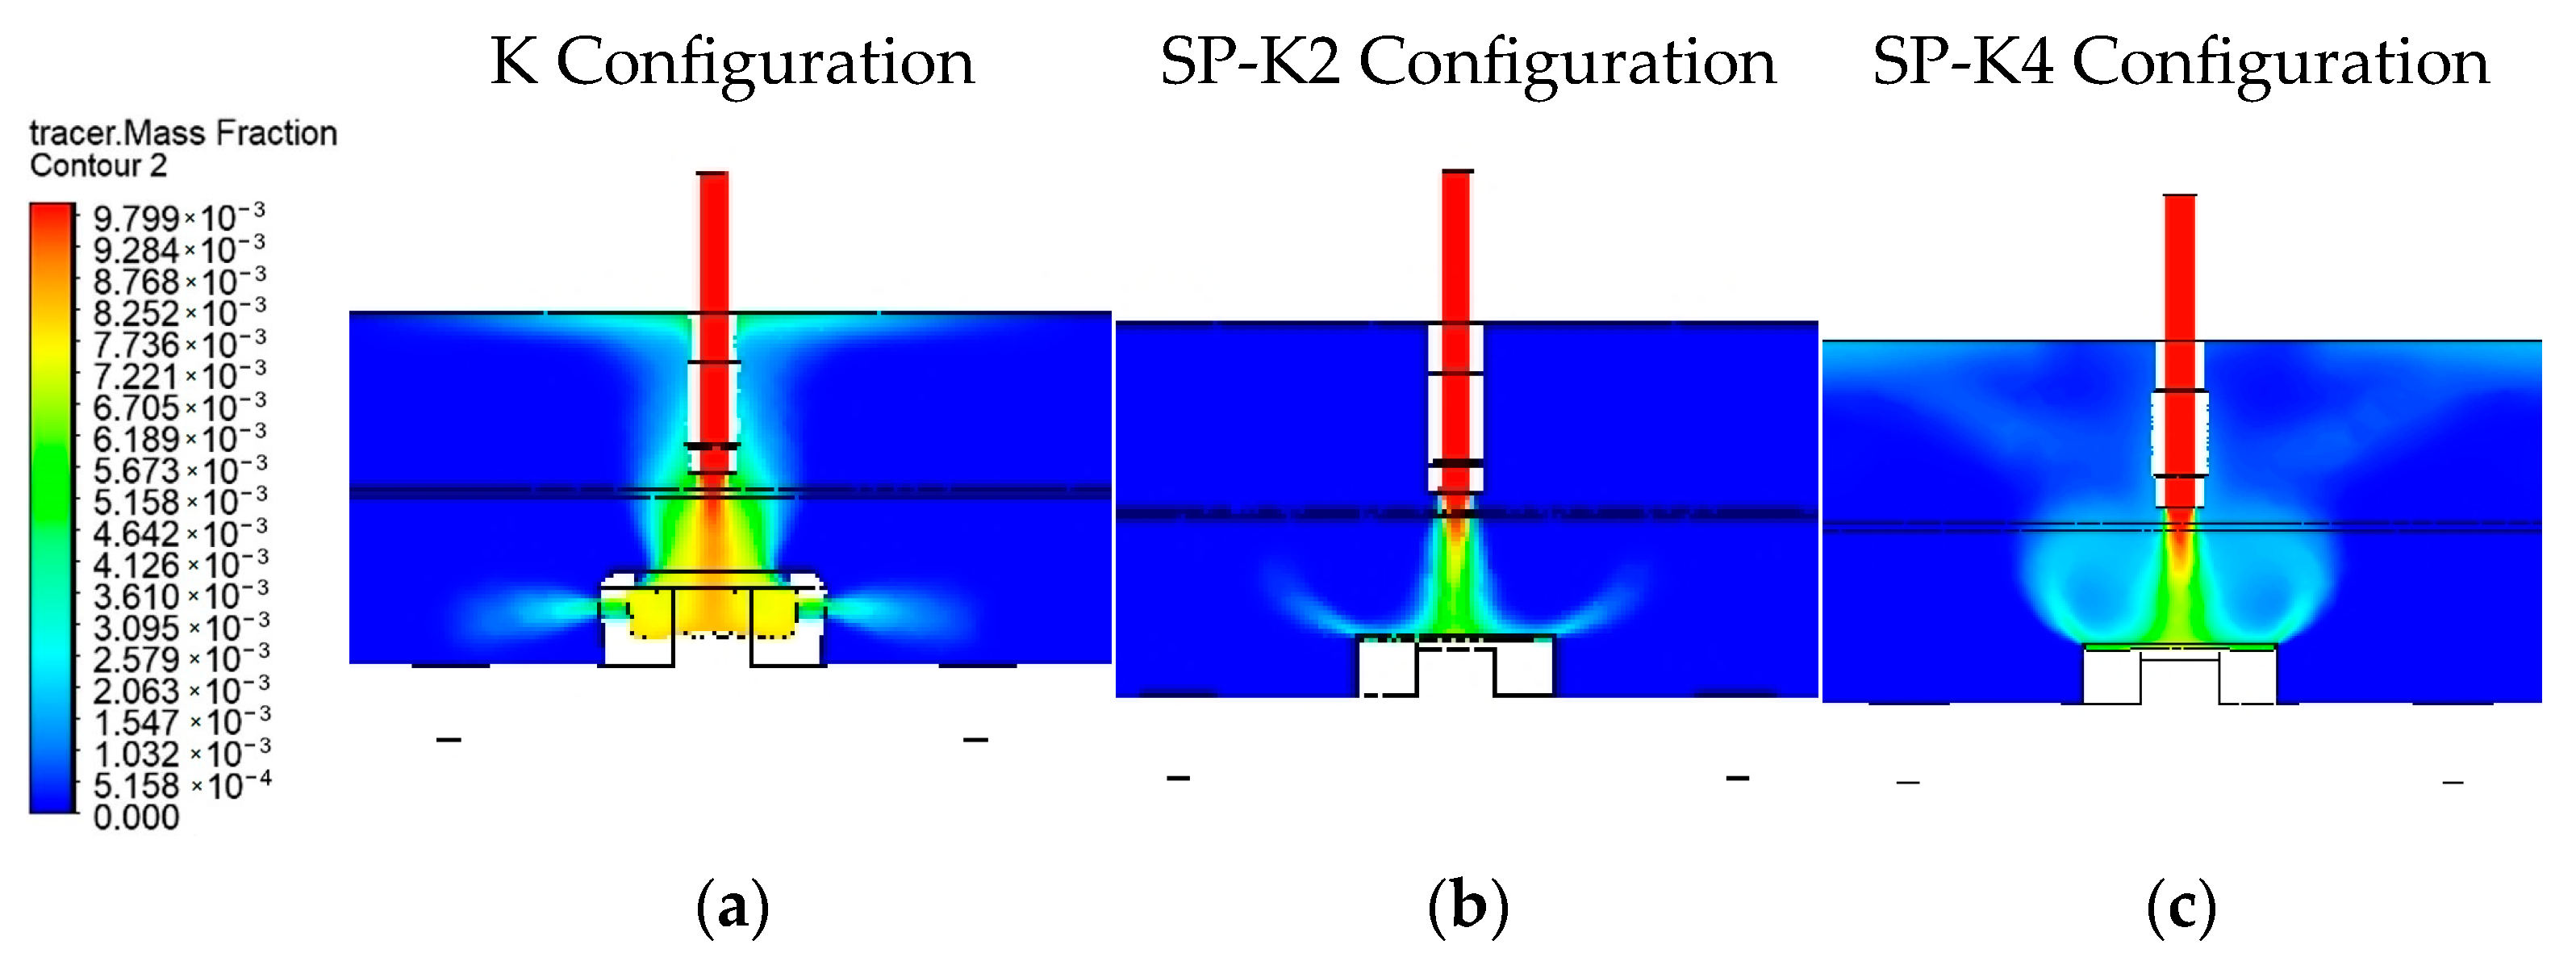
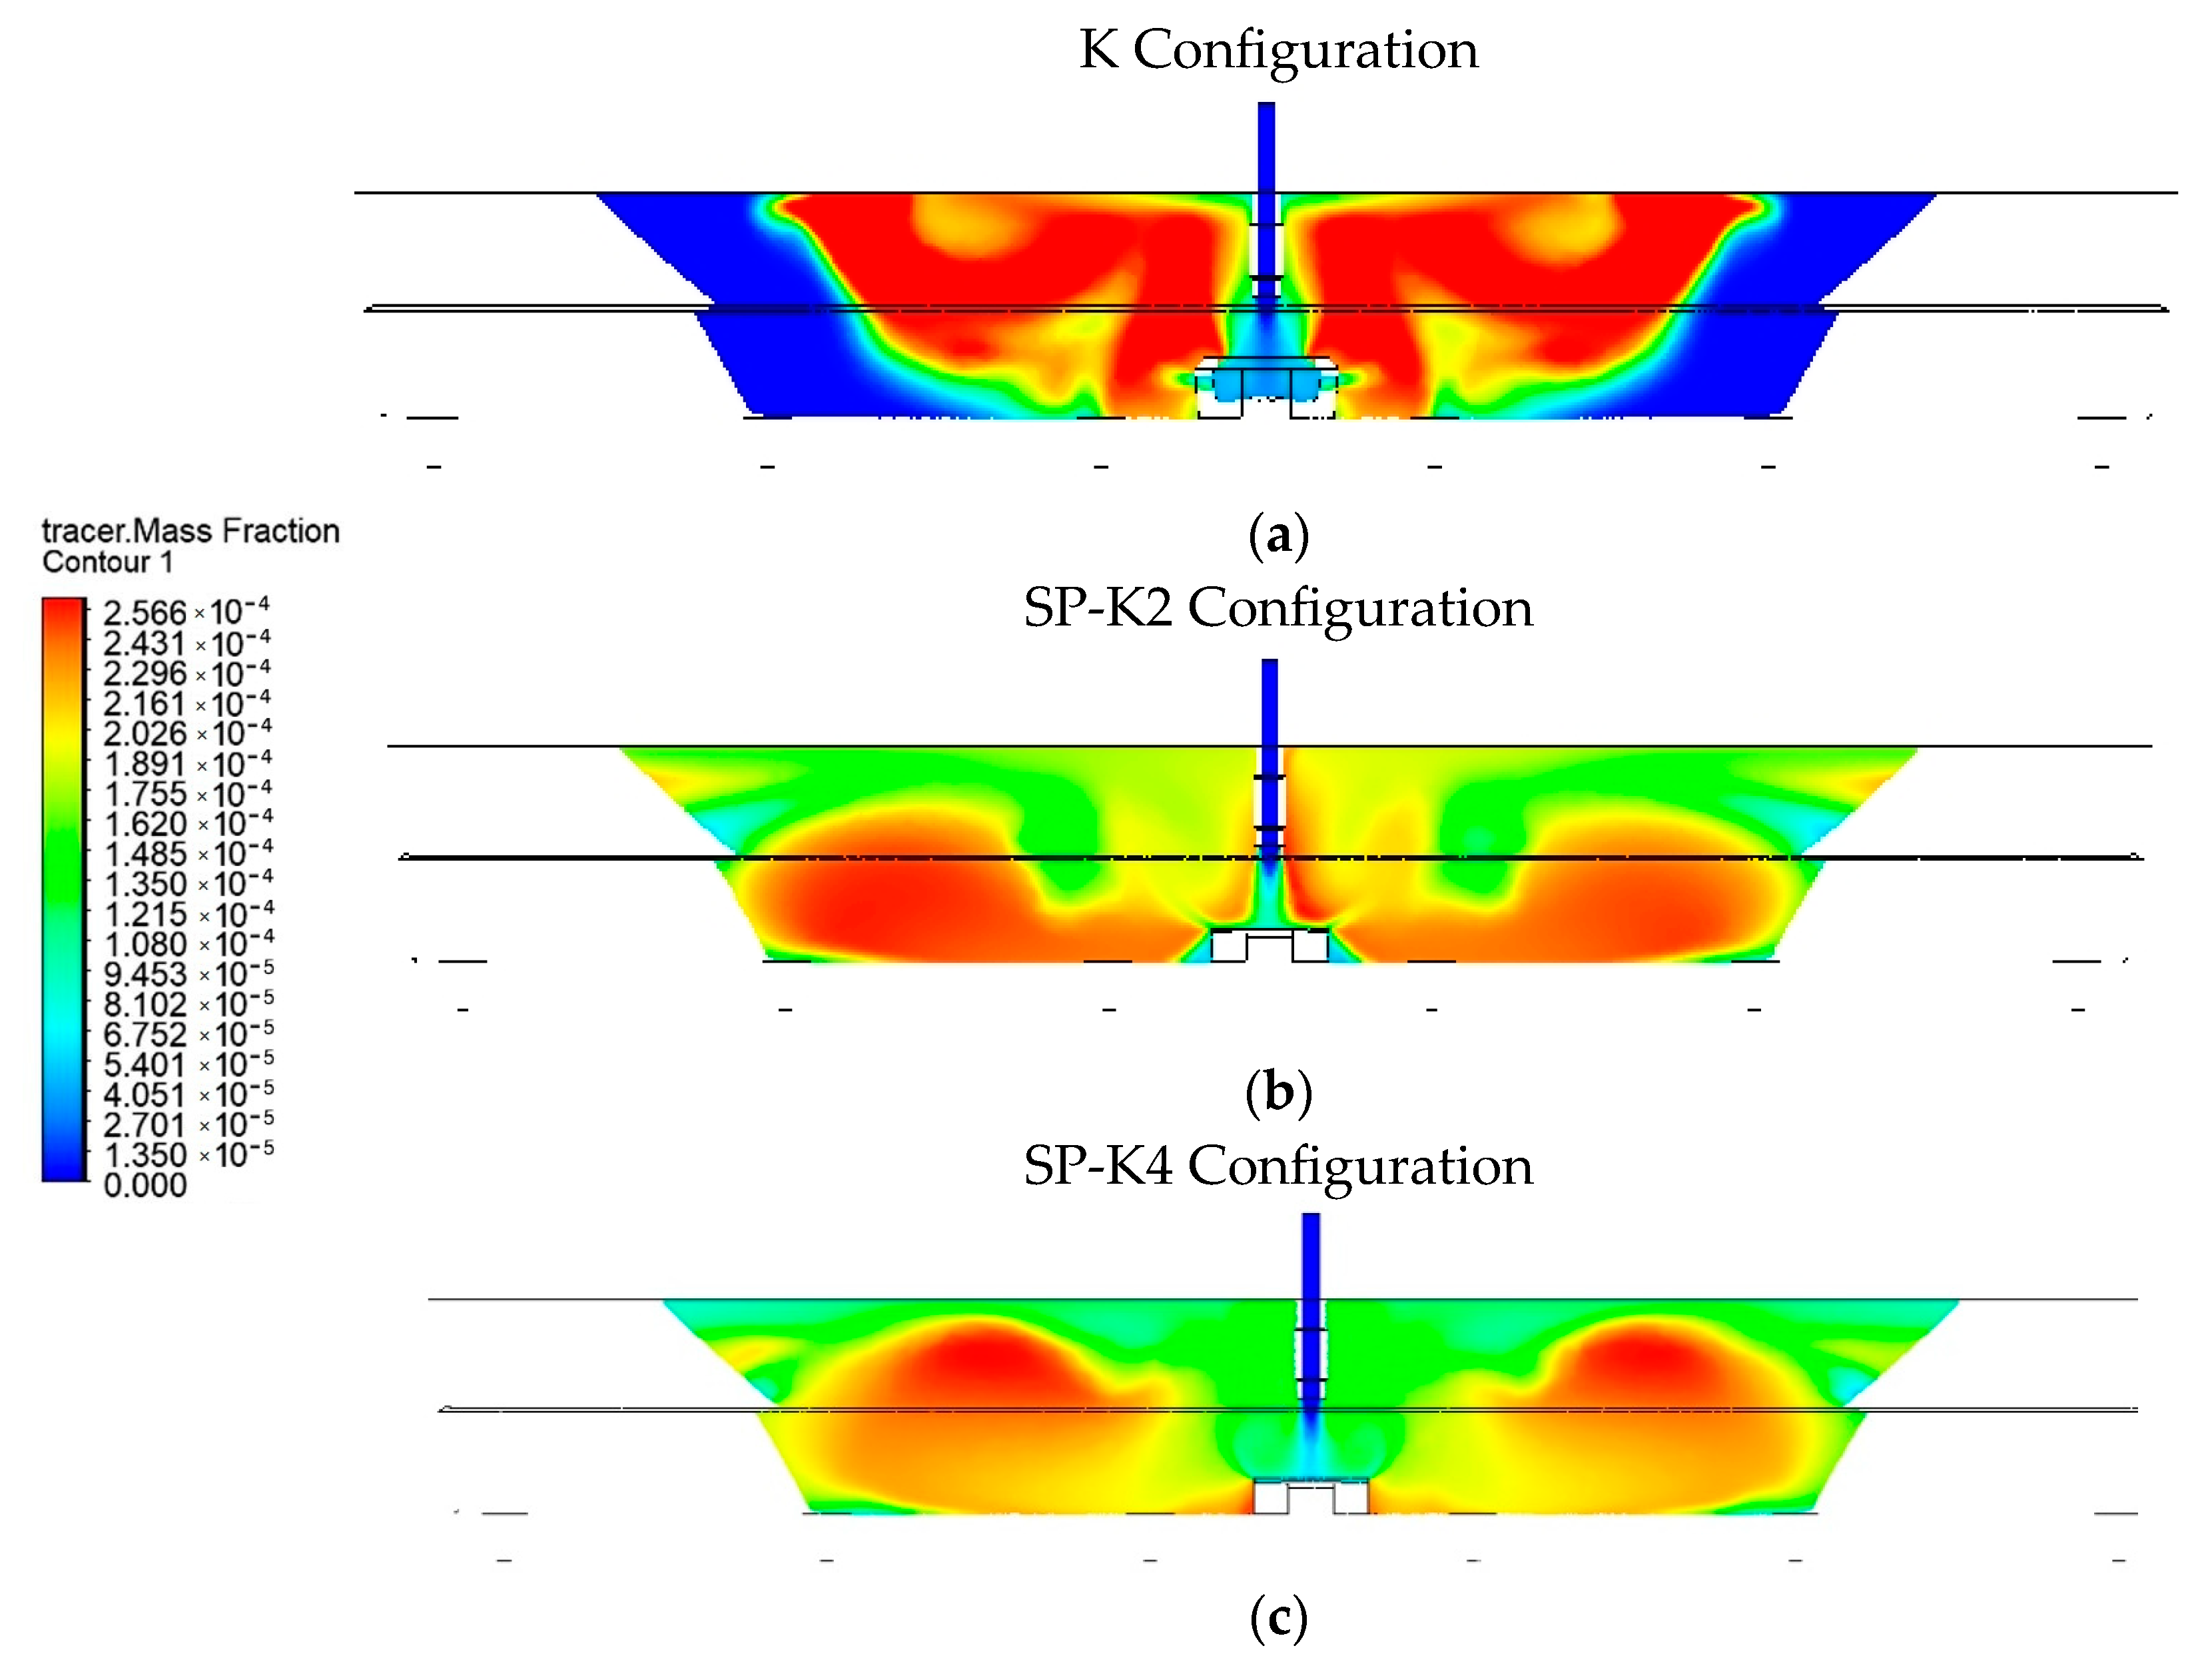
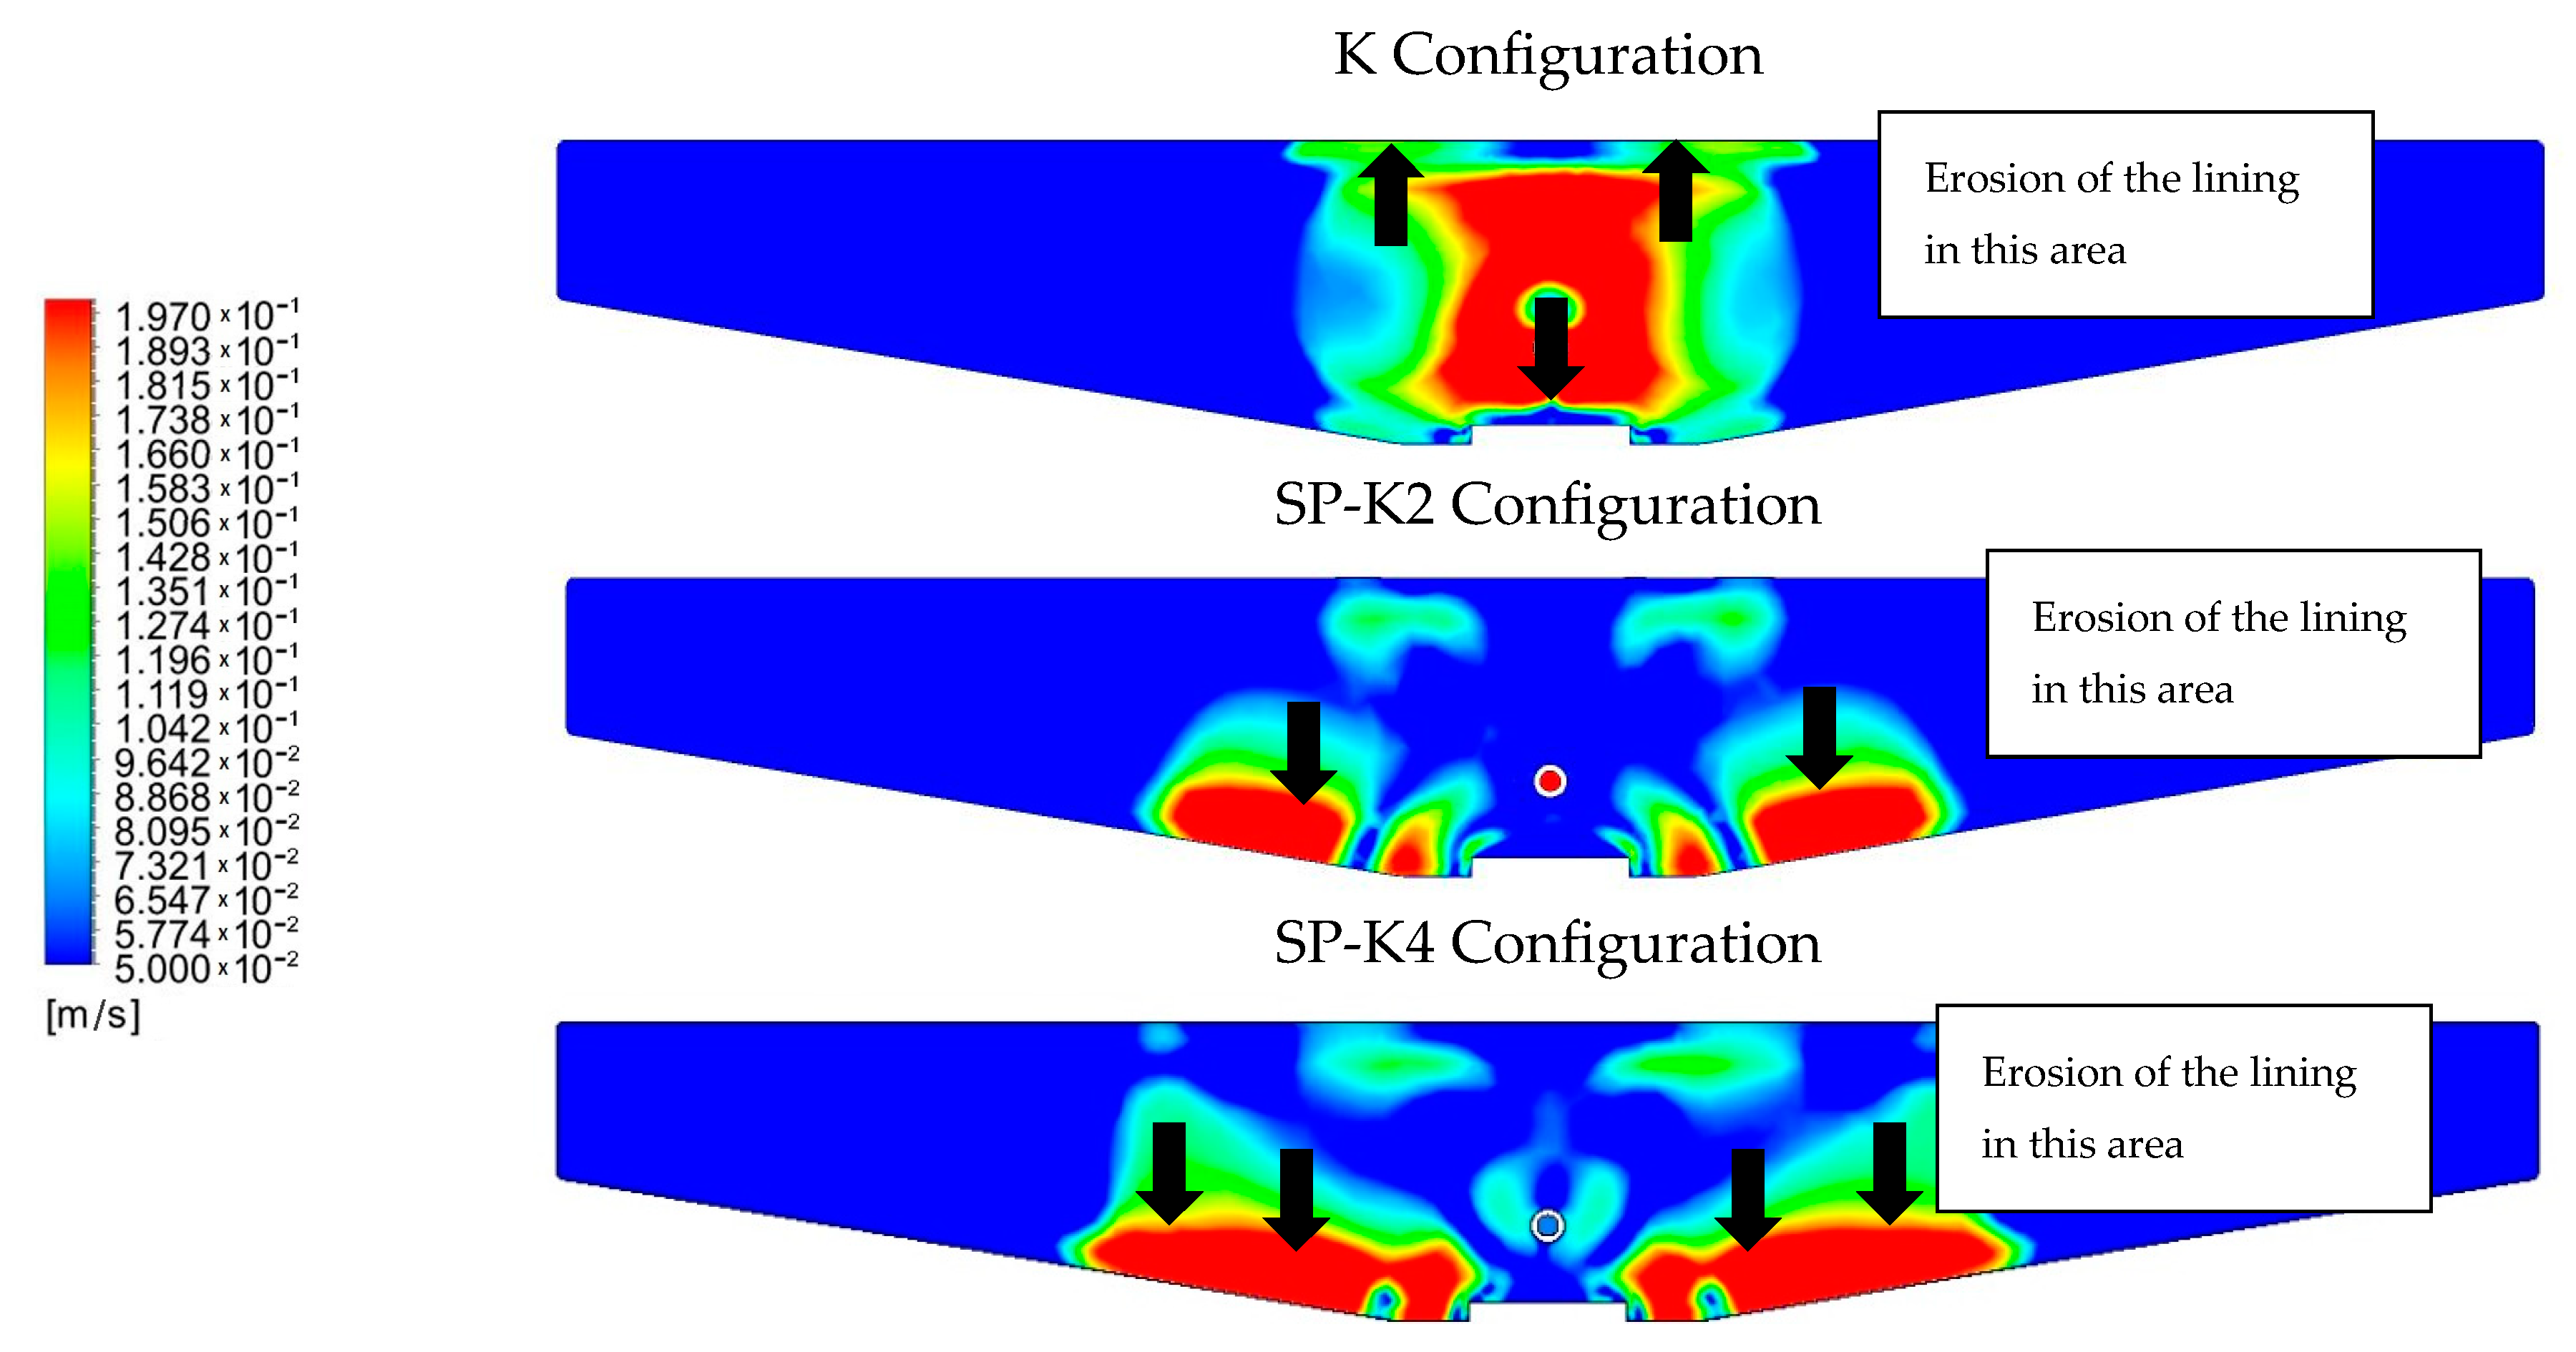
4.4. A Comparison of Contours Based on Flow Velocity
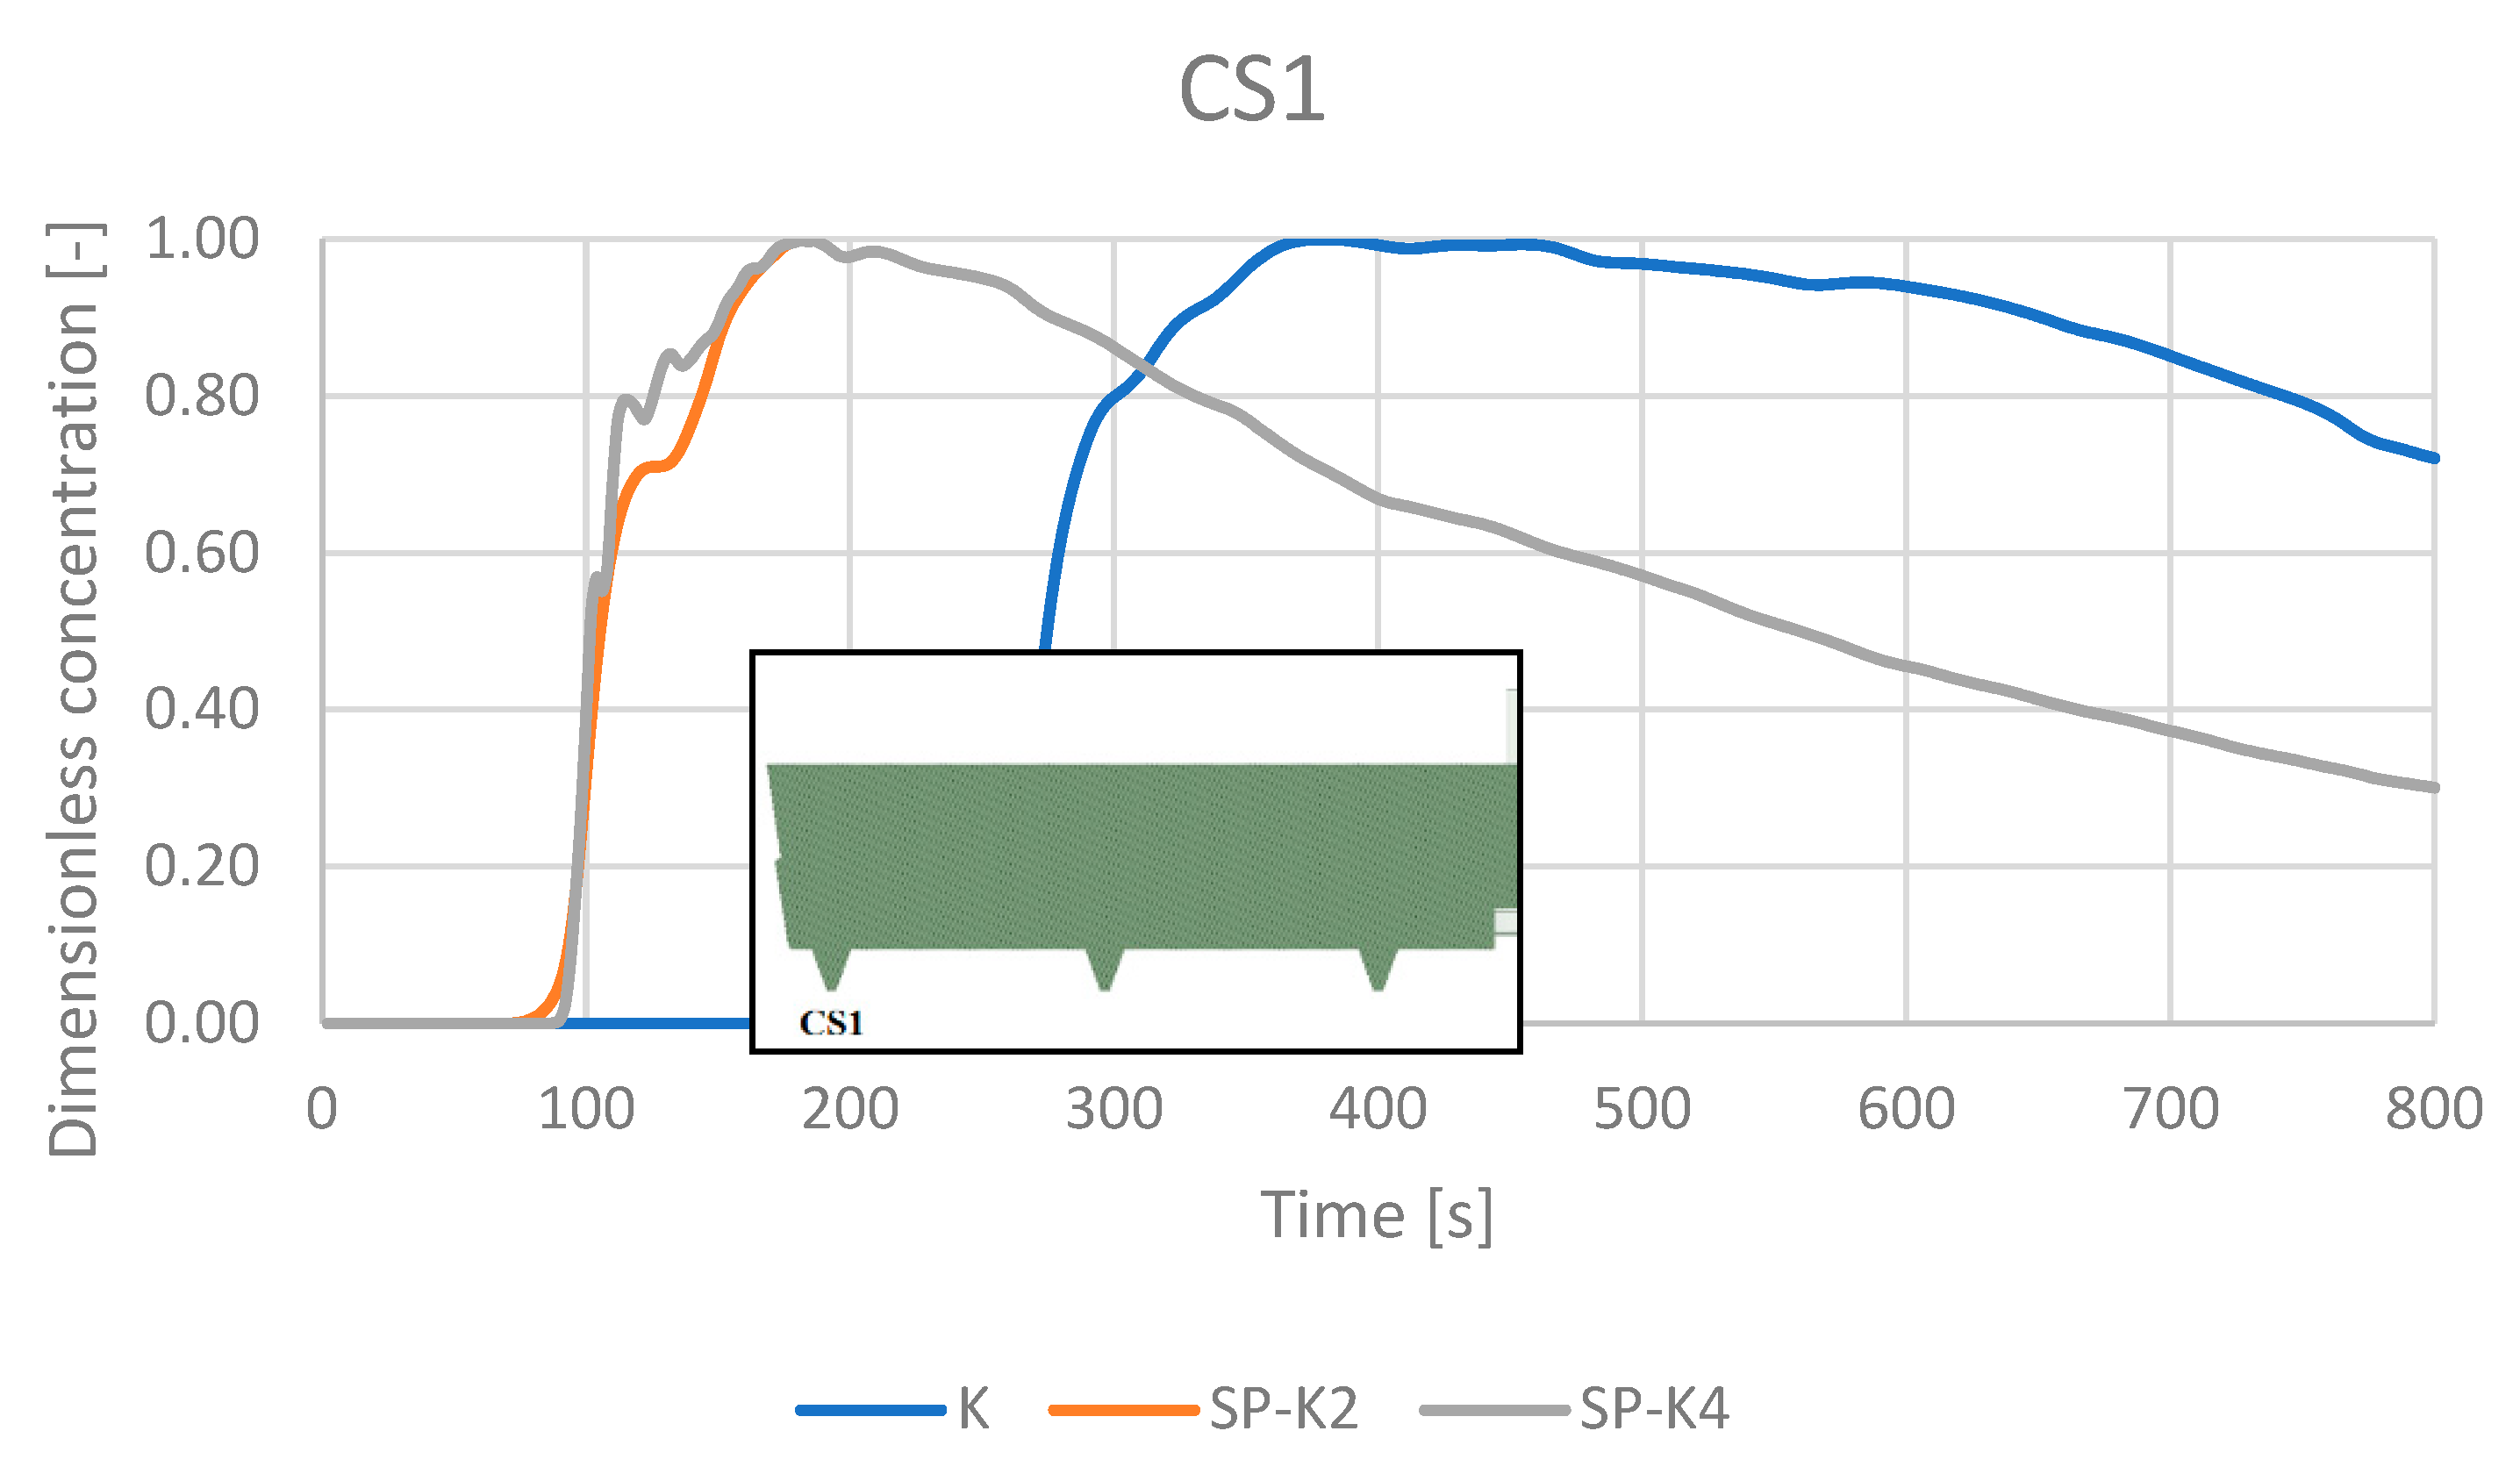
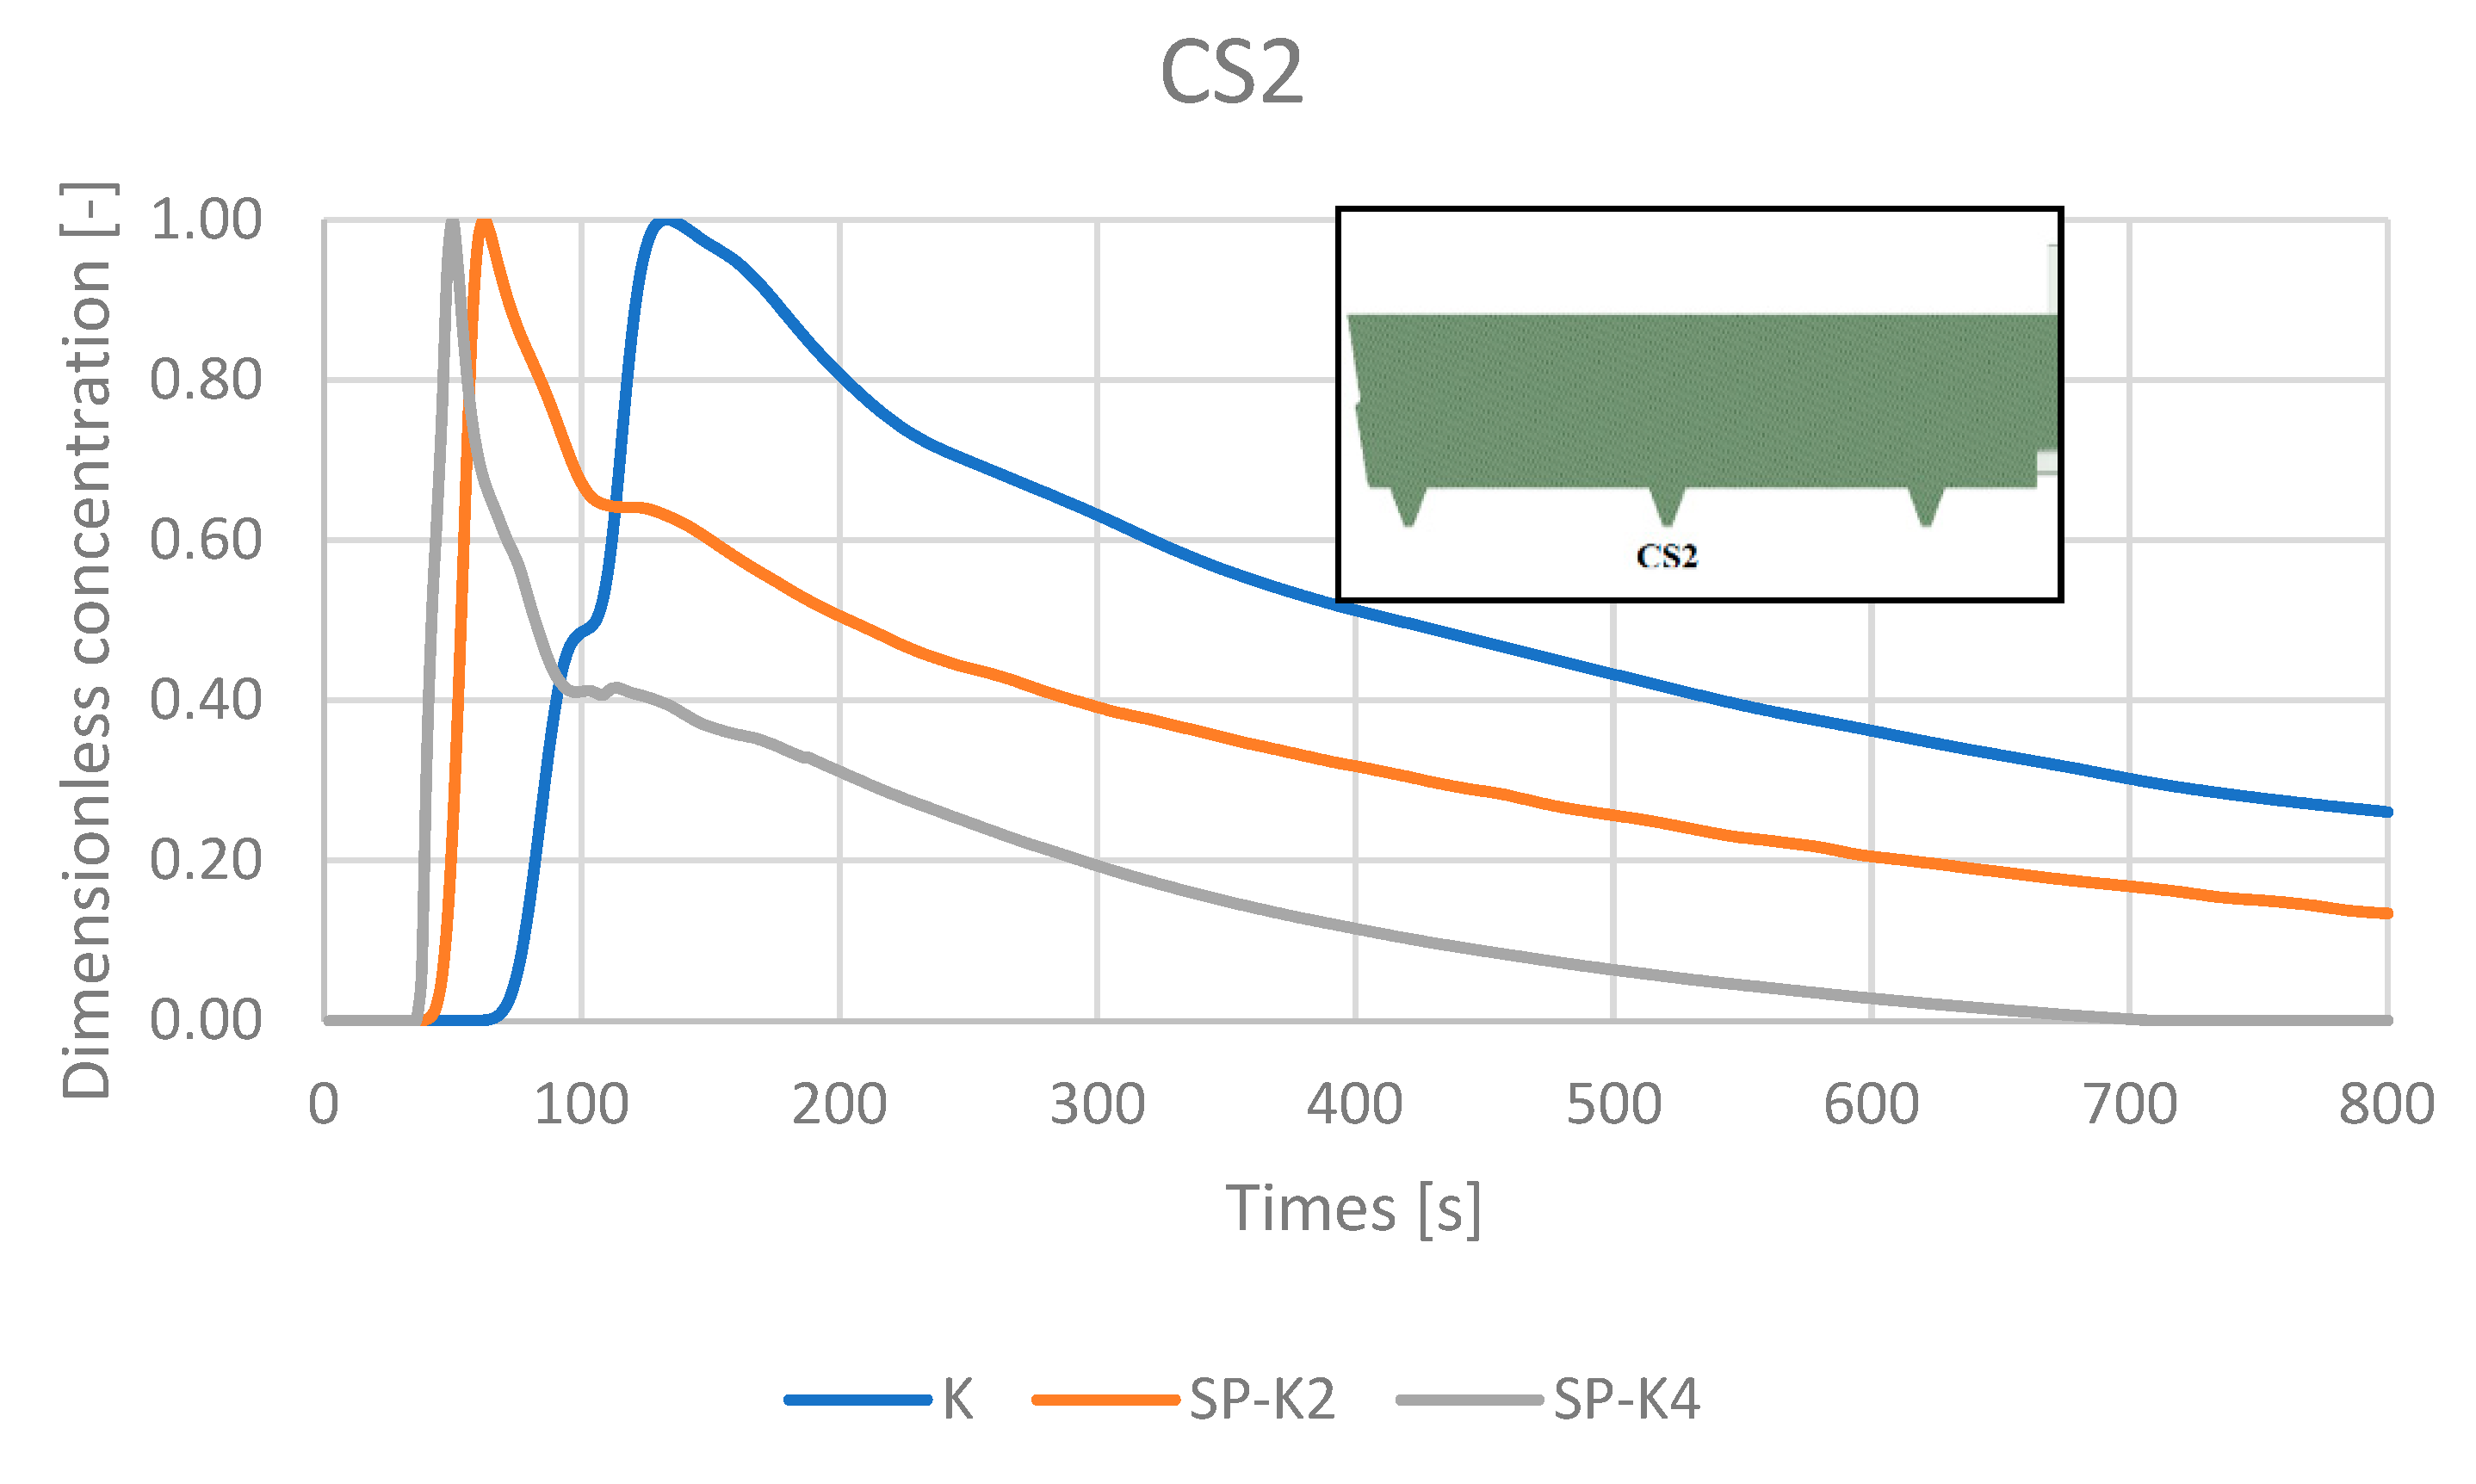
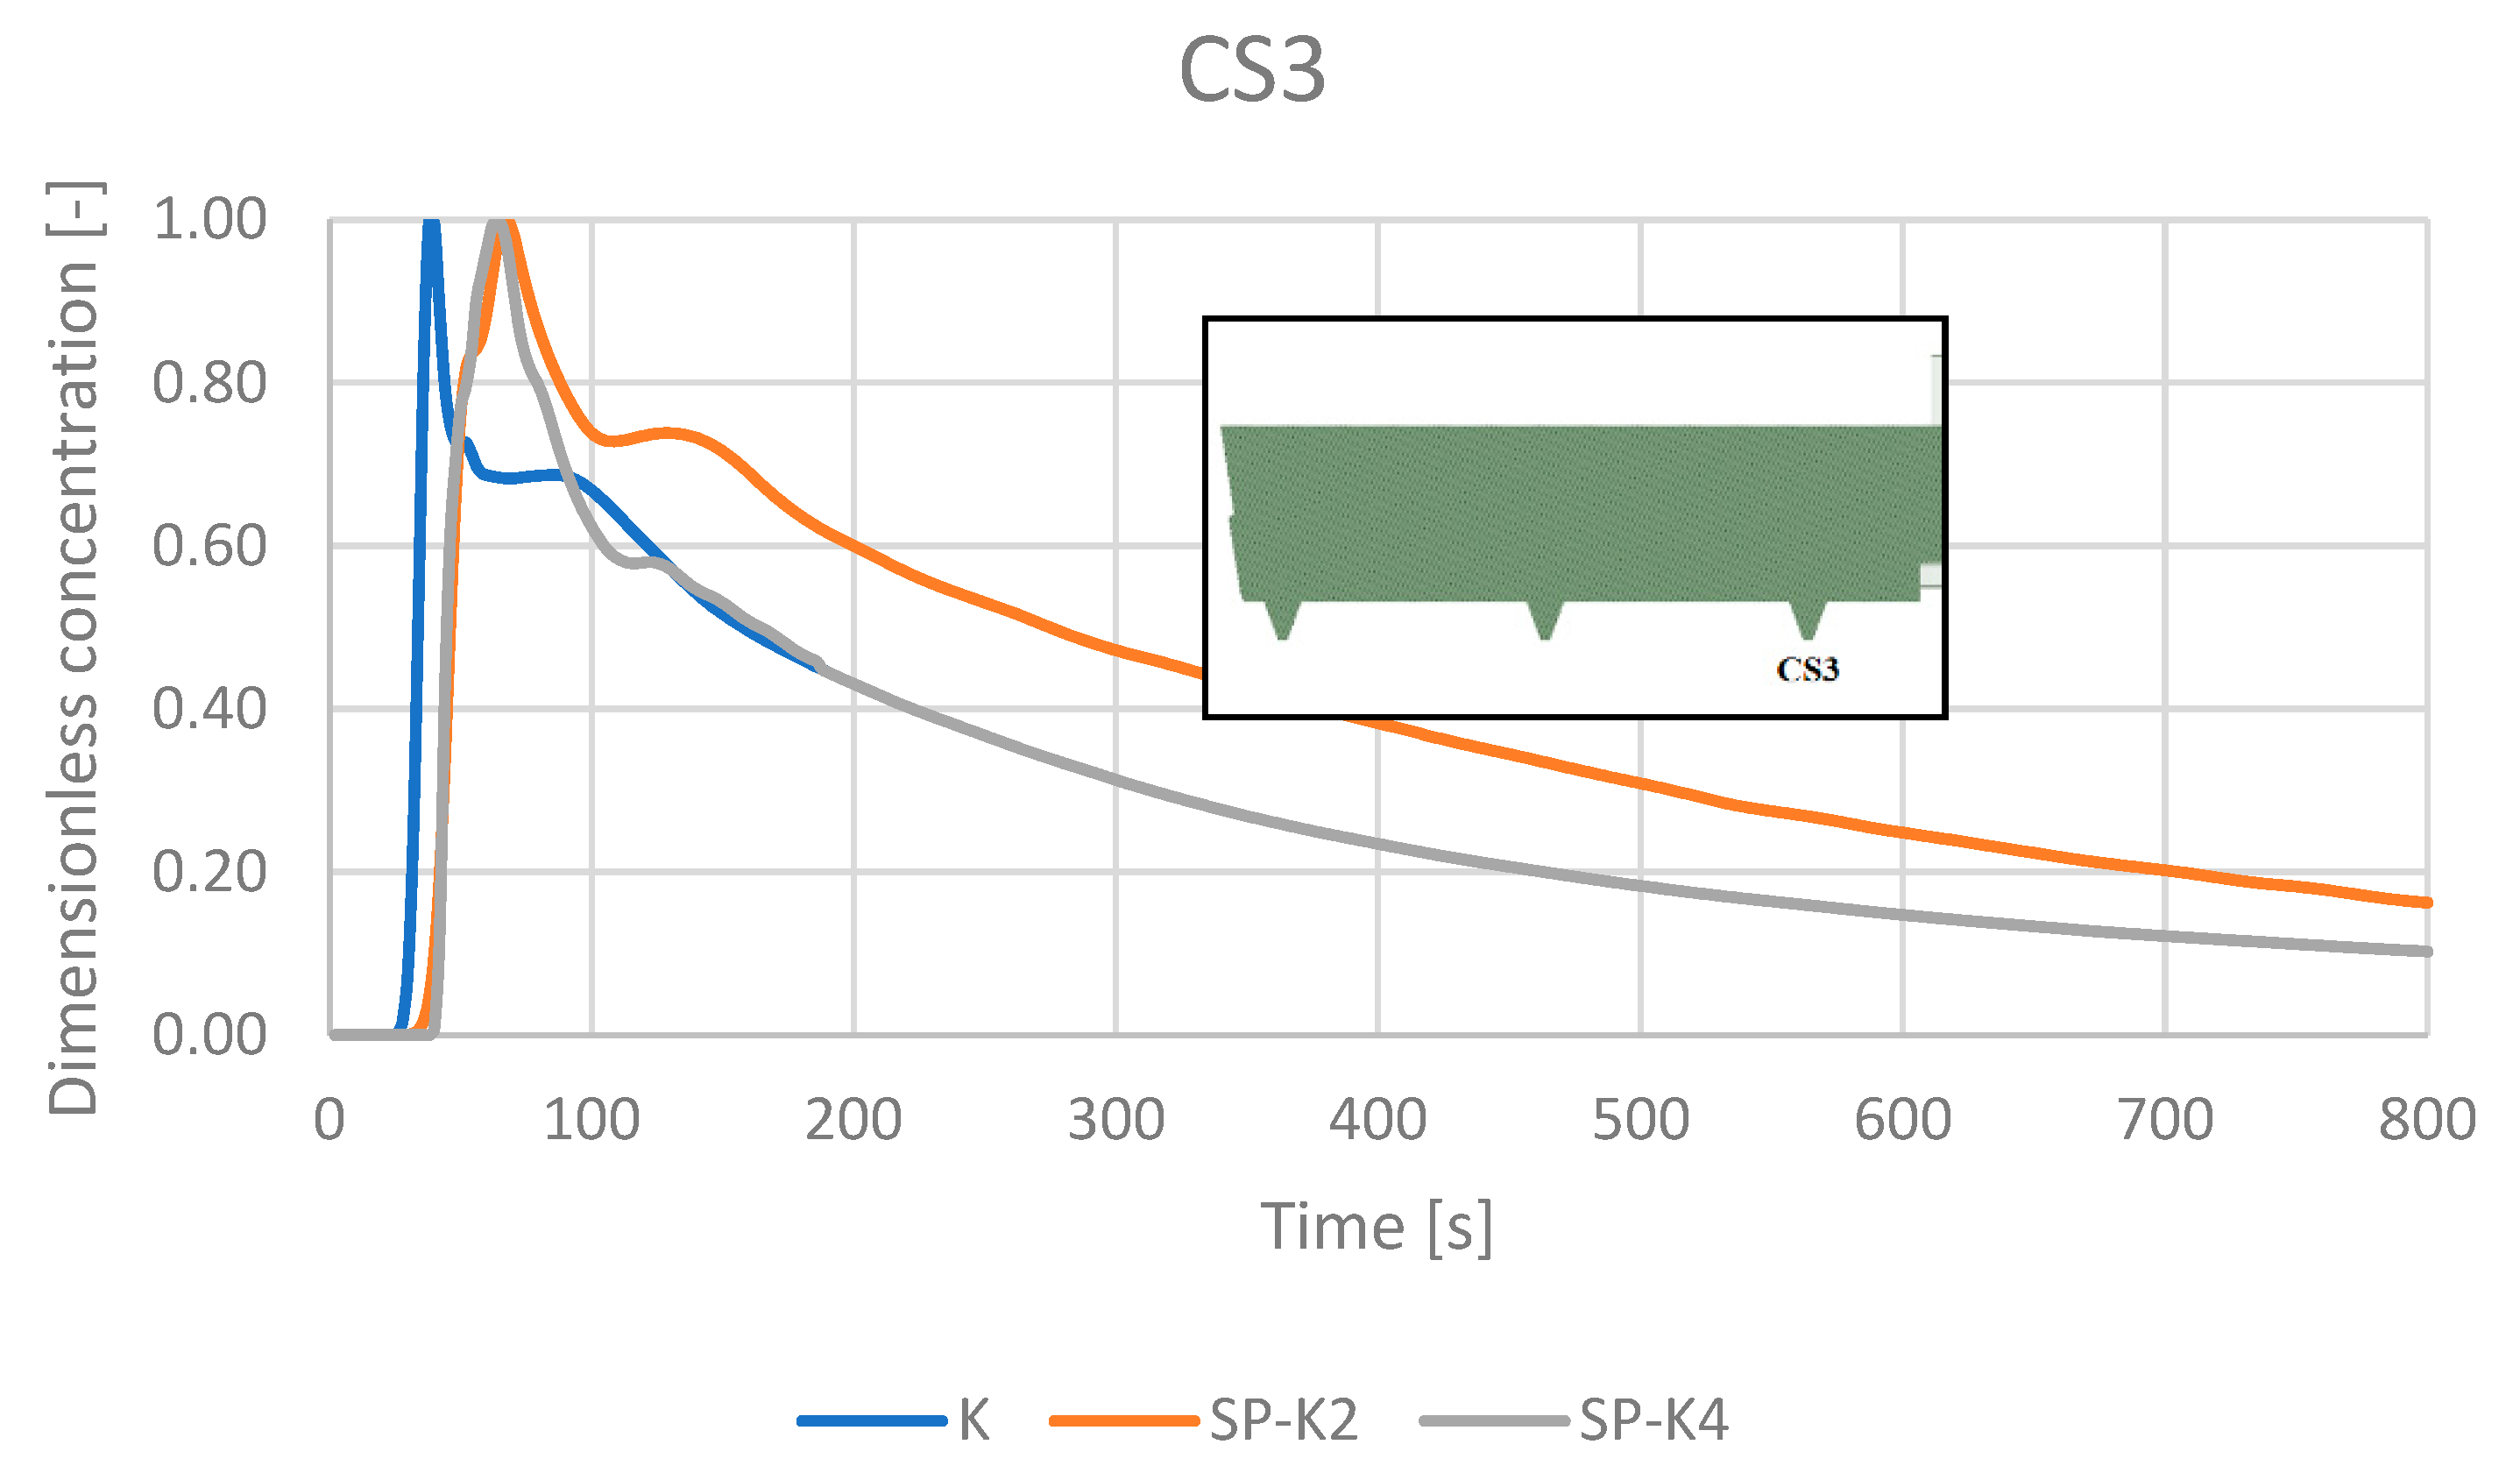
4.5. RTD Curves
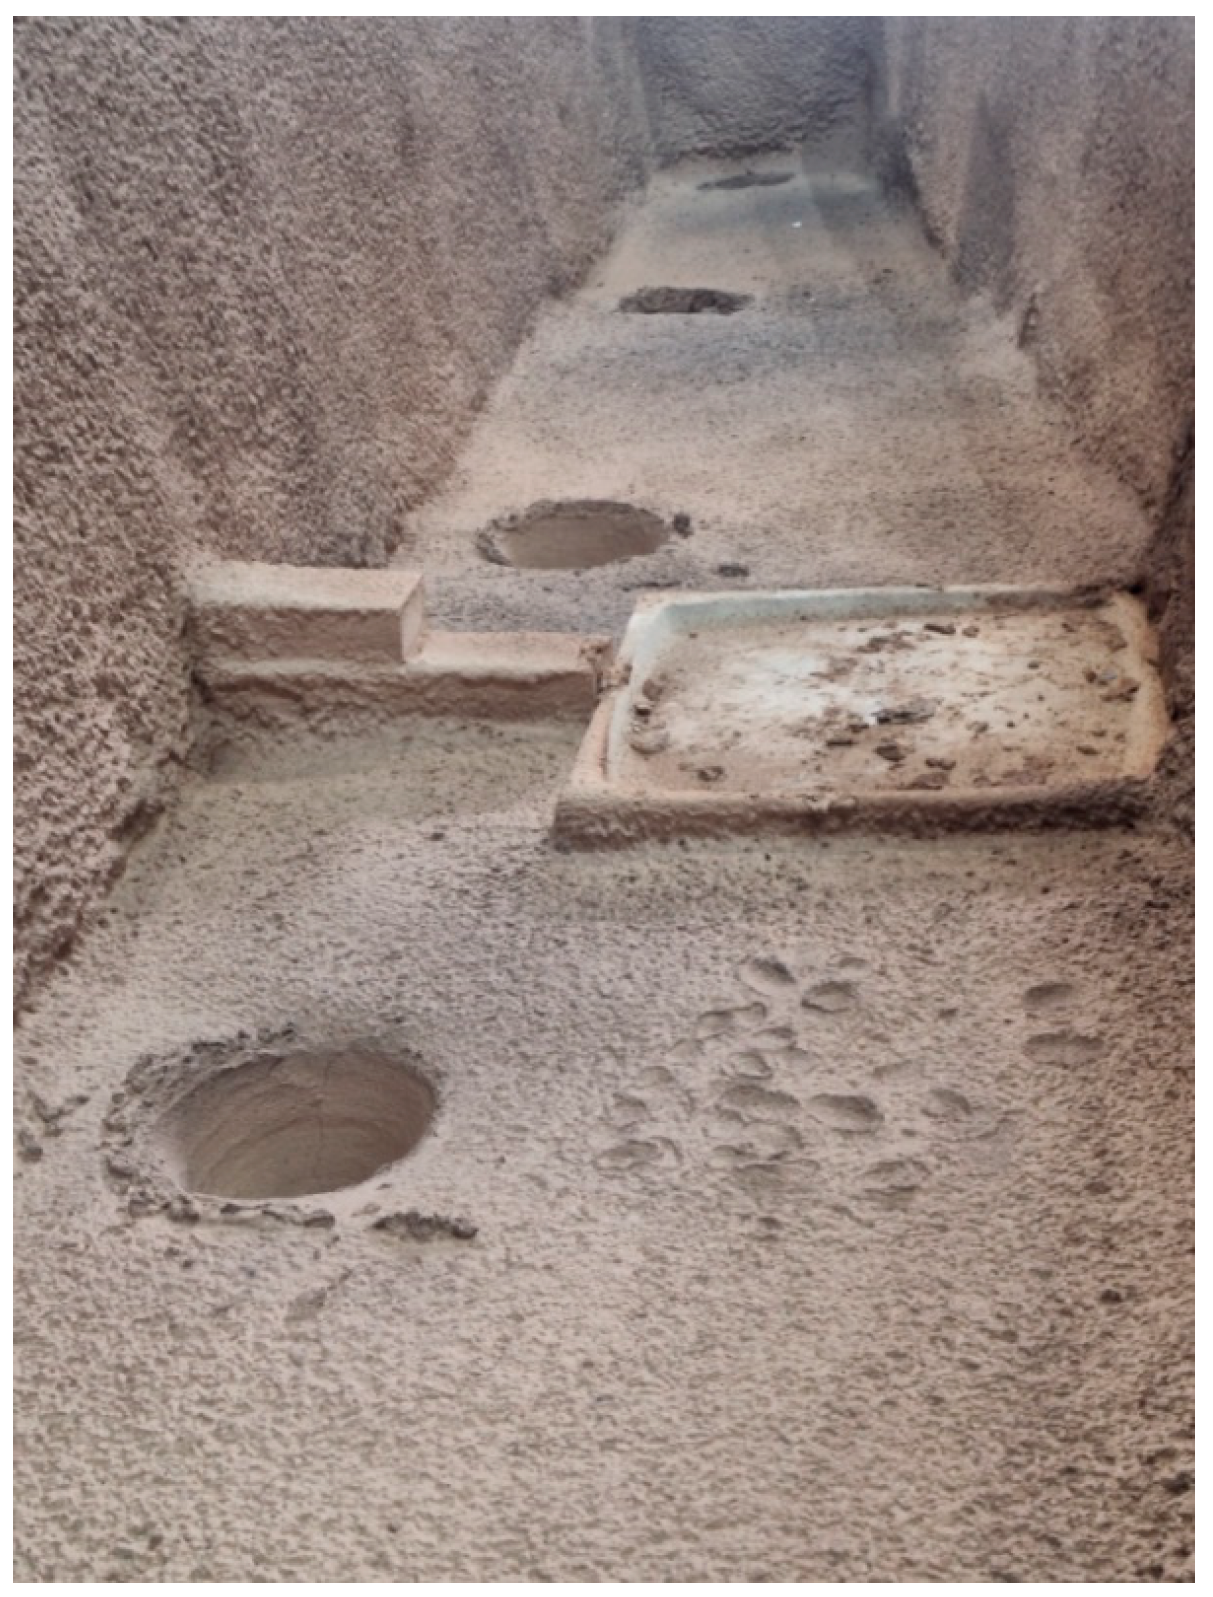
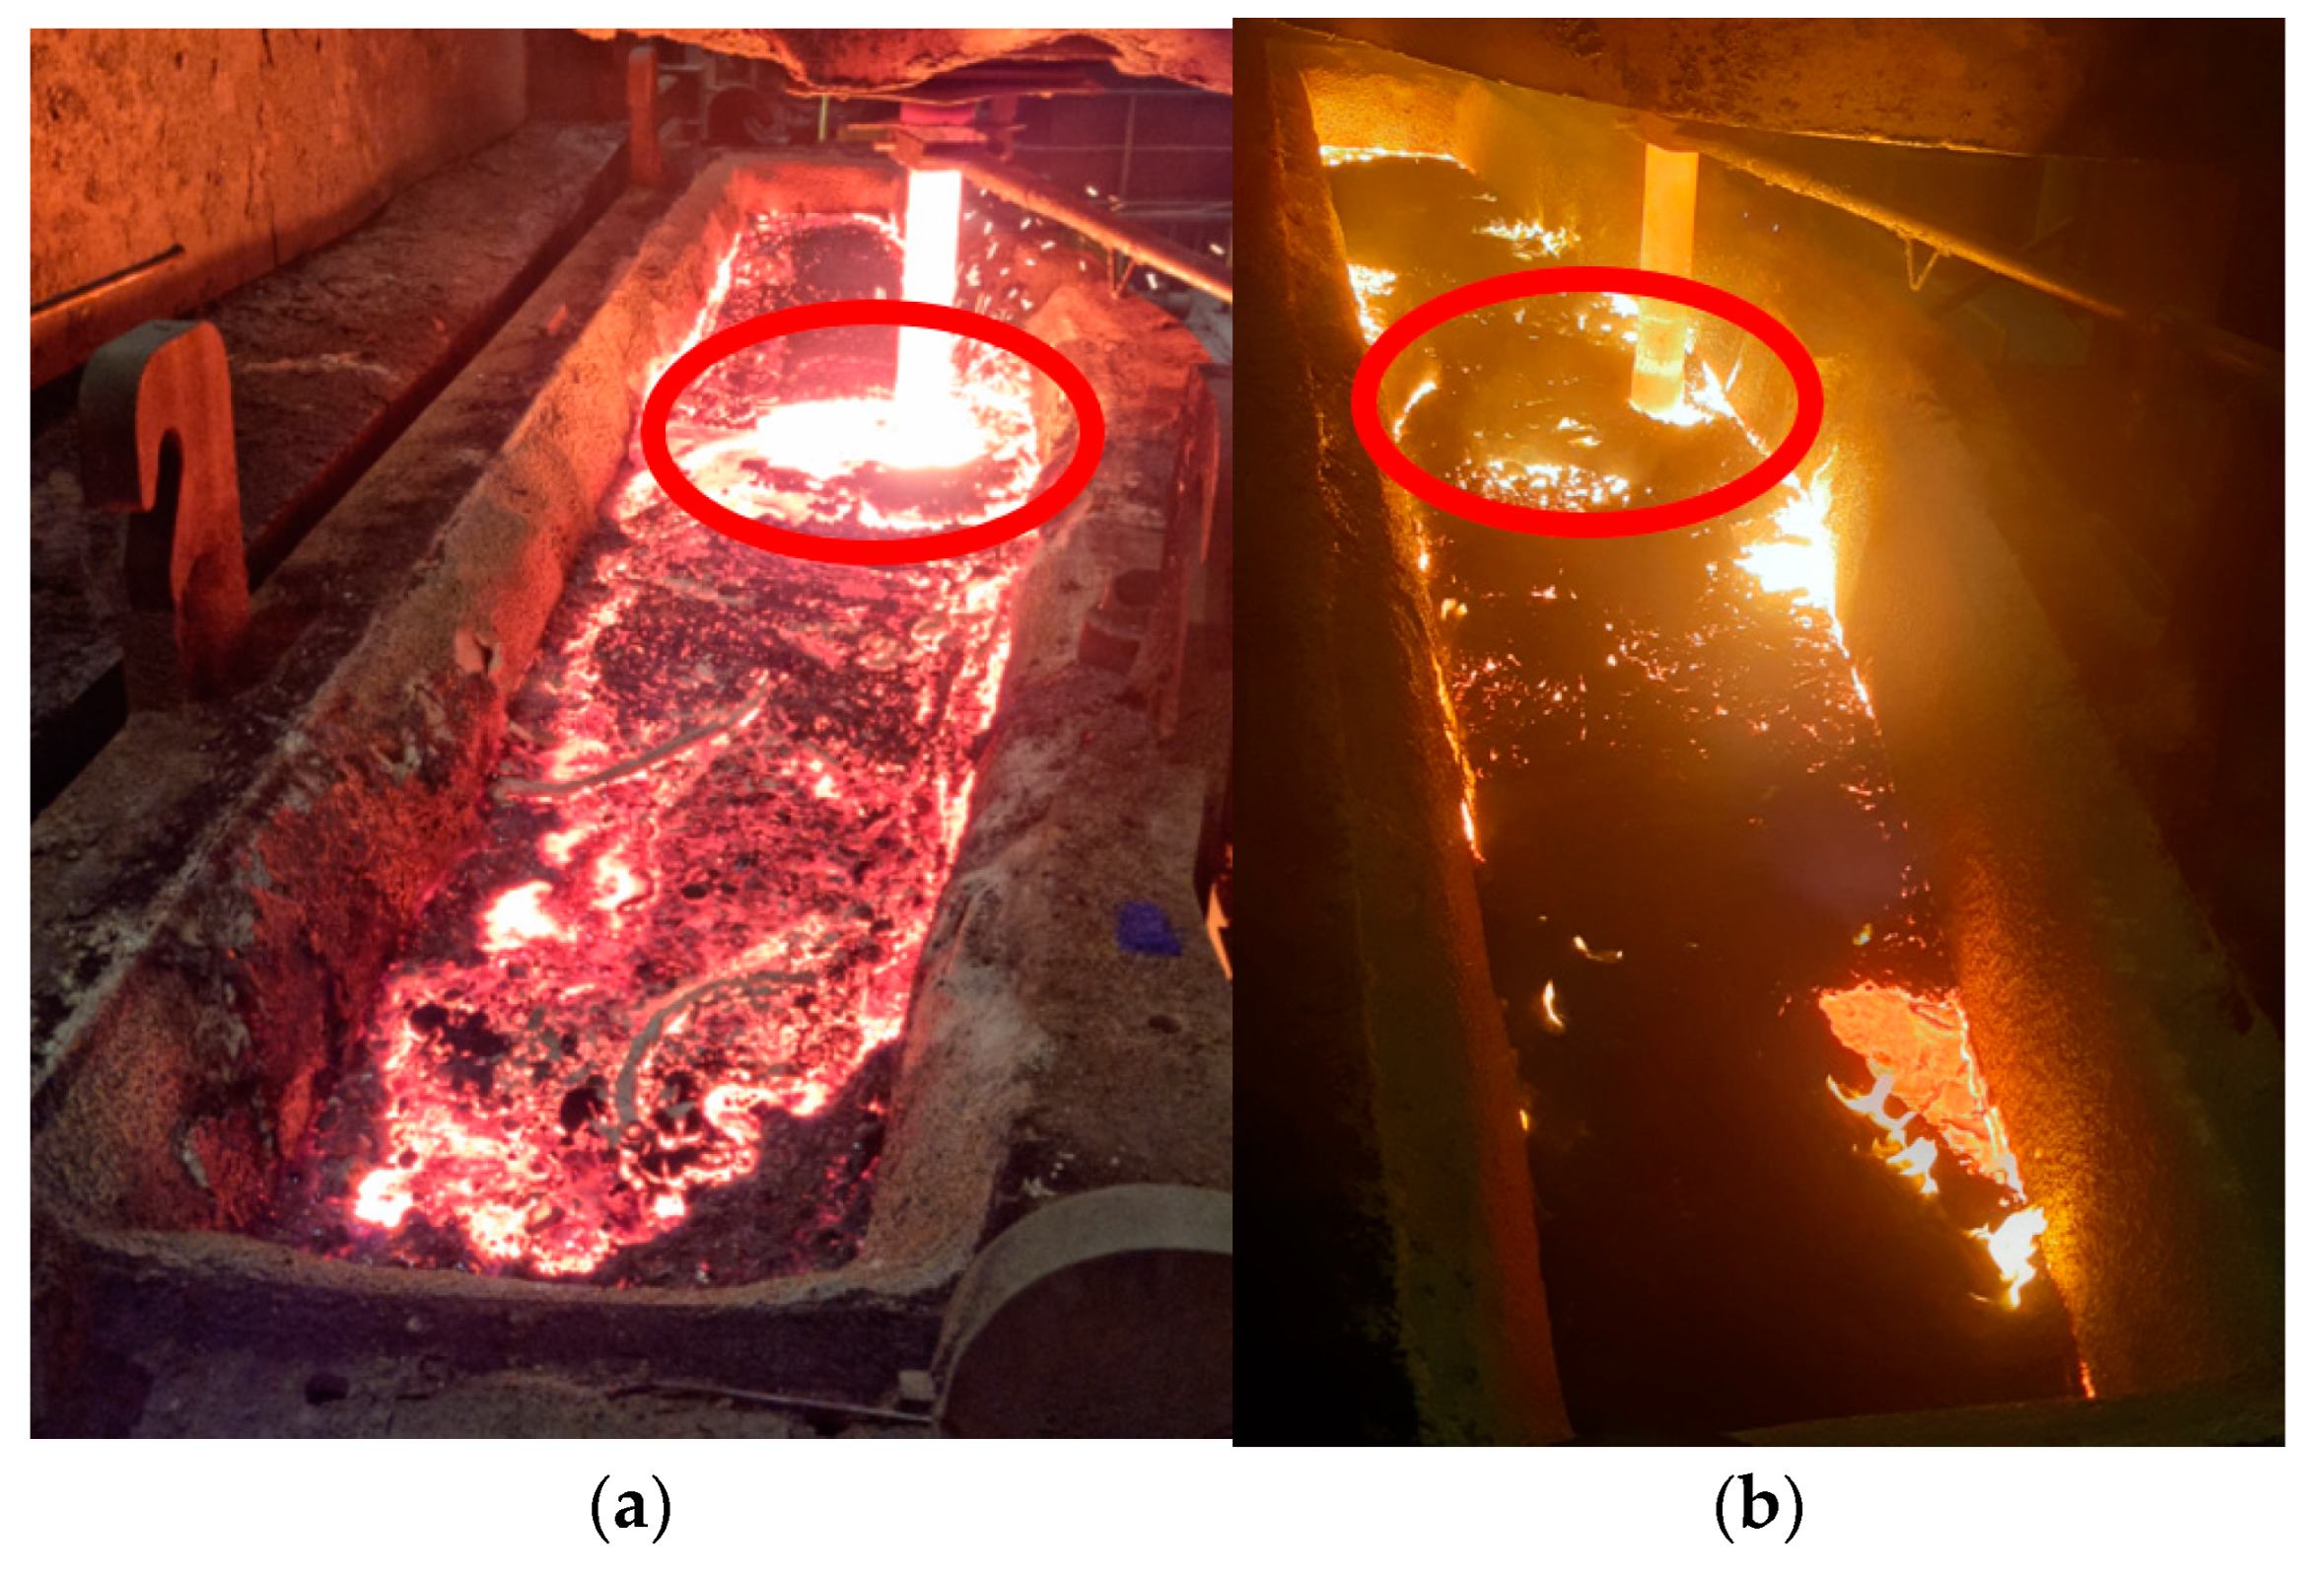
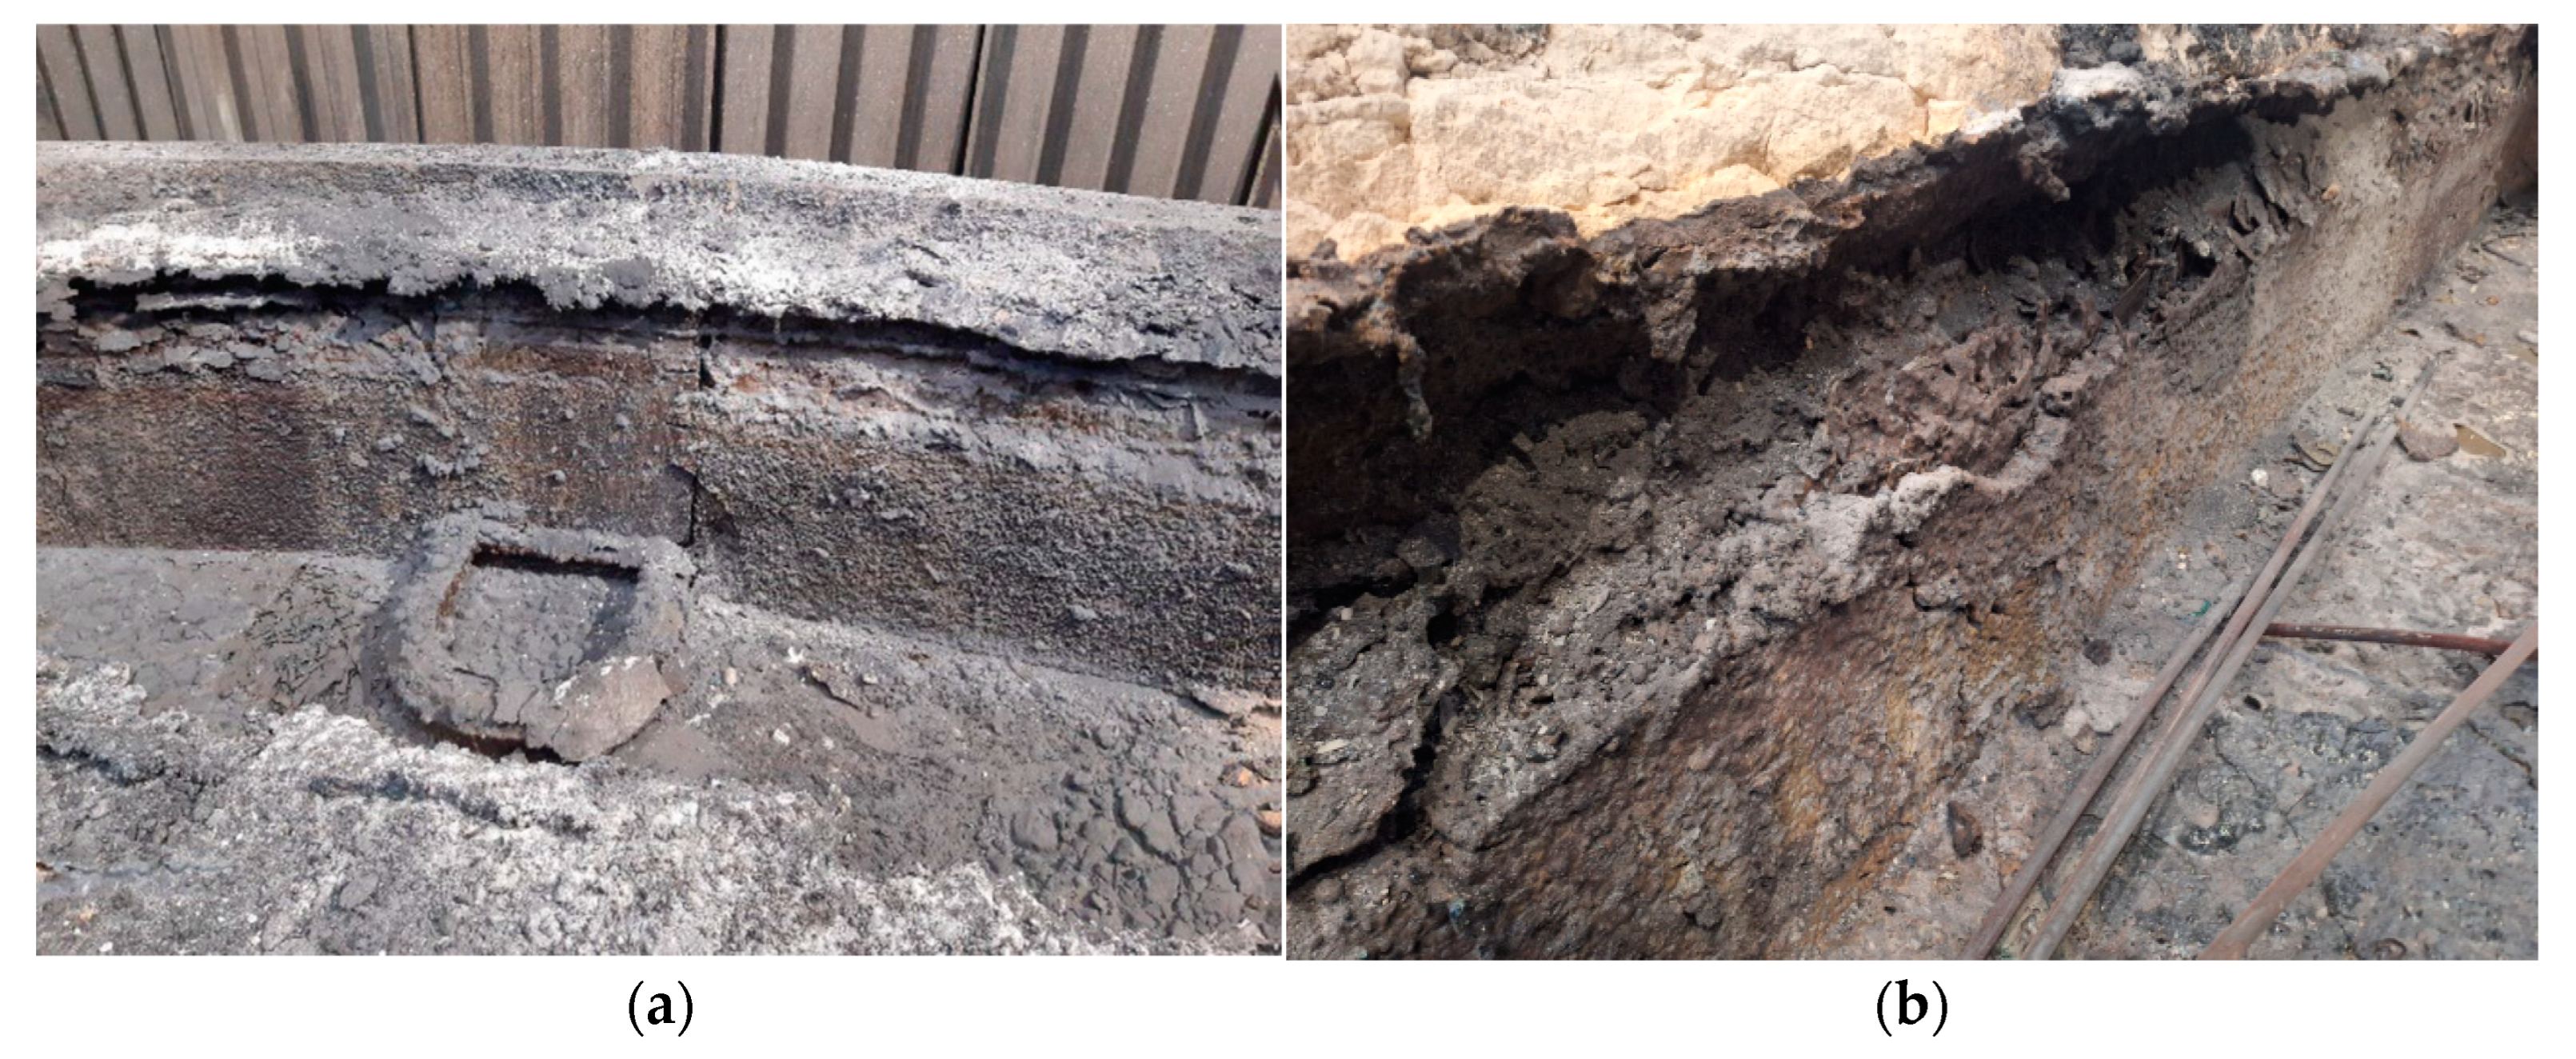
5. Industrial Plant Trials
6. Discussion
7. Conclusions
- Prioritize the customization of pad shape according to tundish geometry and strand arrangement.
- Use numerical simulations as a standard tool in the design phase to evaluate flow uniformity, thermal homogenization, and inclusion flotation zones.
- Implement wear resistance studies for refractory materials in high-turbulence regions.
- (1)
- The effect of chemical erosion mechanisms caused by steel–refractory interaction;
- (2)
- The impact of transient flow instabilities, particularly those associated with ladle shroud exchanges and level fluctuations in the tundish. These phenomena can significantly influence the inclusion content, slag entrapment, and lining lifetime and thus require advanced modeling and experimental validation.
Author Contributions
Funding
Institutional Review Board Statement
Informed Consent Statement
Data Availability Statement
Acknowledgments
Conflicts of Interest
References
- Continuous Casting Machinery Equipment. Available online: https://ssavalan.com/en/market-sectors/industrial-machinery-and-equipments/ccm/ (accessed on 24 January 2025).
- Warzecha, M.; Merder, T.; Warzecha, P.; Hutny, A.M. Hydrodynamic Conditions of Flow in the Tundish Depending on Selected Technological Parameters for Different Steel Groups. Arch. Metall. Mater. 2019, 64, 65–70. [Google Scholar] [CrossRef]
- Guthrie, R.I.L.; Isac, M.M. Continuous Casting Practices for Steel: Past, Present and Future. Metals 2022, 12, 862. [Google Scholar] [CrossRef]
- Sowa, L. Effect of Steel Flow Control Devices on Flow and Temperature Field in the Tundish of Continuous Casting Machine. Arch. Metall. Mater. 2015, 60, 843–847. [Google Scholar] [CrossRef]
- Ding, C.; Lei, H.; Zhang, H.; Xu, M.; Zhao, Y.; Li, Q. New insight into relationship between casting speed and inclusion removal in the tundish. J. Mater. Res. Technol. 2023, 23, 5400–5412. [Google Scholar] [CrossRef]
- Gryc, K.; Michalek, K.; Střasák, P. Optimalizace vnitřní konfigurace mezipánve pro dosažení teplotní homogenity plynule odlévané oceli. In Proceedings of the Metal, Hradec nad Moravicí, Czech Republic, 22–24 May 2007. [Google Scholar]
- Priesol, I. A Method of Molten Metal Casting Utilizing an Impact Pad in the Tundish. International Patent Application No. PCT/IB2016/056207, 10 October 2016. Available online: https://patentscope.wipo.int/search/en/WO2018069753 (accessed on 10 October 2024).
- Li, C.; Dai, Z.H.; Xu, J.L.; Yang, J.; Yu, G.S.; Wang, F.C. Numerical study of the particle residence time and flow characters in an opposed multi-burner gasifier. Powder Technol. 2015, 286, 64–72. [Google Scholar] [CrossRef]
- Arth, G.; Meurer, D.; Tang, Y.; Hackl, G.; Petritz, B. Bulletin: The Journal of Refractory Innovations. In Tundish Technology and Processes: Ladle to Mould Systems and Solutions (Part II); RHI Feuerfest GmbH: Vienna, Austria, 2017; pp. 64–70. Available online: https://www.rhimagnesita.com/wp-content/uploads/2017/12/Bulletin-2017-1-171130-Hyperlink_mon.pdf (accessed on 7 December 2017).
- Arth, G.; Meurer, D.; Kappel, M.; Loop, P.; Petritz, B. Bulletin: The Journal of Refractory Innovations. In Tundish Technology and Processes: Ladle to Mould Systems and Solutions (Part III); RHI Magnesita GmbH: Vienna, Austria, 2018; pp. 64–70. Available online: https://www.rhimagnesita.com/wp-content/uploads/2018/11/bulletin-2018-1-181120-mon_hyperlink.pdf (accessed on 29 November 2024).
- Tkadlečková, M.; Walek, J.; Michalek, K.; Huczala, T. Numerical Analysis of RTD Curves and Inclusions Removal in a Multi-Strand Asymmetric Tundish with Different Configuration of Impact Pad. Metals 2020, 10, 849. [Google Scholar] [CrossRef]
- Chang, S.; Huang, W.; Zou, Z.; Baokuan Li, B.; Guthrie, R.I.L. Motion behavior of micro-bubbles in a delta shape tundish using impact pad. Powder Technol. 2020, 367, 296–304. [Google Scholar] [CrossRef]
- Bhattacharya, T.; Brown, A.J.; Muller, C.M.; Angelo, J.P.; Lee, M.S.; Singh, K.N.; Kaushik, P. Development of Next-Generation Impact Pads for Producing Ultraclean Steel Using Mathematical Models and Plant Trials. In Proceedings of the AISTechAt, Pittsburgh, PA, USA, 16–19 May 2016. [Google Scholar]
- Crowley, R.W.; Lawson, G.D.; Jardine, B.R.; Grosjean, J.C. Cleanliness improvement using a turbulence suppressing tundish impact pad. Rev. Met. 2017, 93, 967–972. [Google Scholar] [CrossRef]
- Hackl, G.; Tang, Y.; Lukesch, G.; Meurer, D.; Shivaram, P.; Resende, A.D. Impact: Zone Solutions for an Improved Flow Performance in the Tundish. In Proceedings of the AISTech 2019, Iron & Steel Technology Conference, Pittsburgh, PA, USA, 6–9 May 2019. [Google Scholar]
- Buľko, B.; Priesol, I.; Demeter, P.; Gasparovic, P. Geometric modification of the tundish impact point and the advanced material for this application. In Proceedings of the Alafar, Foz do Iguacu, Brazil, 7–10 November 2022. [Google Scholar]
- Priesol, I. Spôsob Liatia Roztaveného Kovu s Využitím Dopadovej Dosky v Tundish. International Patent Classification: B22D 11/10 B22D 41/00, Application No. 109-2016, 11 October 2016. [Google Scholar]
- Hoerner, S.F. Fluid Dynamic Drag: Practical Information on Aerodynamic Drag and Hydrodynamic Resistance; Hoerner Fluid Dynamics: Bakersfield, CA, USA, 1965. [Google Scholar]
- Kireš, M.; Labuda, J. Mechanika Kvapalín a Plynov, Obtekanie Telies Reálnou Tekutinou; Slovak Republic Mechanism of Body Bypassing; PF UPJŠ v Košiciach: Košice, Slovakia, 2009; Available online: http://physedu.science.upjs.sk/kvapaliny/obtekanie.htm (accessed on 6 March 2025).
- Buľko, B.; Priesol, I.; Demeter, P.; Gašparovič, P.; Baricová, D.; Hrubovčáková, M. The Geometric Modification of Impact Point in Tundish. Metals 2018, 8, 944. [Google Scholar] [CrossRef]
- Liu, J.; Zhou, P.; Zuo, X.; Wu, D.; Wu, D. Optimization of the Liquid Steel Flow Behavior in the Tundish through Water Model Experiment, Numerical Simulation and Industrial Trial. Metals 2022, 12, 1480. [Google Scholar] [CrossRef]
- Yang, B.; Lei, H.; Xu, Y.; Liu, K.; Han, P. Numerical Investigation of Flow Characteristics of Molten Steel in the Tundish with Channel Induction Heating. Metals 2021, 11, 1937. [Google Scholar] [CrossRef]
- Ansys.com. Ansys Discovery. Available online: https://www.ansys.com/products/3d-design/ansys-discovery (accessed on 5 August 2024).
- Michalek, K.; Gryc, K.; Tkadlečková, M.; Morávka, J. Modelování a Vizualizace Metalurgických Procesu; VŠB: Ostrava, Czech Republic, 2013; p. 118. [Google Scholar]
- Zhiyin, Y. Large-eddy simulation: Past, present and the future. Chin. J. Aeronaut. 2015, 28, 11–24. [Google Scholar] [CrossRef]
- Buľko, B.; Demeter, P.; Dzurňák, R.; Fogaraš, L.; Hubatka, S.; Šabík, V.; Chomič, V.; Ondrejkovič, K. Optimizing of steel flow in three-strand t-type tundish using mathematical and physical models. In METAL 2022, Proceedings of the 31st International Conference on Metallurgy and Materials, Brno, Czech Republic, 18–19 May 2022; Tanger Ltd.: Greensboro, NC, USA, 2022. [Google Scholar] [CrossRef]
- ANSYS Fluent 12.0 Theory Guide—Standard and SST k-ω Models, Section 4.5.1: Standard k-Omega Model. Available online: https://www.afs.enea.it/project/neptunius/docs/fluent/html/th/node66.htm (accessed on 30 May 2024).
- Sheng, D.Y. Design Optimization of a Single-Strand Tundish Based on CFD-Taguchi-Grey Relational Analysis Combined Method. Metals 2020, 10, 1539. [Google Scholar] [CrossRef]
- SimScale. K-Omega Turbulence Models. Available online: https://www.simscale.com/docs/simulation-setup/global-settings/k-omega-sst/ (accessed on 1 October 2024).
- Gupta, V.K.; Jha, P.K.; Jain, P.K. Modeling of Wall Shear Stress Induced Inclusion Transport and Removal in Multi-Strand Tundish. ISIJ Int. 2021, 61, 2445–2456. [Google Scholar] [CrossRef]
- Murugan, A.R.; Moorthy, C.G.; Ramasamy, C.T. A definition of dirac delta functions. Adv. Math. Sci. J. 2020, 9, 1213–1220. [Google Scholar] [CrossRef]
- Species Transport Theory. Ansys Fluent. Available online: https://www.afs.enea.it/project/neptunius/docs/fluent/html/th/node128.htm (accessed on 16 April 2024).
- Spille-Kohoff, A.; Preuß, E.; Böttcher, K. Numerical solution of multi-component species transport in gases at any total number of components. Int. J. Heat Mass J. Mater. Res. Technol. Transfer. 2012, 55, 5373–5377. [Google Scholar] [CrossRef]
- Cloete, J.H.; Akdogan, G.; Bradshaw, S.M.; Chibwe, D.K. Physical and numerical modelling of a four-strand steelmaking tundish using flow analysis of different configurations. J. S. Afr. Inst. Min. Metall. 2015, 115, 355–362. [Google Scholar] [CrossRef]
- Wang, G.; Yun, M.; Zhang, C.; Xiao, G. Flow Mechanism of Molten Steel in a Single-Strand Slab Caster Tundish Based on the Residence Time Distribution Curve and Data. ISIJ Int. 2015, 55, 984–992. [Google Scholar] [CrossRef]
- Cwudziński, A.; Falkus, J.; Podolska-Loska, A. Numerical, Physical, and Industrial Investigations on Hot Metal Desulphurization—From Macromixing Conditions to Reaction Rate Phenomena. Materials 2024, 17, 5858. [Google Scholar] [CrossRef] [PubMed]
- Cwudziński, A.; Pieprzyca, J.; Merder, T. Numerical and Physical Modeling of Liquid Steel Asymmetric Behavior during Non-Isothermal Conditions in a Two-Strand Slab Tundish—“Butterfly Effect”. Materials 2023, 16, 6920. [Google Scholar] [CrossRef] [PubMed]


| Shapes and Surface Profiles of Solid Bodies | C—Coefficient of Drag |
|---|---|
| Circular plate | 1.11 |
| Square plate | 1.05 to 1.27 |
| Hollow hemisphere | 1.35 to 1.40 |
| Convex hemisphere | 0.30 to 0.40 |
| Round cylinder | 1.20 |
| Rβ | Rk | Rω | ζ* | Mt0 | σk,1 | σω,1 | σk,2 | σω,2 | α1 | βi,1 | βi,2 | ||||
|---|---|---|---|---|---|---|---|---|---|---|---|---|---|---|---|
| 1 | 0.52 | 1/9 | 0.09 | 8 | 6 | 2.95 | 1.5 | 0.25 | 1.176 | 2.0 | 1.0 | 1.168 | 0.31 | 0.075 | 0.0828 |
| Resulting Min. and Max. Residence Times | |||||||||
|---|---|---|---|---|---|---|---|---|---|
| Tmin [s] | Tmax [s] | [%] | |||||||
| CS1 | CS2 | CS3 | CS1 | CS2 | CS3 | ||||
| K configuration | 168 | 56 | 28 | 387 | 103 | 37 | 19.9 | 25.8 | 54.3 |
| SP-K2 configuration | 80 | 41 | 33 | 180 | 60 | 65 | 31.7 | 15.2 | 53.1 |
| Percentage difference [%] | −52.4 | −26.8 | 17.9 | −53.5 | −41.7 | 75.7 | - | - | - |
| SP-K4 configuration | 65.2 | 39.5 | 43.3 | 180 | 50 | 73.9 | 19.9 | 9.8 | 70.3 |
| Percentage difference [%] | −61.2 | −29.5 | 54.6 | −53.5 | −51.5 | 99.7 | - | - | - |
| Configuration | Vm/Vd | Vp/Vd |
|---|---|---|
| K | 2.7 | 1.3 |
| SP-K2 | 1.7 | 0.5 |
| SP-K4 | 3.5 | 0.5 |
Disclaimer/Publisher’s Note: The statements, opinions and data contained in all publications are solely those of the individual author(s) and contributor(s) and not of MDPI and/or the editor(s). MDPI and/or the editor(s) disclaim responsibility for any injury to people or property resulting from any ideas, methods, instructions or products referred to in the content. |
© 2025 by the authors. Licensee MDPI, Basel, Switzerland. This article is an open access article distributed under the terms and conditions of the Creative Commons Attribution (CC BY) license (https://creativecommons.org/licenses/by/4.0/).
Share and Cite
Demeter, P.; Buľko, B.; Dzurňák, R.; Priesol, I.; Hubatka, S.; Fogaraš, L.; Hrubovčáková, M.; Demeter, J. The Development of an Optimized Impact Pad for a Six-Strand Tundish Using CFD Simulations. Appl. Sci. 2025, 15, 5450. https://doi.org/10.3390/app15105450
Demeter P, Buľko B, Dzurňák R, Priesol I, Hubatka S, Fogaraš L, Hrubovčáková M, Demeter J. The Development of an Optimized Impact Pad for a Six-Strand Tundish Using CFD Simulations. Applied Sciences. 2025; 15(10):5450. https://doi.org/10.3390/app15105450
Chicago/Turabian StyleDemeter, Peter, Branislav Buľko, Róbert Dzurňák, Ivan Priesol, Slavomír Hubatka, Lukáš Fogaraš, Martina Hrubovčáková, and Jaroslav Demeter. 2025. "The Development of an Optimized Impact Pad for a Six-Strand Tundish Using CFD Simulations" Applied Sciences 15, no. 10: 5450. https://doi.org/10.3390/app15105450
APA StyleDemeter, P., Buľko, B., Dzurňák, R., Priesol, I., Hubatka, S., Fogaraš, L., Hrubovčáková, M., & Demeter, J. (2025). The Development of an Optimized Impact Pad for a Six-Strand Tundish Using CFD Simulations. Applied Sciences, 15(10), 5450. https://doi.org/10.3390/app15105450