1. Introduction
Tuberculosis (TB) is caused by
Mycobacterium tuberculosis which is spread from person to person through the air, which makes it highly contagious. According to this, the World Health Organization (WHO) maintains that TB is one of the top ten causes of death worldwide. Moreover, in 2023, it returned as the leading cause of death from a single infectious agent, overshadowed by COVID-19 in the 2020 to 2023 period [
1]. In developing countries, the situation is worse due to the risk of developing TB after the infection is associated with sociopolitical issues and healthcare infrastructure, representing a significant public health challenge. Different efforts led by WHO, such as the End TB initiative, have been proposed, but it has been difficult to reduce the incidence rates (newly diagnosed cases), which had an increment of
between 2020 and 2023, due to the impact of the COVID-19 pandemic. In addition, it was estimated that more than ten million people fall ill with TB, marking an increase in this number since 2021 [
1,
2].
It is estimated that one in four people worldwide is infected with latent TB, with the potential to develop active TB, especially in individuals with compromised immune systems—such as those with HIV, diabetes, malnutrition, tobacco use, or homelessness, who have a 5–10% chance [
1,
3,
4]. TB can affect any organ in the body but primarily targets the lungs, a condition known as pulmonary TB (PTB), which presents symptoms such as a severe cough lasting more than three weeks, chest pain, and coughing up blood or sputum [
5,
6].
This study analyzed a case using data from a developing country, specifically Colombia. In 2023, Colombia reported a tuberculosis (TB) incidence rate of
per 100,000 population, which increased to
in 2024—marking a
and
rise in reported pulmonary TB (PTB) cases compared to the previous years [
1,
7]. This growing burden highlights the persistent disparities in resource distribution within the public health sector. Addressing these challenges requires the development of alternative strategies to enhance disease management, facilitate early detection, and expedite the initiation of anti-PTB treatment.
National protocols allow healthcare professionals to initiate treatment based on clinical evaluation [
8], even in the absence of bacteriological confirmation, to prevent disease transmission and progression in patients based on three primary diagnostic tests: smear microscopy, molecular tests, and culture. Smear microscopy is the simplest and most affordable test, providing results within a short time. However, its sensitivity is low, ranging between
and
, depending on the quality of the sample. In contrast, molecular tests offer higher sensitivity, exceeding
, and can deliver results within hours. The main drawback of this method is the need for specialized equipment and trained professionals, making it more costly than smear microscopy. Finally, culture is the most reliable diagnostic method, offering high sensitivity and specificity. However, it requires skilled personnel, expensive infrastructure, and a processing time of at least two to three weeks [
8,
9]. Each test has its advantages and limitations, and depending on resource availability, a patient may undergo one, two, or all three tests. Nonetheless, the time and costs associated with these diagnostic methods create accessibility barriers in certain regions. Therefore, developing new low-cost, rapid technologies is essential to support healthcare professionals in diagnosing the disease more efficiently [
10].
Despite the availability of current technologies and diagnostic protocols for PTB, some regions in the country still lack the necessary resources to implement these procedures effectively. In many cases, healthcare professionals rely on traditional tools, while access to laboratories and advanced diagnostic equipment remains limited and often delayed. Previous research conducted by the same team has explored alternative approaches for addressing these challenges in [
11,
12,
13]. In this study, an extension was based on a previously reported method, where medical staff documented patient consultations with detailed descriptions of medical findings and terminology. This documentation, commonly used in the traditional Colombian healthcare system, can serve as an additional data source to support the diagnostic process.
In recent years, artificial intelligence (AI) has been increasingly utilized in medicine to support decision-making [
14,
15]. AI-powered systems provide healthcare professionals with valuable insights, enabling them to enhance diagnostic accuracy and efficiency. These systems can process large amounts of data and apply machine learning (ML) techniques to specific medical tasks [
16,
17]. One of the key advantages of AI-based tools is the cost-effectiveness and accessibility for frontline healthcare workers, making them particularly useful in situations where conventional diagnostic methods are unavailable [
18]. AI has been successfully applied in various medical fields, including cancer detection [
19], COVID-19 diagnosis and treatment, and drug discovery through deep neural networks [
20,
21,
22,
23]. In the case of TB, studies [
12,
24] have demonstrated how artificial neural networks (ANNs) can be trained to diagnose TB using clinical data (CD). Additionally, research in [
22,
25] explores ANN-based clustering techniques to categorize populations into three risk groups (high, medium, and low risk) showing promising results in TB and COVID-19 risk assessment.
Natural language processing (NLP) is a branch of AI that enables the analysis of unstructured text and can be used to develop decision-support tools. For example, NLP has been applied to build AI systems that assist with tasks such as retrieving relevant information [
26], determining patient eligibility and tracking [
27,
28], and diagnosing diseases [
29]. These systems typically rely on data from electronic medical records (EMRs), including clinical notes (CNs), laboratory results, and imaging data. Research has shown that the most effective NLP models are those that learn patterns from data using ML techniques [
30]. Since 2021, the rise of large language models (LLMs) has driven advancements in generative models and new approaches to text processing. However, these methods face challenges related to the specific dataset used for model development and the manual annotations provided by expert medical professionals [
31,
32]. Examples of NLP applications in healthcare include assessing dietary risks for diabetes patients [
33] and comparing NLP-generated labels based on medical imaging with expert TB screening in chest X-rays [
34]. Additionally, NLP and LLM have been used for data fusion in medical contexts [
31,
32,
35].
To enhance PTB diagnosis, we proposed four predictive modeling schemes utilizing two data sources. The first source comprises clinical data (CD) from 151 patients, including variables such as HIV status, geographic location within the city, and sex. Additionally, clinical notes (CNs) from physicians’ reports (PRs) during patient consultations as part of routine practice were included. Two schemes integrate both CD and CN, while the other two process them separately. Each scheme employs five machine learning (ML) algorithms: support vector machine (SVM), K-nearest neighbor (KNN), logistic regression (LR), random forest (RF), and artificial neural networks (ANNs). Since CN consists of unstructured text, NLP techniques were applied to convert these reports into numerical representations, allowing ML algorithms to extract meaningful patterns. This approach addresses the challenges faced by resource-limited settings, where access to advanced diagnostic infrastructure is scarce. By leveraging data fusion techniques and computational intelligence, the proposed models can support TB diagnosis in regions lacking well-developed healthcare systems, improving early detection and intervention.
2. Materials and Methods
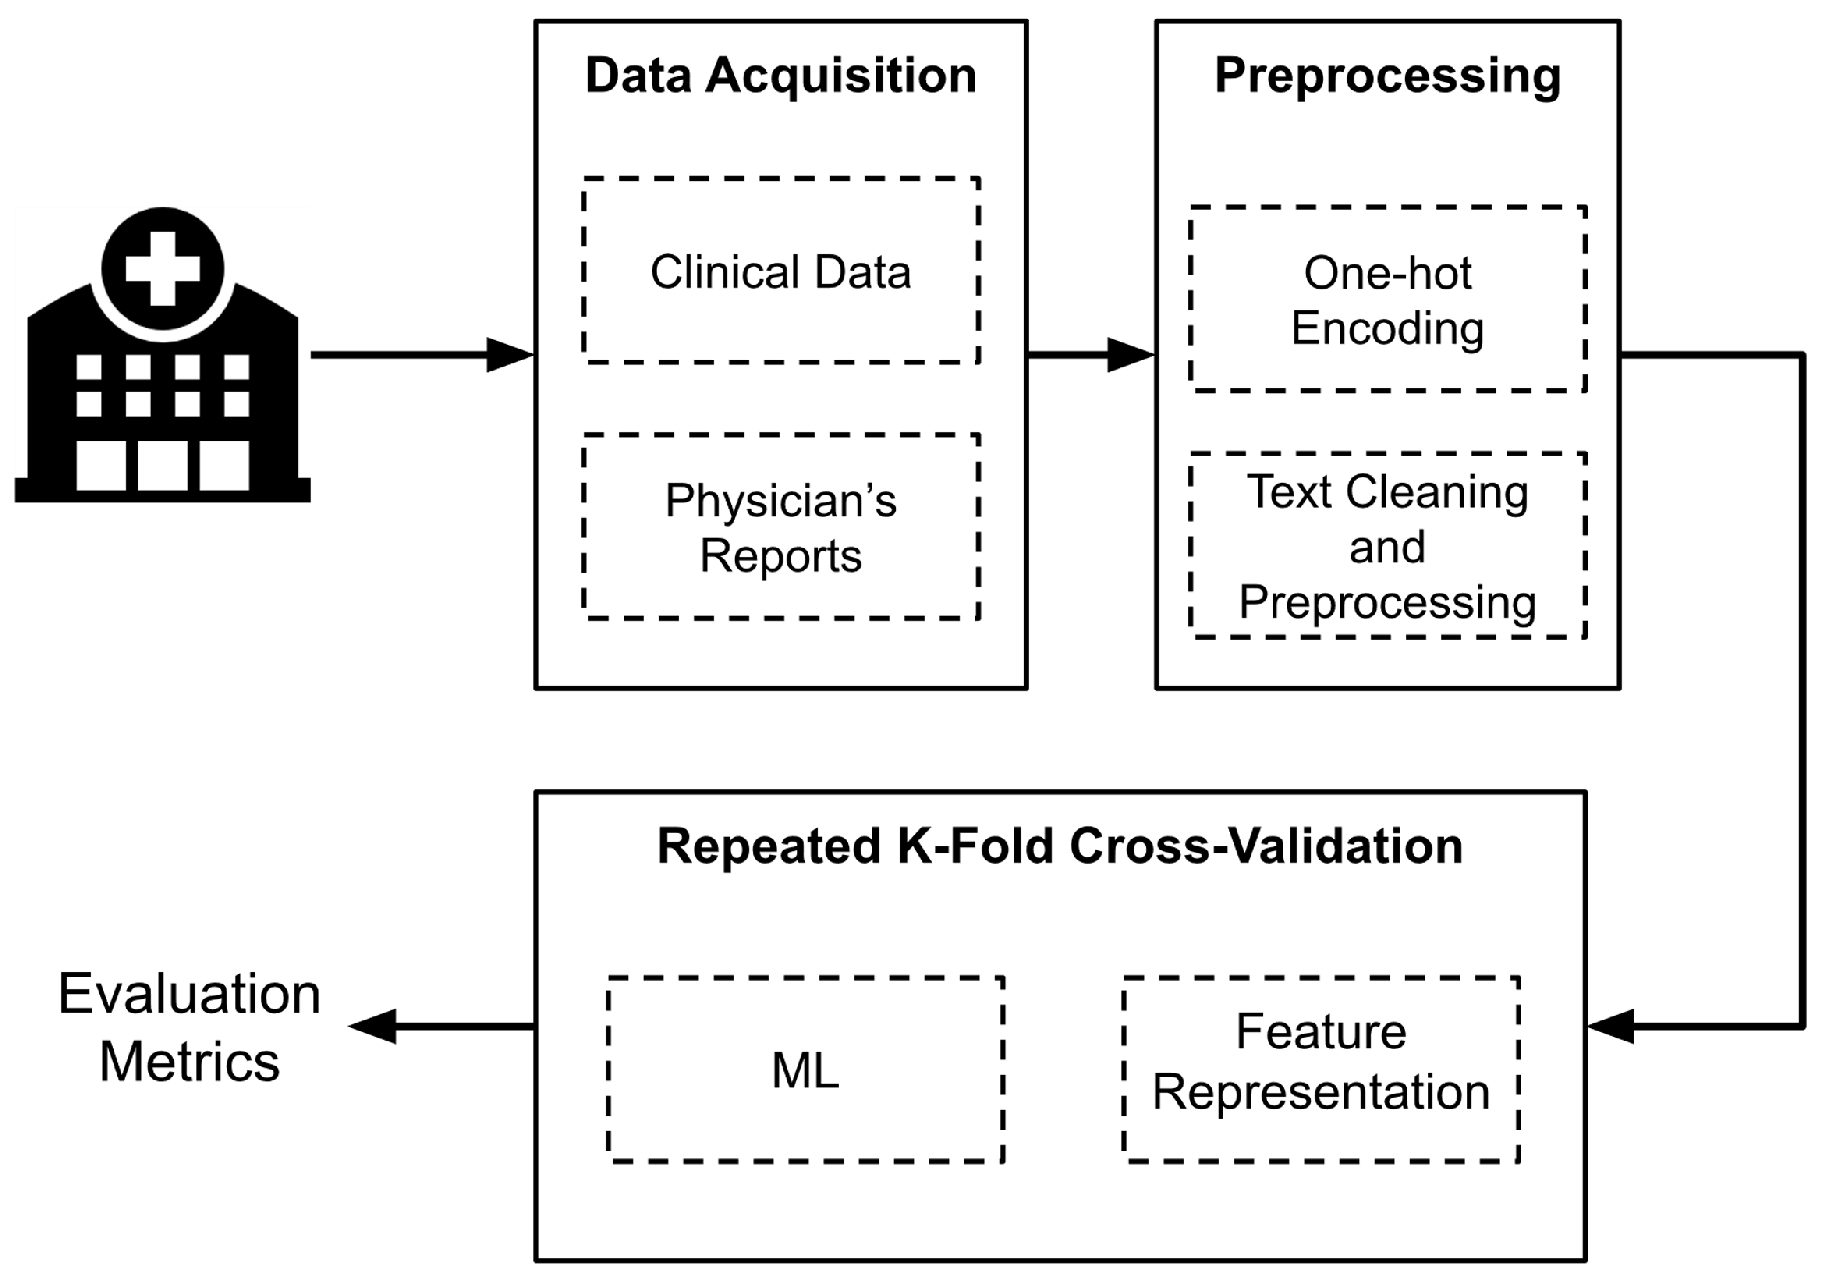
Figure 1 presents an overview of the implemented methodology. First, data were collected from Hospital Santa Clara in Bogota, Colombia. Next, a preprocessing and cleaning phase was conducted to prepare the data before extracting the features used as input for the algorithms. For this, four different schemes were designed, each employing five ML models. To assess the model performance, the stratified
k-fold cross-validation technique was established. The following sections provide a detailed explanation of each step illustrated in
Figure 1.
2.1. Dataset
The data were collected between 2017 and 2019 at Hospital Santa Clara in Bogotá D.C., Colombia, which is part of the Middle-East Integrated Health Services Subnetwork (translated from Spanish: Subred Integrada de Servicios de Salud Centro Oriente). The study was approved by the subnetwork’s ethics committee under Act No 316 of 24 May 2021. Approval was granted based on the anonymization of data, which included only population-related variables and posed no risk to subjects. Informed consent was not required, as all data were retrospective and fully anonymized.
Clinical data (CD) variables were extracted from records of the institutional PTB program, while clinical notes (CNs) from the physician reports (PRs) were obtained from electronic medical records, which are standardized according to the hospital’s record acquisition system. In Colombia, EMRs remain a challenge due to limitations in basic guidelines, policies defining required data fields, and issues related to interoperability [
36].
The dataset included clinically suspected PTB cases, with microbiological tests performed to confirm the disease. These tests identified 116 confirmed PTB cases and 35 non-PTB patients from an initial dataset of 233 individual records. The remaining cases were excluded due to missing PTB confirmation or unavailable PR data.
For PR extraction, when applicable, dates related to diagnostic tests and the initiation of treatment were prioritized. The temporal placement of PR was considered crucial, as it contained information indicative of PTB. Therefore, up to five PRs recorded within 30 days prior to these key dates were extracted, analyzed, and summarized. This was necessary because not all EMR data were directly related to PTB but rather encompassed the patient’s entire medical history.
Regarding CD, data were collected by physicians involved in the institutional PTB program, as well as members of the research team. The extracted variables included (i) geographic location within Bogotá, (ii) sex, (iii) human immunodeficiency (HIV) status, (iv) antiretroviral treatment (ART) status, (v) population risk factors, such as homelessness, migrant status, displacement, or indigenous background. These variables were selected based on recommendations from physicians and were encoded using binary representation [
37].
Table 1 provides an overview of the variables and their possible values.
2.2. Preprocessing
During the preprocessing and data cleaning phase, an exploratory analysis was conducted to identify and correct any errors in data acquisition. Based on this analysis, a final dataset of 151 patients was constructed, as some cases had to be excluded due to missing EMRs or discrepancies between recorded diagnostic test dates and those found in the EMR system.
Additionally, Bogotá’s population was recategorized into five zones (north, south, east, west, and areas outside the city) based on geographical patients’ places of residence. This zoning ensured a significant number of patients per region. The assigned localities within each zone correspond to those designated by the city for the four integrated health services subnetworks, allowing for the inclusion of indirect sociodemographic information.
For NLP preprocessing, the PR involved text cleaning through a three-step process. First, all words were converted to lowercase. Second, stopwords were removed using a standard stopword list to filter out prepositions, adverbs, articles, and conjunctions. Finally, a customized word removal process was applied to eliminate repetitive terms frequently found in the TB diagnosis process, such as medication units, institution-specific terms related to patients, and other TB-related words requiring lemmatization and stemming. The selection of these additional words was conducted in collaboration with healthcare professionals to ensure relevance.
Additionally, clinical reports often contain terms related to information or events unrelated to PTB [
38]. However, the impact of these terms was minimized through post-processing. Non-alphabetic characters, including accents, punctuation marks, numbers, and other symbols, were also removed. Furthermore, double spaces and line breaks were eliminated to refine the text and prevent unnecessary elements from affecting the algorithms. More details on dataset construction from EMR and a preliminary analysis of text content can be found in [
38]. For practical issues, the term
patient document refers to the combined and preprocessed text from the five PR associated with each patient.
2.3. Feature Representation
The CD source data were structured using nominal variables represented as numerical vectors. To achieve this, one-hot encoding was applied, assigning unique binary values to each category of the original variable. For example, the HIV status variable has three possible values: positive, negative, and unknown. Consequently, three separate columns were created, each representing one of these values. A binary value of one (1) was assigned when the condition was present, and zero (0) otherwise. This numerical representation enables ML algorithms to be trained using categorical variables from the CD without implying any specific order or preference among them.
For NLP applications, computers process language in the form of text extracted from patients’ documents. However, these texts need to be converted into numerical representations for ML algorithms to analyze and learn from the data. To achieve this, two different text representation methods were explored, where each document is transformed into a vector that captures its content.
Term Frequency-Inverse Document Frequency: The first method employs term frequency-inverse document frequency (TF-IDF) [
39]. This metric helps emphasize words that frequently appear in a document while penalizing those that occur across multiple documents. The informativeness of a word is inversely related to the number of documents in which it appears, as words that are common across documents contribute less to classification. Equation (
1) shows how
was calculated for each term
, where
is the number of documents, and
is the number of documents in the document set that contain the term
. The set of all the terms that appear in the documents is known as the vocabulary.
After calculating the for all terms, the TF-IDF is obtained by multiplying the term frequency (TF) of each item in a document by its corresponding value. As a result, each document is represented by a vector containing the TF-IDF values for all terms in the dataset. Additionally, L2 normalization was applied to each vector to ensure that the sum of the squares of its elements equals 1.
Moreover, TF-IDF terms are not limited to single words; n-grams can also be used. N-grams are contiguous sequences of elements—for example, a 2-g consists of two consecutive words in a document. This approach captures language structure and enhances contextual understanding. Several n-gram combinations were explored to construct the vocabulary. Different combinations of n-grams were explored to build the vocabulary: (i) 1-g (a single term), (ii) 1-g and 2-g combination, (iii) 2-g, (iv) 1-g, 2-g, and 3-g combination, (v) 3-g. Since the vocabulary can become extensive, the vector size was constrained within a specified range, with the minimum and maximum values optimized during the process. Additionally, the vocabulary was capped at 1000 terms. However, given the high dimensionality relative to the available samples, dimensionality reduction was applied using truncated singular value decomposition (SVD), with the number of components also optimized.
Version 1.0 of the
Scikit Learn library was used to compute the TF-IDF vector for each document [
40]. The vectorization process followed the parameters described earlier, including word-based analysis,
n-grams ranging unigrams to trigrams, and a maximum of 1000 features. As mentioned in the previous subsection, stop words were excluded during preprocessing based on the Spanish language.
Embeddings Representation: The second method employed embeddings representations. In this approach, each term is represented by a vector, where words with similar meanings or those used in similar contexts have closely related vector representations. There are different ways to generate embeddings: they can be learned from an ML model during training on a specific task or obtained in an unsupervised manner from document statistics [
41]. In this work, the Word2Vec model was used to generate embeddings [
42]. Two algorithms were applied: continuous bag of words (COBW), which predicts a target word based on surrounding words within a window, and skip-gram, the reverse task by predicting context words for a given target word using unsupervised learning techniques. Both methods rely on neural networks, including layers and weights, to predict words and generate meaningful word embeddings.
Finally, while each term in a document is represented as a vector, a single vector representation for the entire document is required to train traditional ML algorithms. To achieve this, a pooling step was applied using two different operations: maximum pooling, which selects the maximum value for each dimension across all word vectors in the document, and mean pooling, which computes the average of the word vectors. As a result, each document was represented by a vector containing either the maximum or the mean of the embeddings corresponding to its words.
2.4. Machine Learning Models
Before discussing the experimental design, it was necessary to briefly explain the ML algorithms used. As mentioned above, the five algorithms employed were KNN, LR, SVM, ANN, and RF. These models were trained for binary classification to distinguish between patients with confirmed TB and those without TB.
KNN is an instance-based learning classifier that does not attempt to build a general internal model. Instead, it stores instances of the training data and classifies new samples based on the
k (a specified number) nearest neighbors. Classification is determined either by a majority vote among the nearest neighbors or by assigning weights inversely proportional to the distance from the point being classified [
43].
The regression task developed by the LR model consists of optimizing a cost function. It models the likelihood of a binary outcome (in this case, TB detection) using a logistic function [
40].
For ANN, different architectures can be applied, In this study, a single hidden layer with a set of neurons was used. Each neuron performs a weighted sum of its inputs and applies an activation function, which adds nonlinearity to its output. The model learns the optimal weights from the training set and generalizes them to new inputs [
44].
Another approach for classification can be implemented through the use of SVM. This model aims to maximize the margin, defined as the distance between the separation hyperplane and the closest labeled training samples, known as support vectors [
45]. These support vectors contribute to the distinguishing between the TB-detected and non-detected classes.
The hyperparameter optimization was performed using a grid search, systematically evaluating different parameter combinations to identify the best configuration based on training performance for each model. For the SVM, the parameters tested included the regularization parameter C, kernel type, and gamma. The KNN model was optimized by varying the number of neighbors, weight function, algorithm type, and leaf size. In the case of the LR model, the regularization parameter C and optimizer were adjusted. For the ANN, the optimization process involved tuning the number of neurons and layers, batch size, number of epochs, activation function type, and learning rate. Finally, for the RF model, the number of estimators and the sample-splitting strategy were explored.
Finally, the RF model is an ensemble training method that combines multiple decision trees, each trained independently. While a single tree may not be sufficient for accurate classification, RF improves performance by aggregating multiple weak classifiers to enhance prediction accuracy [
46]. All models were implemented using the
Scikit Learn library, except for ANN, which was implemented using the Keras library and its version 2.7.0rc0 [
47]. For each case, the hyperparameters were optimized through a grid search strategy, where different values were tested, and the best-performing configurations were selected.
2.5. Experimental Design
As mentioned earlier, five ML schemes were proposed for classification, as illustrated in
Figure 2. These schemes include two approaches that use PR and CD separately and two fusion schemes that combine both sources of information: Type A and Type B data fusions. The ML approaches were applied to the PR-based, CD-based, and Type A fusion models. In contrast, the Type B fusion models were constructed based on the performance of the PR-based and CD-based approaches. This allows for selecting the best-performing ML algorithms for the classification task.
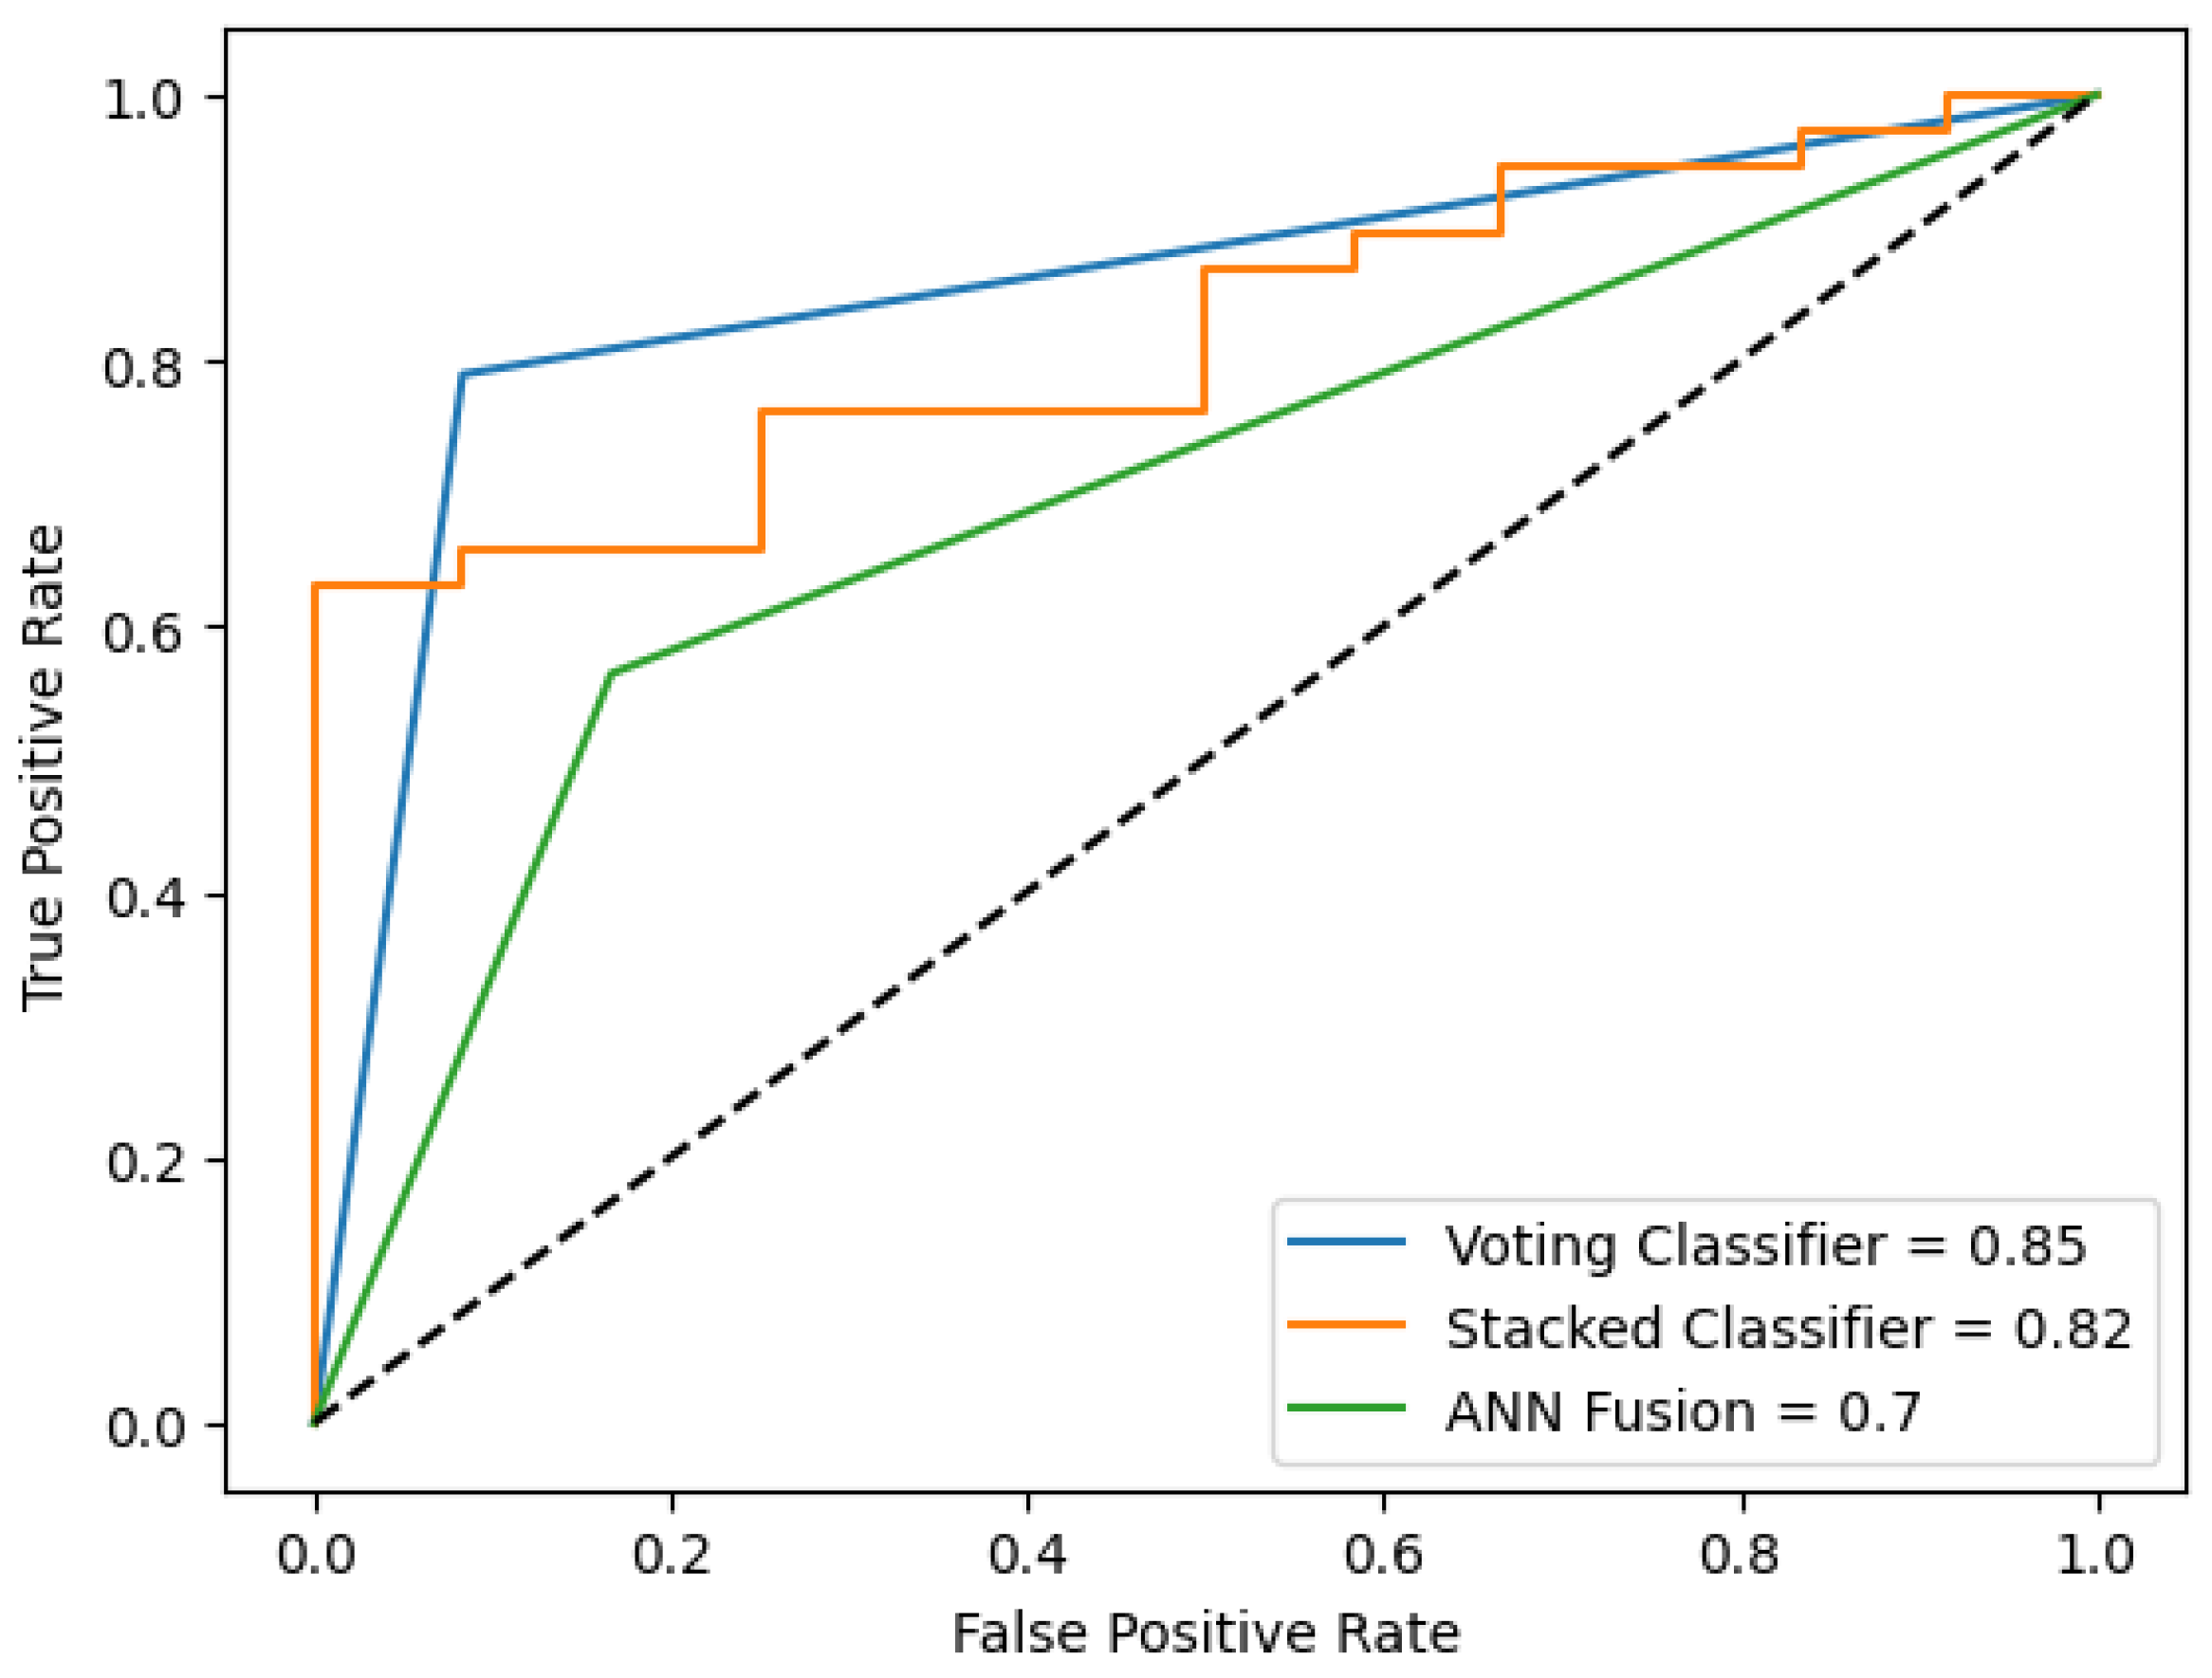
The Type B data fusion model incorporates an aggregation layer with two different strategies: (a) majority voting, where the final classification is determined by a simple majority vote among the four classifiers. In case of a tie, priority is assigned in descending order from model 1 (highest priority) to model 4 (lowest priority); (b) stacking classifier, where an ML algorithm is used as the aggregation layer. LR was chosen for this task, where the inputs are the probability outputs or decision functions (depending on the type of ML model) from the four classifiers.
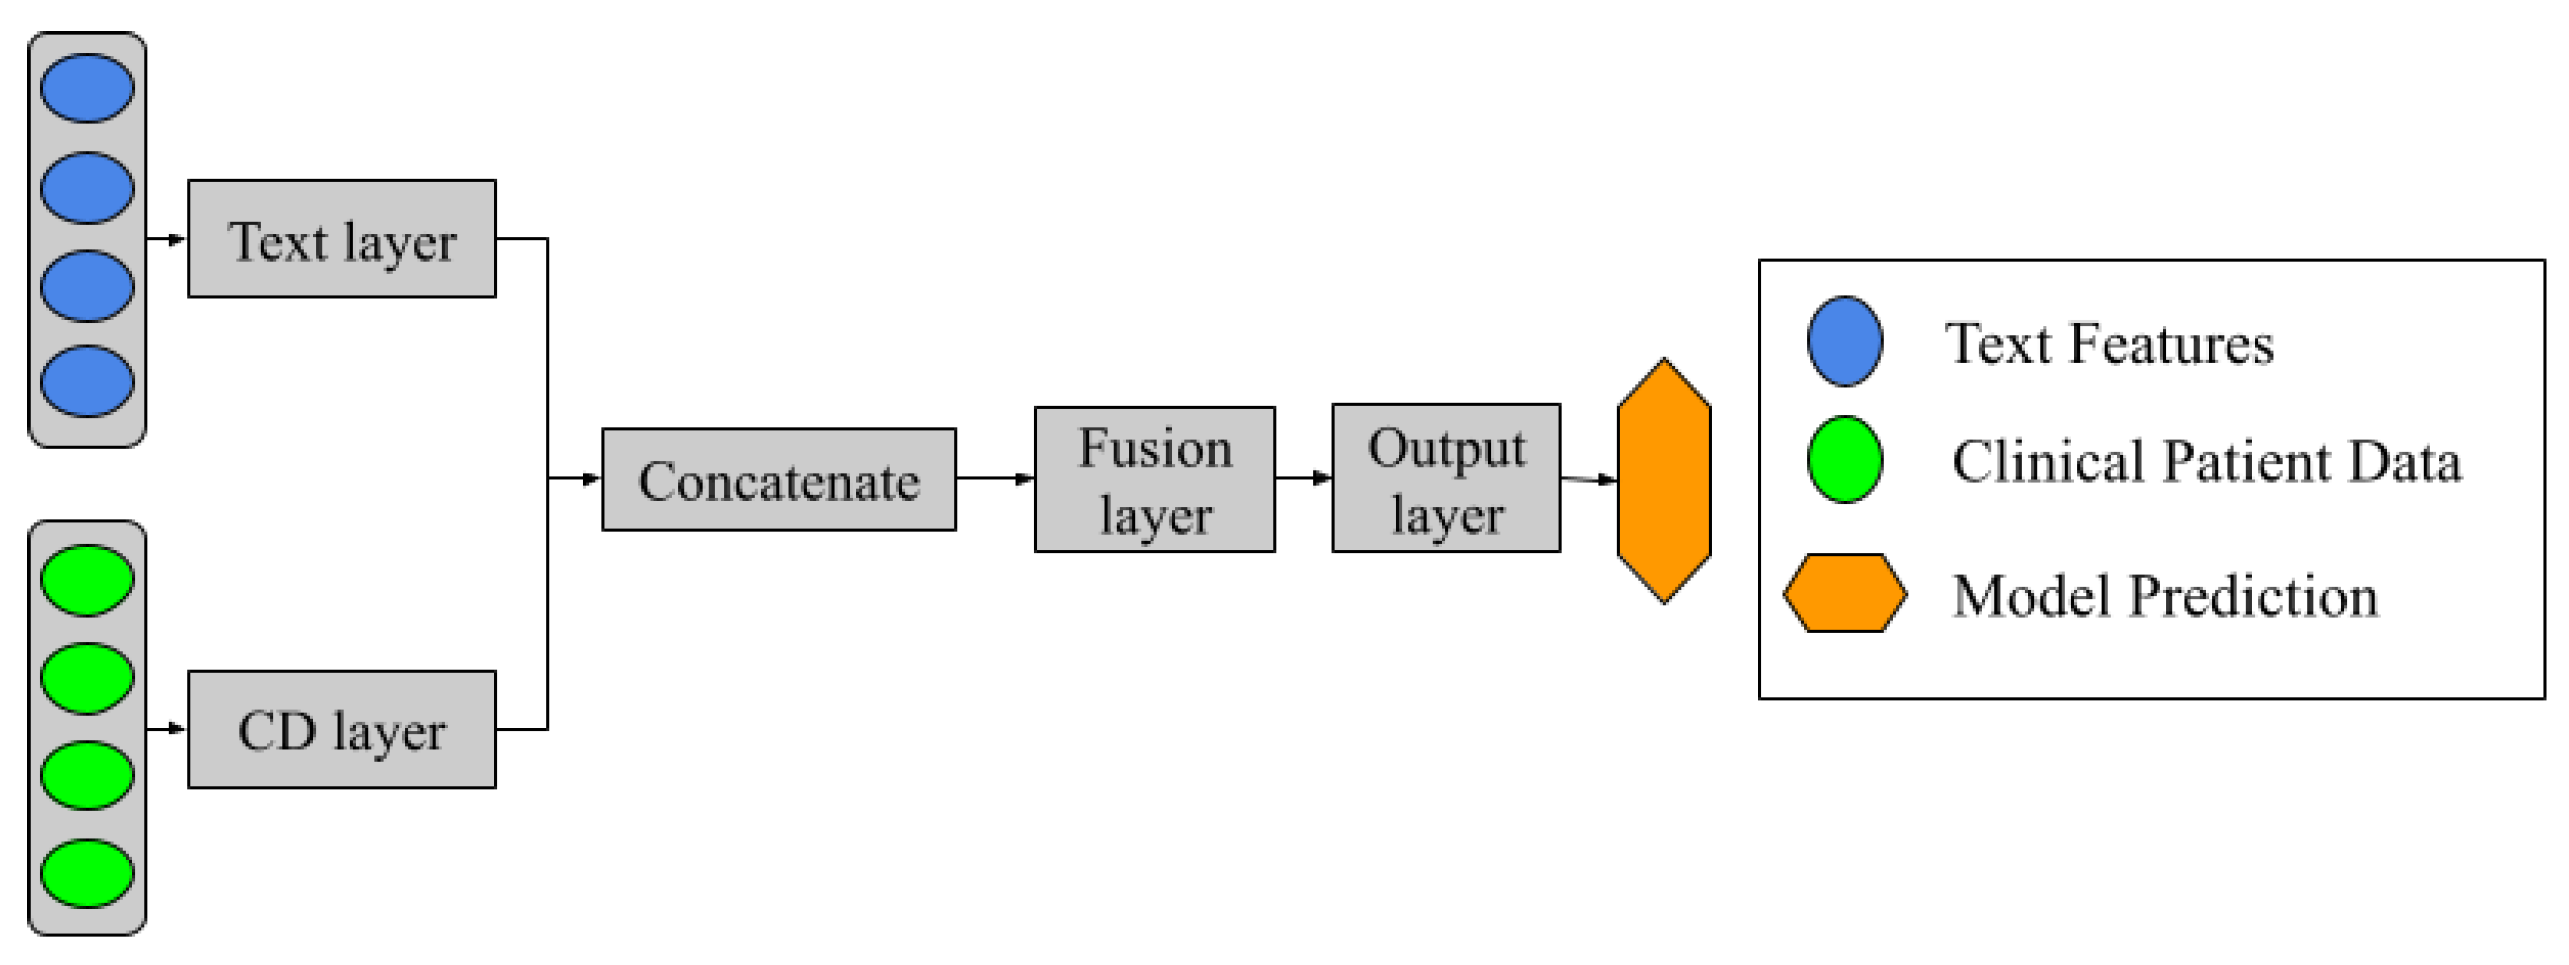
Additionally, a different model was introduced alongside the previously mentioned approaches. This model consists of a neural network architecture, as illustrated in
Figure 3. The design incorporates two separate networks, each dedicated to learning from PR and CD data sources independently during the training process. These networks are then concatenated, allowing a subsequent layer to handle information fusion. Finally, the output layer consists of a single neuron with a sigmoid activation function, which performs the binary classification task.
Stratified
k-fold cross-validation (SKCV) was used to select the best parameters for text representation (TF-IDF and embeddings) and to optimize the hyperparameters of the ML models, as illustrated in
Figure 1. In SKCV, the dataset was split into multiple partitions for training and validation, ensuring that each set remained distinct. The term “stratified” indicates that the class distribution was preserved across all partitions. Given the database size, a three-fold approach was chosen to maintain a sufficient number of samples in the validation set for an accurate model evaluation. To ensure statistical reliability, SKCV was repeated ten times, and the mean and standard deviation of the performance metrics across all repetitions were used to assess and compare the models.
The parameters explored for obtaining the TF-IDF measure included different combinations of n-grams as well as the maximum and minimum values of required for a term to be included in the vocabulary. Additionally, the number of components used for dimensionality reduction was examined alongside the computed TF-IDF values. Both TF-IDF calculation and dimensionality reduction were fitted using the training set before being applied to both the training and testing sets. This approach ensures that when predicting the diagnosis of a document, the TF-IDF method does not incorporate vocabulary from the test set, preserving the integrity of the model evaluation. By doing so, test documents accurately simulate the addition of new, unseen inputs.
For the Word2Vec models training, the COBW and skip-grams neural network models were implemented using the training set. Several parameters were explored, including the window size and the minimum frequency a word needed to appear to be included in the vocabulary. Additionally, during the pooling step, both maximum pooling and mean pooling operations were applied. For both feature extraction methods, each document was represented by a vector, followed by a normalization step, where values were transformed into a range between −1 and 1 to ensure consistency across representations.
Furthermore, the hyperparameters of the ML algorithms were explored using a random grid search in a heuristic manner until the best results were achieved. For models with a small set of hyperparameters, every possible option was systematically tested whenever feasible, such as LR, ANN, and SVM kernel models. For the fusion models, the same methodology was applied; however, the exploration process was shorter, as it was guided by the results obtained from the PR and CD-based models. Additionally, it is important to note that the text representation parameters and the ML hyperparameters were optimized together, ensuring an effective combination for classification performance.
The metrics used to evaluate the results of SKCV were sensitivity, specificity, and area under the curve (AUC), as they are particularly relevant in healthcare systems [
48]. These metrics were computed for each testing set and then averaged. To ensure robust evaluation, the SKCV process was repeated ten times, and the mean and standard deviation of the three metrics were calculated across all repetitions, providing insight into the variability of the models. Additionally, given the imbalanced dataset, the training was weighted according to the number of samples in each class, ensuring that the metric accurately reflects the dataset distribution. Finally, the same training and testing sets were consistently used across all models to enable fair comparisons.
3. Results and Discussion
Table 2,
Table 3 and
Table 4 present the results of the PR and CD-based isolated models. Each table lists the five ML algorithms used, with the best-performing model highlighted in bold. For the CD-based models (
Table 2), ANN achieved the best performance. However, all models—except KNN—produced similar results (see
Table 5 for hyperparameter details).
Table 3 and
Table 4 display the models trained using features extracted from patient documents. Among the two PR analysis methods, the TF-IDF representation yielded the best result, with an AUC of
, a
lower than that of the CD-based models.
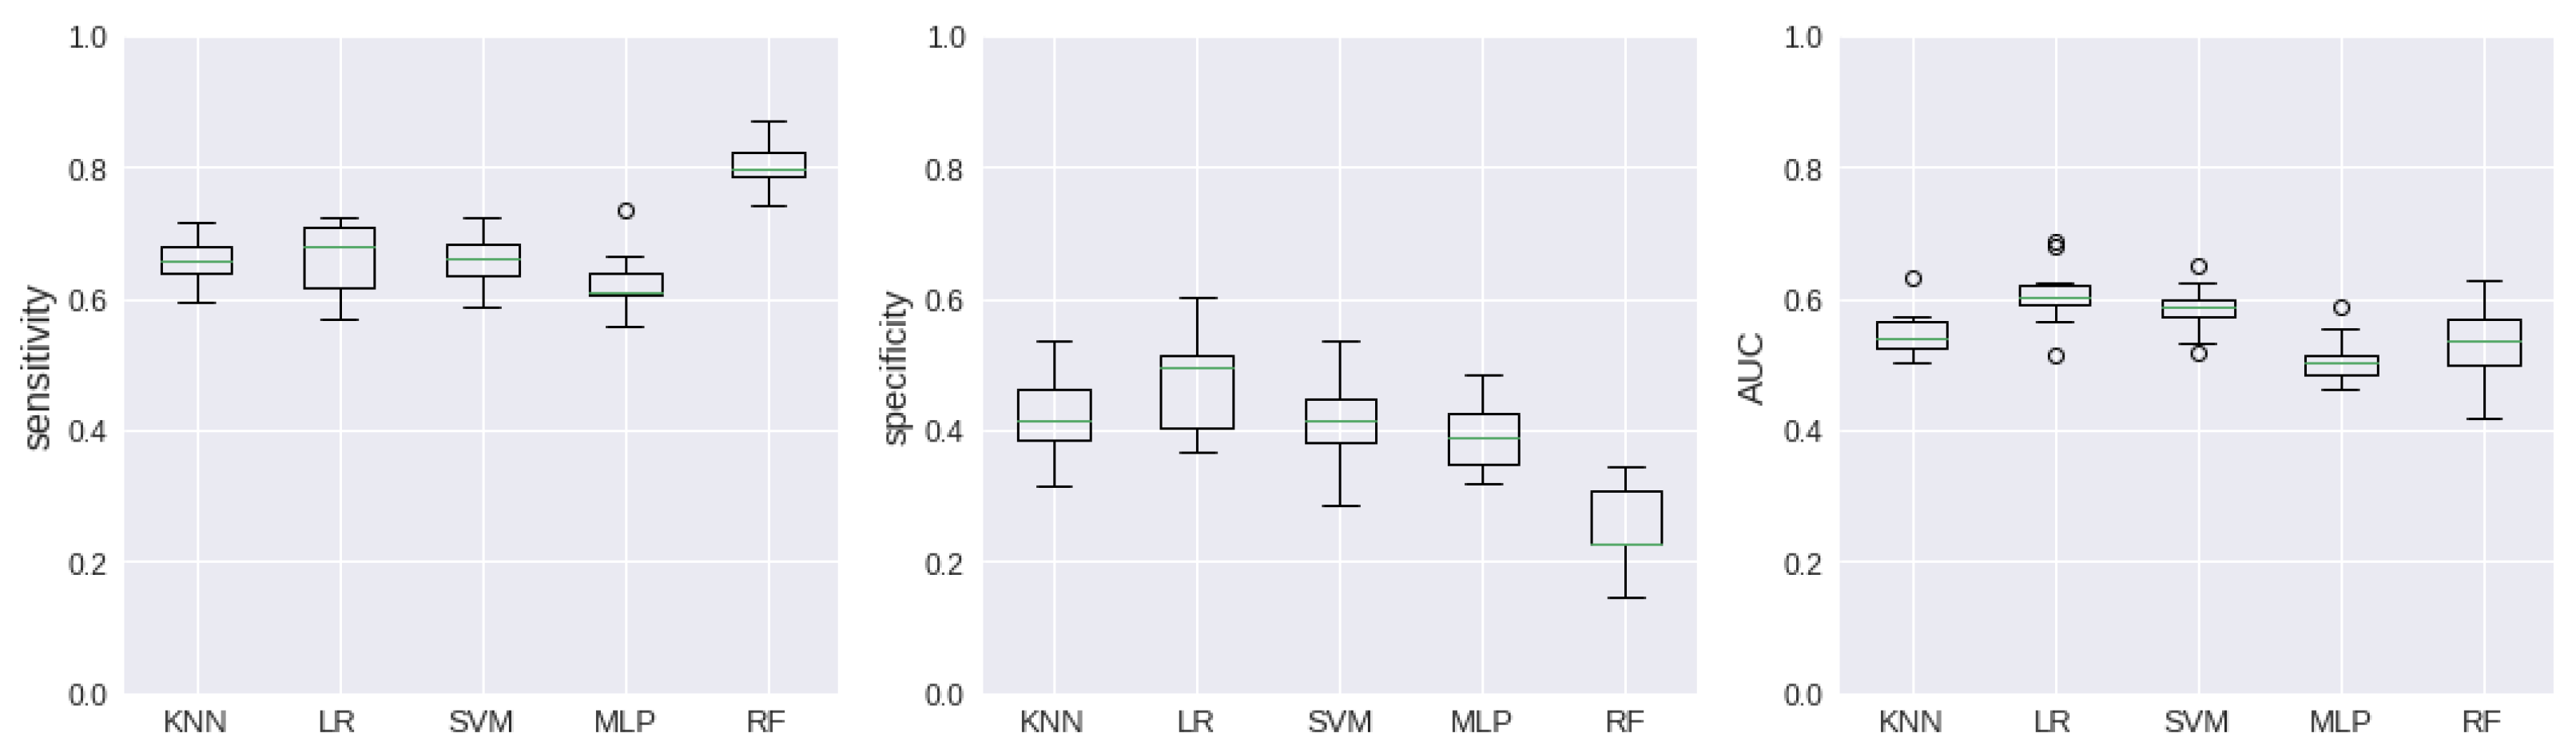
Figure 4 and
Figure 5 exhibit the dispersion of the results through boxplot graphics.
Table 6 presents the results of the Type A data fusion models. As shown in
Figure 2, these models incorporate both sources of information as input.
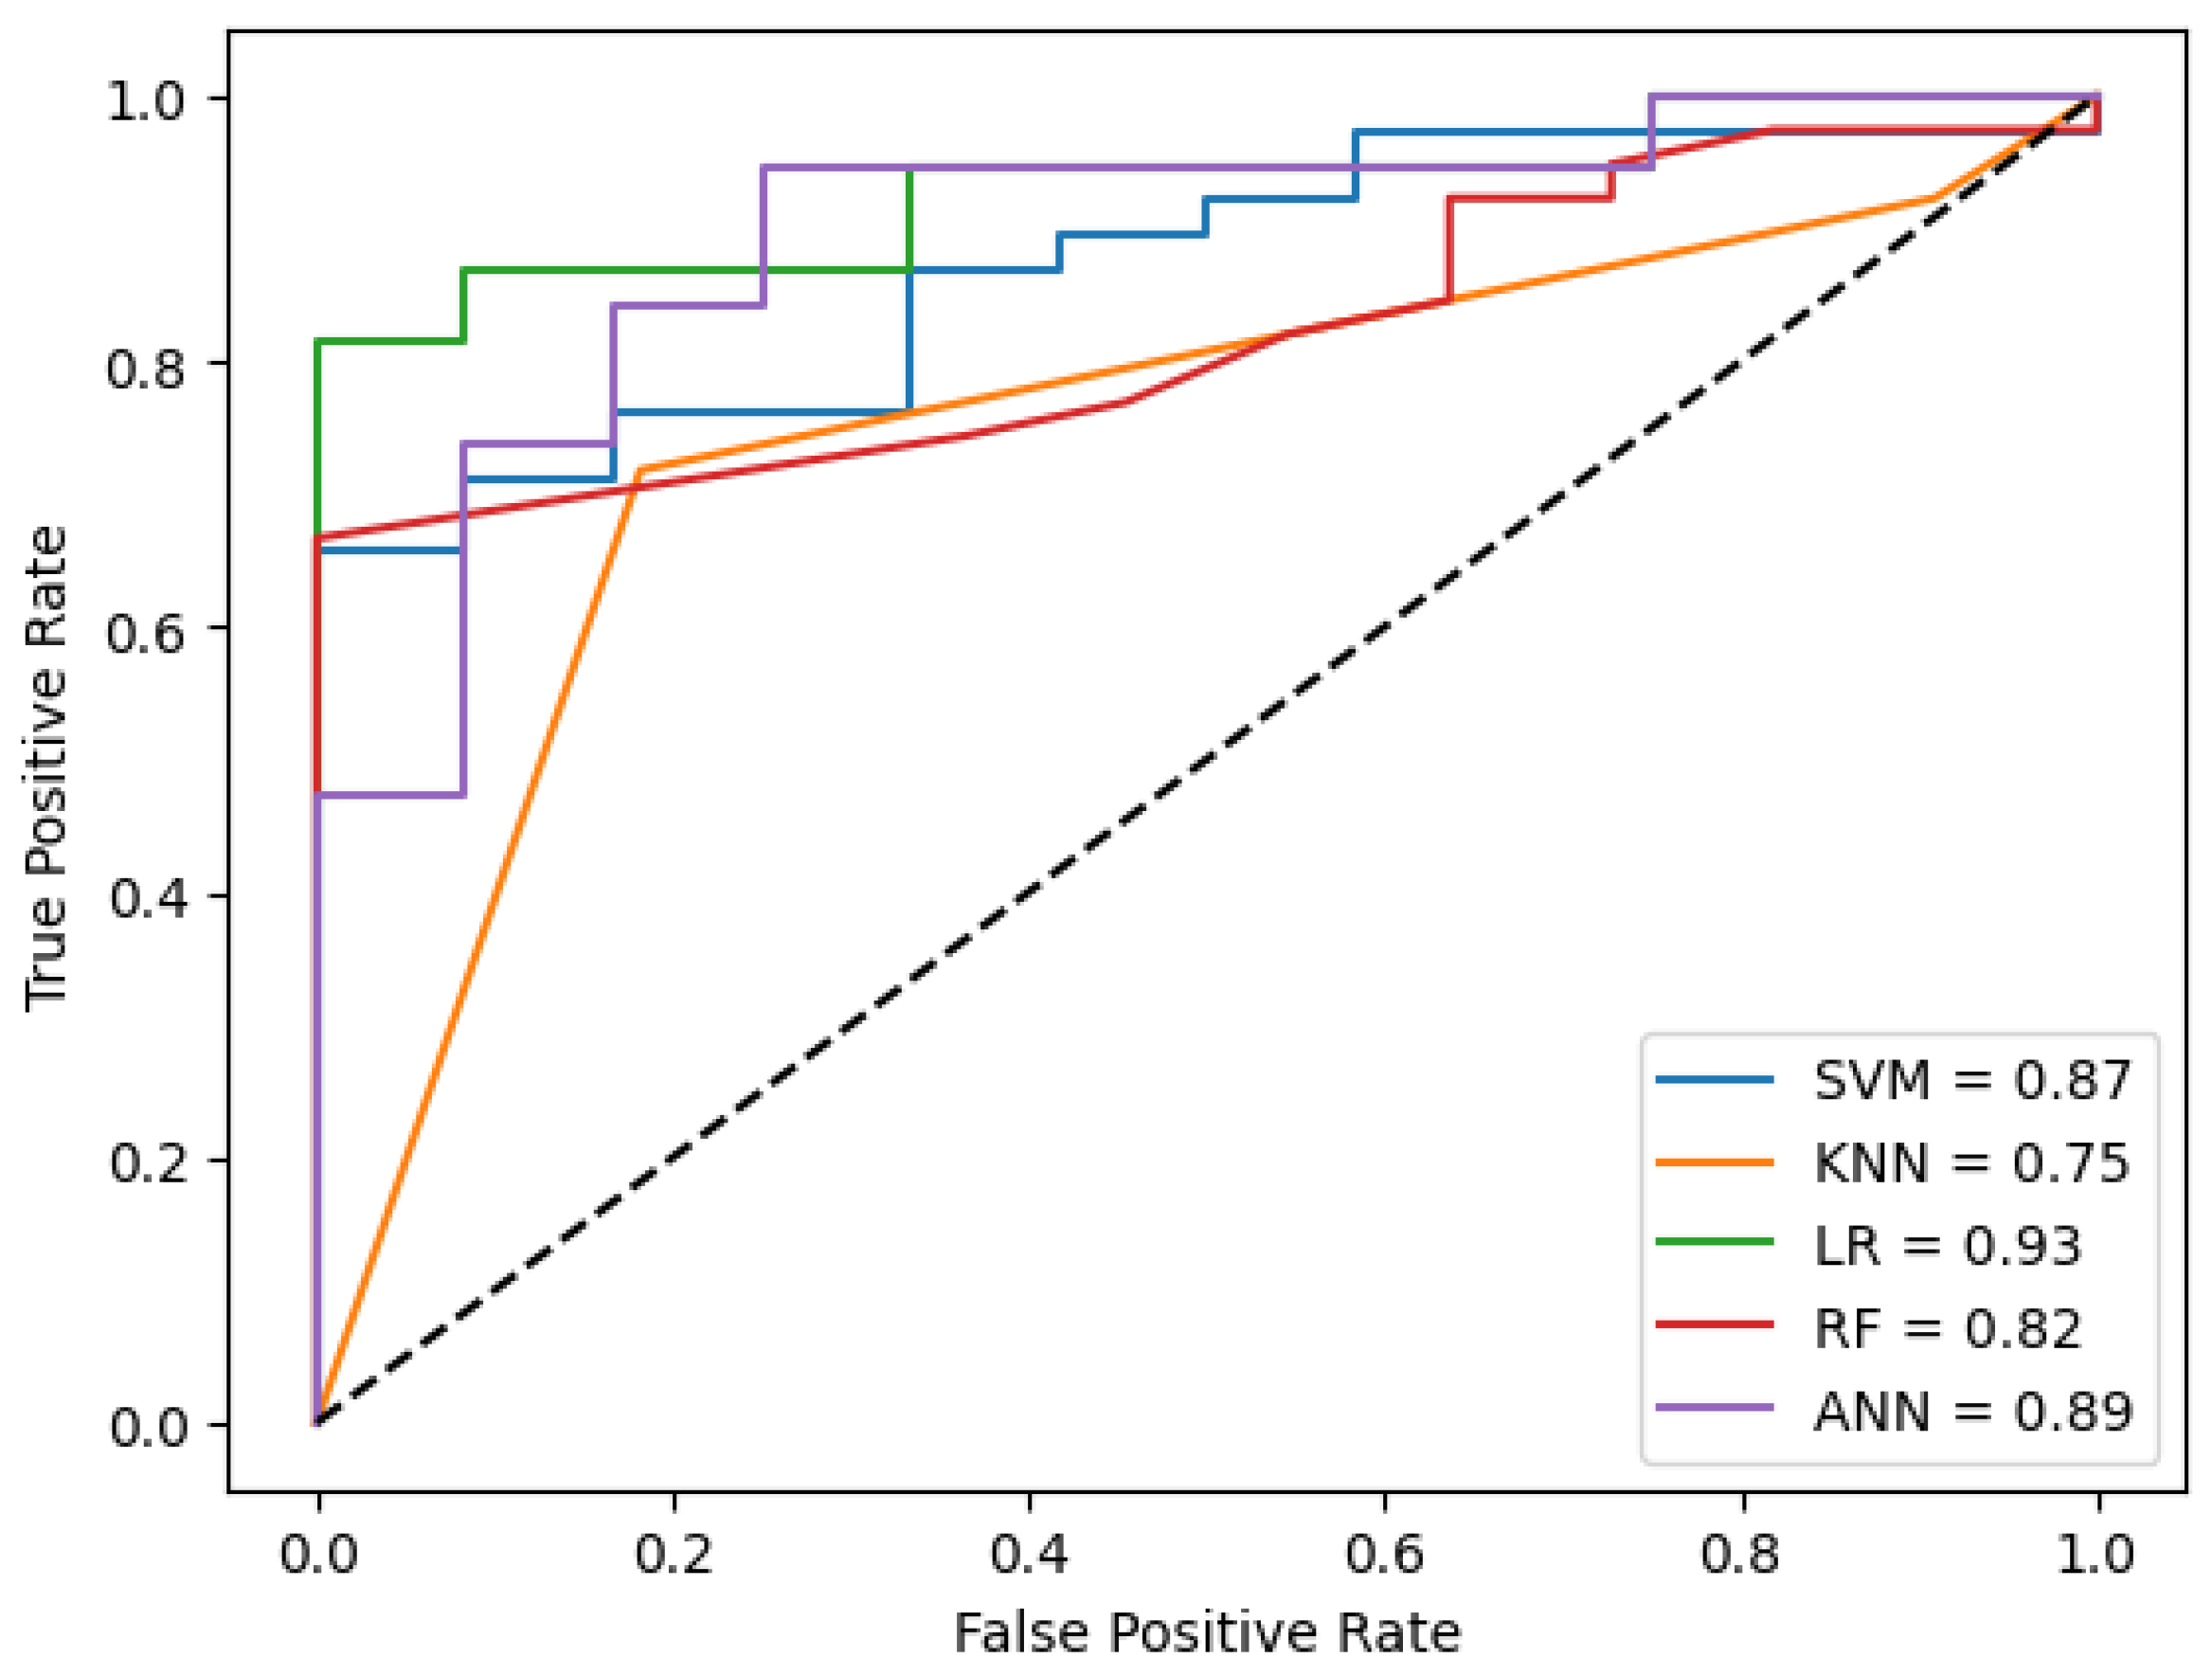
Figure 6 visualizes the ROC curve for the best performance of the models in the cross-validation technique. The results are comparable to those in
Table 2, likely due to the greater predictive value of CD data compared to patient documents, which may contribute to the higher performance observed with CD-based models.
As outlined in the experimental design, four algorithms were selected for the Type B data fusion models (see
Table 7), based on the results from
Table 2,
Table 3 and
Table 4. From
Table 2, LR and SVM were chosen, as they demonstrated better performance compared to the other models. The ANN model was excluded since it was already incorporated into the architecture shown in
Figure 3. Additionally, two models from
Table 3 were selected, as the TF-IDF method outperformed the embeddings approach. Again, LR and SVM were chosen as the most effective algorithms. It is important to note that the AUC metric is not available for the voting classifier, as it was not possible to estimate a probability function based on the votes.
Figure 7 visualizes the ROC curve for the best performance of the models in the cross-validation technique.
When comparing the performance of the four proposed schemes, the CD-based models achieved the highest AUC values, indicating the best results. While combining information from different sources also enabled patient classification, the overall model performance remained unchanged. However, data fusion remains a valuable approach for supporting diagnostic decision-making, particularly in cases where certain patient information is unavailable. For example, some patients may avoid disclosing their HIV status or other critical details. In such situations, patient interviews and PR data can be leveraged to enhance diagnostic accuracy and compensate for missing information.
Despite achieving a sensitivity of
when PR was represented using embeddings and SVM model, and a value of
for TF-IDF representation and RF model, the AUC values (
and
) remained lower than that of the CD-based models (see
Table 2). Comparable studies have reported an AUC of
and a sensitivity of
using a similar set of clinical variables, where an ANN model achieved the best performance [
11]. Additionally, in a resource-limited setting, sensitivity values as high as
have been reported [
12]. However, specificity values in these studies were relatively low, recorded at
and
, respectively. It is important to note that, despite these similarities, differences in the variables used and preprocessing techniques influence the final results.
Regarding the data fusion models, Type A outperformed Type B, achieving an AUC of
compared to
. However, the sensitivity of the Type B model reached
, making it comparable to widely used smear microscopy tests, which typically have a sensitivity ranging from
to
, the first feasible diagnostic option in the Colombian protocol. Ideally, PR should have provided additional information, yet the results remained similar between CD-based models (AUC =
) and the best data fusion model (AUC =
), with a drop of less than one percentage point. Notably, the best PR-based approach achieved the highest sensitivity (
) (see
Table 4), which is particularly valuable when not all data sources are available. In such cases, health professionals can assess multiple diagnostic models and make more informed decisions rather than relying solely on CD or PR in isolation.
A distinctive aspect of this research is its emphasis on leveraging available data to train models in resource-constrained healthcare settings. Many developing countries face significant challenges, including inconsistent health data collection, restricted data availability, and shortages of healthcare personnel, all of which impact the development of reliable models. This research is part of a larger initiative aimed at developing computational intelligence tools to assist healthcare professionals in diagnosing and managing suspected PTB cases more effectively.
The tuberculosis diagnosis program at Hospital Santa Clara relies on two distinct sources of data. The first is structured data collected by nursing professionals, who record acquisition variables based on test results and patient interviews. The second source consists of unstructured data documented by physicians in text reports during patient appointments. These two sources are largely independent and collected at different moments. While they are eventually integrated into the health record through the information system, timely TB diagnosis is crucial for isolating suspected patients and initiating anti-TB therapy.
This study aims to determine whether both data sources are complementary or if one alone is sufficient for diagnosis. Additionally, the proposal seeks to provide an alternative for remote areas where limited digital health infrastructure makes maintaining a comprehensive electronic health record challenging. To enhance the paper, these details have been highlighted in red in the discussion section, following the previous comment.
A key consideration in processing data for NLP applications is the comparison between TF-IDF and embedding techniques. In this study, TF-IDF demonstrated superior performance over embeddings (see
Table 3 and
Table 4), particularly in the CD-based approach, where isolated models performed better with TF-IDF. This outcome may be attributed to the lower complexity of the classification method, a trend also observed in the fusion strategies. Specifically, Type A, which employs a simpler approach, outperformed the more complex Type B strategy. There, three out of five machine learning models achieved better performance than more structured and computationally intensive models. Regarding performance (see
Figure 6 and
Figure 7), this phenomenon is evident, as the Type A fusion achieved better ROC curves compared to other approaches.
The use of NLP and LLMs in TB diagnosis has been explored in various contexts. These include cough signal analysis and embeddings for detection [
49], as well as a feature fusion approach that combines cough signals with spectrogram images [
50], achieving a sensitivity of
from 144 signals. Additionally, text analysis has been used to differentiate TB from COVID-19 based on reported cases [
51]. Other studies have compared NLP-based image analysis with radiologist-generated natural text from chest radiographs (CXRs) [
34] and developed a report generation system for lung diseases by fusing text reports with CXR images, achieving an accuracy of
on a dataset of 3955 images [
52]. Furthermore, laboratory test results, tumor markers, and imaging analysis were used to classify 296 patients with spinal TB and spinal tumors using ChatGPT (Version 4) and ML models. The results showed that ChatGPT’s performance was suboptimal, with a sensitivity of
[
53]. While similar studies have explored the fusion of structured and unstructured data for TB prediction—achieving a mean AUC of
across different models [
54]—the present study’s approach, which focuses on basic text from a specific segment of the EMR, remains largely unexplored. Notably, the aforementioned study analyzed 692,949 patients and incorporated more advanced clinical variables (e.g., hemoptysis, cough, and erythrocyte sedimentation rate), making direct comparisons challenging. Additionally, a multimodal approach leveraging EHR datasets, various clinical notes, LLMs, and hypergraph modeling of structured EHR data was introduced by [
31]. Although this method achieved AUC values of
and
on two different datasets, it was applied outside the TB domain. A pre-trained model combining text reports and CXR images achieved a validation accuracy of
[
52], though a notable distinction was the use of approximately 3800 images from a well-established dataset. Finally, exploratory studies have leveraged NLP to extract TB-related information from EMRs [
38,
55], yet none have implemented classification for diagnostic support. These findings underscore the potential for future research to refine and expand this field further.
In the specific context of PTB diagnosis, clinical signs and symptoms serve as the initial indicators, identifying a patient as a potential case. According to the Colombian national protocol, at least one of the three diagnostic tests outlined in the introduction is required for confirmation. Smear microscopy, which involves analyzing sputum samples under a microscope to detect Mycobacterium, has a sensitivity of only 40–60% due to the high bacterial load needed for detection [
56].
The present results, particularly the models based on embeddings and Type B data fusion, achieved sensitivity values of
and
, respectively. These models could serve as viable alternatives when only smear microscopy is available, assisting healthcare professionals in patient assessment. A more sensitive test, such as culture in solid or liquid media, requires at least two weeks and specialized infrastructure [
57], which may not be feasible in low-income settings. The most advantageous option in terms of speed and accuracy—the molecular test—is also largely inaccessible in Colombia, where fewer than twenty certified facilities can perform it [
58]. Furthermore, reliance on sample transportation presents logistical challenges that may compromise test integrity. Given these constraints, improving infrastructure for advanced diagnostic methods remains a priority in developing countries like Colombia. Meanwhile, the present proposal could provide valuable clinical insights, supporting timely diagnosis and treatment initiation.
The main limitation of this study is the dataset size, which impacts the ability to train robust ML models. In AI applications, larger datasets generally lead to better performance. However, the data used in this study were obtained from a real-world setting at Hospital Santa Clara, one of the institutions treating the highest number of PTB patients. Integrating data from multiple healthcare centers and consolidating records prior to confirmed diagnoses remains a significant challenge, even within the same city. Additionally, access to data with consistent characteristics is constrained by national protocols for reporting TB cases.
Moreover, while the advancements in LLM architectures, particularly Transformers, offer promising avenues for text-based medical analysis, they were beyond the scope of this study. Future research could explore these architectures for deeper insights. However, a critical challenge with such approaches is the need for a significantly larger dataset to properly train and fine-tune the models. Expanding the dataset depends on the epidemiological characteristics of the disease and the availability of data from medical centers. Although this study’s dataset is relatively small, it represents the most comprehensive PTB patient data available from Bogotá, D.C.’s leading treatment center.


 ,
, 


