1. Introduction
The diversification and expansion of businesses have become essential strategies for modern enterprises, with large corporations increasingly transitioning from singular business models to diversified ecosystems. In these ecosystems, services are interconnected and collaboratively evolve to meet dynamic market demands [
1]. The service ecosystem is multi-layered, with foundational services at the base providing stability and support, while interactions between different service sectors at the top drive innovation [
2] and resource integration [
3]. This interconnectedness enables the development of composite services that generate value through cross-field collaboration. As consumer demands become more complex, enterprises must innovate by integrating diverse resources and exploring new service compositions to maintain competitiveness in a rapidly evolving market [
4].
Despite extensive research on individual services, comprehensive studies on service ecosystems remain underdeveloped [
5]. At present, research in this field faces many challenges. Firstly, computational experimental results lack a theoretical foundation. In the few relevant studies, the lack of theoretical support for computational experimental results is a common problem, which may reduce the credibility and interpretability of the experiments. In addition, it is difficult to design or implement computational experimental systems. Most previous work in this area has focused only on the supply–demand relationship between service providers and demanders, ignoring that the service ecosystem is a complex system influenced by multiple factors [
6]. Therefore, the Lotka–Volterra model is introduced to explore the competitive and cooperative relationships among services. Considering that the characteristics of services in service ecosystems are more complex than populations in biology, we also extend the binary Lotka–Volterra model to a ternary model and improve the service evolution in response to social environmental factors and service dynamics. In addition, an adversarial game algorithm is utilized as the decision-making method for service agent nodes to experiment the evolutionary patterns of service ecosystems, and a genetic algorithm is designed as the model for service evolution.
The contributions of this paper can be summarised as follows:
The Lotka–Volterra model is introduced from biology into the field of service ecosystem research, and a novel extended ternary Lotka–Volterra model is proposed to address the influence of social environmental factors and service dynamics on service evolution.
A computational experimental system integrating adversarial game algorithms was designed to study the competition–cooperative evolution model of services.
Combining the experimental results with the analysis of the real world, it is concluded that moderate competition among the original businesses is conducive to the development of new composite businesses, while excessive cooperation will hinder the survival and growth of new businesses in the market.
2. Related Work
The service ecosystem is a complex system involving multiple service providers, consumers, and other stakeholders, aiming to create value for all parties within a specific service field [
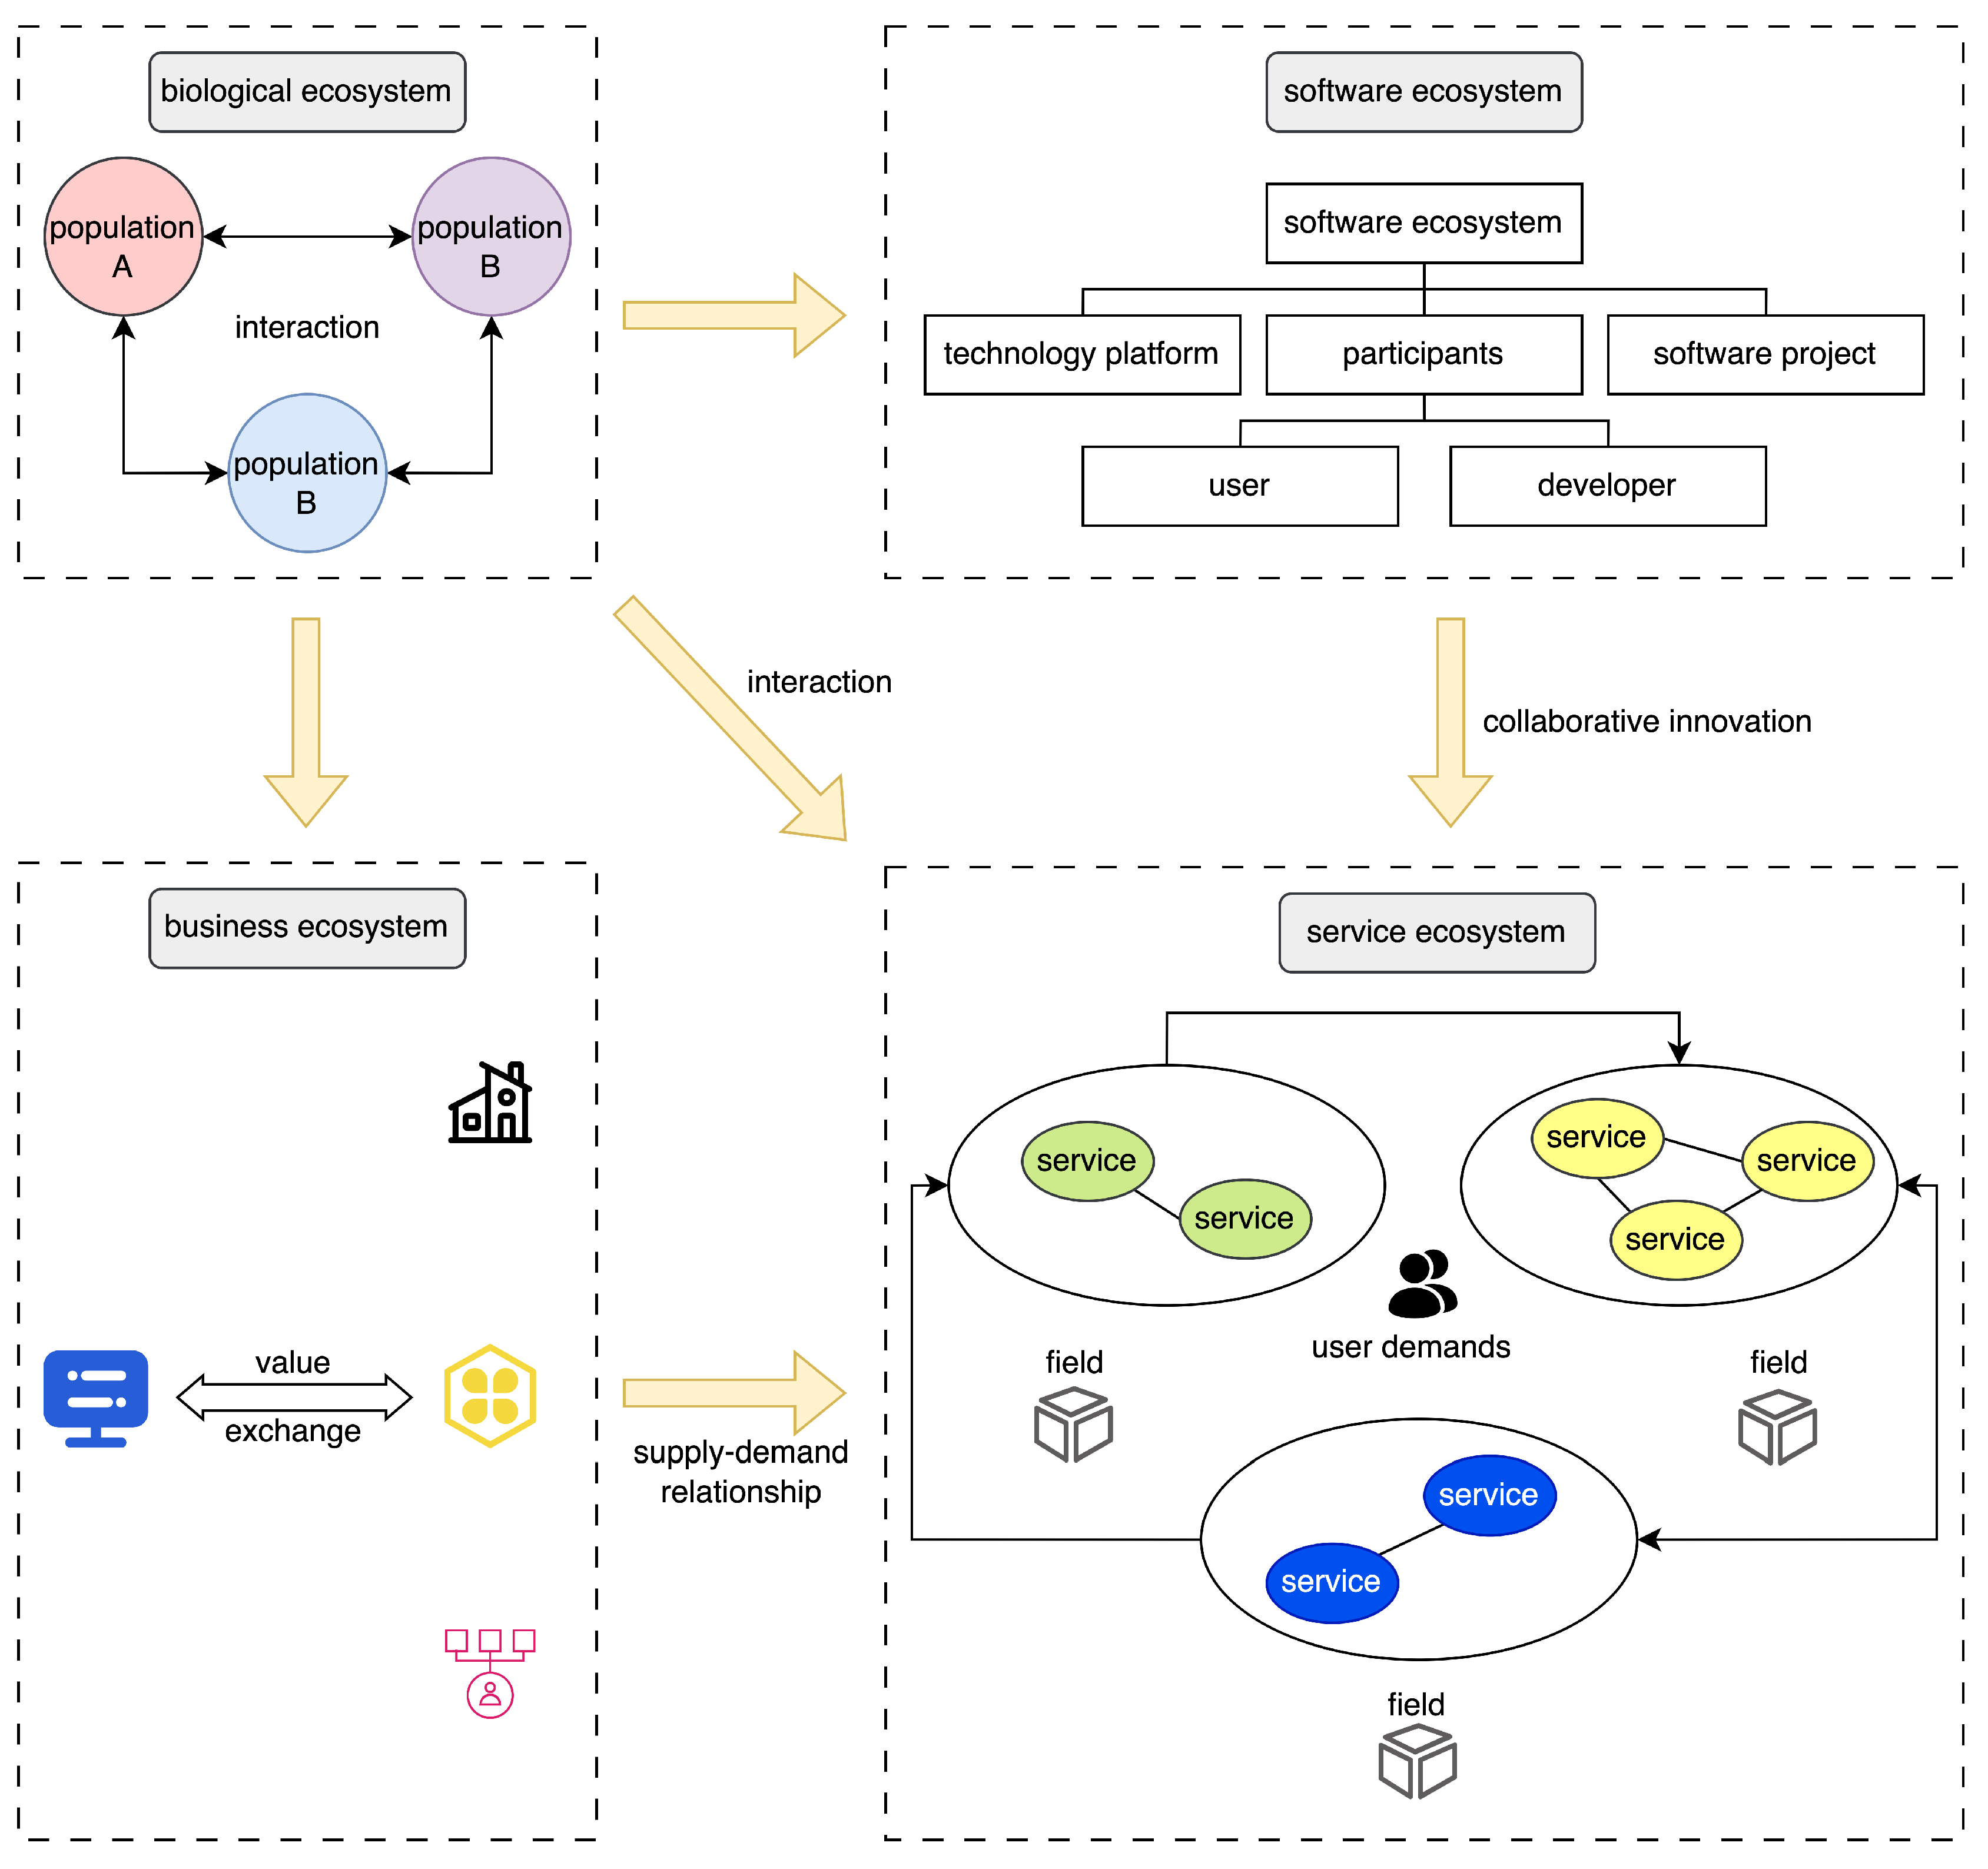
7]. This concept, inspired by biological ecosystems, has evolved into an independent theoretical framework with the development of commerce and the digital age. Ecosystems originally stemmed from biology, where they refer to a community of organisms and their associated physical environment in a specific location, with research focusing on the interactions and relationships between organisms and the environment, forming a complex network of exchange and competition. This interdependent relationship has influenced the understanding of interactions among service providers, consumers, and other stakeholders. With the digital age’s advent, the software ecosystem, composed of developers, users, platform providers, and other interested parties, emerged, characterized by openness, diversity, regulation, and sustainability [
8]. The evolution of business ecosystems began by questioning the traditional industrial chain model, as it became clear that the conventional competitive model could not meet rapidly changing market demands and consumer expectations. The development of information technology and globalization deepened the interconnectedness between enterprises, fostering the emergence of business ecosystems, where multiple enterprises, organizations, and individuals interact, compete, and collaborate within a specific market or industry [
9]. The service ecosystem, building on earlier ecosystem concepts, focuses on service as its core and value creation as its engine [
10], aiming to provide integrated and complete service solutions through collaboration, innovation, and sharing. In this ecosystem, all parties contribute to forming a dynamic, evolving network to meet changing needs and expectations [
11]. The service ecosystem’s development, inspired by earlier ecosystems and incorporating innovative ideas and technical advancements, is an emerging field that adapts to contemporary social development, with its application gradually shifting from material to service [
12], as shown in
Figure 1.
At present, a large amount of related research has been conducted in the academic community on service ecosystems, which mainly includes studies on the architecture of service ecosystems, the requirement engineering of service ecosystems, computational experiments in service ecosystems, and autonomic computing in service ecosystems. Liu Yi et al. [
13] proposed a set of definitions and structures of service ecosystems and established a three-dimensional network model. In addition, they introduced and discussed the general dynamic activities of services and then summarized the main critical indicators of service ecosystems. Moreover, they established a research framework, and gave the correlation among dynamic activities, correlations, and indicators. Florian Schierlinger et al. [
14,
15] used the value-based network method and modeling tool EcoViz to conduct conceptual modeling based on existing information at different levels of the system, iteratively building conceptual models of ecosystems. Moreover, they presented four real cases from different fields and expounded the application mode and scope of EcoViz. Boley, Dhaminda, and others [
16,
17] defined the following basic elements of service ecosystems: ecosystem members, ecosystem infrastructure, ecosystem capacity, and ecosystem services. Ecosystem members mainly include service providers, service agents, service consumers, and infrastructure providers. Li et al. [
18] reviewed different analogies of biological ecosystems and analyzed the constituent elements and characteristics of SOBE. Moreover, they proposed a topological structure based on the analysis of SOBE. Finally, they proposed a service ecosystem architecture composed of service providers, service consumers, and infrastructure providers, and defined its lifecycle. Eila Ovaska et al. [
19] proposed the basic definition and elements of a digital service ecosystem, as well as a scenario-based service requirement engineering method for a digital service ecosystem. They demonstrated the application of this requirement engineering method through a practical case, and showed that the service ecosystem promotes value creation and co-development of services in the value network through certain ecological regulations.
At the level of evolutionary analysis, Liu et al. [
20] modelled the service ecosystem as a multi-layer semantic network, including an event layer, a stakeholder layer, a service layer, and a field layer. They incorporated the “event layer” into the model and used a rule-based approach to describe a specific mapping pattern from an event to one or more evolutionary relationships. Finally, by analyzing information (e.g. news headlines) over a certain period of time, evolutionary rules were generated to enable the network structure to show the continuous evolution of the service ecosystem. O Adeleye et al. [
21] used a complex network-based analysis method for the Web API-level service ecosystem and conducted research on related aspects of service discovery through the changes in the network degree and power-law rules. Huang et al. [
22] proposed an innovative three-stage network prediction method (NPA) to overcome the neglect of service ecosystem evolution by existing methods. Through the introduction of a network sequence model, network analysis method, and ranking aggregation, the perception and prediction of the evolution of service ecosystem are realized, so as to provide more accurate service recommendation. Zhong et al. [
23] proposed a method to extract service-evolution patterns by using Latent Dirichlet Allocation (LDA) and time-series prediction methods, thereby improving the service recommendation framework based on collaborative filtering and content-matching methods. Lyu et al. [
24] proposed a three-level view model to further visualizing the service ecosystem and discussed the model and construction method of each level diagram, as well as their structural characteristics.
On the computational science level, Zhou et al. [
25,
26] proposed a three-layer model of a cloud manufacturing service ecosystem: individual layer, organizational layer, and social layer, which more comprehensively considered the organizational structure and social relations among service agents, and verified the validity of SLE2 model to a certain extent through computational experiments. Xue et al. [
27] linked the operating state of the service ecosystem with value creation and proposed a value entropy model to assess the health of the service ecosystem. Then, a computational experiment system is established, which verifies the validity of the value entropy model to a certain extent. At the same time, they also tried to adjust parameters in the computational experimental environment to affect the behavior of service individual agents (including fairness of cooperation, cooperation strategy, etc.), and designed a variety of experimental scenarios to compared the impact of different scenarios on the evolution of service ecosystem. Feng et al. [
28] discussed the evolution mechanism and expansion boundary of intelligent digital service ecology by using the computational experiment method as a means of analysis and deduction. Taking the field of elderly care as an example, they introduce the application of service ecosystem evolution theory in this field. The construction of an elderly care service ecosystem is based on optimizing market resource allocation and cross-sector service value chains in health and elder care. Through strategic analysis, evolutionary control, and evaluation methods and models, they analyze the evolution of the elder care service ecosystem. Khlie et al. [
29] utilized the Long Short-Term Memory (LSTM) network and variational autoencoder (VAE) to study the application of generative artificial intelligence models in demand forecasting, thereby improving the accuracy of demand forecasting to optimize inventory management and meet customer demands.
3. Service Competition–Cooperation Evolution Model
In the whole service ecosystem, competition and cooperation are the core driving force of service evolution and development. In this chapter, the Lotka–Volterra model of biology is introduced into the field of service ecosystem for the first time, and its adaptation is adjusted to some extent, so as to serve as the theoretical basis for the service competitive-cooperative relationship in the process of service ecosystem evolution.
3.1. Ternary Lokta–Volterra Service Competition–Cooperation Model
In the traditional biological population theory, the Lokta–Volterra model is an extension of the Logistic model, and its process is mainly determined by three factors: the number of the population
, the observation time of the evolutionary model
, the environmental capacity of the population
and the growth rate of the population
. Therefore, the detailed logistic regression is as follows:
In service ecosystems, the coexistence of competition and cooperation among services is known as “competition-cooperation”. This phenomenon is increasingly prevalent in the modern business environment, where the key strategy lies in identifying collaborative opportunities even in highly competitive markets to achieve mutual benefits. Existing services compete for limited market space while simultaneously leveraging cooperation and integration to enhance their competitiveness, evolving into composite services better suited to current market demands [
30].
Newly evolved composite services inevitably participate in the competitive–cooperative relationships within the service ecosystem. These new services may challenge the market positions of existing services, particularly when they offer more efficient, cost-effective, or superior user experiences, which inevitably intensifies the battle for market share. Conversely, new services can also expand their market reach through collaboration with existing services, such as through service bundling or cross-selling. This complementary relationship can provide a more comprehensive solution to consumers.
From a comprehensive perspective, the competitive–cooperative relationships between existing and new services are dynamic, continuously evolving in response to changes in the market environment, technological advancements, customer needs, and strategic directions. Depending on the context and timing, these relationships may exhibit varying degrees of competition or cooperation.
Based on the above analysis, the service competition–cooperation evolution model can be obtained as shown in Equation (
2):
where
represents the size of class service
i in the service ecosystem,
,
are regarded as the original two types of atomic services, and
is regarded as the newly evolved combined services. The
indicates competition between services, and
indicates the influence of class service
i on
i, which is called the interaction coefficient among services.
Moreover, the Equation (
3) can be simply expressed as:
where
, it indicates the strength of the interaction and the type of interaction;
represents the intrinsic growth rate of service
i;
represents the population size of service
i;
represents the carrying capacity of service
i.
3.2. Ternary Lokta–Volterra Improvement Model
The Lotka–Volterra model is used to describe the dynamics of the interaction between two species in biology, but in the process it only considers the effect of changes in the size of the species on its growth rate. However, service ecosystems have more complex dynamics and influencing factors than natural ecosystems.
3.2.1. Social and Environmental Factors
In the natural and scientific fields, entropy is an omnipresent concept. In physics, chemistry, biology, information theory, and other fields, entropy has its unique meaning and application, such as the commonly used loss function of cross-entropy in deep learning [
31], statistical mechanical entropy from the perspective of microscopic particles [
32], and value entropy in the natural social environment [
33]. The second law of thermodynamics states that in an isolated system, spontaneous processes always increase the system’s entropy, and the higher the entropy, the greater the complexity of the system. This theory also applies to the evolutionary processes of service ecosystems, where social environments can exert driving forces or resistance.
According to the entropy theory, the service ecosystem will adapt to the current market environment with the entropy change effect [
34,
35]. The types of services tend to be diversified and complicated gradually, and the uncertainty of the system increases. Meanwhile, changes in the social environment, such as economic fluctuations and technological innovation, may also lead to the increase of entropy in the system. Moreover, with the mature supervision mechanism and the stability of the social environment, the standardization of services will be improved, and the entropy in the system will be reduced.
Based on the above analysis, entropy-increase (
) and -decrease (
) models applicable to service ecosystems affected by social and environmental factors can also be proposed:
where
represents the influencing factors of social environment on the entropy change of service ecosystem, such as economic factors, technological change factors, policy and regulation factors, etc, and
represents the influence weight of the influencing factors in the social environment on the service ecosystem. The
represents a specific event in one of the influencing factors. For example, a series of game recharge policies have been recently announced, which restrict incentives such as first recharge and continuous recharge, which has caused a shock to the game industry, resulting in the cancellation of a large number of Internet companies researching games and a decline in the environmental capacity of the entire game industry.
represents the probability that the event will have an effect on entropy.
The influence of social environment on the entropy increase and decrease of the service ecosystem will not change the interaction relationship between services themselves, but will affect the environmental capacity of some services. Therefore, according to the entropy theory, the three-way service competition–cooperation model under the influence of social environment can be obtained:
where
represents the influence coefficient of this social environment on service
i.
3.2.2. Service Dynamics
In biology, population changes are usually affected by evolutionary forces such as gene mutation, natural selection, and gene flow, which take multiple generations to significantly change the characteristics of the population. Therefore, the impact of the population on the environment is relatively stable over a short time scale. In contrast, in a service ecosystem, even uniform types of services are constantly undergoing rapid change and adjustment due to multiple factors.
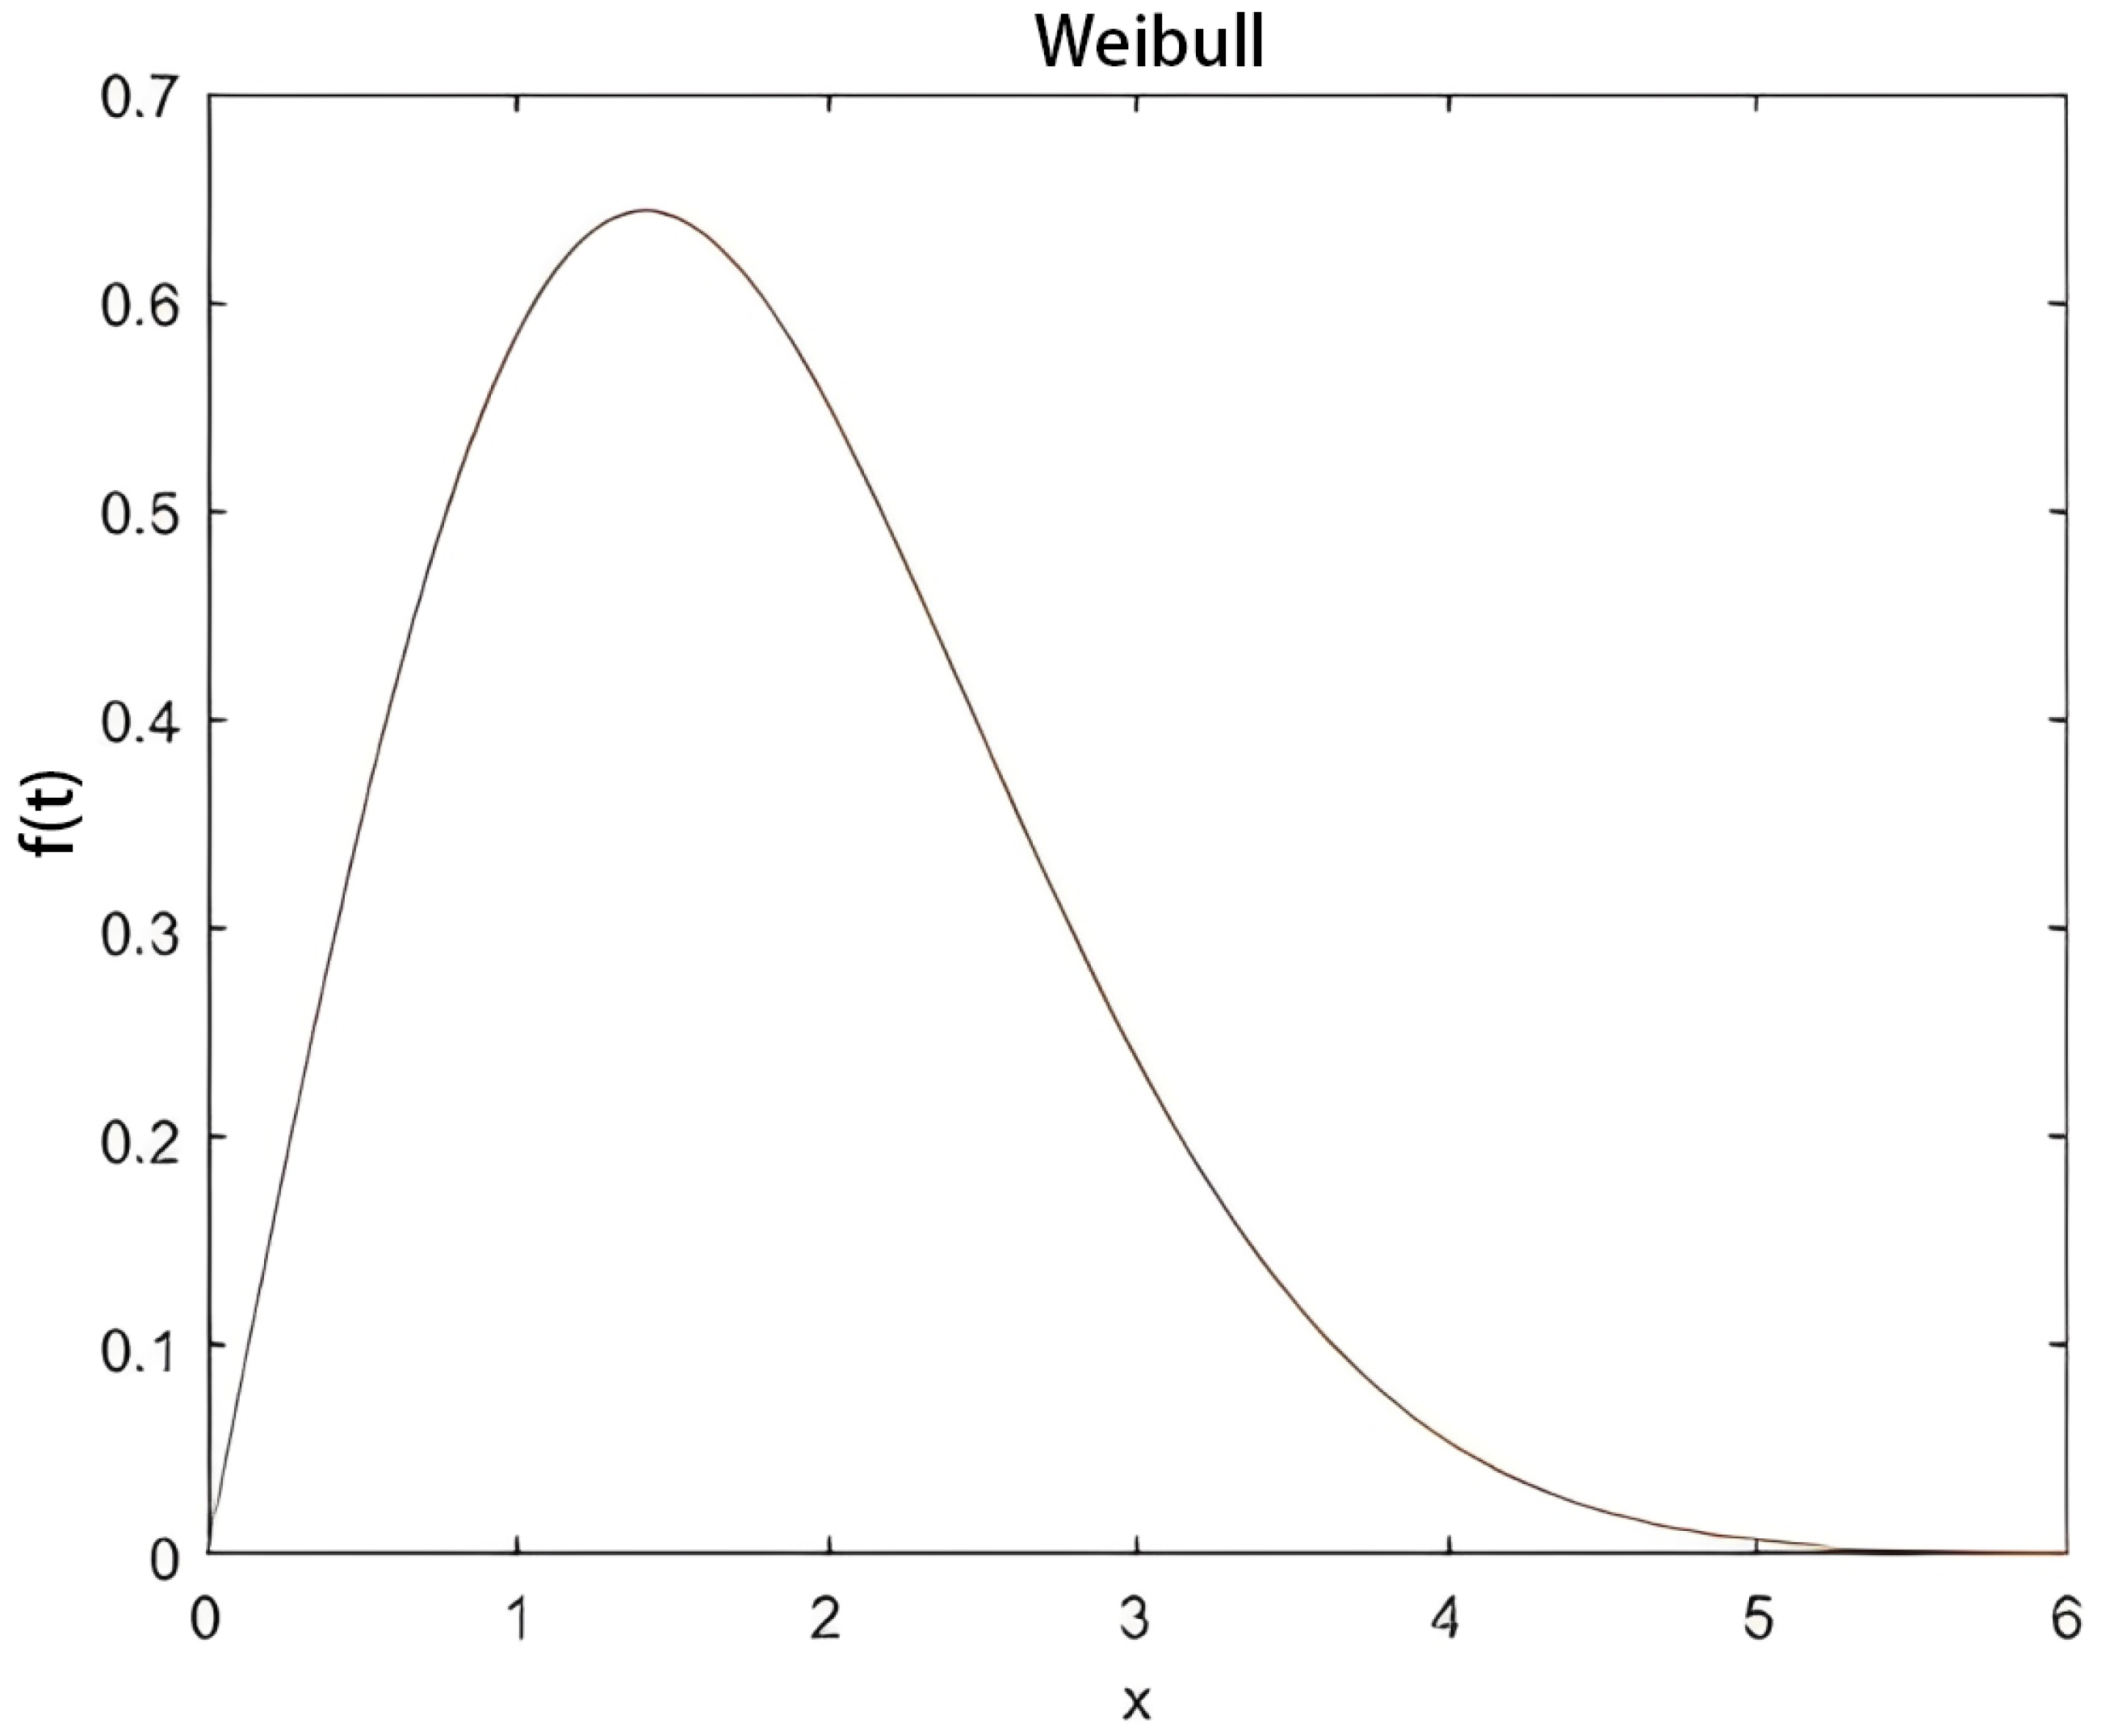
The lifecycle of service with the change in market can be divided into germination, growth, maturity, and decline periods. To model the lifecycle dynamics of services, we employ the Weibull probability density function—a flexible continuous distribution widely used to characterize time-dependent phenomena like failure rates or adoption curves. In this section, the Weibull probability density function can be expressed as:
where
t represents the time,
denotes the competitiveness of the service itself in the market,
k and
are the variable parameter weighting of various influencing factors of the competitiveness of the service. The extreme point
of the function can be calculated by taking the derivative of Equation (
6), where
determines the time and size of the service competitiveness reaching the peak, and k only determines the size of the service competitiveness peak. When
k = 3 and
= 0.4, the Weibull probability density function curve is shown in
Figure 2.
From the perspective of service ecosystem, the factors that affect the competitiveness of a class of services are quite diversified, and the common factors include service technology dependence T, including the degree and popularity of new technologies or new business models adopted; the degree of service standardization Q, whether the service can be replicated and expanded quickly; user acceptance of the service U, whether the service meets user expectations; service compliance L, whether the service meets relevant laws and regulations, etc.
By combination with the common influencing fators and the analysis of the extreme value of Weibull curve, the following relationship can be shown: , , where represents the influence weight of factor i, and O represents other influence factors.
The impact of service dynamics in a service ecosystem is not between services, but rather the competitiveness of the services themselves to change over time in the system. Therefore, combined with Equation (
7), a ternary Lokta–Volterra improvement model can be obtained considering social environmental factors and service dynamics:
where
represents the impact factor of the dynamism of class
i service on that service;
represents the intrinsic growth rate of service
i;
represents the population size of service
i;
represents the carrying capacity of service
i;
represents the social–environmental impact on service
i.
Similarly, if the growth rates of the three types of services are all set to 0 simultaneously, the equilibrium equations can be obtained, and the eight social environmental factors and the local equilibrium points and stability conditions in
Table 1 for the dynamic stabilization of the service industry can be obtained. The local equilibrium points are as follows:
where the
are as follows:
and its Jacobi matrix and stability conditions are as follows:
where the
,
,
are as follows:
The competitive and cooperative relationship of ternary services is obviously more complex. In the theoretical model, each type of service is indeed likely to disappear, especially in environments with fierce competition and limited resources. However, in actual service ecosystems, there are often multiple market regulation mechanisms and service-evolution strategies that aim to maintain the diversity and stability of the ecosystem. Due to the constantly improving inter-service regulation rules over time, although service extinction is possible, the probability of complete extinction is relatively low.
4. Results
To deeply explore the inherent law of service ecosystem evolution and have practical experimental means, this paper adopts value exchange as the core driving force of the system, and independently designs and implements a computational experimental system based on the agent model.
4.1. The Overall Design Process of the System
In the pre-processing phase of the experiment, the grid map environment in which the experiment is located will be initialized. Then, set the size of the environment grid of the map, determine the types of service proxy nodes and demand proxy nodes, determine the initial scope limits of various proxy nodes, and divide the service area.
In the initial stage of evolution, a certain number of different types of service agent nodes will be randomly generated in different locations of the map in the whole computing experiment environment. Each service proxy node has different attributes according to Gaussian distribution, and may exhibit different behaviors and states at different time stamps according to the surrounding environment of the service proxy node itself.
With the progress of the experiment, several different types of demand proxy nodes are randomly generated in the experimental map environment at a fixed time stamp at every interval, including simple atomic-type requirements and complex requirements. The existence of demand agent nodes encourages all kinds of service agent nodes in the map to fulfill the needs of demand agent nodes through cooperation, so as to obtain corresponding value, evolve and develop, and avoid dying out because of living beyond the means. Each demand proxy node also has different attributes, and the value provided is also different when the service type and quantity are different. At the same time, it has different effective times, when the effective time is not solved by the service agent node, then it will disappear from the map.
At different operational timestamps, each service agent node captures environmental information within its scope, including the attributes and behaviors of various demand agent nodes and other service agent nodes. Based on certain strategies, it makes movement decisions to determine the direction towards which demand agent node it should move, attempting to collaborate with other service agent nodes to fulfill the demand agent nodes on the map, thereby earning profits and achieving evolutionary development. During the operation, service agent nodes may experience different lifecycle states as their assets or behaviors change.
After a period of calculating the time stamp within the experimental system, the entire service ecosystem has undergone an evolutionary cycle. Each type of service agent node has different quantity and asset scale, which represents the service competition pattern in the current service ecosystem.
4.2. Design of Service Proxy Nodes
Service agent nodes play a vital role in the system, they constantly adapt to the environment changes, and meet the different demands of the environment in a dynamic and intelligent way. By efficiently matching demand and supply, the service agent node completes the corresponding demand and earns profits according to certain market rules.
4.2.1. Design of Service Proxy Node Properties
Table 2 provides an explanation of the properties of the service proxy nodes designed in the computational experimental system.
4.2.2. Service Proxy Node Mobility Strategy
In terms of mobile decision design for service proxy nodes, this paper uses a more realistic environment based adversarial game approach. From a realistic comparison perspective, this paper maps the relevant decisions made by service providers in the real world into an adversarial game, where the two parties in the adversarial game correspond to market regulators and service providers respectively. The purpose of market regulator regulation is to maximize the total profits in the local market, while the service provider decision-making is to maximize their own profits. Both parties continuously coordinate and communicate until a solution that is satisfactory to both each other. The detailed flowchart is shown in
Figure 3.
In the computational experimental system, adversarial games are manifested in the mobility strategy of service agent nodes. Service agent nodes consider changing their own node decisions under the influence of market regulators to maximize the current individual node’s profits, while market regulators consider changing the mobility decisions of all service agent nodes within a certain area to maximize the total market revenue within the area. Based on the decisions made by the other party, both parties continuously adjust the game to seek a consistent strategy combination, that is, to achieve equilibrium in the game, and ultimately determine the decision-making behavior of the service agent node.The expression for maximizing the benefits of both parties in the game is shown in Equation (
26):
where
represents the profit calculation function of the service proxy node;
represents the profit calculation function for all service agent nodes in the regional market; The parameter
a in
represents the service proxy node that needs to be adjusted to achieve maximum revenue, while the parameter b represents the fixed service proxy node;
represents the
i-th service proxy node;
represents service proxy nodes other than the i-th node;
represents the mobile decision made by the
i-th service proxy node to maximize the interests of party
j;
represents combining the strategies optimized respectively by the service agent nodes and the market regulators into a final decision set.
To some extent, adversarial game decision making is a method for achieving optimal solutions. However, it often lacks advantages in terms of the computational complexity and the number of iterations required to reach a final decision. To shorten the runtime of computational experiments and reduce experimental costs, two thresholds, and , are introduced on the basis of adversarial game decision making. The first threshold, , limits the number of computations required for a single game. This is determined by the time complexity and is calculated based on the number of service agent nodes and demand agent nodes involved in the current game. If the number of computations exceeds the threshold , the game is considered too complex and needs to abandoned. The second threshold limits the number of iterations in the game, and if the number of iterations exceeds the threshold , the game is considered too difficult to balance and is abandoned. If the game is abandoned, a pure strategy method (such as nearest demand first, maximum profit demand first, or most densely demanded area first) is randomly selected from the strategy pool as a fallback solution to assist the current service agent node in making movement decisions.
4.2.3. Service Proxy Node Lifecycle
At different run-time stamps, service proxy nodes may have different behaviors and states. Based on the realistic analysis corresponding to SEEF model, the lifecycle of service proxy nodes is set into four states: survival, extinction, fragmentation and evolution. The lifecycle state-transition process is shown in
Figure 4.
Within the time stamp of each experiment, the service agent node attempts to solve the corresponding needs of the demand agent node by moving in the experimental environment, so as to obtain profit distribution and achieve asset accumulation. At the same time, in addition to the increase of assets, the assets of service agent nodes may also be affected by market regulation factors and environmental factors. Due to environmental factors, each service proxy node has a certain operating cost per timestamp. For some service agent nodes whose service quality is too low, market regulatory factors will also impose a certain amount of penalty on the service agent nodes.
Survival and Extinction States: When the assets of a service agent node remain positive, it represents that the service agent node is in a survival state; conversely, when the assets of a service agent node are negative, it indicates that the service agent node is in an extinction state and will be removed from the experimental environment.
Splitting State: When the assets of a service agent node accumulate to a certain threshold, it triggers the mechanism of reproductive splitting. By inheriting some attributes and behaviors from the parent node, the service agent node generates two offspring nodes, and further expanding market share and enhancing market position.
Evolutionary State: The emergence of novel complex demands implies the birth of emerging markets. To enhance competitiveness, service providers collaborate with each other, leveraging their respective resources to introduce composite services quickly to meet complex demands and seize emerging markets. During the process where different types of service agent nodes collaborate to fulfill complex demand agent nodes, new composite types of service agent nodes are randomly generated through genetic algorithms, aligning with real-world market operations.
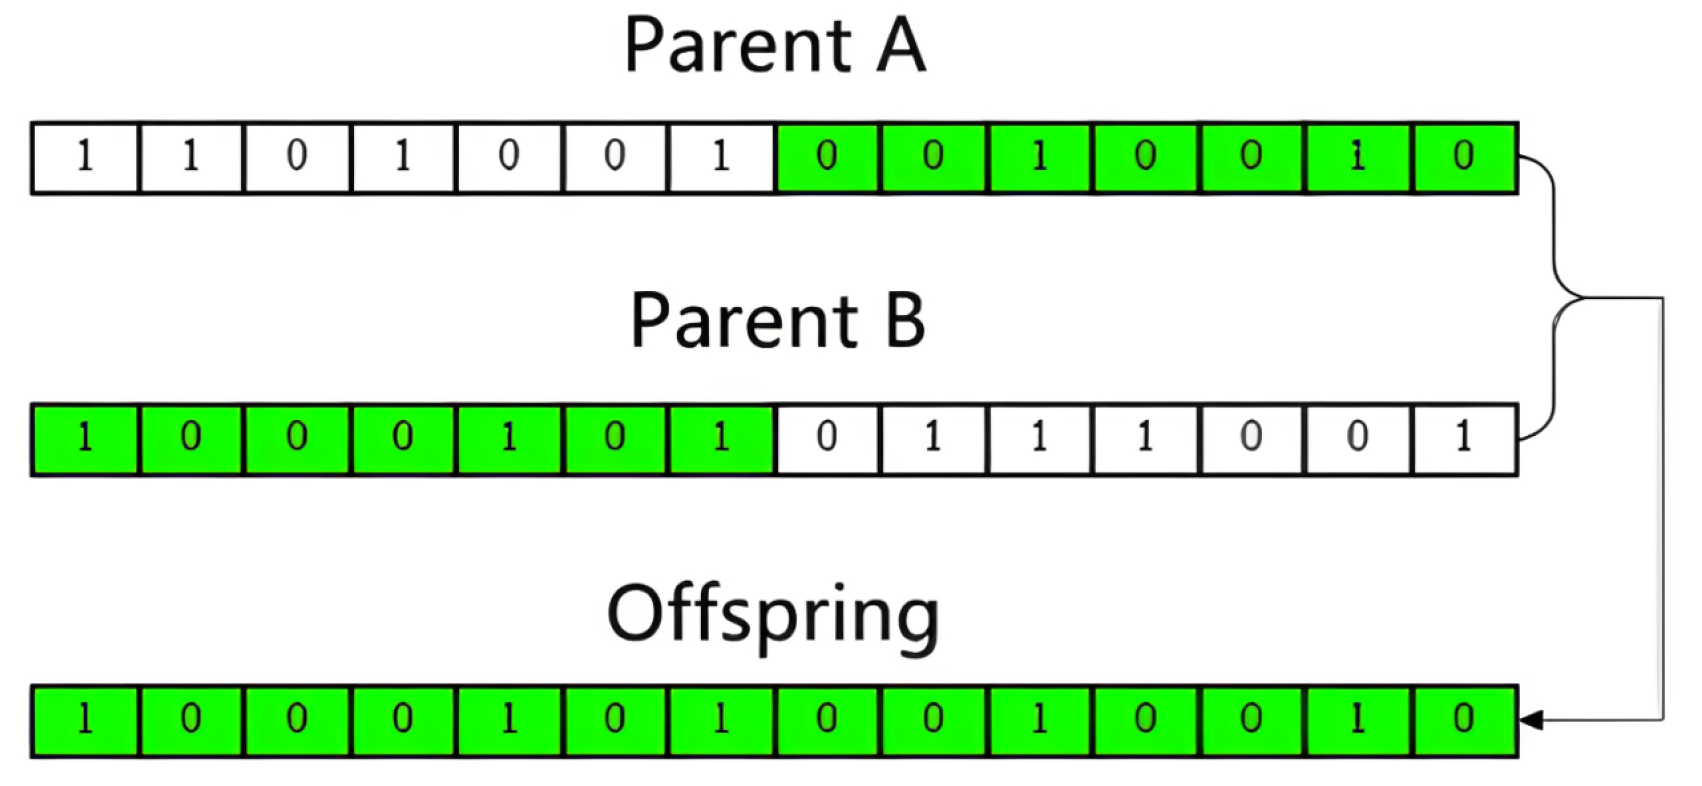
In the design of computing experiment system, as shown in the
Figure 5, the service type of each service proxy node will be set as an integer number, which can be regarded as a series of binary 0 or 1. In the initialization stage of the experiment, the one-to-one correspondence between each binary bit and the service type will be predefined, and the 0 or 1 of each binary bit represents whether the service proxy node has the capability of the service type. Therefore, the binary sequence is equivalent to a partial gene string of the service proxy node. When multiple service agent nodes cooperate to complete all the service requirements of a composite demand agent node, two service agent nodes with different gene strings will be randomly selected from the participating service agent nodes, and their genes will be cross-mutated, so that a new type of service agent node of composite service is likely to be generated.
4.3. Demand Proxy Node Design
The demand agent node plays a role in providing value and promoting the development and evolution of service agent node in system environment.
4.3.1. Demand Agent Node Attribute Design
Table 3 provides an explanation of the attributes of the demand proxy nodes designed in the computational experiment system.
4.3.2. Demand Proxy Node Lifecycle
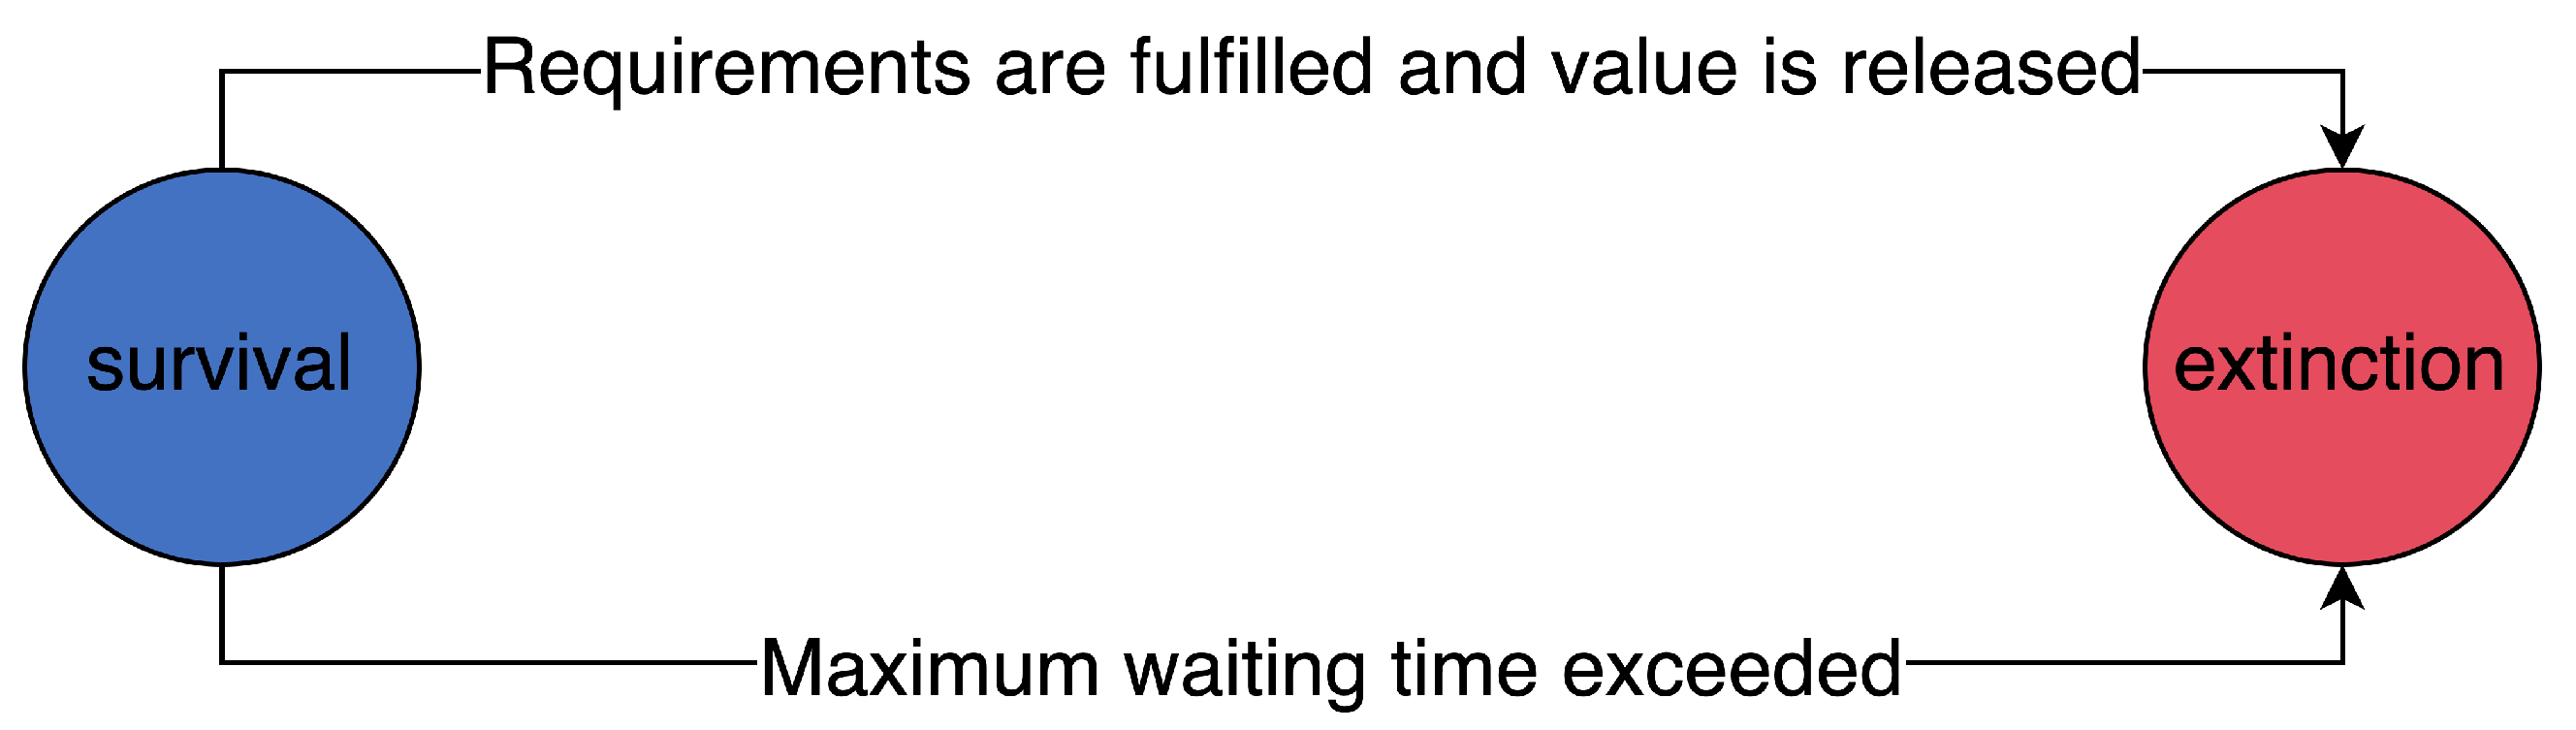
In reality, the corresponding state of the service consumer itself has only two states: the demand has been completed or the demand has not been completed. Therefore, in the computational experimental system, the lifecycle of the demand agent node is set to two states: survival and extinction, and the lifecycle state-transition process is shown in
Figure 6.
To maintain a stable demand-market state in the environment, a certain number of demand proxy nodes are generated in the map every several time stamps, which are fixed in the map environment and provide a source of value for the operation of the entire service ecosystem.
When multiple service agent nodes, whether of the same type or different types, move to the demand agent node and the service quantities of all service types for that demand agent node are met, the demand agent node will release its value. This value is distributed to all participating service agent nodes based on the principle of distribution according to labor. Subsequently, the demand agent node will disappear from the map, transitioning into an extinction state. If the demand of the demand agent node is not satisfied within its maximum duration, the demand agent node will become extinct due to the expiration of its timeliness.
4.4. Market Regulatory Factors Design
In the evolution process of the whole service ecosystem, market regulators do not directly participate in the process of value exchange, but mainly play a side regulation role. Therefore, in this system, market regulators exert their influence through various systemic mechanisms rather than through agent nodes. The factors related to market regulation function to prevent malicious competition, enhance service quality, and increase the diversity of the service ecosystem.
4.5. Environmental Factor Design
In the system, environmental factors are mainly reflected in the setting of the overall demand environment of the system. For each demand agent node, it may be randomly generated in a random area of the map at different time stamps, and each service agent node will seize its profit according to its comprehensive competitiveness, which fits the emergence and solution process of demand in the real environment to a certain extent. As for the overall environment, to reduce the impact of changes or randomness in total environmental demand on the experiment, the experimental system sets the overall demand-market environment as a relatively stable state. At every several time stamps, the number of demand agent nodes will be supplemented to a fixed number. At the same time, environmental factors are also reflected in the operating costs of service agent nodes, and each service agent node will reduce its own assets due to its operating costs at each timestamp.
5. Service Co-Opetition Evolution Experimental Analysis
This section aims to comprehensively and deeply explore the complete research process of service ecosystem evolution, from framework design, theoretical analysis, system design, numerical analysis, computational experimental analysis, to real-world comparative analysis, revealing the potential hidden laws in service evolution.
5.1. Numerical Analysis
To study the competitive and cooperative relationships between services in the service ecosystem, we first conduct a numerical analysis on the improved ternary Lotka–Volterra model proposed in Equation (
7) to verify the model’s effectiveness and partially study the theoretical service-evolution laws.
The evolution process of the service ecosystem requires multiple iterations to uncover its co-opetition evolution laws. Therefore, this paper uses the evolution timestamp as the horizontal axis and the scale of various services as the vertical axis. We use Matlab R2018a software to perform a numerical analysis of the improved ternary Lotka–Volterra model. The evolution period is set to t = 100, and the basic assignment of specific model parameters is shown in the following
Table 4:
In this, , are regarded as the initial scales of the two original atomic services A and B, and is regarded as the initial scale of the new type of composite service C.
5.1.1. Analysis of Co-Opetition Results Based on Stable Conditions
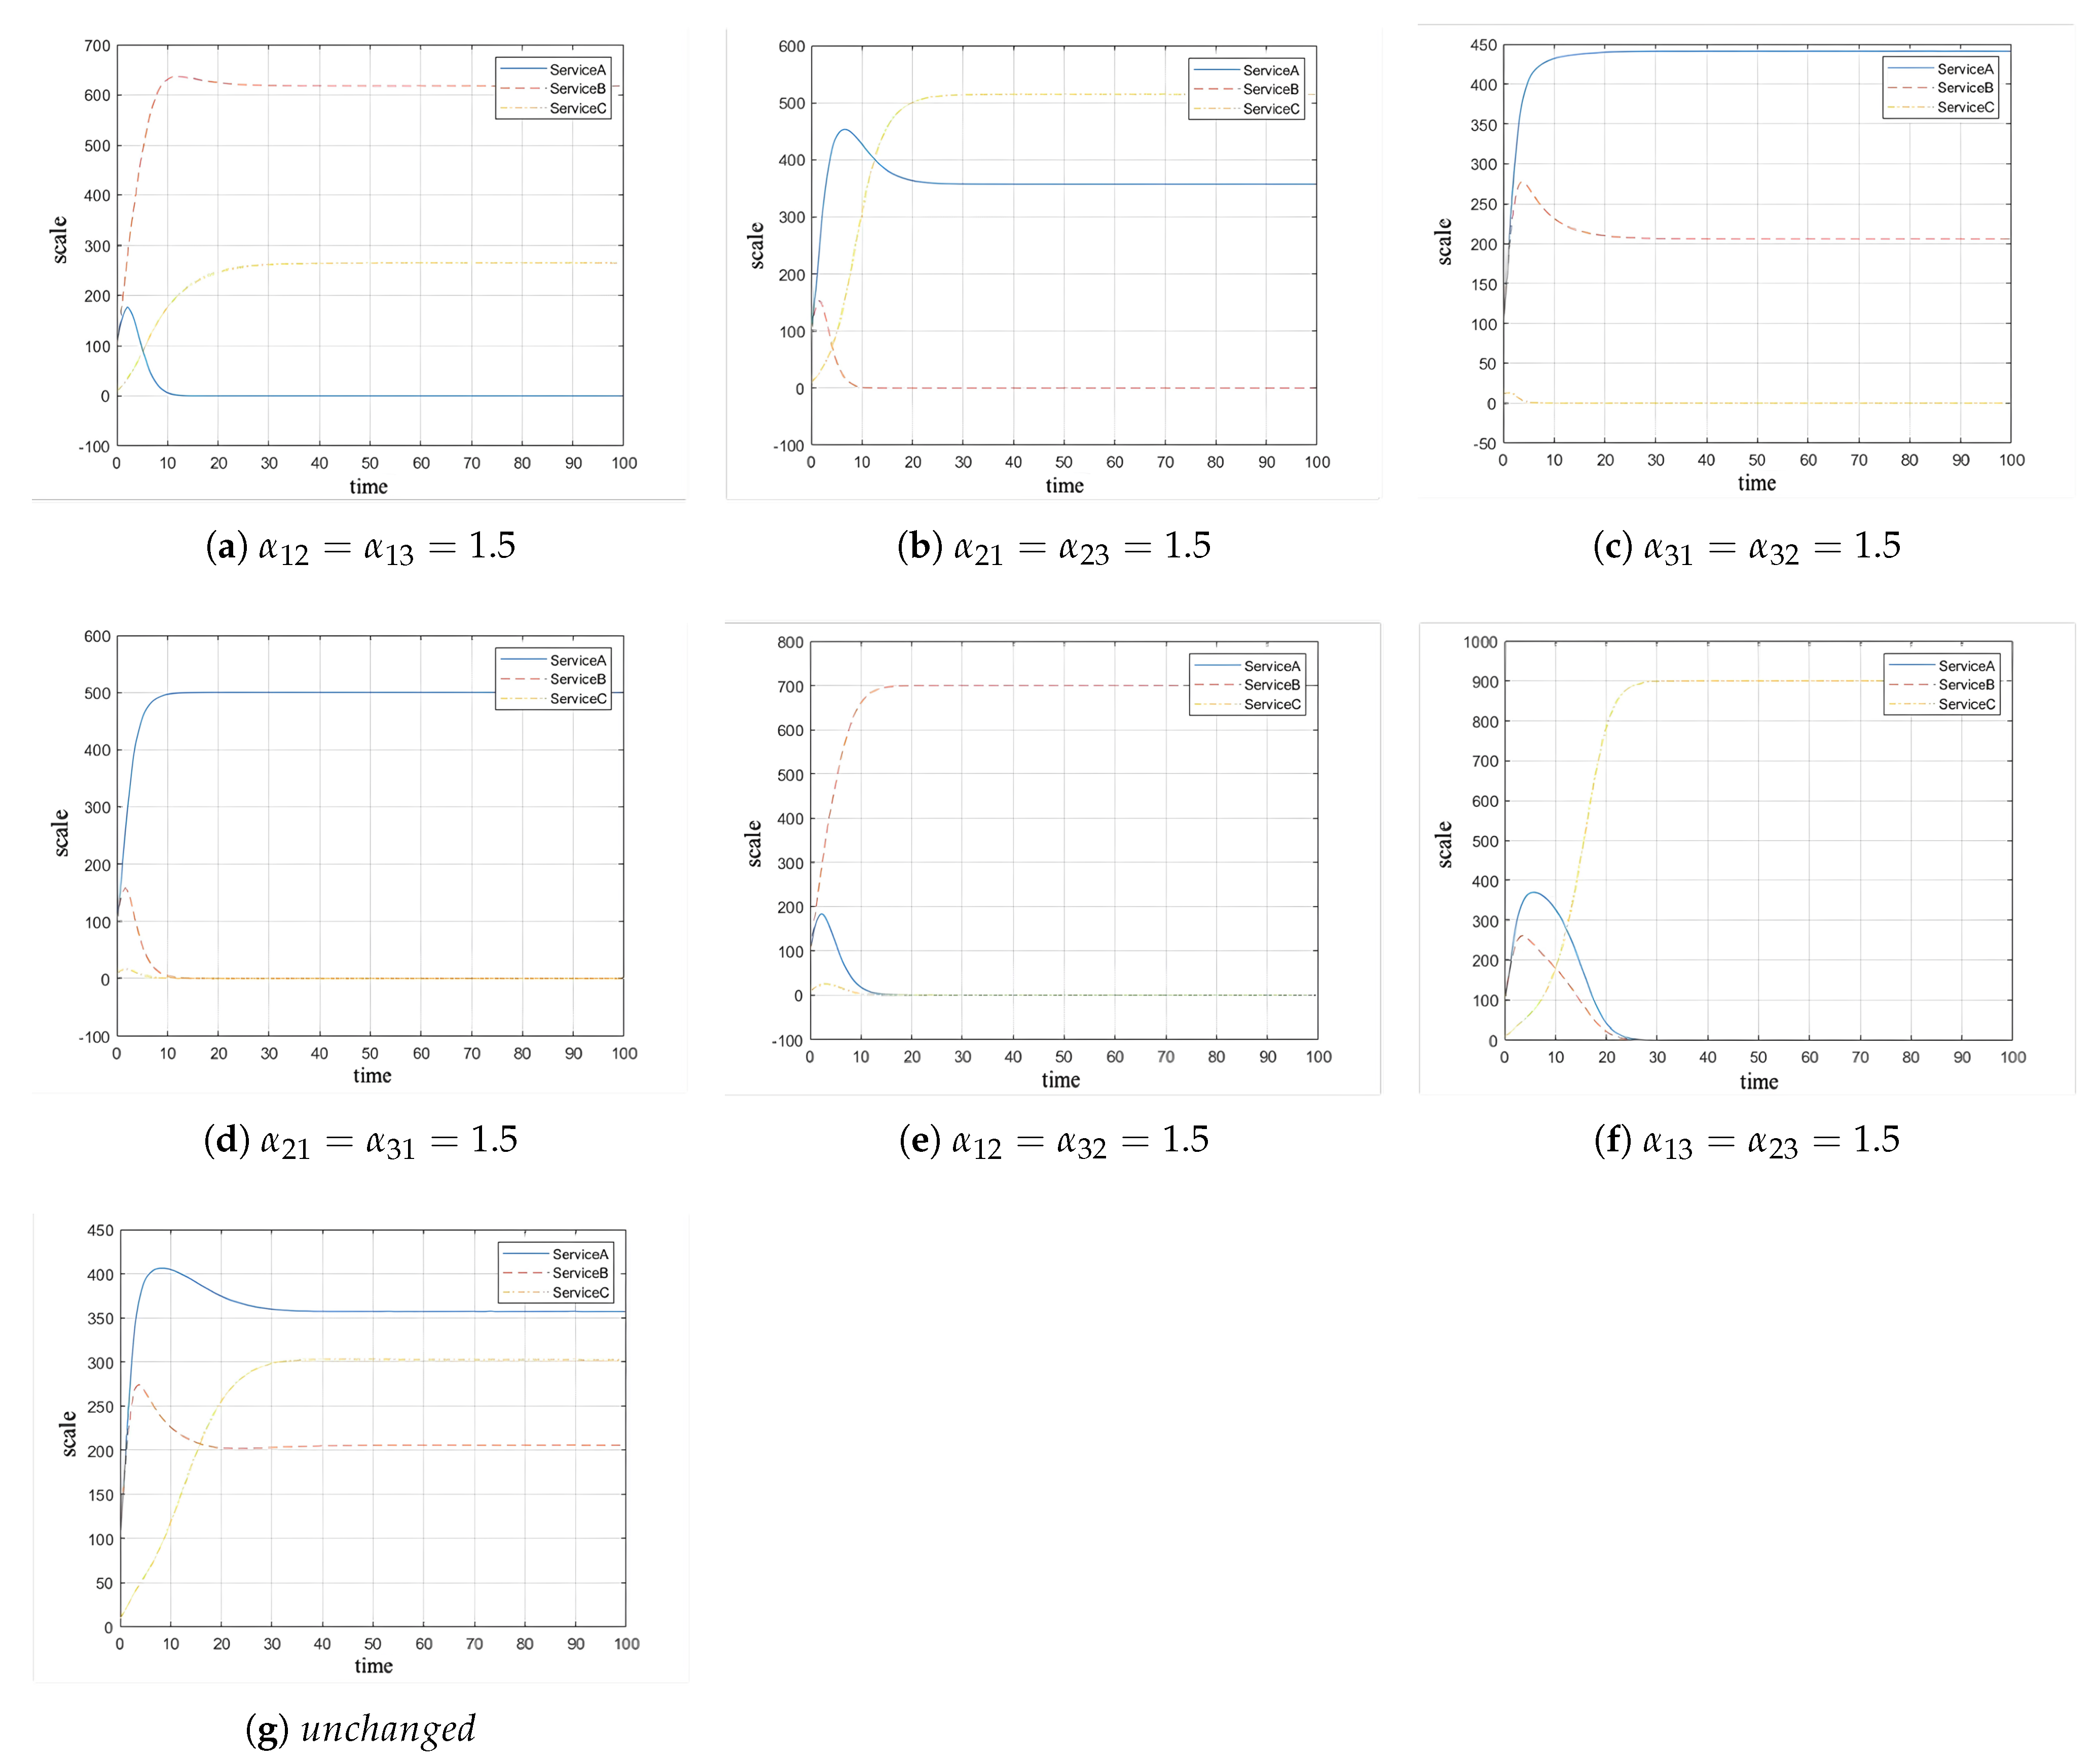
Based on the basic assignments of model parameters, combined with the analysis of local equilibrium points and their stability, we can simulate the model’s seven stable local equilibrium points by adjusting the interaction coefficients between services.
From the simulation of the seven stable local equilibrium points of the model, it can be seen that the equilibrium state of service co-opetition is affected by the interaction coefficients between services.
Analysis from
Figure 7a–c shows that when any service type faces fierce competition from other service types, its market share may be significantly eroded by competitors, potentially leading to the decline or extinction of the service type. Meanwhile, the service type that occupies the market share will expand, and its scale growth will be enhanced. Specifically, when one service faces asymmetric competition, such as
, it is driven to extinction from
Figure 7a, while dominant services thrive.
Analysis from
Figure 7d–f shows that when a service type exhibits a significant advantage in market competition, it may squeeze the survival space of other service types, causing them to gradually decline or withdraw from the market. The dominant service type, by suppressing competitors, often expands its market share, thereby consolidating or enhancing its dominant position in the market. For example, when
in
Figure 7d, strong competition suppresses others but allows two services to persist.
Analysis from
Figure 7g shows that balanced competition enables all services to stabilize in the basic parameters. In a word, when services maintain a certain level of co-opetition, the market can support the coexistence of various services. Although theoretically this seems intuitive, the robust operation of the market does not solely rely on natural market forces but also requires appropriate regulatory measures to ensure that services maintain a suitable level of competition and cooperation under different market and social environment changes.
5.1.2. Relationship Between New Service Equilibrium State and Interaction Coefficients
In studying the evolution process of new service types in the service ecosystem, it can be recognized that this process stems from the collaboration between different atomic service types. They interact and integrate, ultimately nurturing entirely new composite service types. Therefore, deeply exploring the co-opetition relationships among these original services is crucial for understanding and predicting the emergence of new service types. These co-opetition relationships determine the direction of service innovation and the potential development scale of new services. By accurately analyzing these interactions, we can better reveal how new service types emerge from existing services and how to develop strategies to promote positive service evolution.
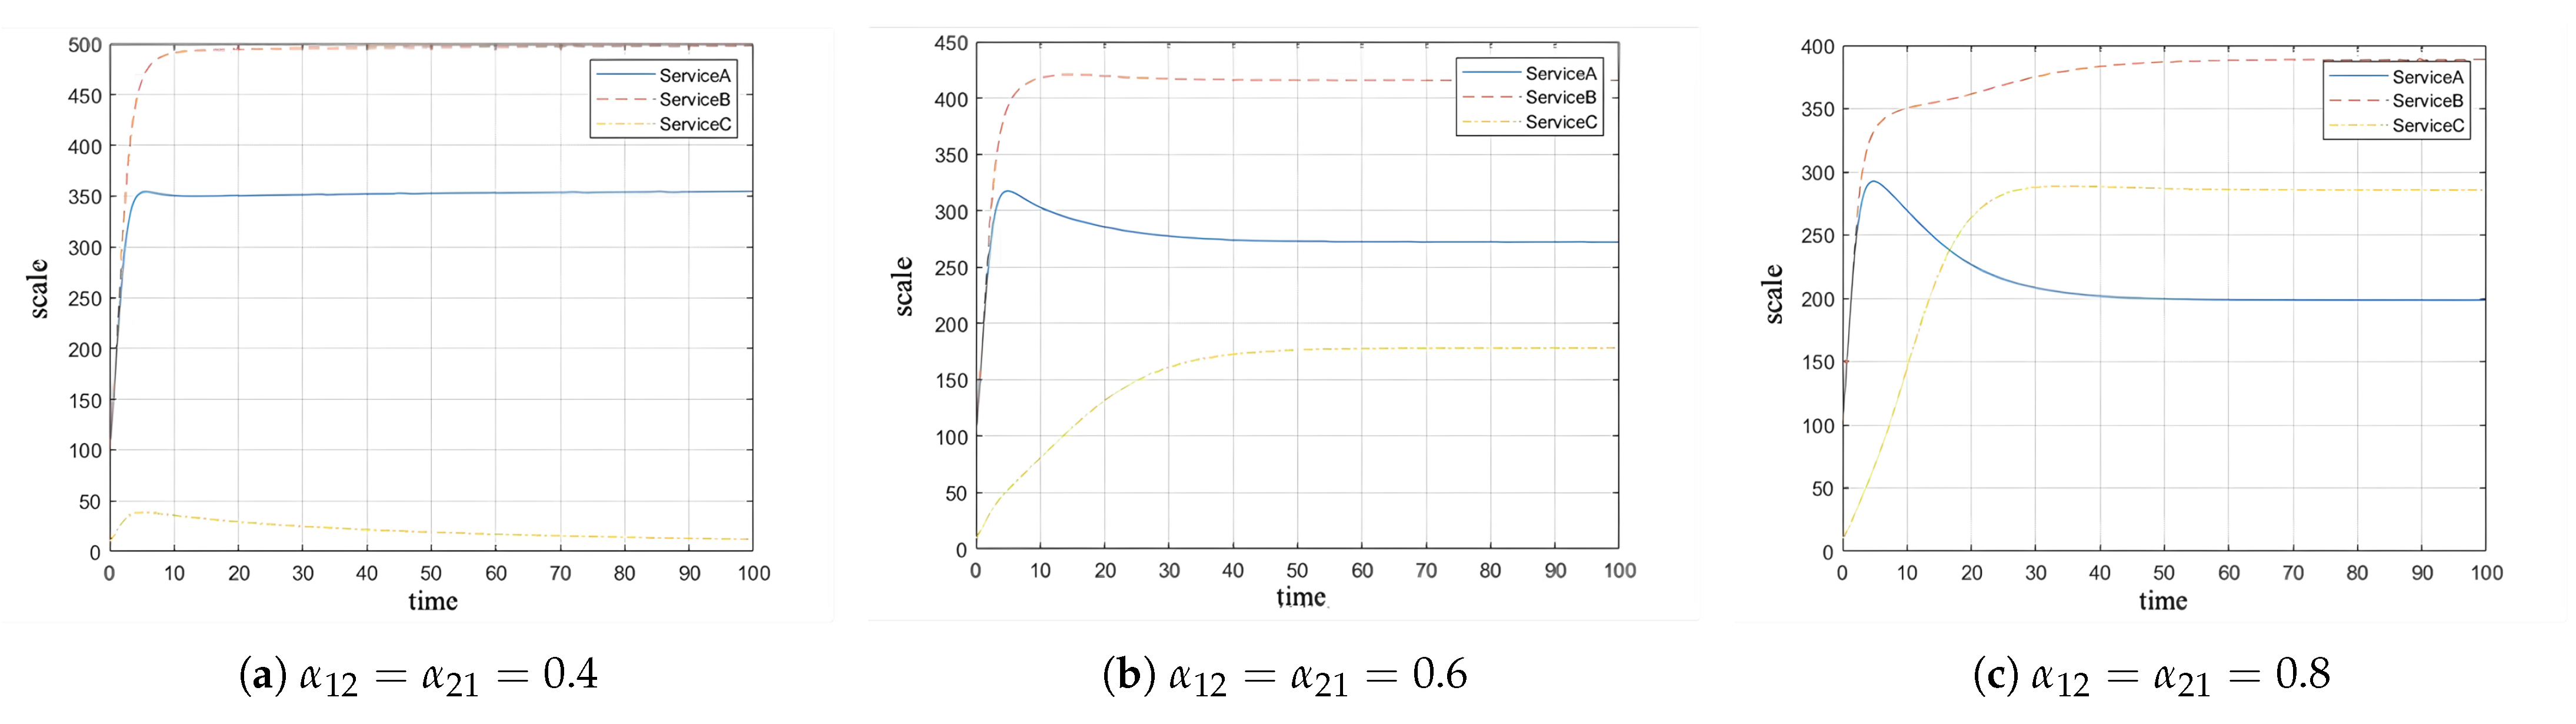
By modifying the interaction coefficients among the original atomic services in the model, setting , to 0.4, 0.6, and 0.8, respectively, the equilibrium states are as follows.
The
Figure 8a shows that low competition
leads to slow composite service growth. The
Figure 8b shows that the moderate competition
accelerates scale rise and maximizes its market share. The
Figure 8c shows that high competition
stifles scale due to resource scarcity. In conclusion, a notable trend can be observed: as the intensity of competition among the original atomic services increases, this intense competitive environment appears to provide fertile ground for the development of emerging composite service types. With the rise in competition coefficients, new composite services are more capable of breaking through the existing market barriers, effectively eroding the market share of the original services. This phenomenon indicates that competition is not only a mechanism for market elimination but also a catalyst for innovation and progress. New composite services can find unique market positions in a highly competitive environment, thereby driving the service ecosystem towards greater efficiency and diversity.
5.2. Computational Experimental Analysis
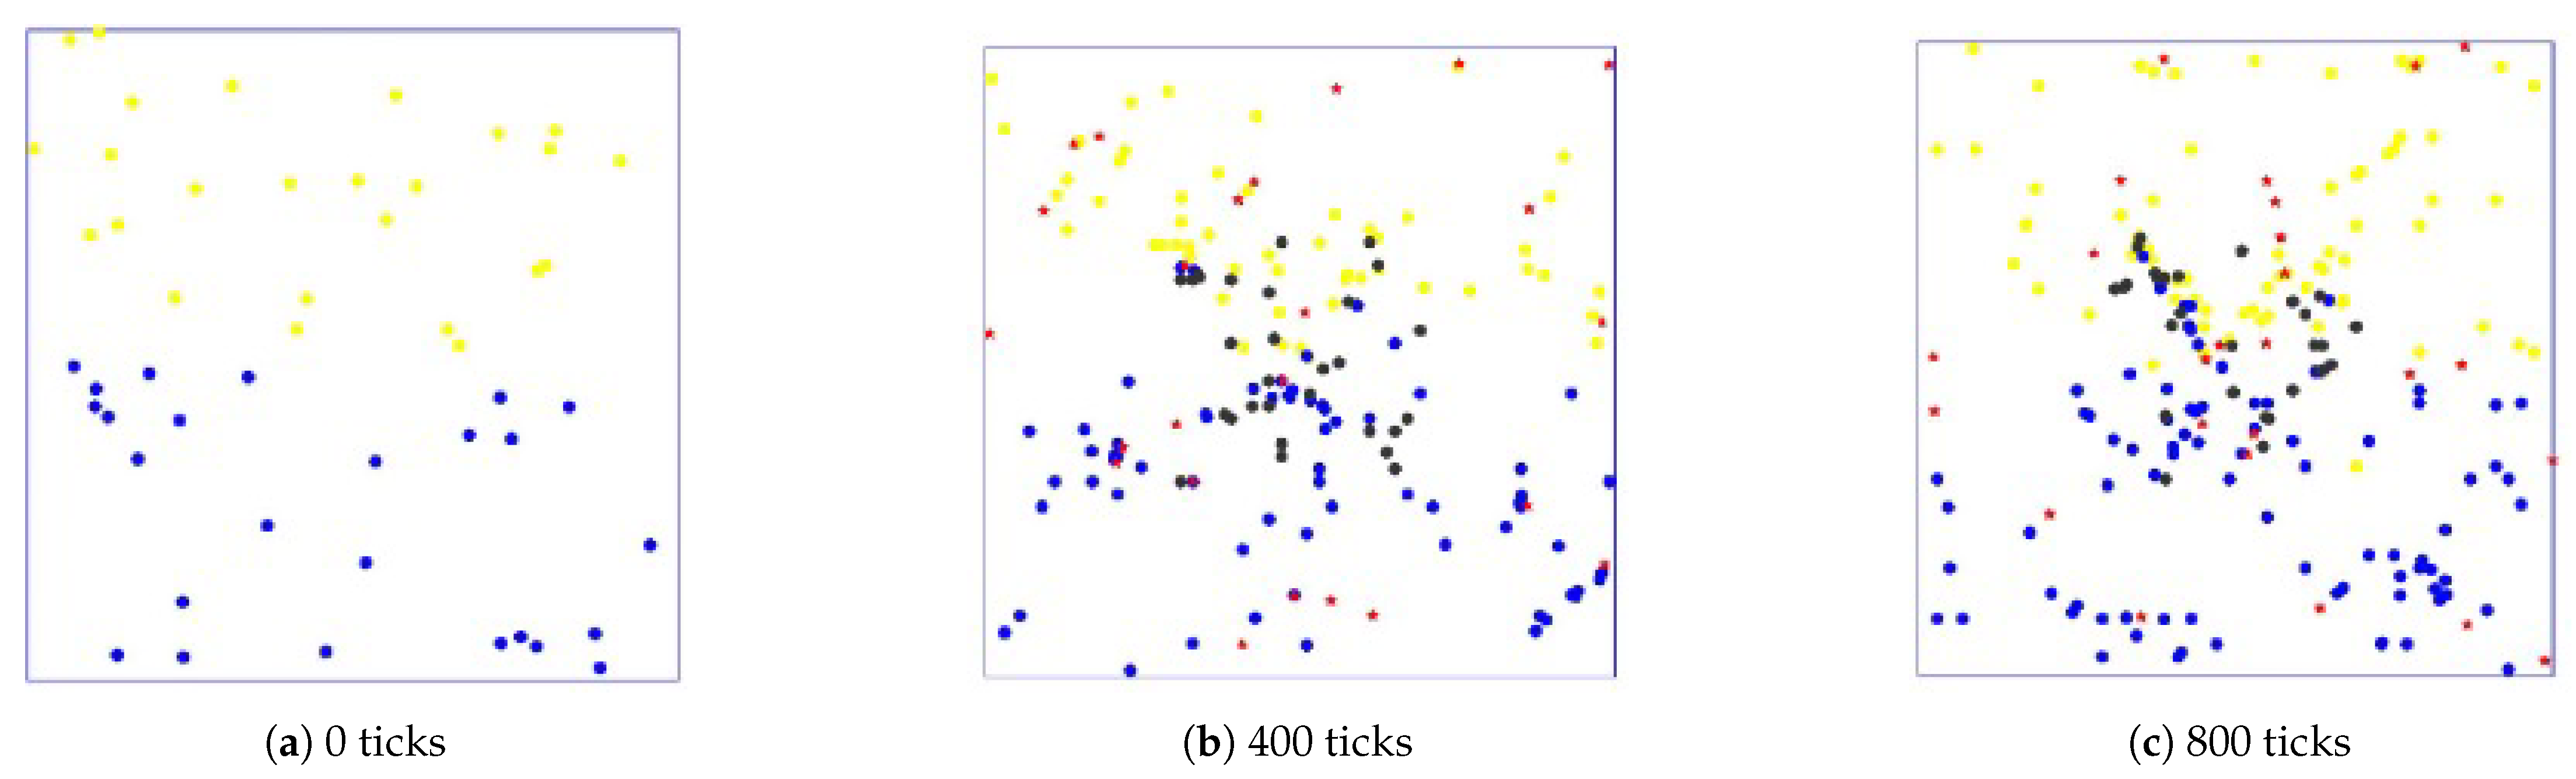
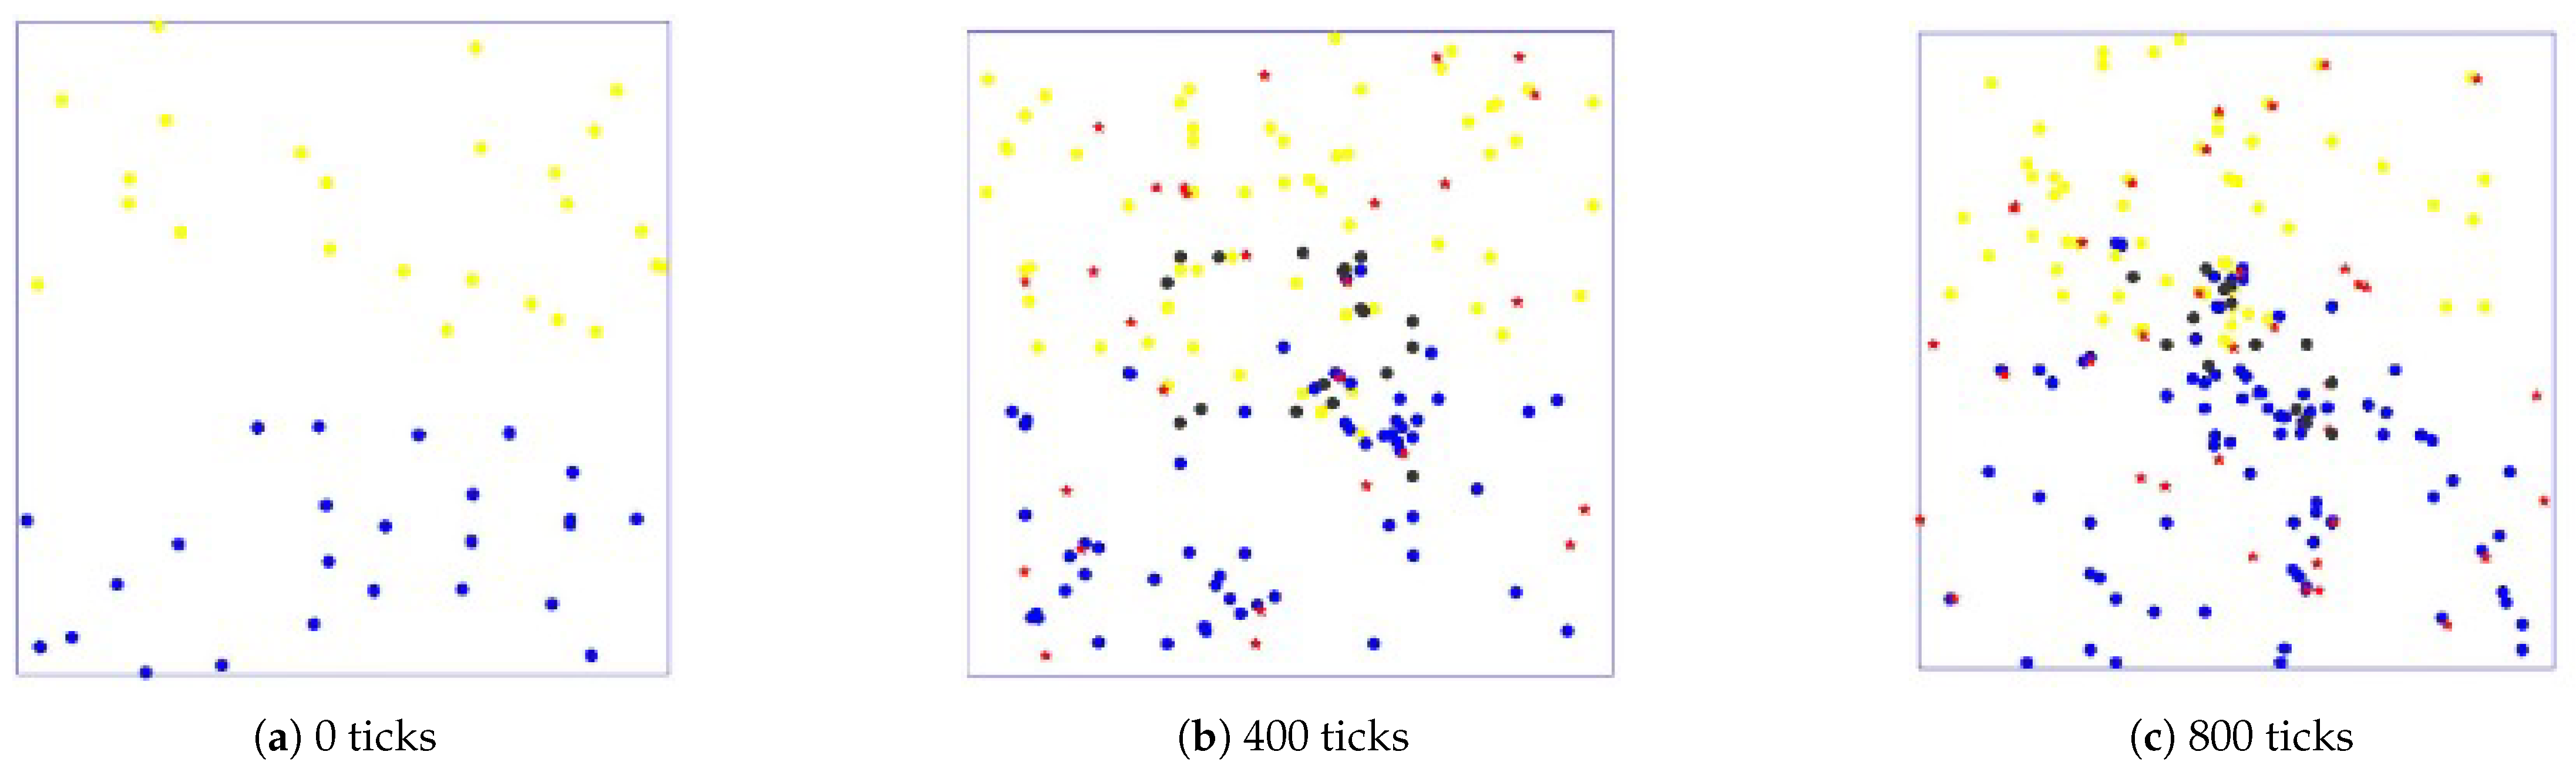
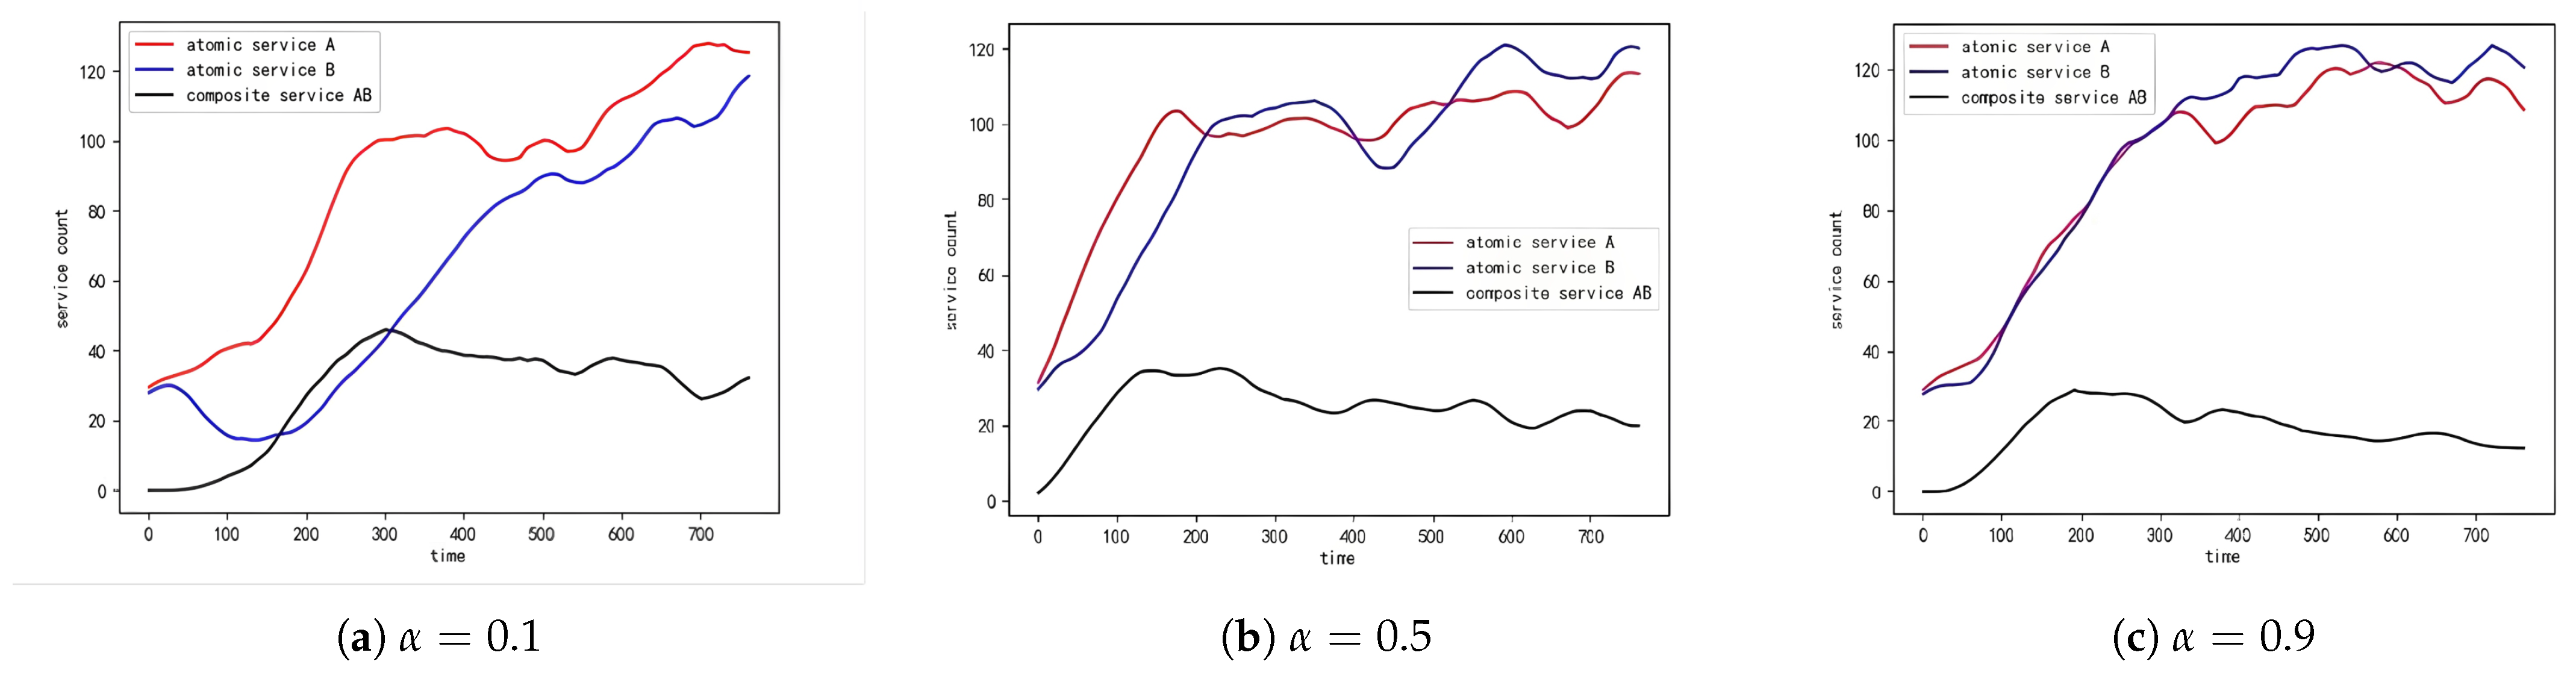
In the computational experimental system, the interaction coefficient between atomic services is defined as follows: when different types of service agent nodes cooperate to fulfill a composite demand, they can provide a service volume equivalent to (1 + ) times the original amount. In the computational experiment, the coefficient is specifically set to 0.1, 0.5, and 0.9 to observe the evolutionary paths of the service ecosystem under different levels of competition between original atomic services. By parameterizing in this way, we can explore the dynamic behavior of the service ecosystem under various competitive pressures, revealing or verifying potential evolutionary laws.
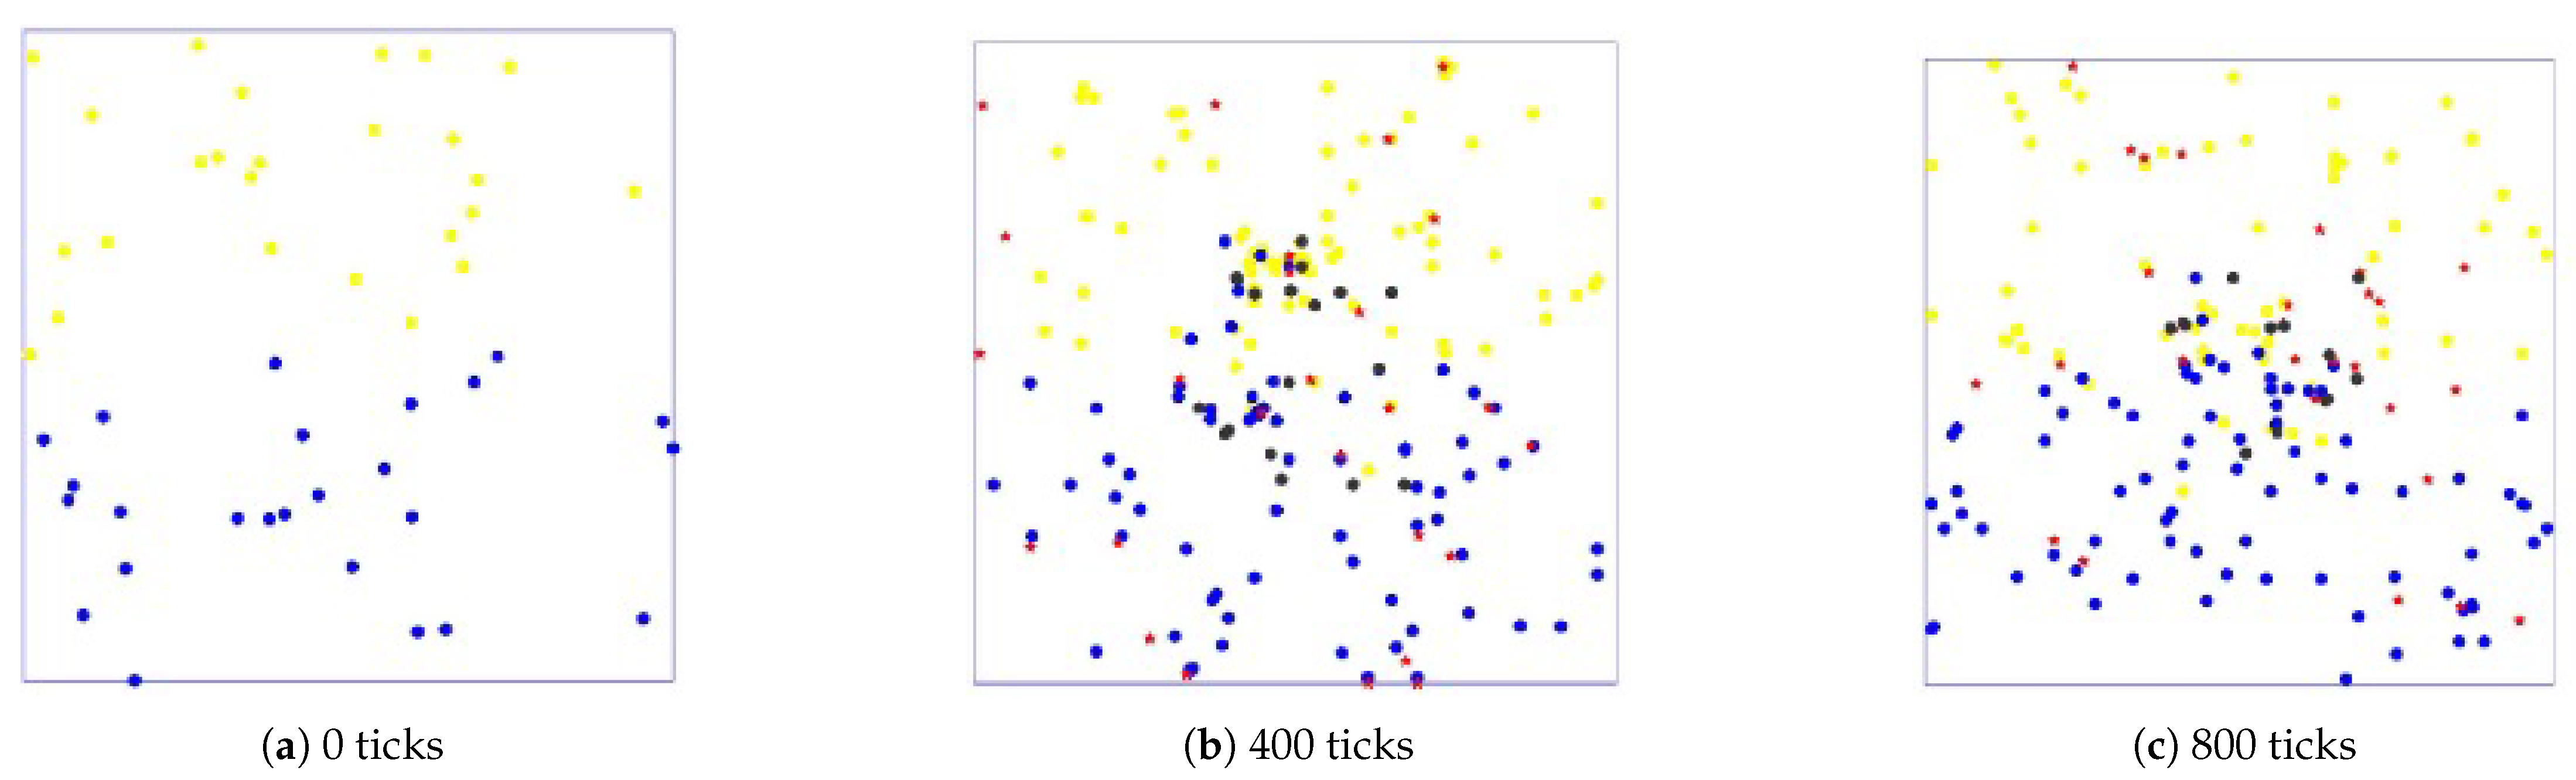
Different time stamps of 0, 400, and 800 ticks are captured during the computational experiments. The evolution process is shown in the
Figure 9,
Figure 10 and
Figure 11 below:
As shown in the figures, at the initial stage (0 ticks), 25 service agent nodes of two different atomic types with varying attributes are randomly generated in the environment, represented by yellow and blue dots. As time progresses, the service ecosystem evolves, and different attribute demand agent nodes, marked by red dots, are generated in a stable total amount. These demand agent nodes have various demands for different types and quantities of services. When atomic service agent nodes cooperate to fulfill these demands, the demand agent nodes release profits, which are distributed to the participating service agent nodes, allowing them to accumulate capital. During this process, atomic service agent nodes may undergo evolutionary cooperation, forming composite service agent nodes (represented by black dots) to adapt to the environment and capture market profits more effectively. By analyzing the evolutionary process under different interaction coefficients between original service nodes, the development of new service agent nodes can be studied.
Combining the evolution diagrams and the changes in the number of different service types during the evolutionary process, it can be observed that as the interaction coefficient between original services increases, the difficulty for emerging service agent nodes to gain an advantage in the competitive market environment also increases. In the service ecosystem, the degree of cooperation between original services directly affects their ability to meet complex and changing demands in
Figure 12a–c. In low competition
, composite services emerge slowly due to weak competitive pressure. In moderate competition
, composite services thrive, reaching equilibrium faster. In addition, in high competition
, composite services struggle to establish due to resource monopolization by atomic services. When these services can efficiently address composite demands through tight cooperation, the unique advantages of emerging composite service agent nodes in the market may diminish. This is because the original services have already established a robust service-provision network through cooperation, making it more challenging for new composite service agent nodes to gain a foothold and demonstrate their competitiveness in the market.
Service ecosystem diversity is a key indicator of its development, reflecting the health and innovation potential of the ecosystem. Observing Simpson’s Diversity Index from
Figure 13a–c, when
, due to service stagnation, the diversity is low. When
, the diversity of service competition tends to balance. With the increase of
, competitive exclusion dominates, leading to the collapse of diversity. In conclusion, as the interaction coefficient between original services increases, the Simpson’s Index shows a downward trend, indicating a reduction in the ecosystem’s diversity. This phenomenon suggests that moderate competition among services may act as a catalyst for diversity development, while overly tight cooperation may hinder the development of new services.
6. Real-World Comparative Analysis and Discussion
To further investigate and validate the impact of interaction coefficients between original services on the development of new services, this section employs real-world comparative analysis, studying two innovative composite services: Tesla and Google Glass. Tesla not only represents an automotive service but also integrates cutting-edge technology from the new-energy-material services, creating a novel comprehensive service product. Similarly, Google Glass combines personal goods services with advanced information technology services, attempting to open up the emerging market for smart wearable devices.
To obtain complete data on the market development of different services in their early stages while ensuring data reliability and persuasiveness, the real-world comparison uses the rolling price-to-earnings ratio (PE-TTM-S) of the original services of Tesla and Google Glass as indicators of service development status. The rolling price-to-earnings ratio provides a real-time assessment of service profitability and is widely recognized as an effective indicator for evaluating service profitability and stock valuation, reflecting the current status and market expectations of services.
Tesla became the first independent pure electric vehicle manufacturer in June 2010, with the first electric car delivered in June 2012. Google Glass had a shorter development period, with rapid growth in patent applications for smart glasses in 2011 and the official development of the Project Glass in April 2012. Therefore, the study uses the rolling price-to-earnings ratio data from 2010 to 2012 for automotive and new-energy-material services, and from 2011 to 2012 for personal goods and information technology services. The specific data are shown in the
Figure 14 and
Figure 15:
The grey estimation method is currently the primary method for parameter estimation and fitting competition relationships for the Lotka–Volterra model. It is simple, requires less computation, is highly generalizable, and overcomes the difficulties caused by incomplete experimental data. The method will be used below to estimate the competition relationships between original services.
The competition relationships between original services can be represented by the following Equations (
27):
Based on the grey derivative and paired logarithmic mapping relationships, the following relationships can be obtained:
Substituting data for
into Equation (
28), we obtain the matrix equations
and
, where:
Using the least-squares method, the parameter estimates are given by = .
The parameter estimation results obtained using Matlab software are shown in
Table 5:
Restoring the interaction coefficients from Equation (
27), the interaction coefficients
and
between automotive and new energy material services are 0.0650 and 39.13, respectively. The interaction coefficients
and
between personal goods and information technology services are −0.5177 and −5.99, respectively.
These results indicate that the original services of Tesla have a more significant competitive relationship compared to those of Google Glass. Both innovative composite services started development around the same time but had different outcomes. Tesla has become a leader in the new-energy-vehicle industry, representing green transportation and capturing a large market share. In contrast, Google announced the discontinuation of the Google Glass project in 2015 due to poor market performance.
The analysis of Tesla and Google Glass provides insights into the development of innovative composite services. These cases suggest that moderate competition among original services can promote the development of new composite services. Competition drives innovation and motivates service providers to seek differentiation, which is crucial for the formation of new services in the market. Conversely, overly tight cooperation among original services may hinder the market penetration of new composite services, as they have already met most of the market demand through cooperation, leaving little room for new services to establish themselves.
Regarding Google Glass, despite representing an innovative direction in the service market, its development obstacles may not necessarily stem from flaws in the service itself but rather from the poor timing of its launch. If the cooperation between two types of original services is too close, they may have effectively captured most of the market demand, leading to a lack of widespread recognition for the specific needs targeted by Google Glass. Alternatively, the market opportunities may have been fully exploited by existing services, or the market may have had overly high expectations. This implies that companies need to carefully analyze market conditions and the interaction patterns of original services, pay attention to the objective laws of service evolution, determine the optimal timing for launching new services, and provide guidance for their development strategies and market positioning.
7. Conclusions and Future Work
Business diversification and expansion have become crucial development strategies for modern enterprises, leading large companies to transition from single-business models to diversified business strategies and ultimately to business ecosystems. This shift is driven by user demand, service innovation, and dynamic cooperation among services. Understanding the development patterns of service ecosystems is essential for forming more efficient and effective management mechanisms and assisting enterprises in making informed decisions during service transformation.
This paper introduces the Lotka–Volterra model from biology into the field of service ecosystems as theoretical support for exploring competitive and cooperative relationships among services. The binary Lotka–Volterra model is extended to a ternary model, considering the complexity of services in the ecosystem, including the impact of social environmental factors and service dynamics on service evolution. Through framework design, theoretical numerical simulation, computational experiments, and real-world comparative analysis, this research explores the competitive–cooperative relationships among original services and their impact on the evolution of new composite services. The study finds that moderate competition = 0.4–0.6 maximizes the emergence of composite services and the survival rate of new services is the highest. In addition, Tesla’s success is related to the annual growth rate of ecosystem partnerships, while the decline of Google Glass is related to developer engagement. Furthermore, the diversity of the ecosystem reaches its peak at , exceeding . Due to the rapid decline in competitive exclusion. In conclusion, moderate competition among original services promotes the development of new composite services, while overly tight cooperation may limit the market survival and development of new services.
In the future, we can consider more factors influencing the evolution of the service ecosystem to improve the model’s complexity and adaptability. In addition, we can utilize more mathematical models to study the impact of various factors on the evolution of service ecosystems. Current research on individual services, such as service recommendations and service composition, is abundant, but research on the entire service ecosystem is still in its infancy, with a lack of reliable real-world data. Future studies could gather relevant data and indicators from the evolutionary development of specific enterprises or organizations’ service ecosystems to support further research.


