
Elastic Structural Assessment of Clamp-Based Steel Beam-to-Column Connections for Reusable Steel Systems


Abstract
Featured Application
Abstract
1. Introduction
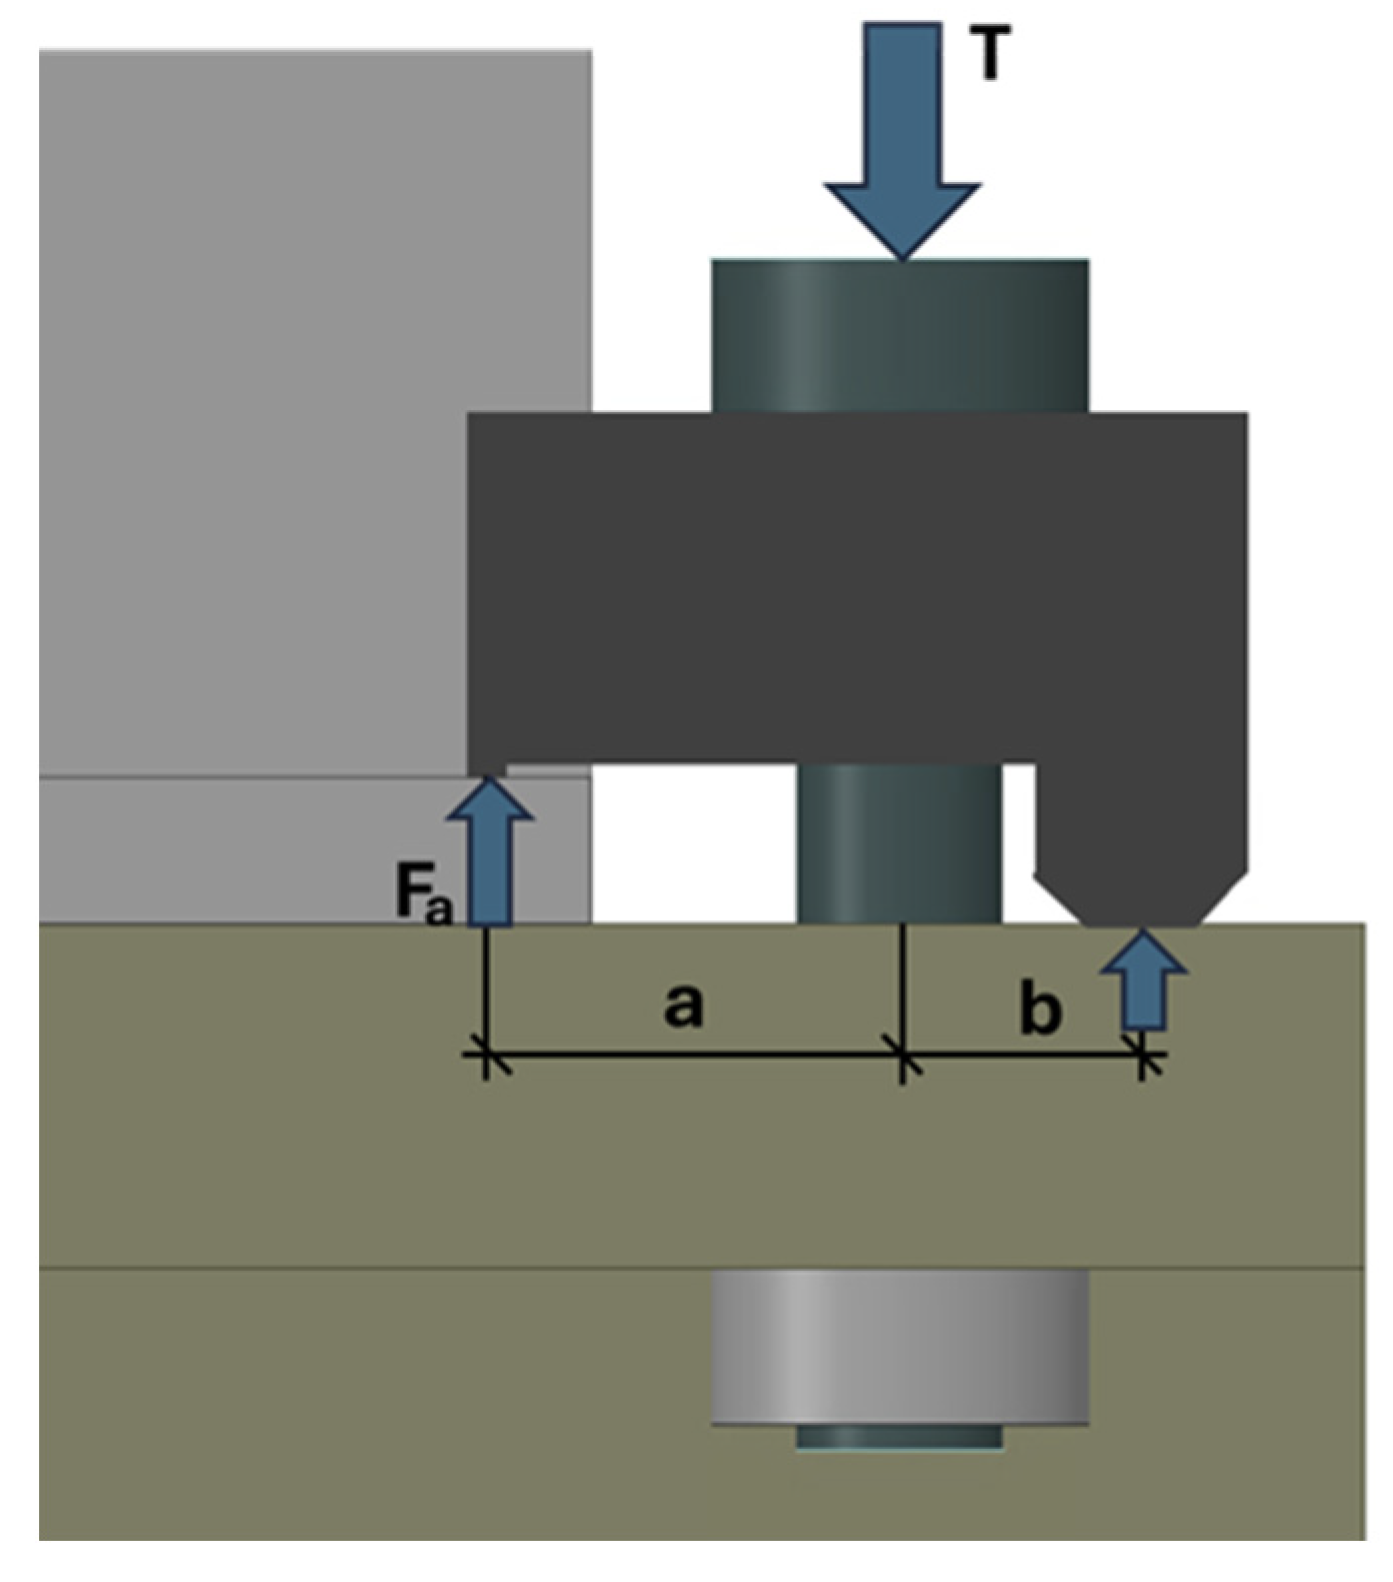
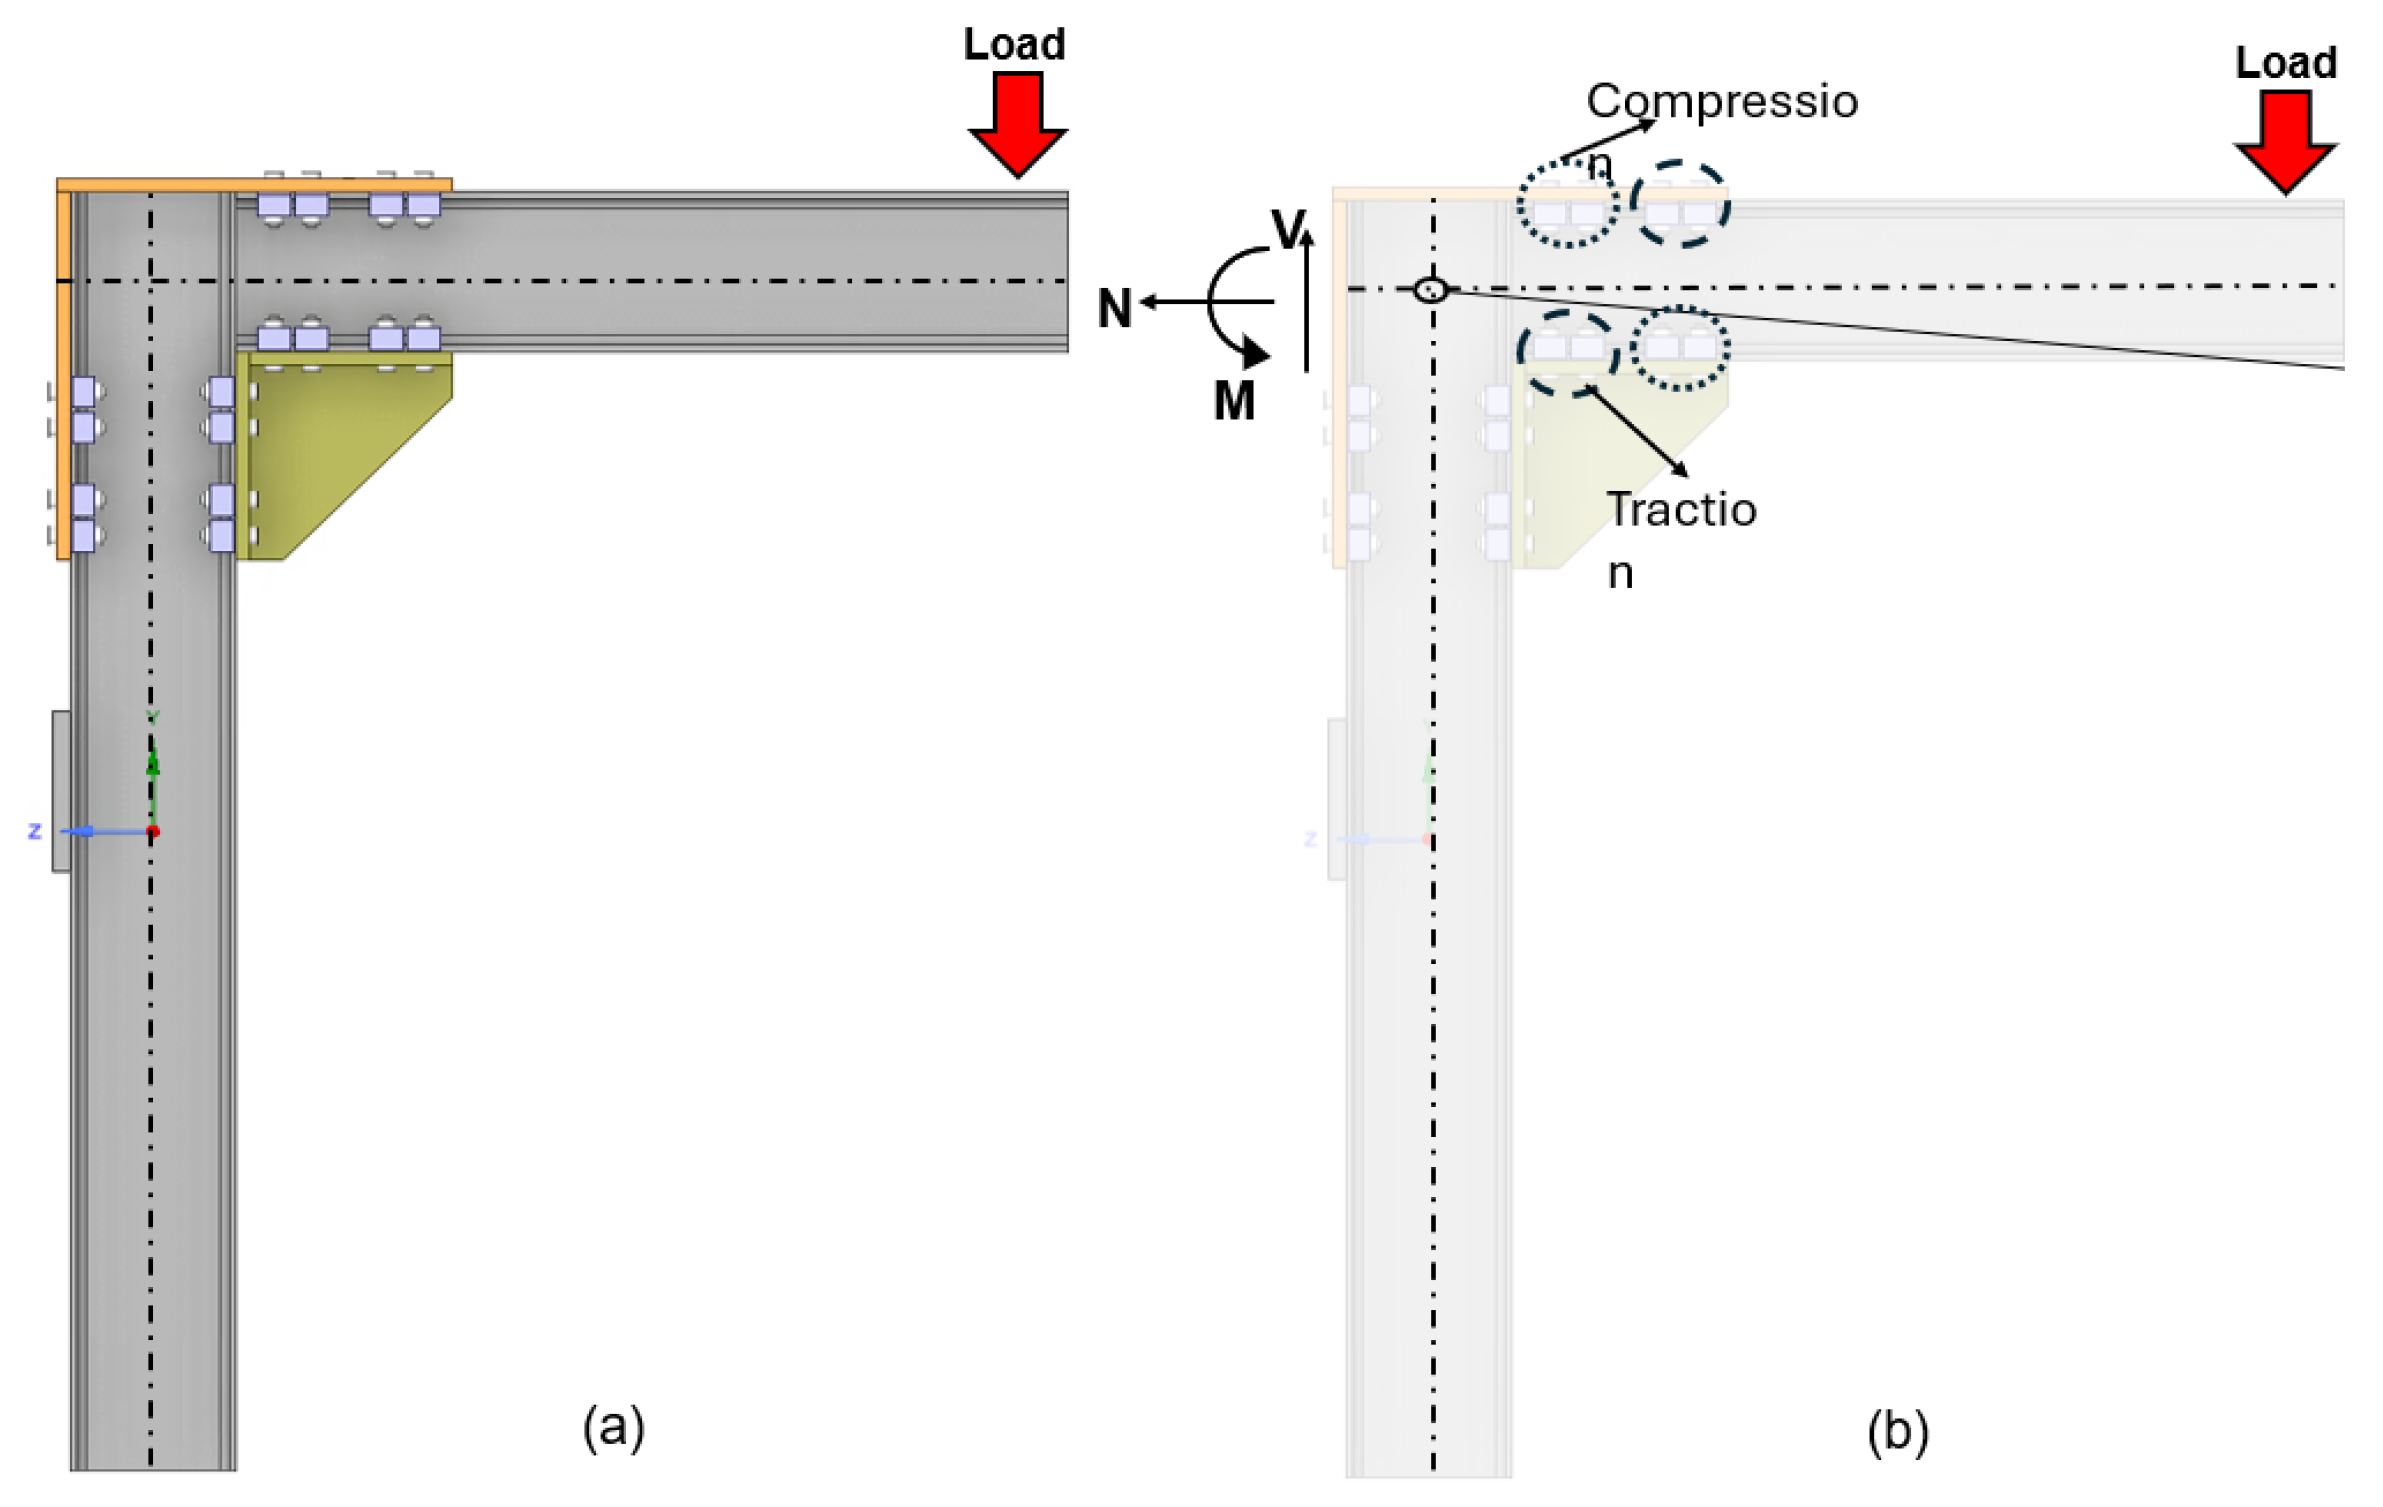
2. Design and Operational Principles of Clamp-Based Connections for Structural Systems
- is the preload force applied to the bolt (N);
- is the arm lever length on the bolt side (mm);
- is the arm lever length on the clamping side (mm).
- is the ultimate tensile strength of the bolt material (MPa);
- is the effective cross-sectional area of the bolt (mm2).
3. Materials and Methods
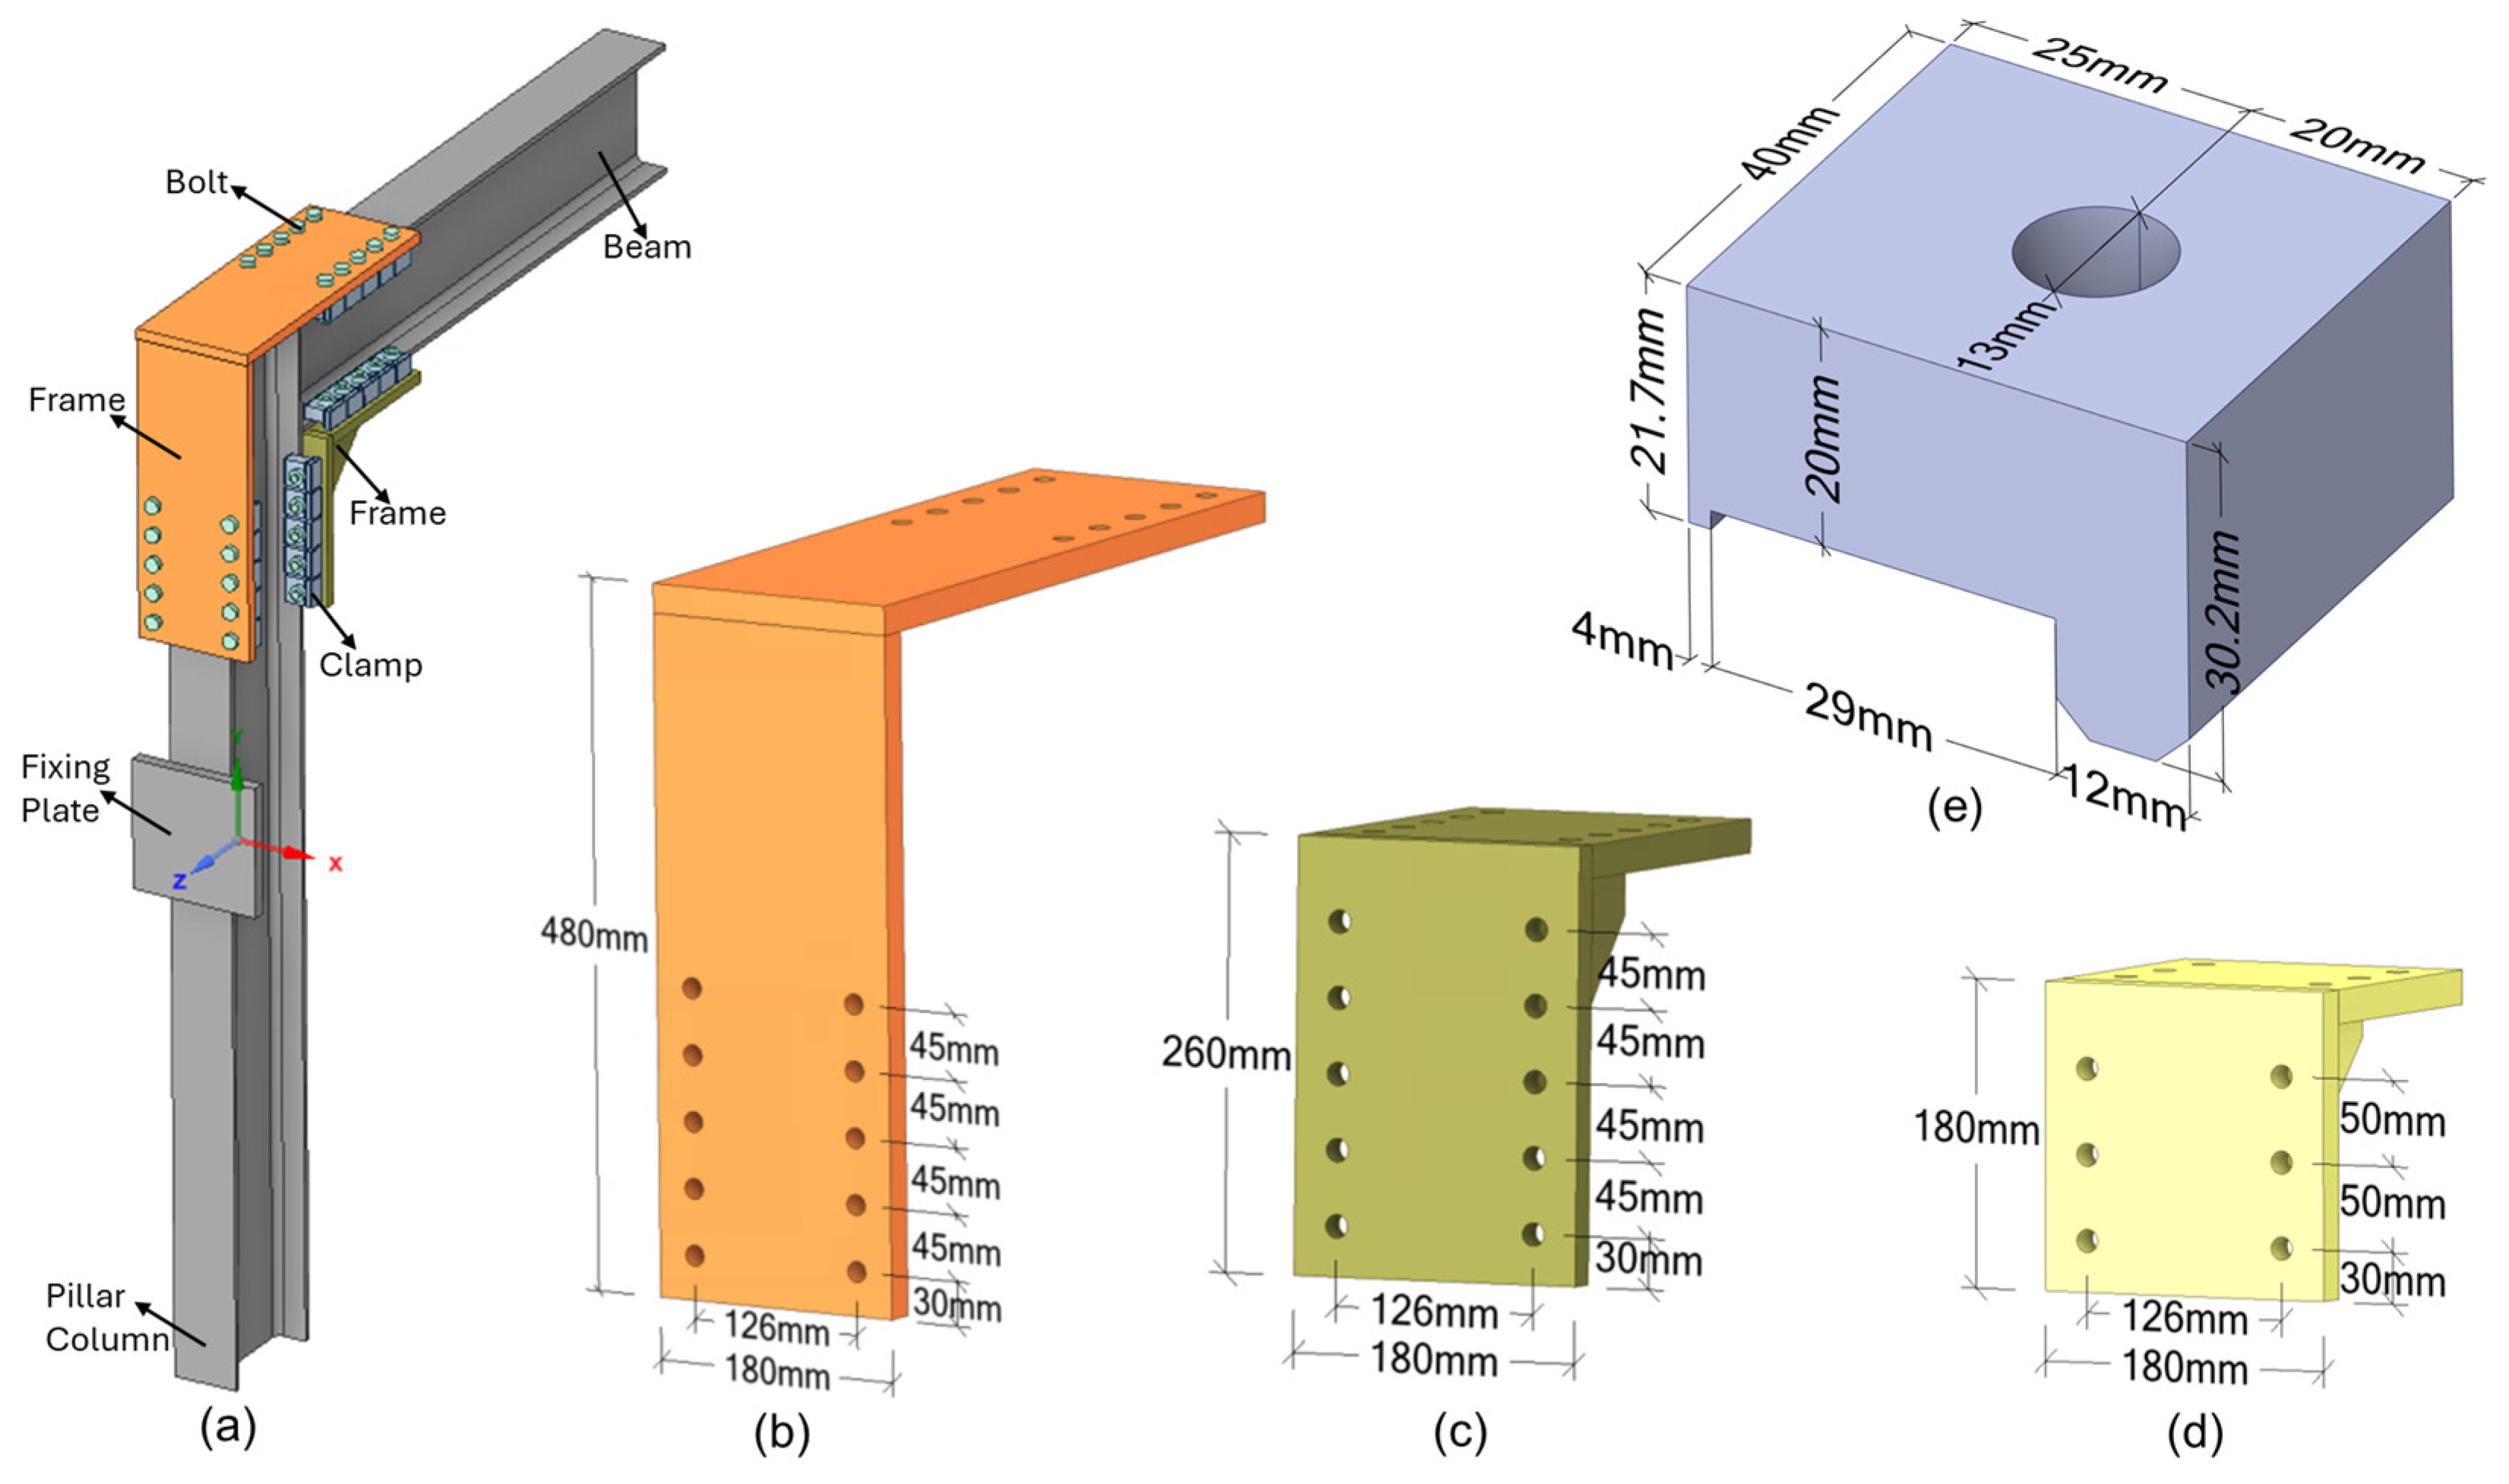
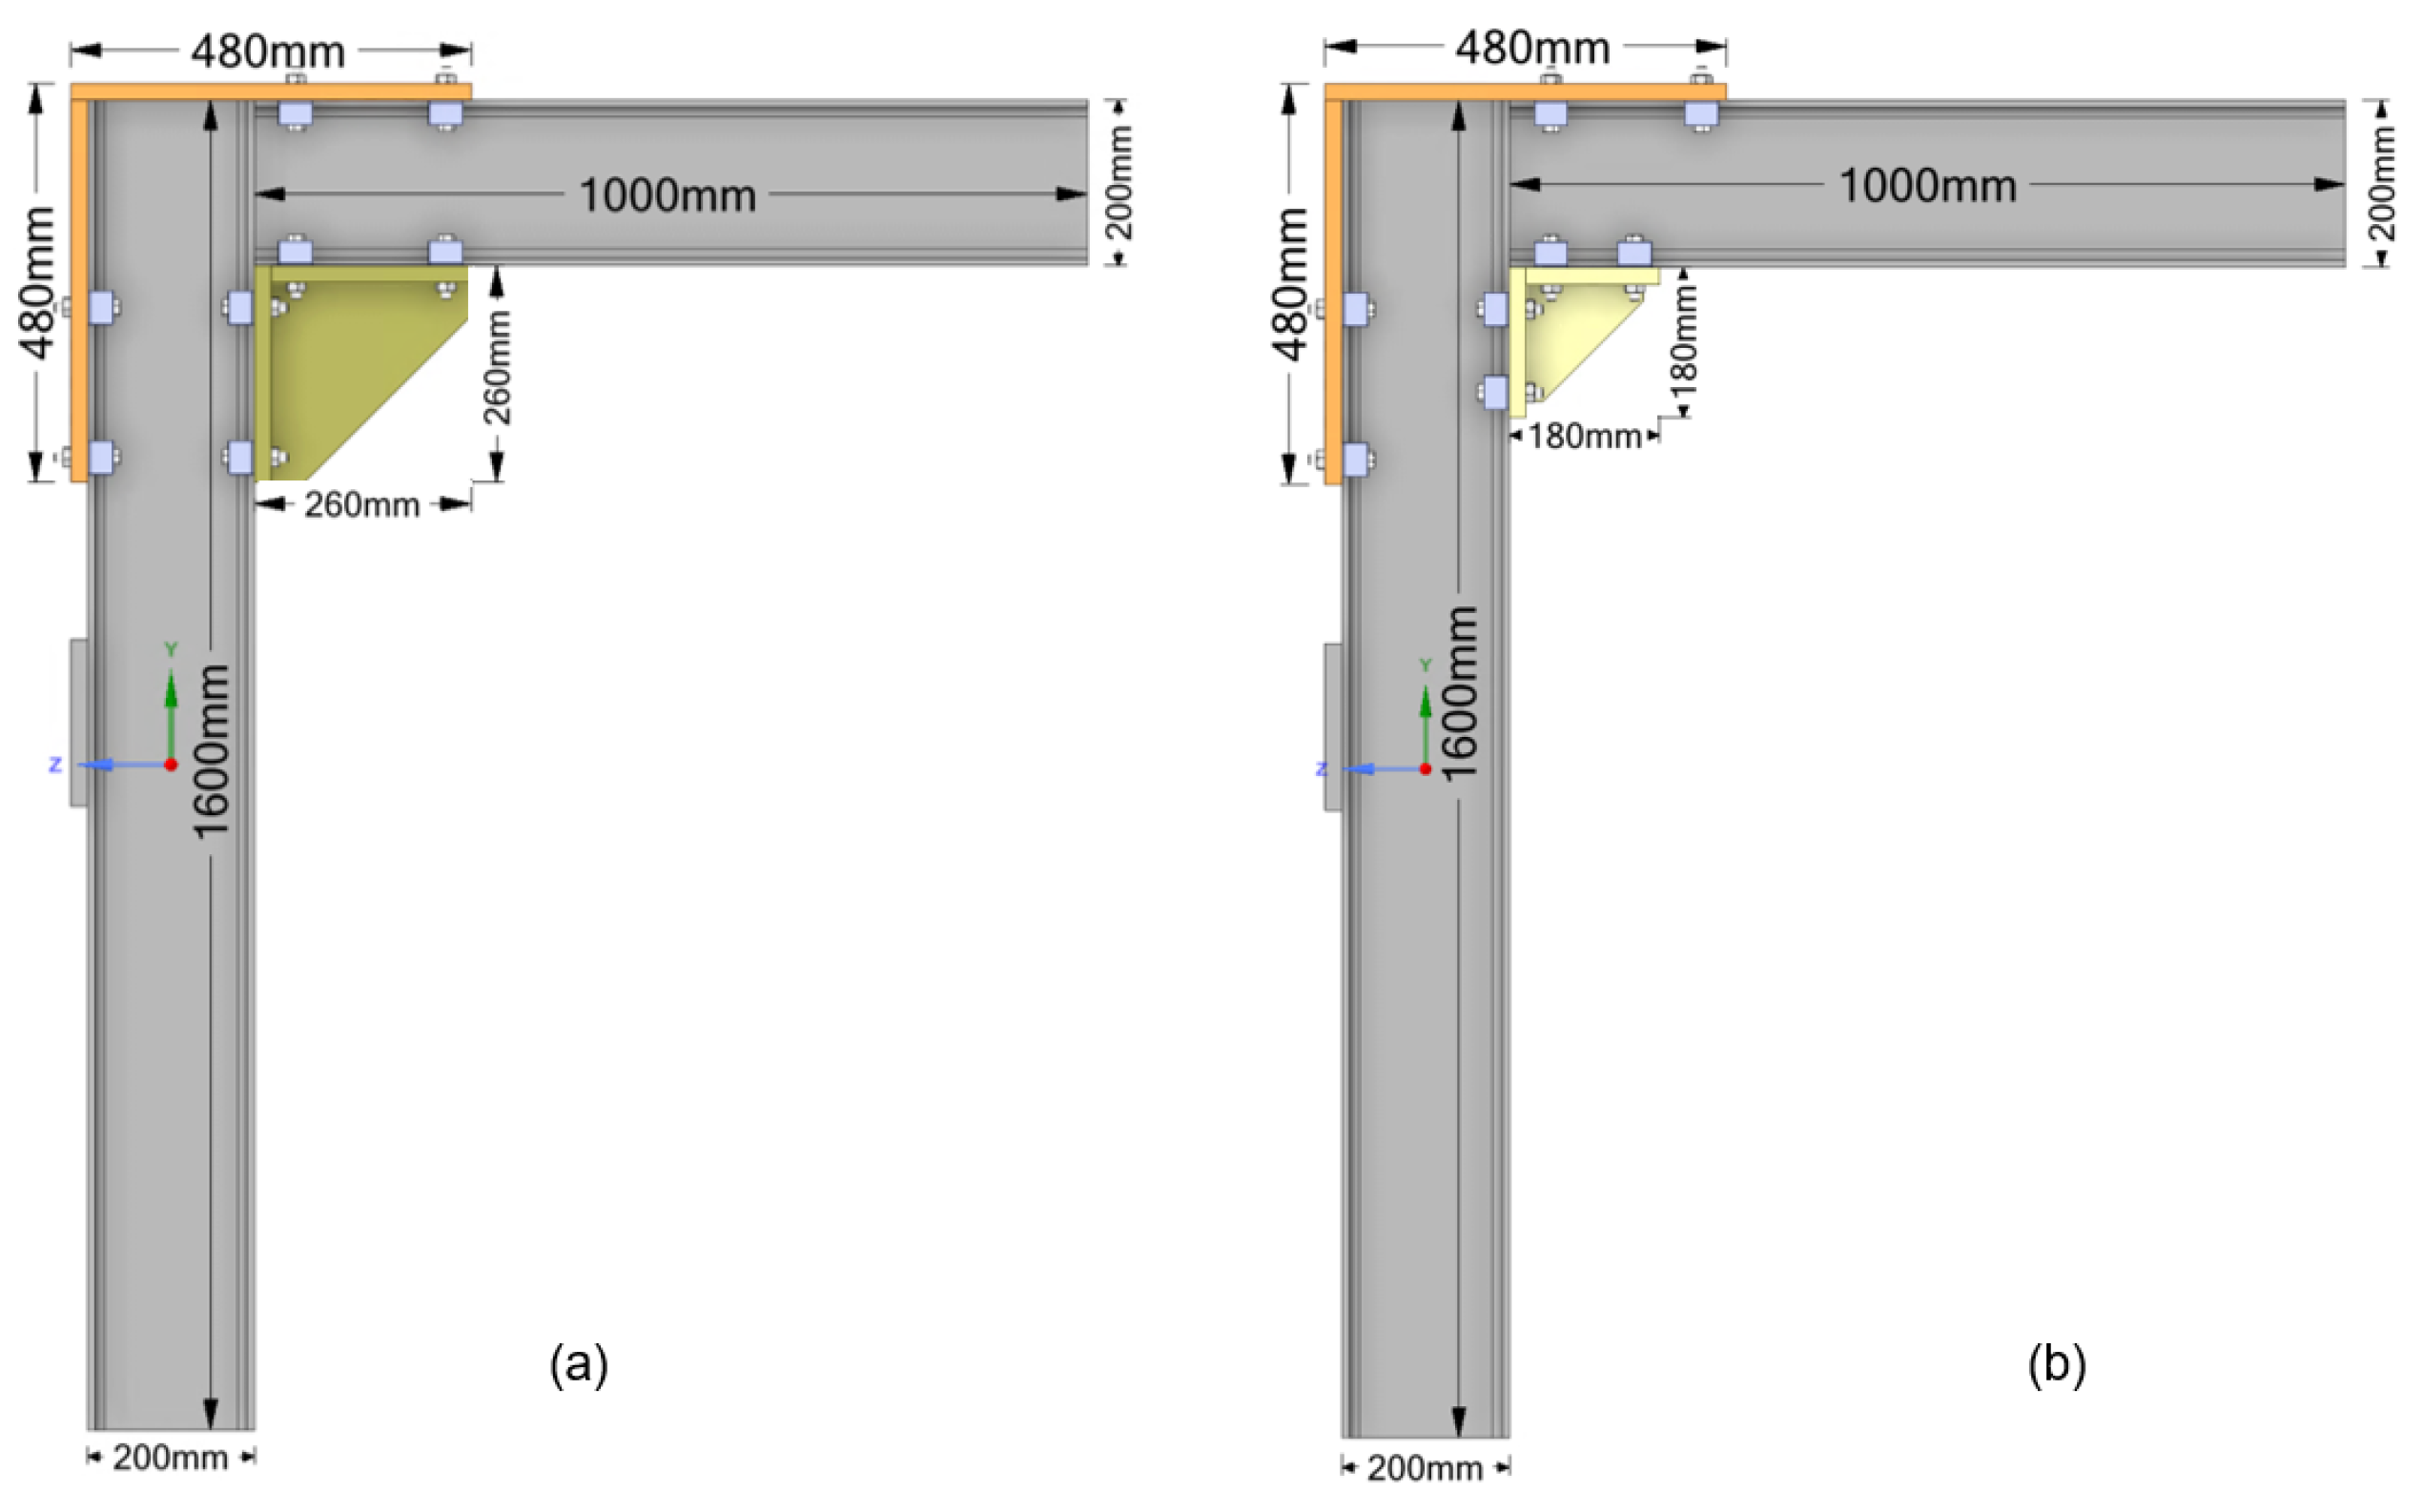
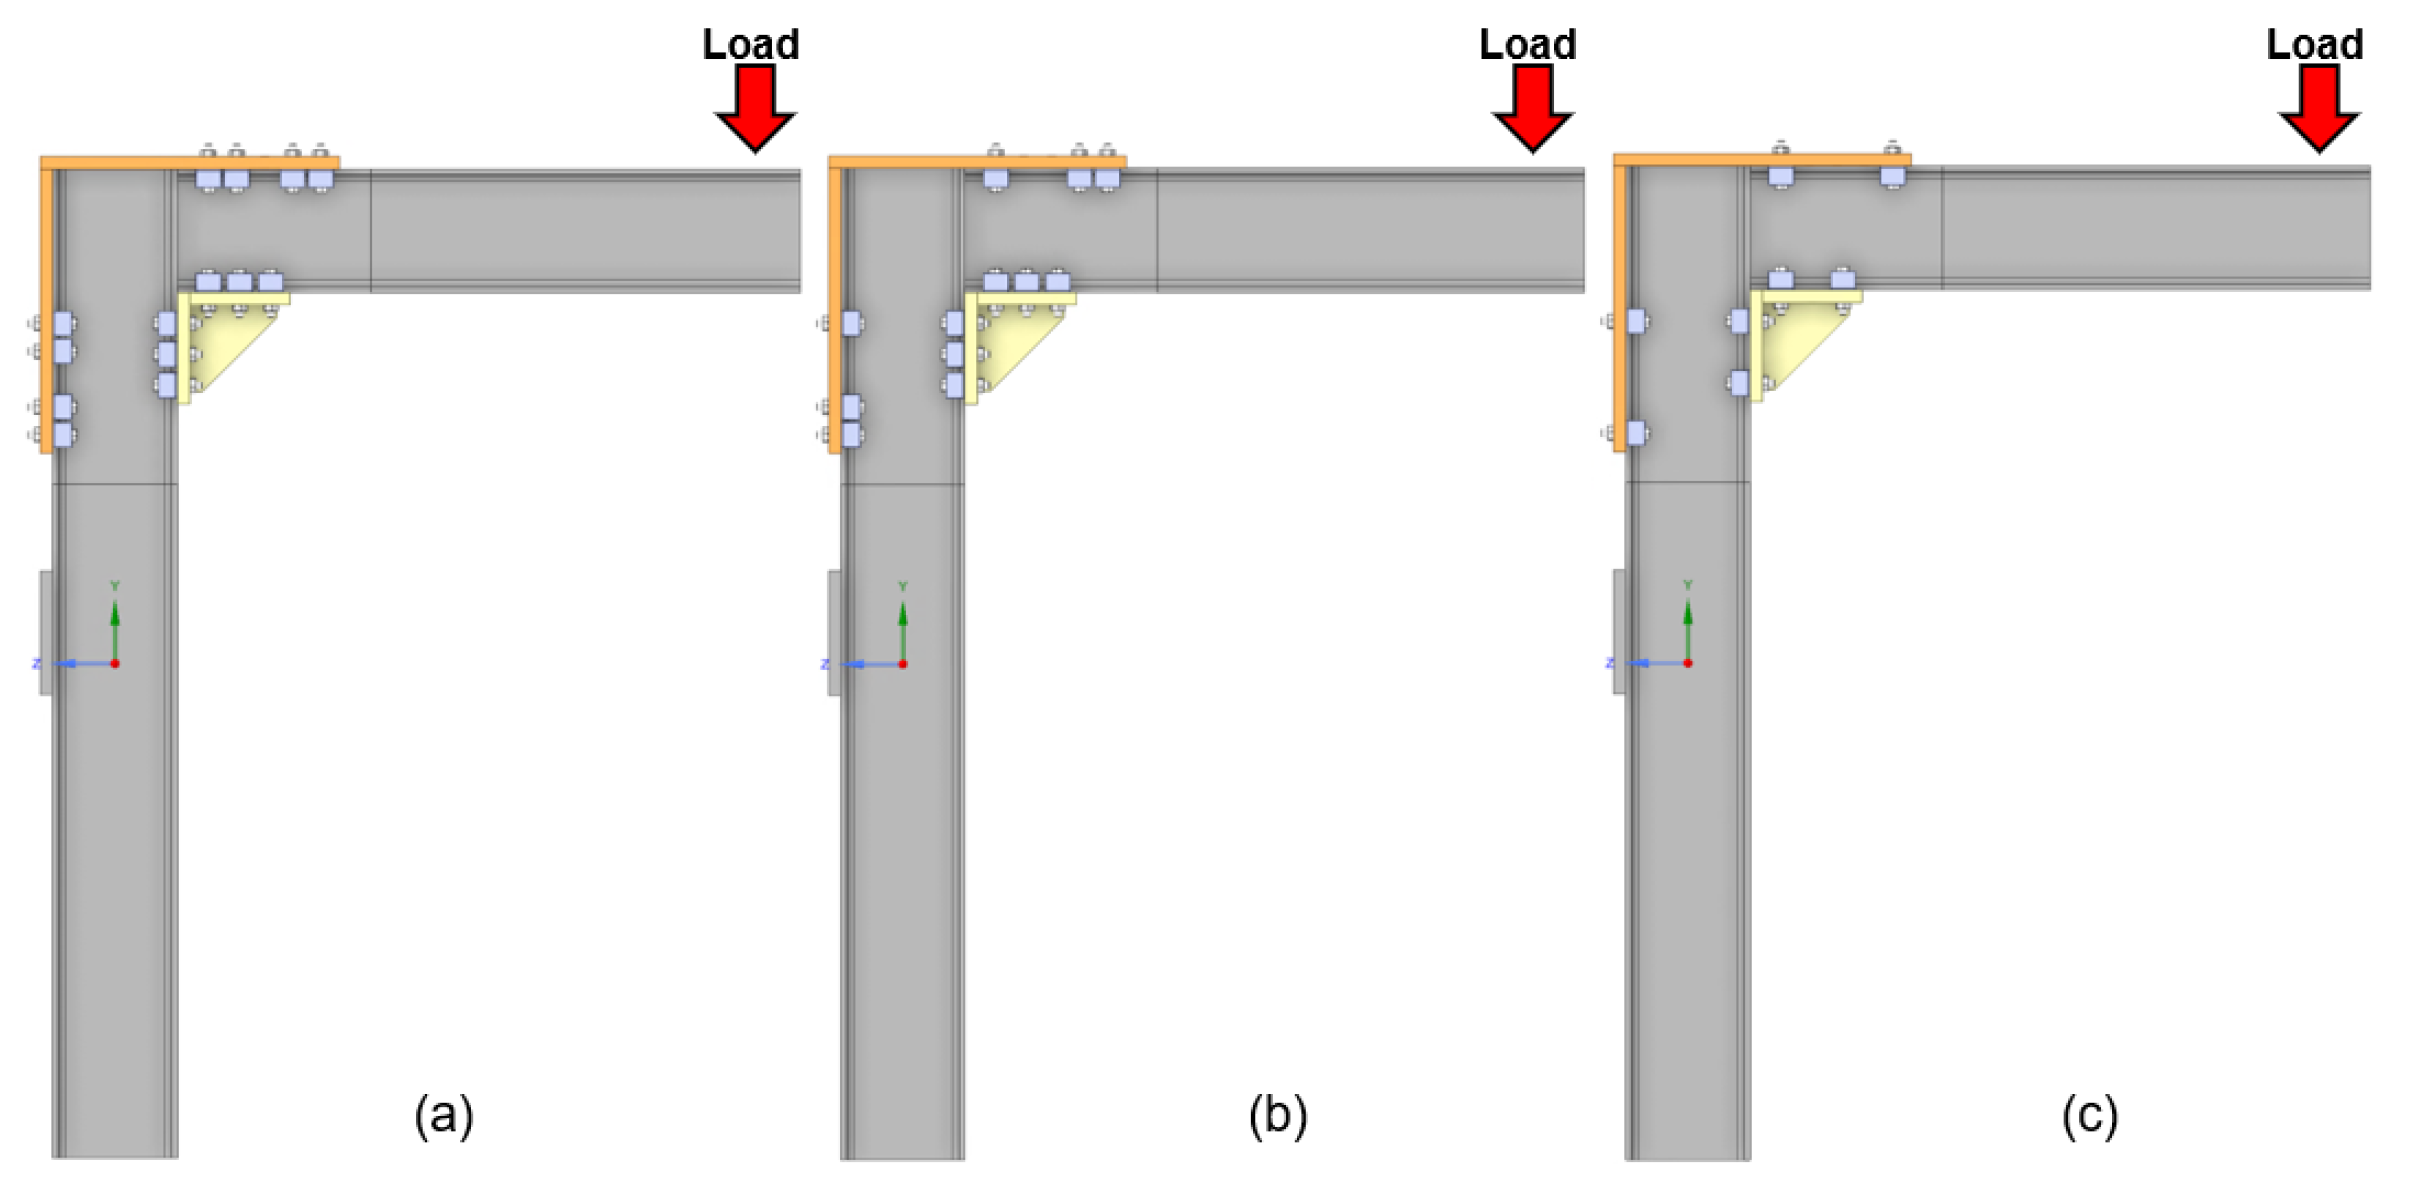
3.1. Specimen Description and Configurations
Application of Pre-Tension and Stepwise Loading
- First, an initial tightening was performed, applying 75% of the reference torque, resulting in 69.5 Nm;
- Second, a final tightening was applied at 110% of the reference torque, corresponding to a final torque of 102.0 Nm.
- = reference tightening torque (Nm);
- = nominal bolt diameter (m);
- = nominal minimum pre-load force (N);
- = torque coefficient.
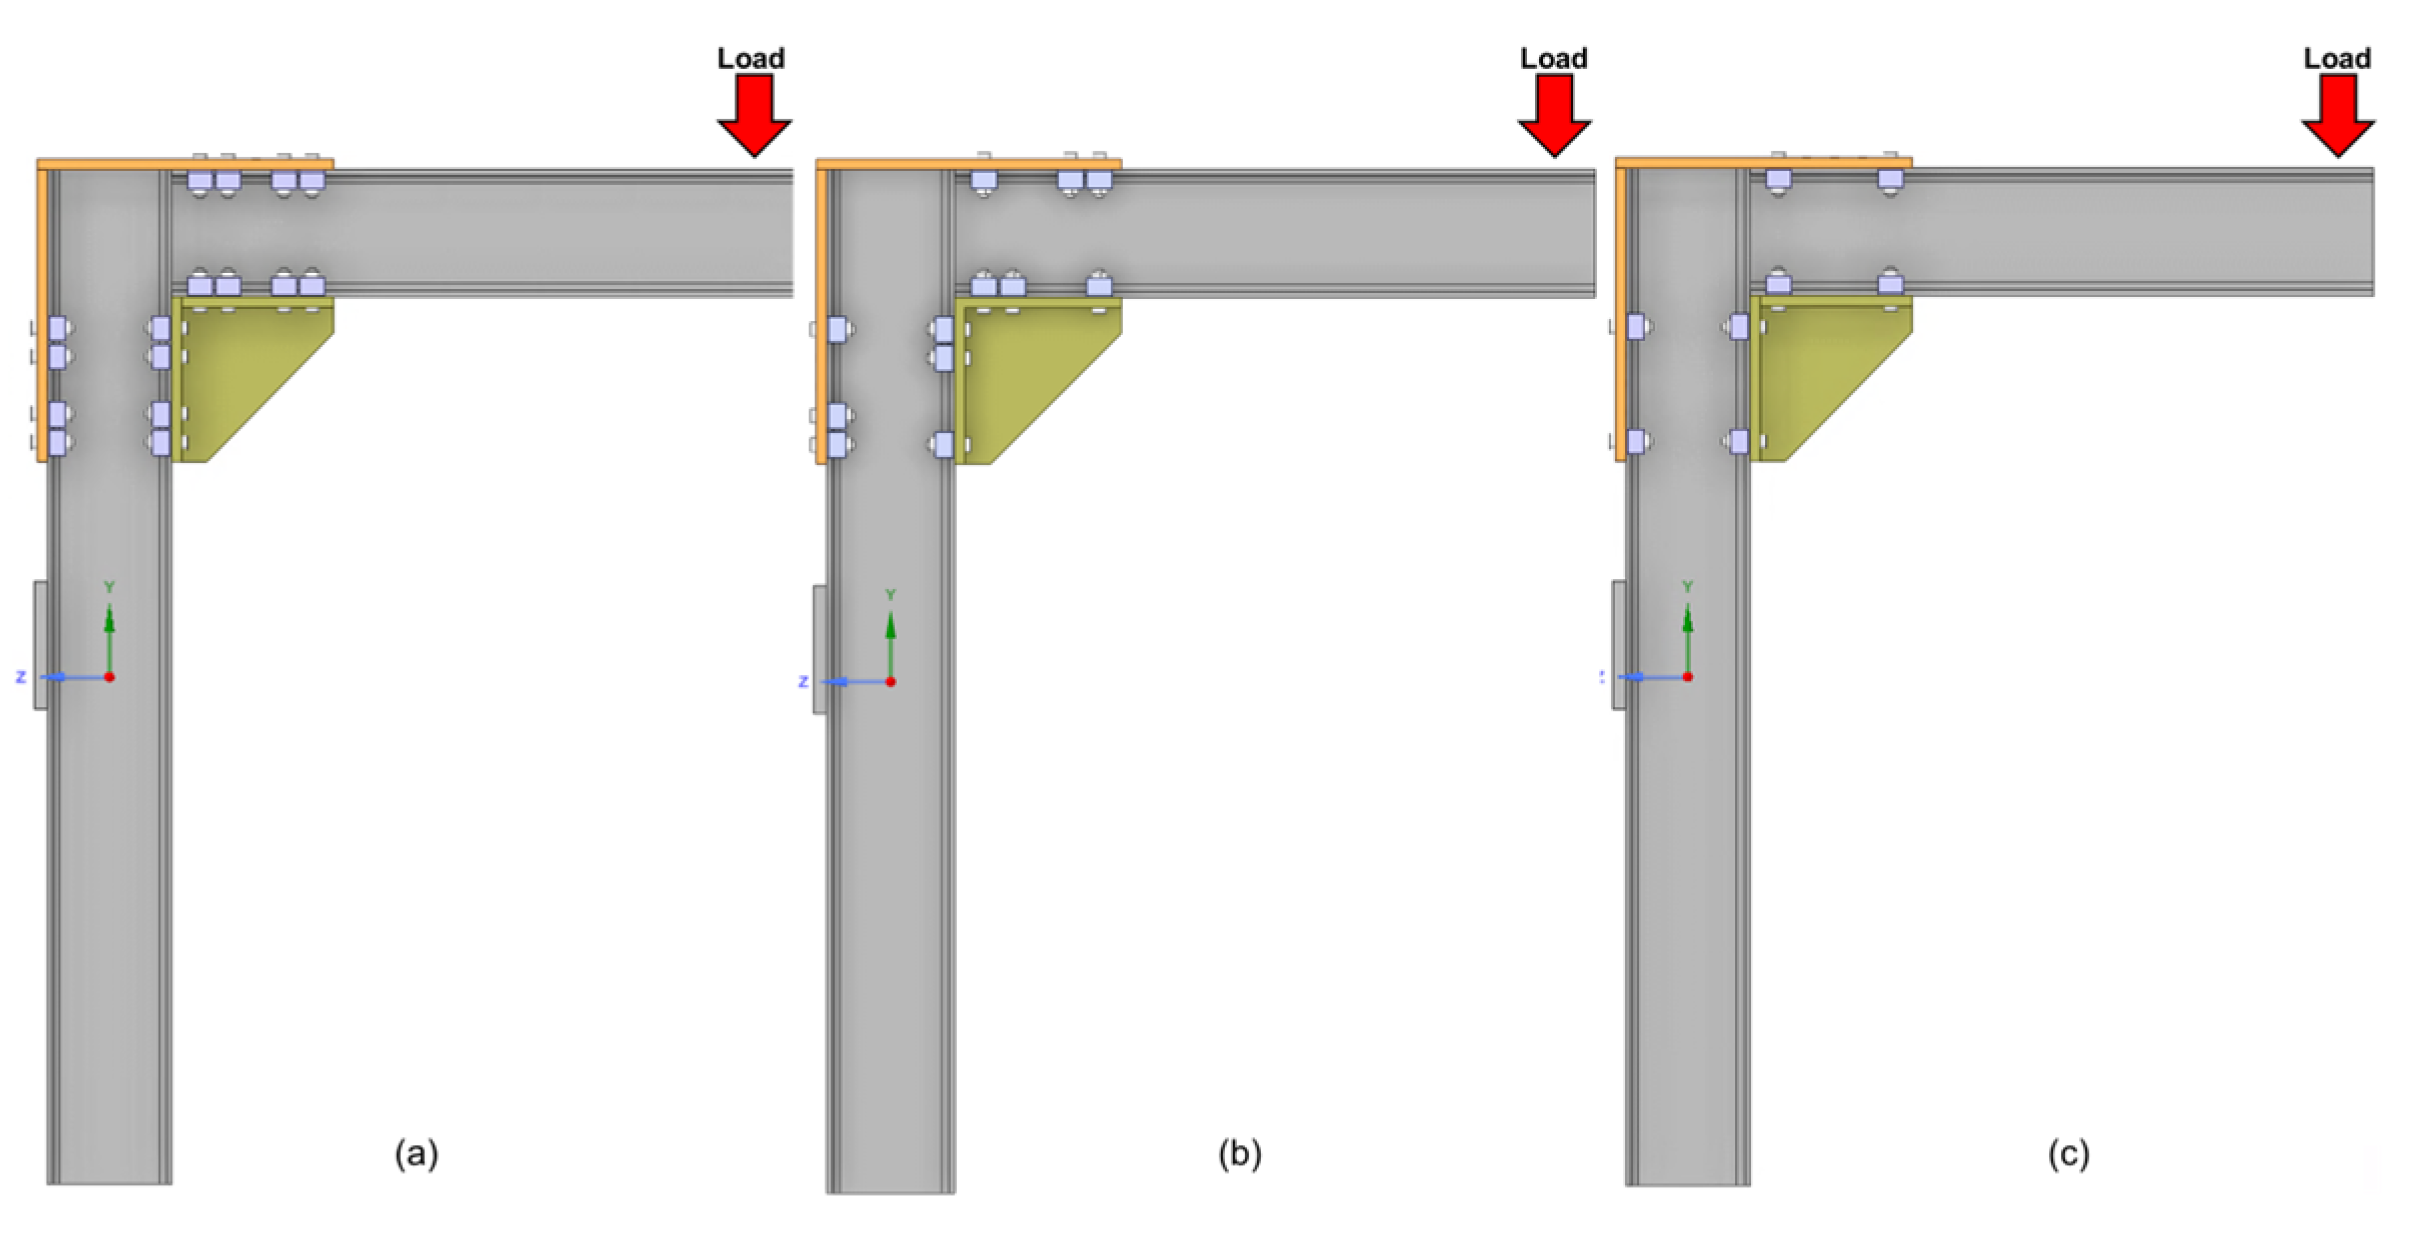
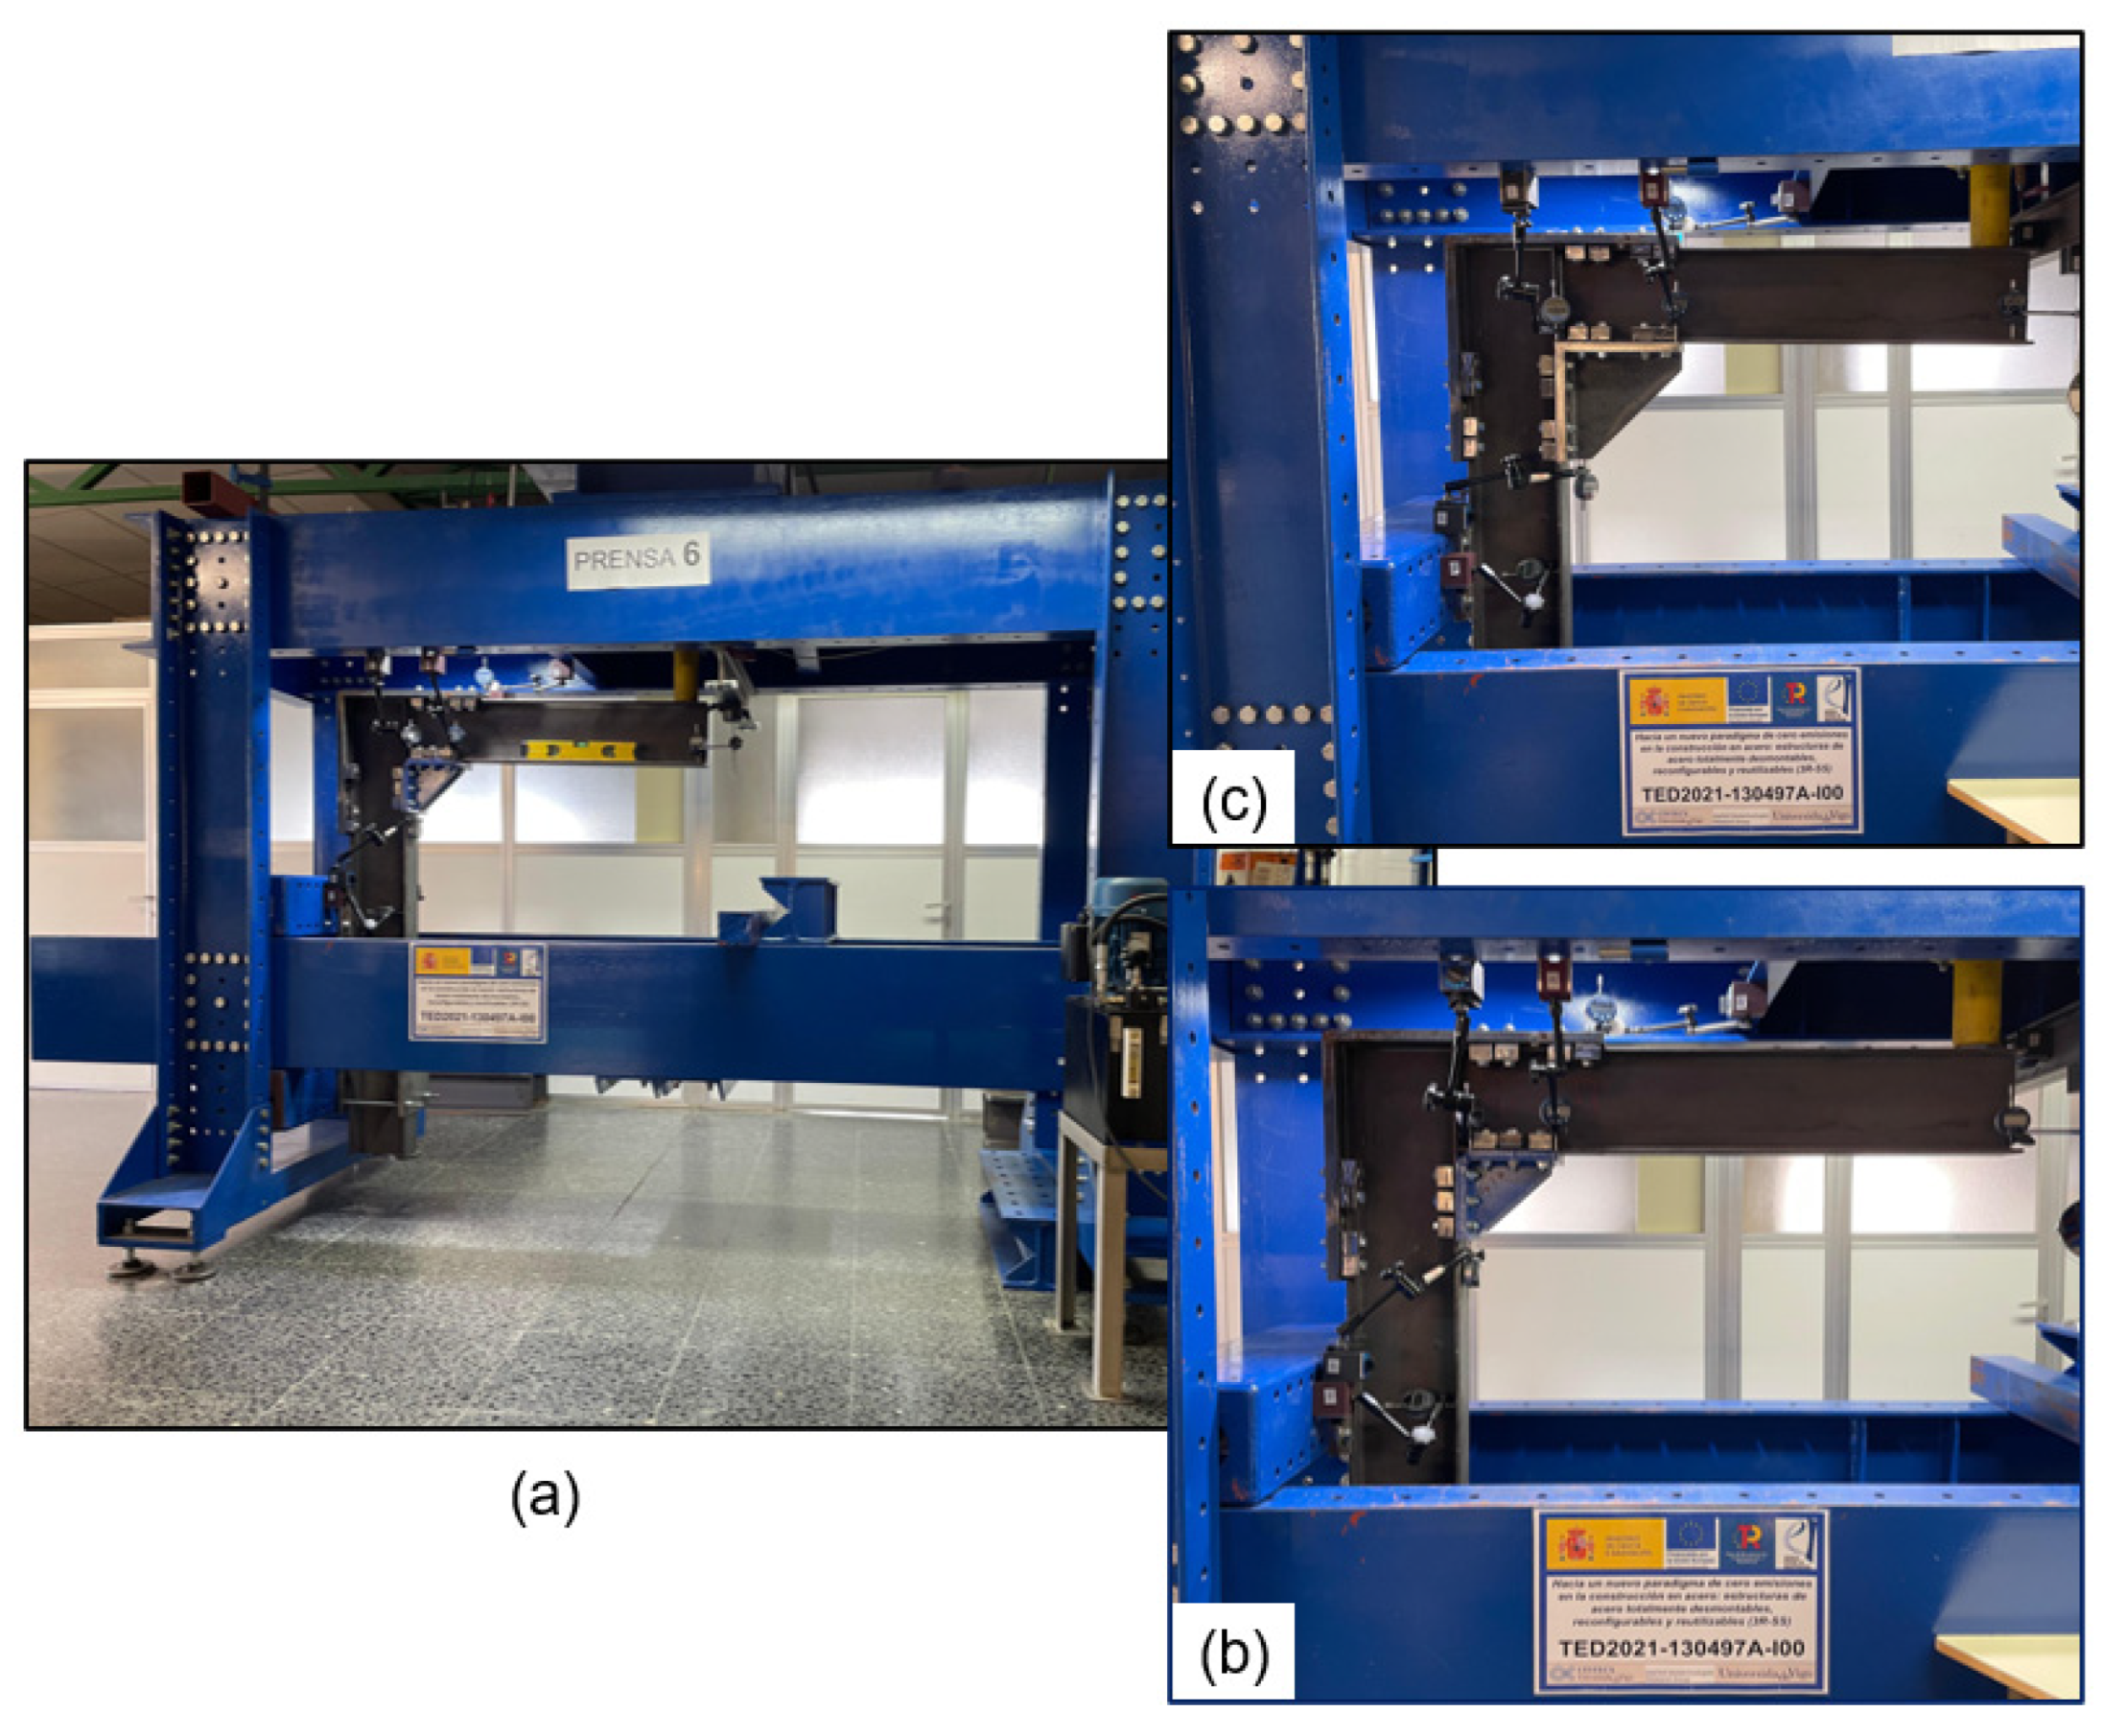
3.2. Experimental Program
3.2.1. Initial Assumptions
3.2.2. Specimens Specification
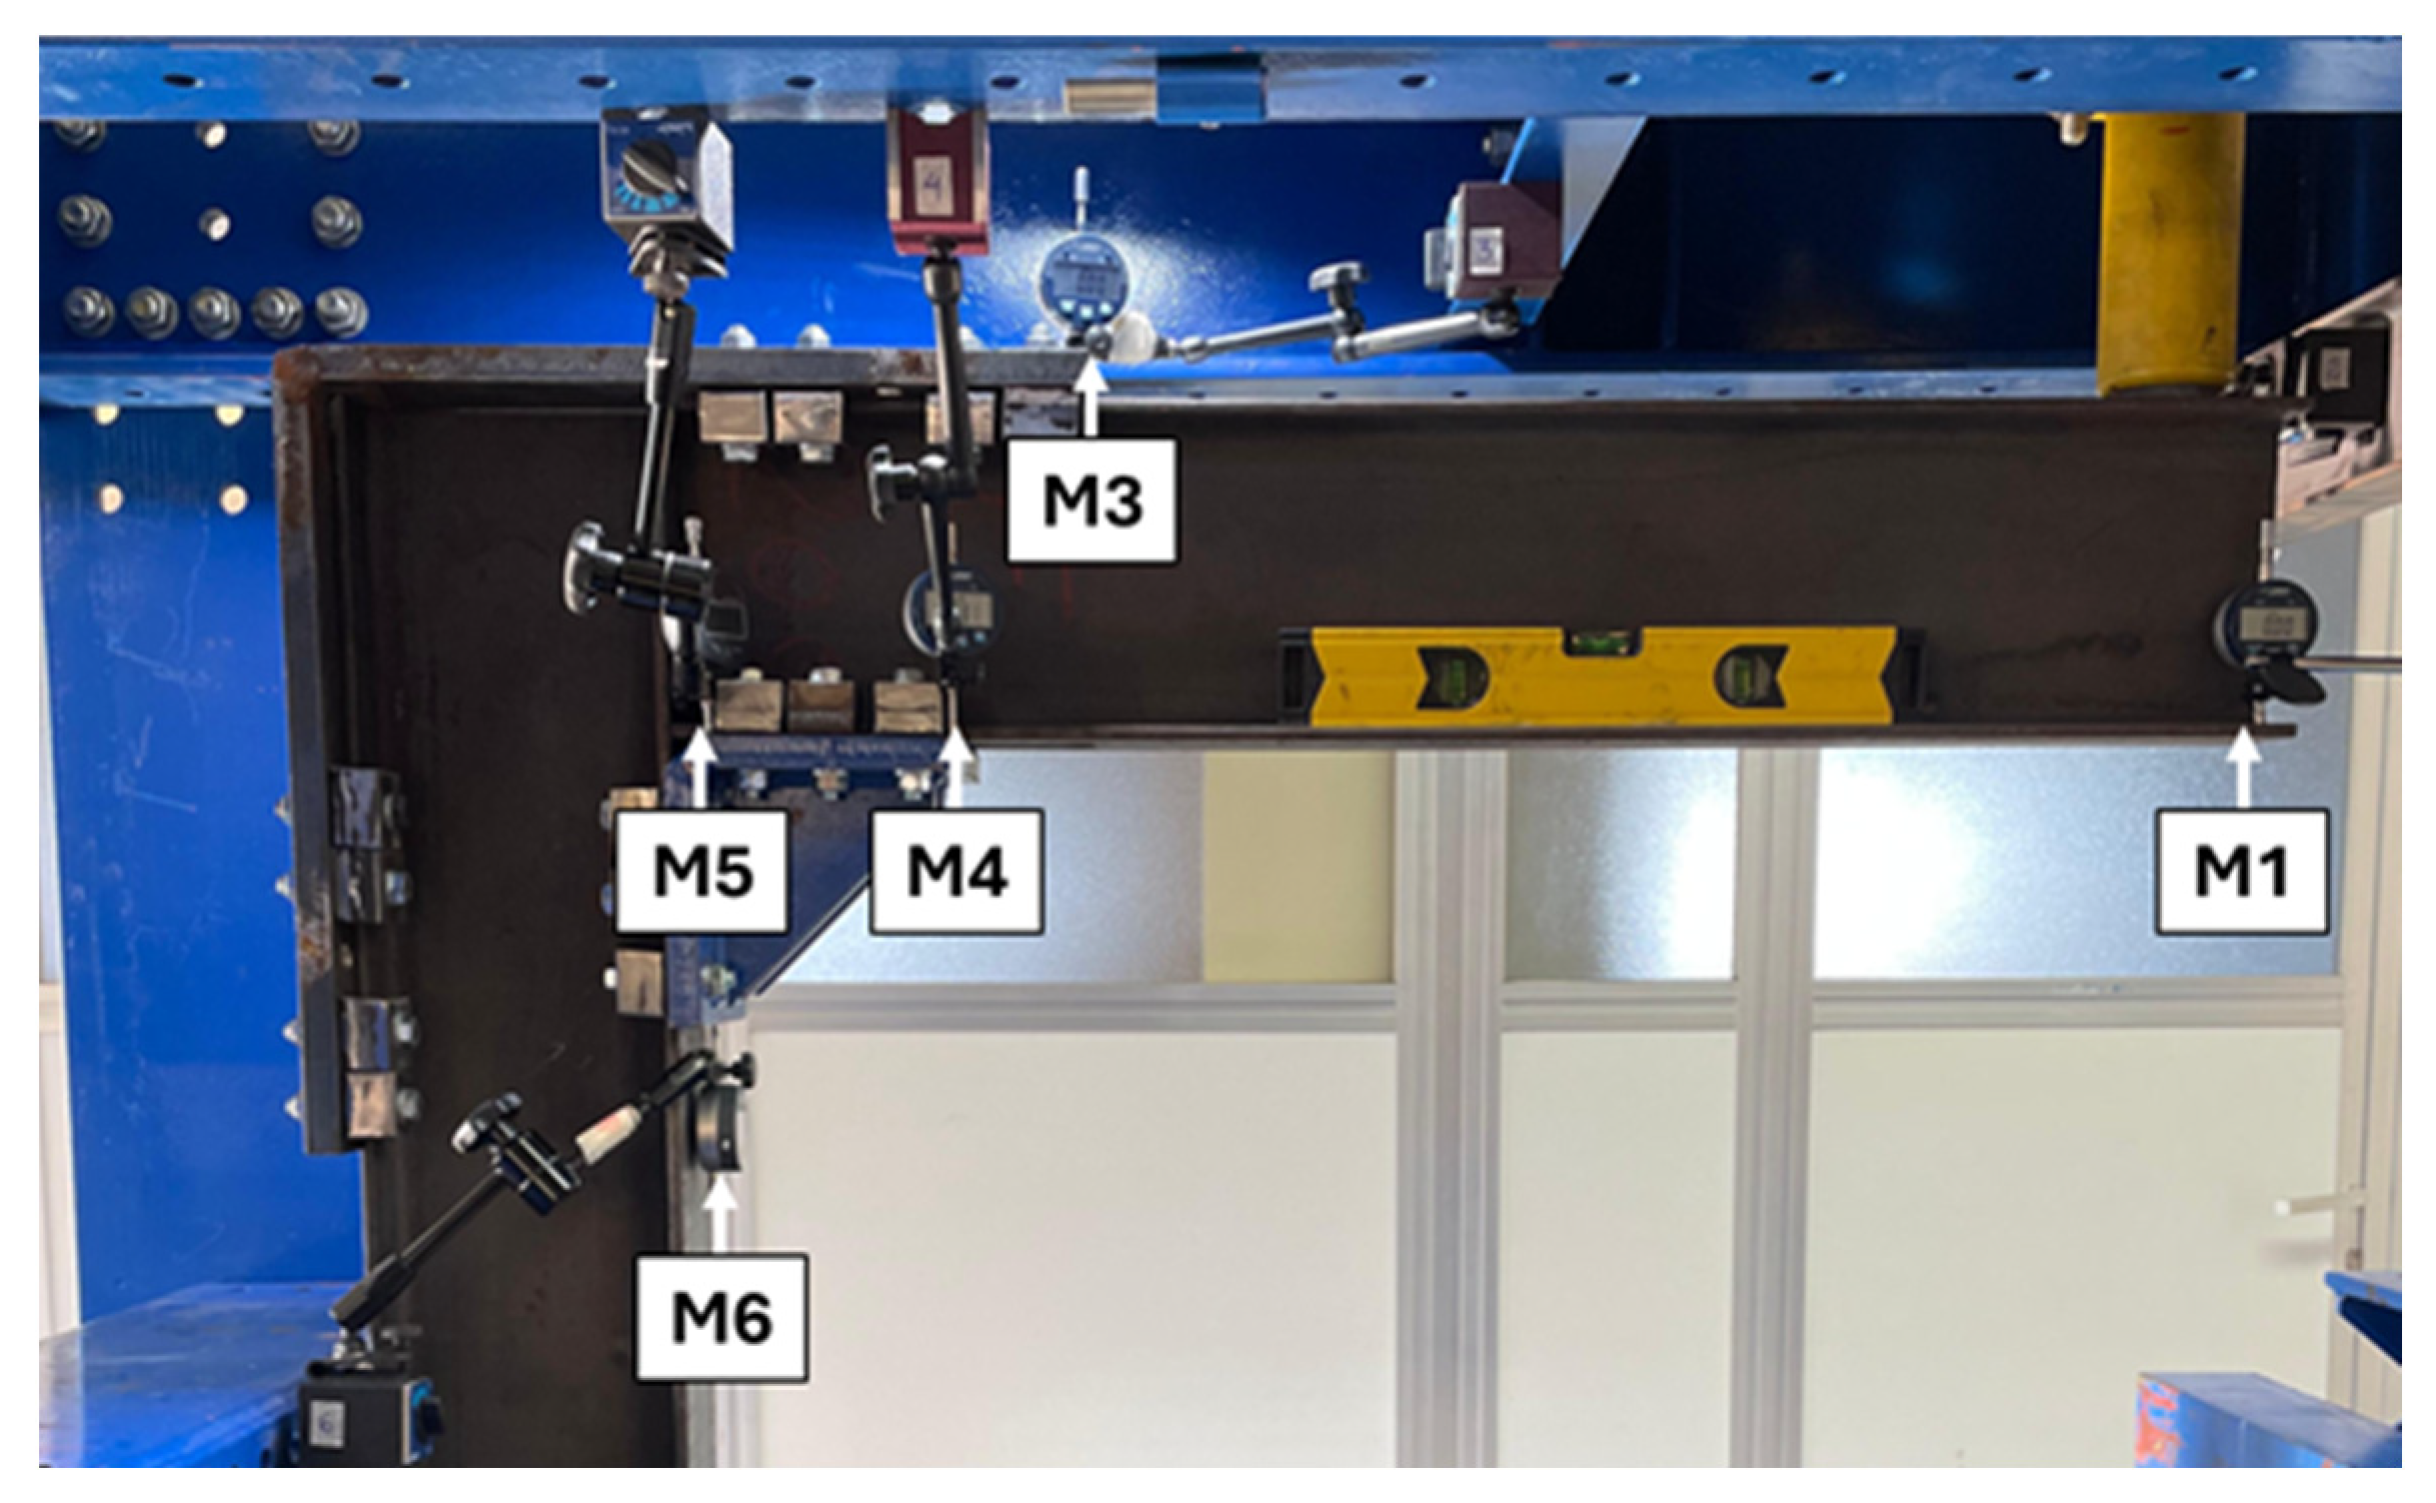
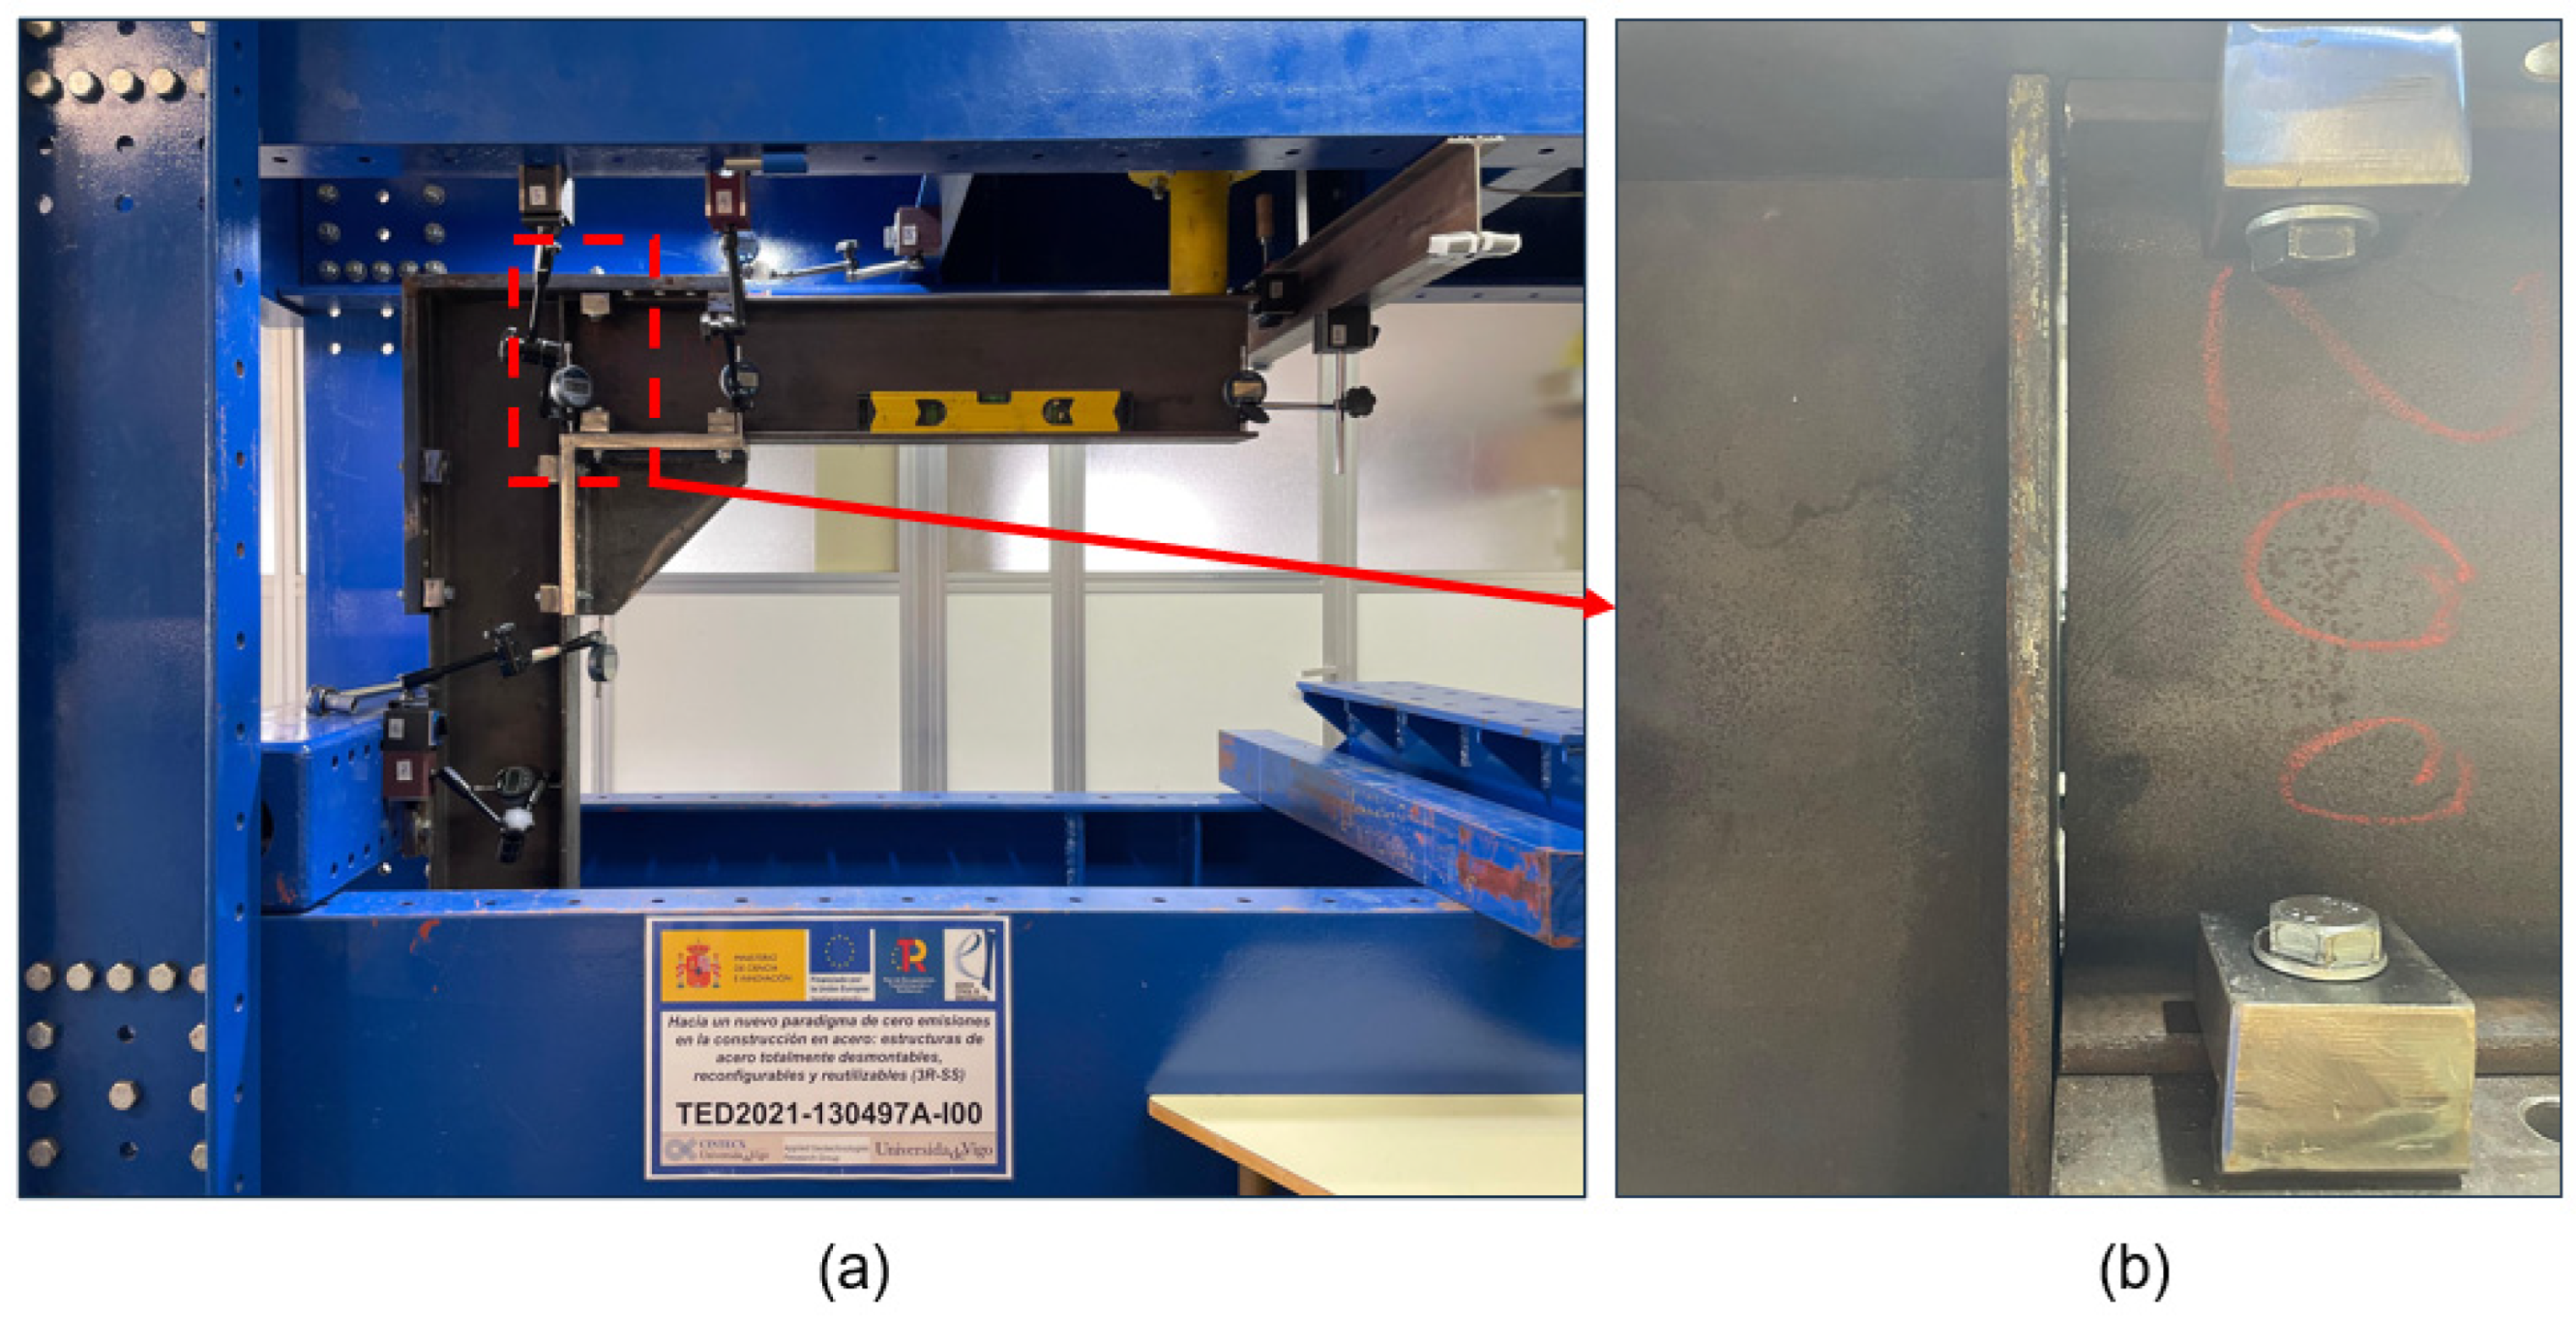
3.2.3. Structural Monitoring
3.3. Numerical Modeling
3.3.1. Material Properties
3.3.2. Contact Interactions and Friction Coefficient
3.3.3. Bolt Pretension
3.3.4. Mesh Generation
3.4. Validation Procedure
4. Results and Discussion
4.1. Experimental Results and Comparison
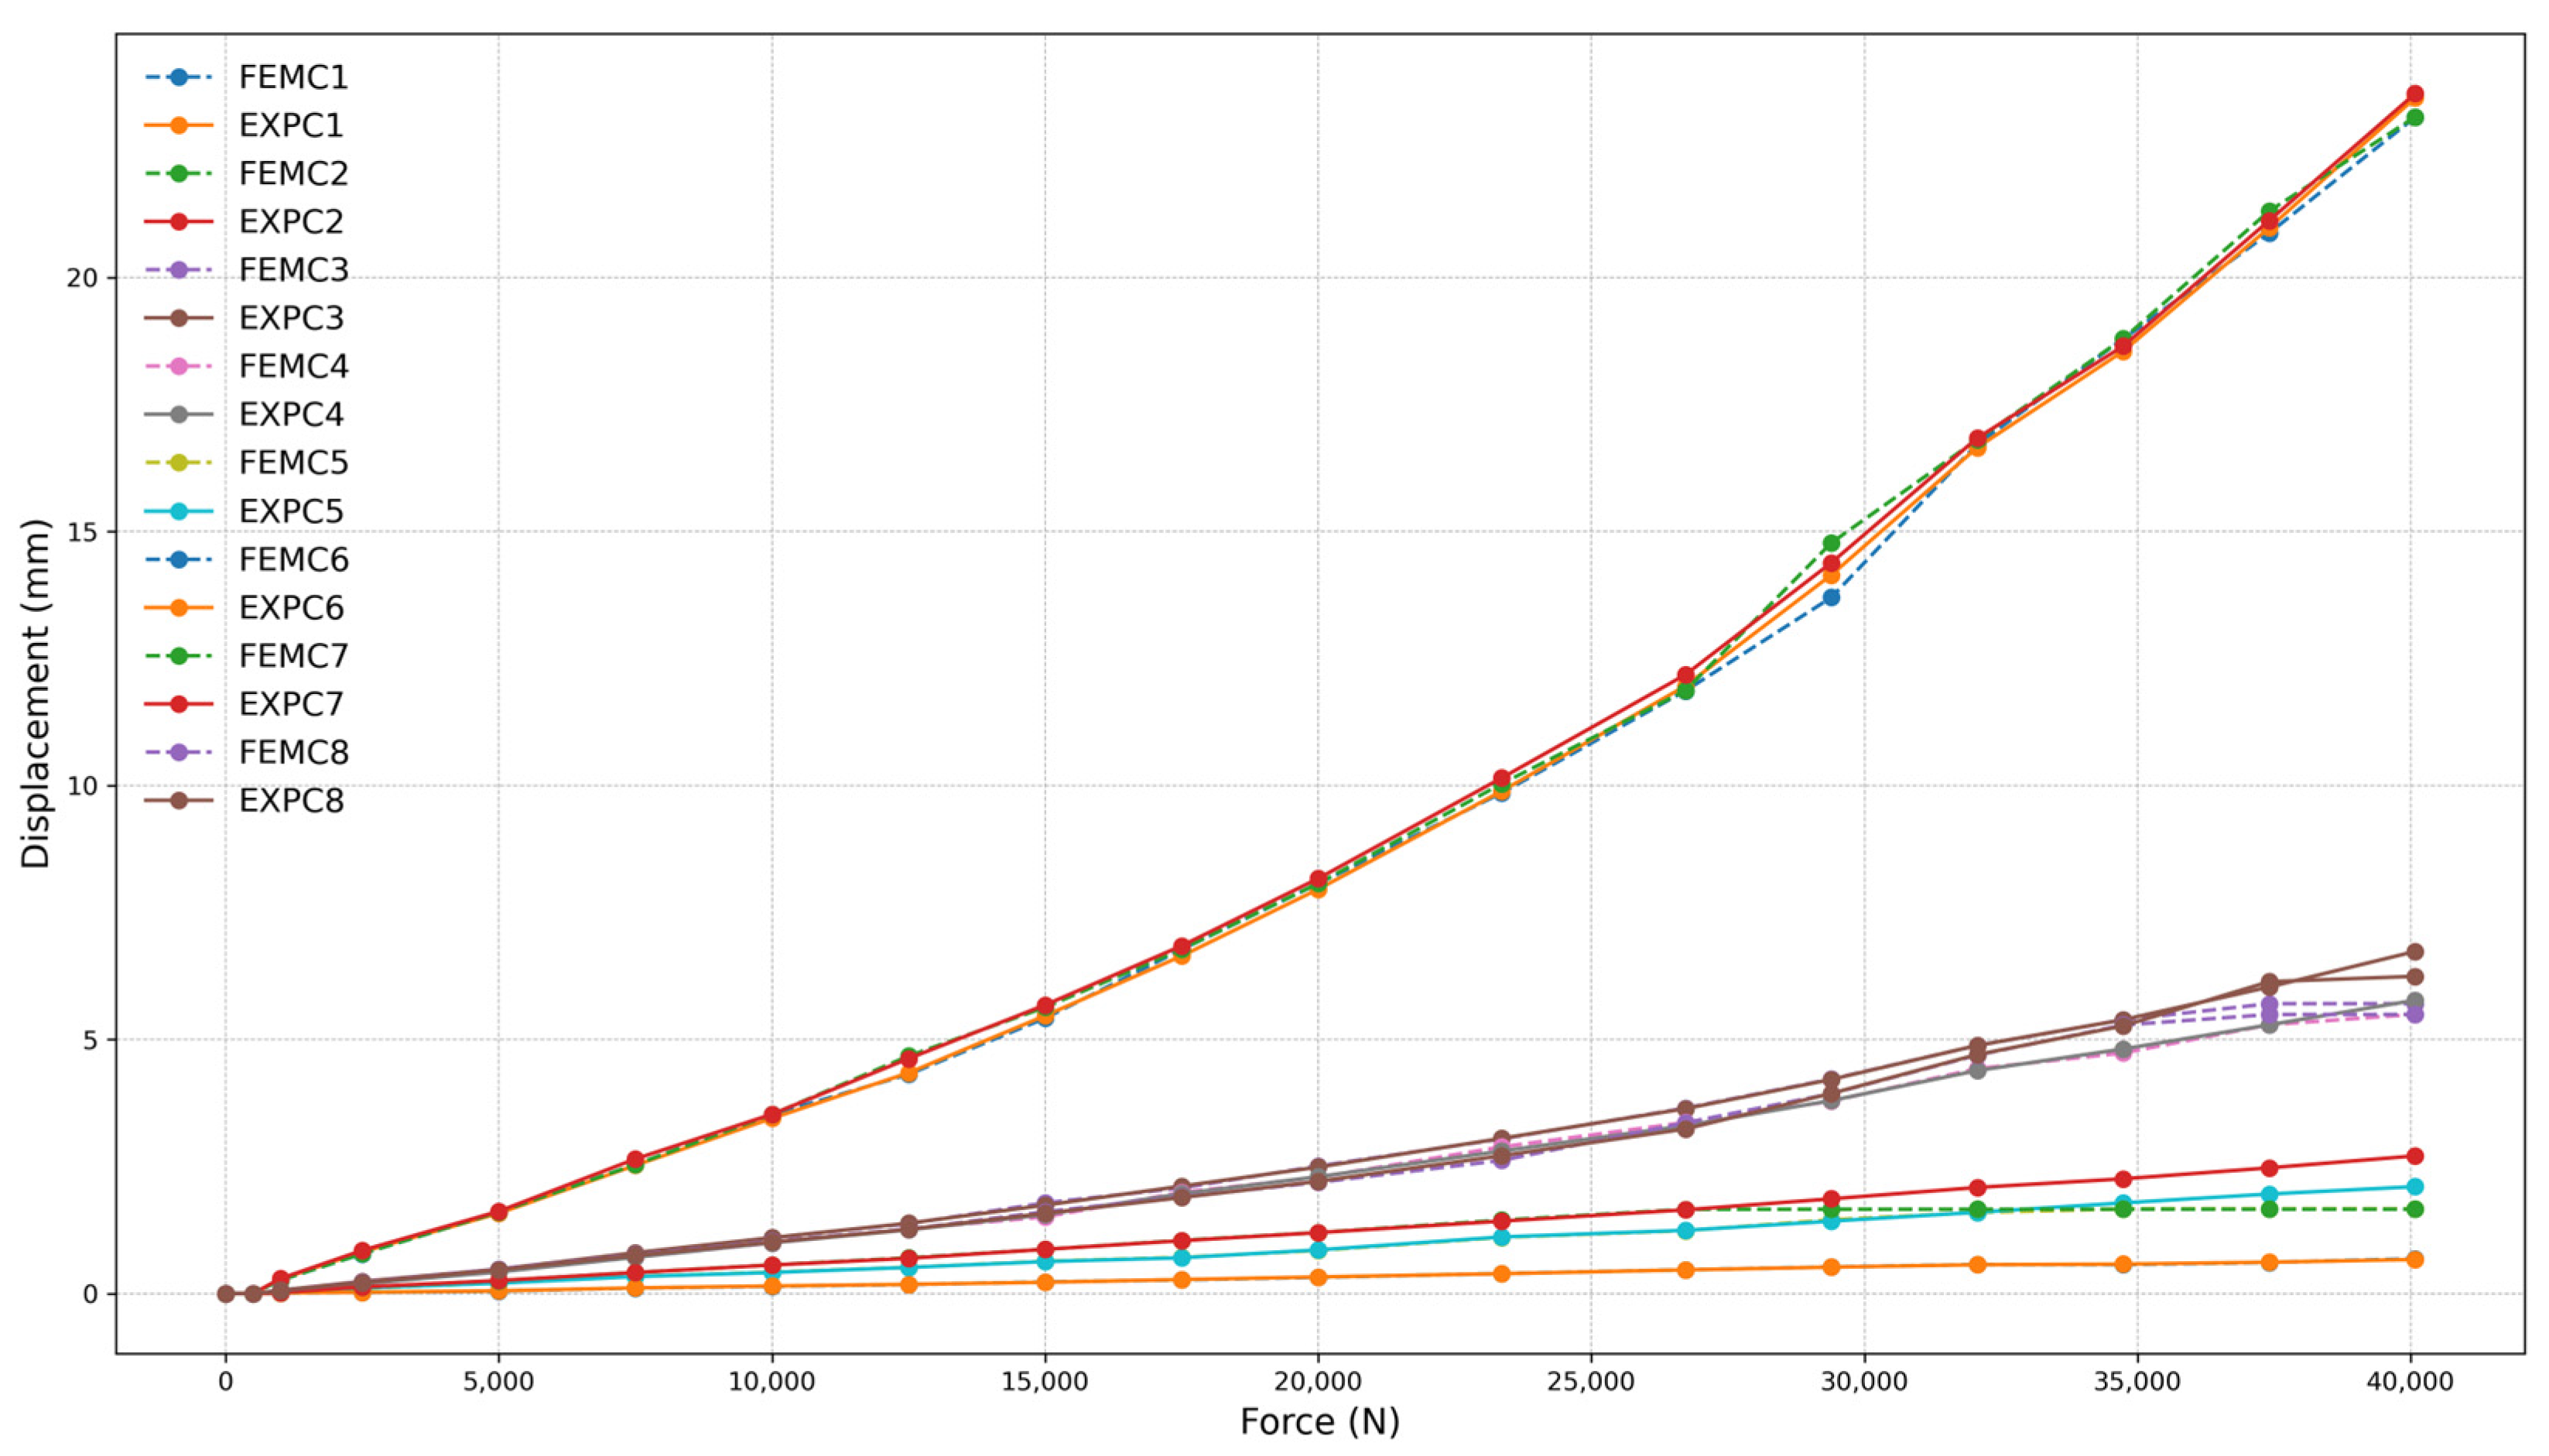
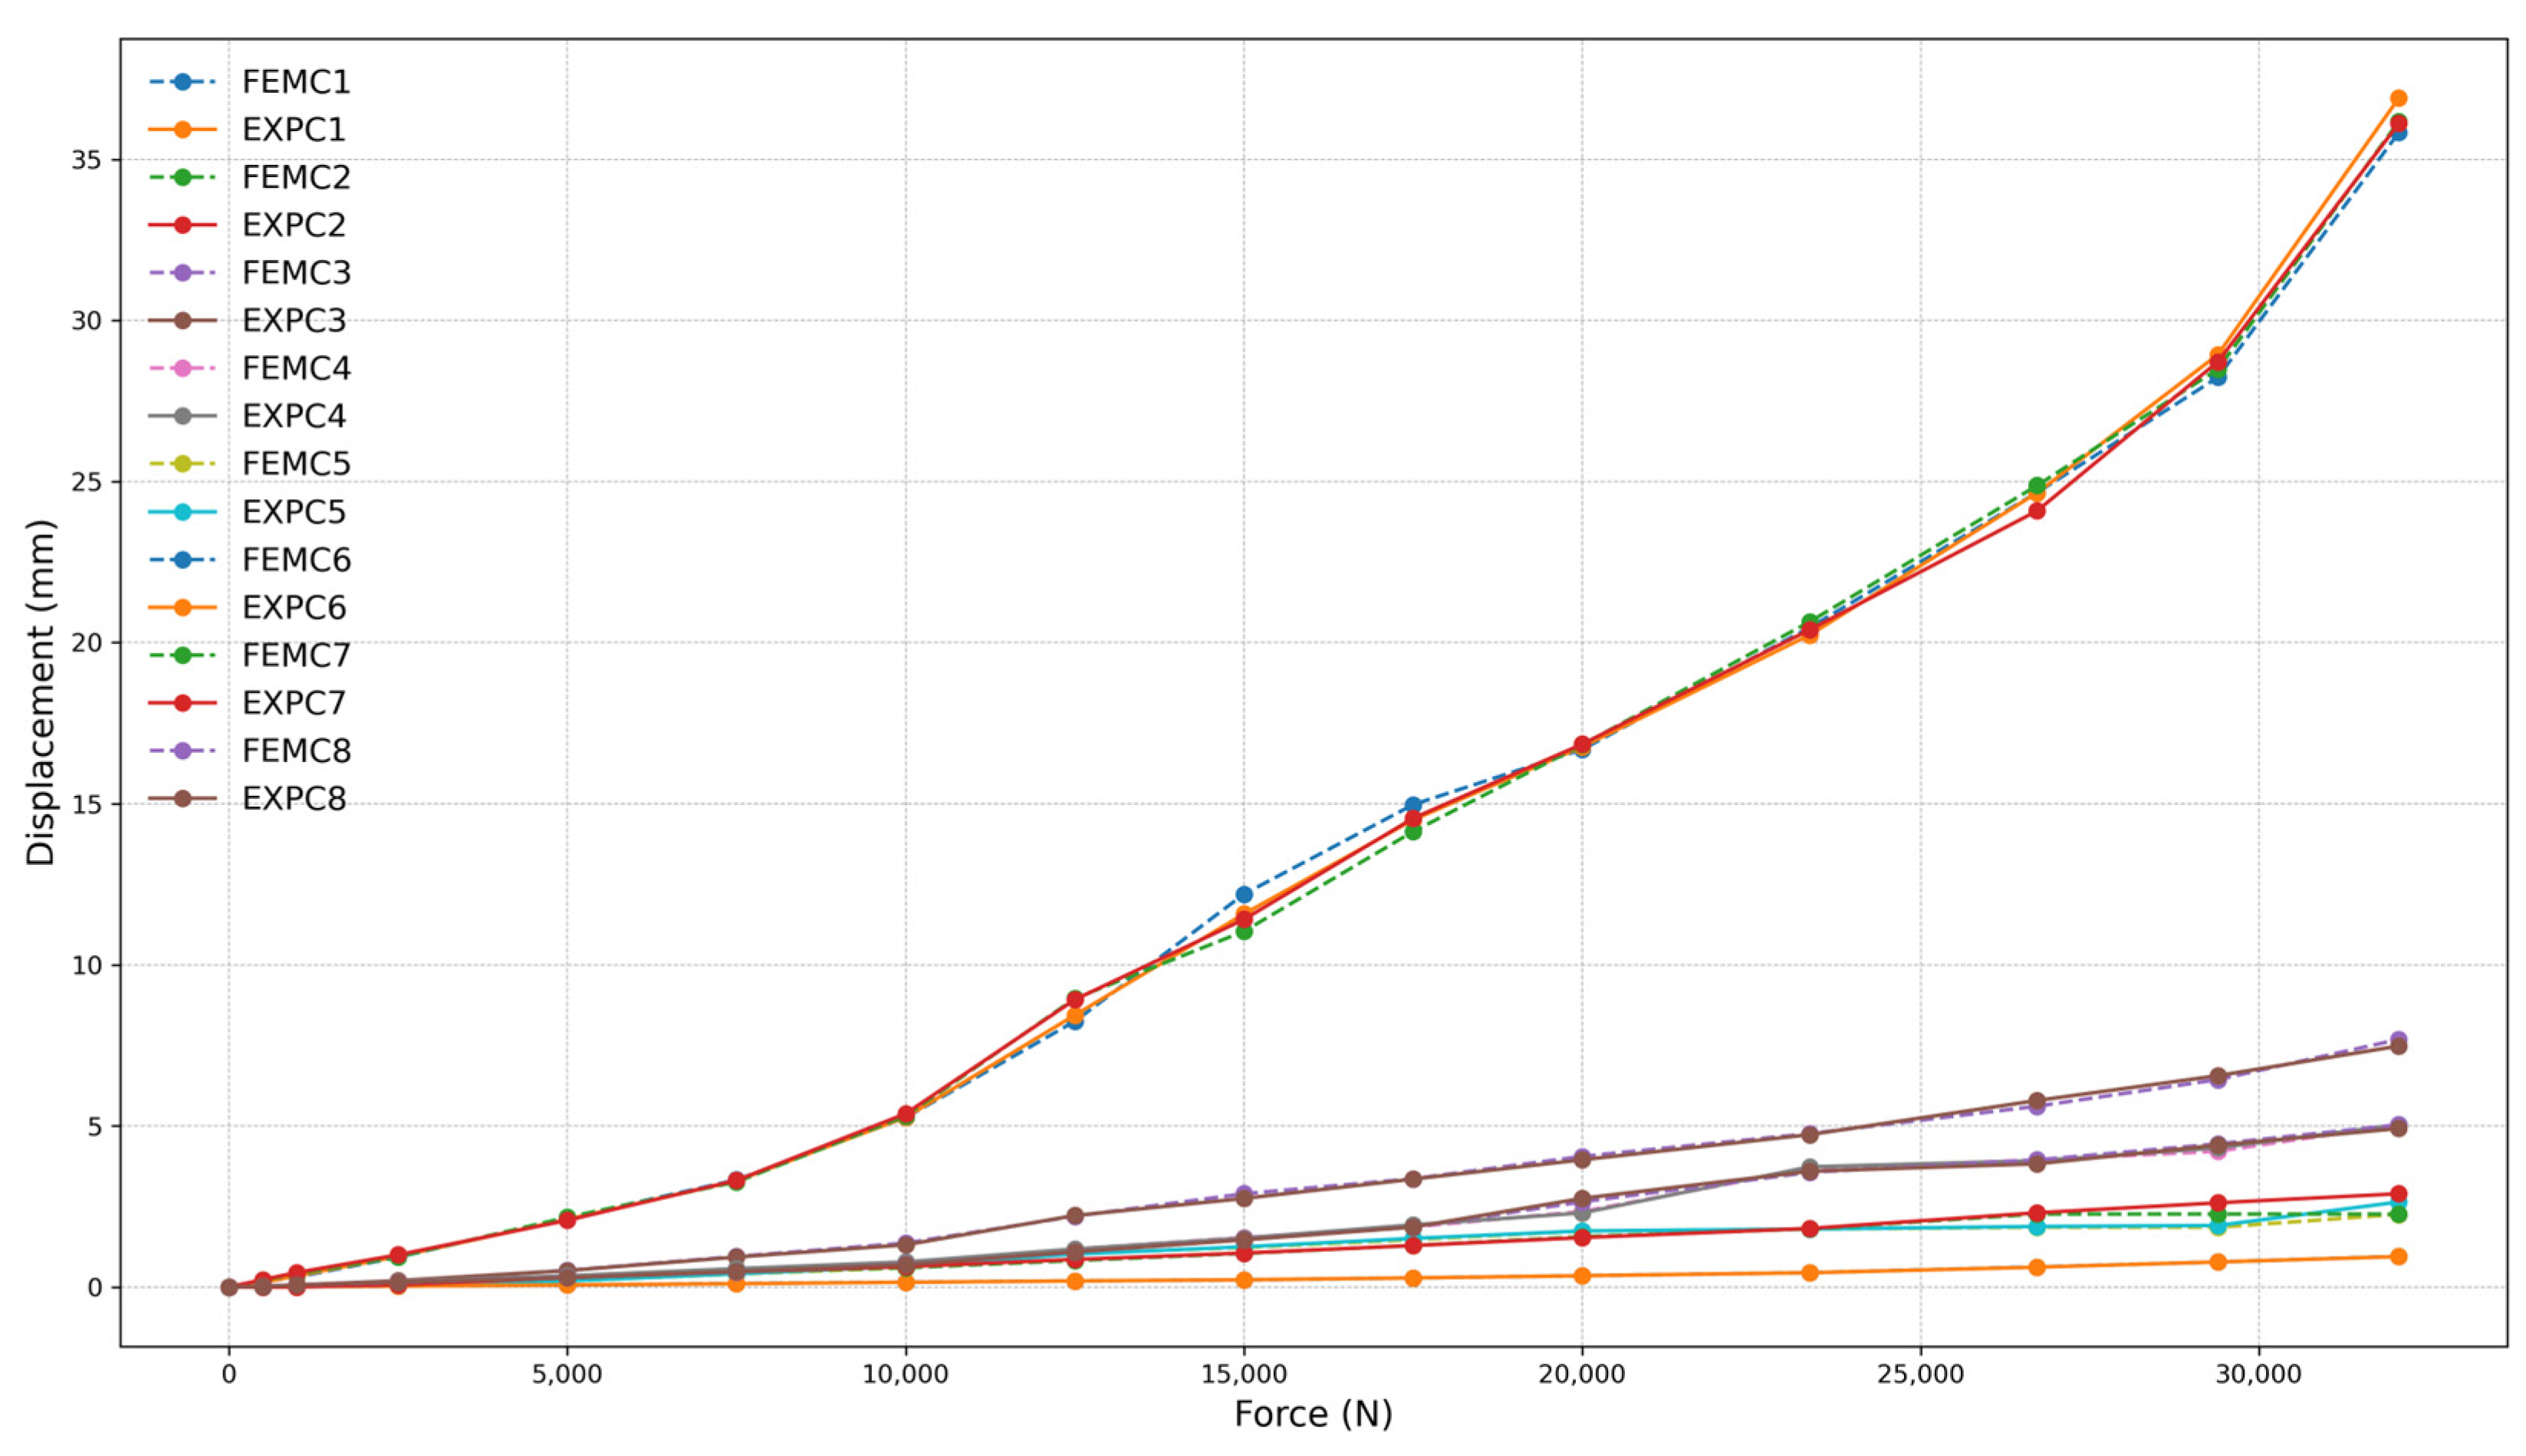
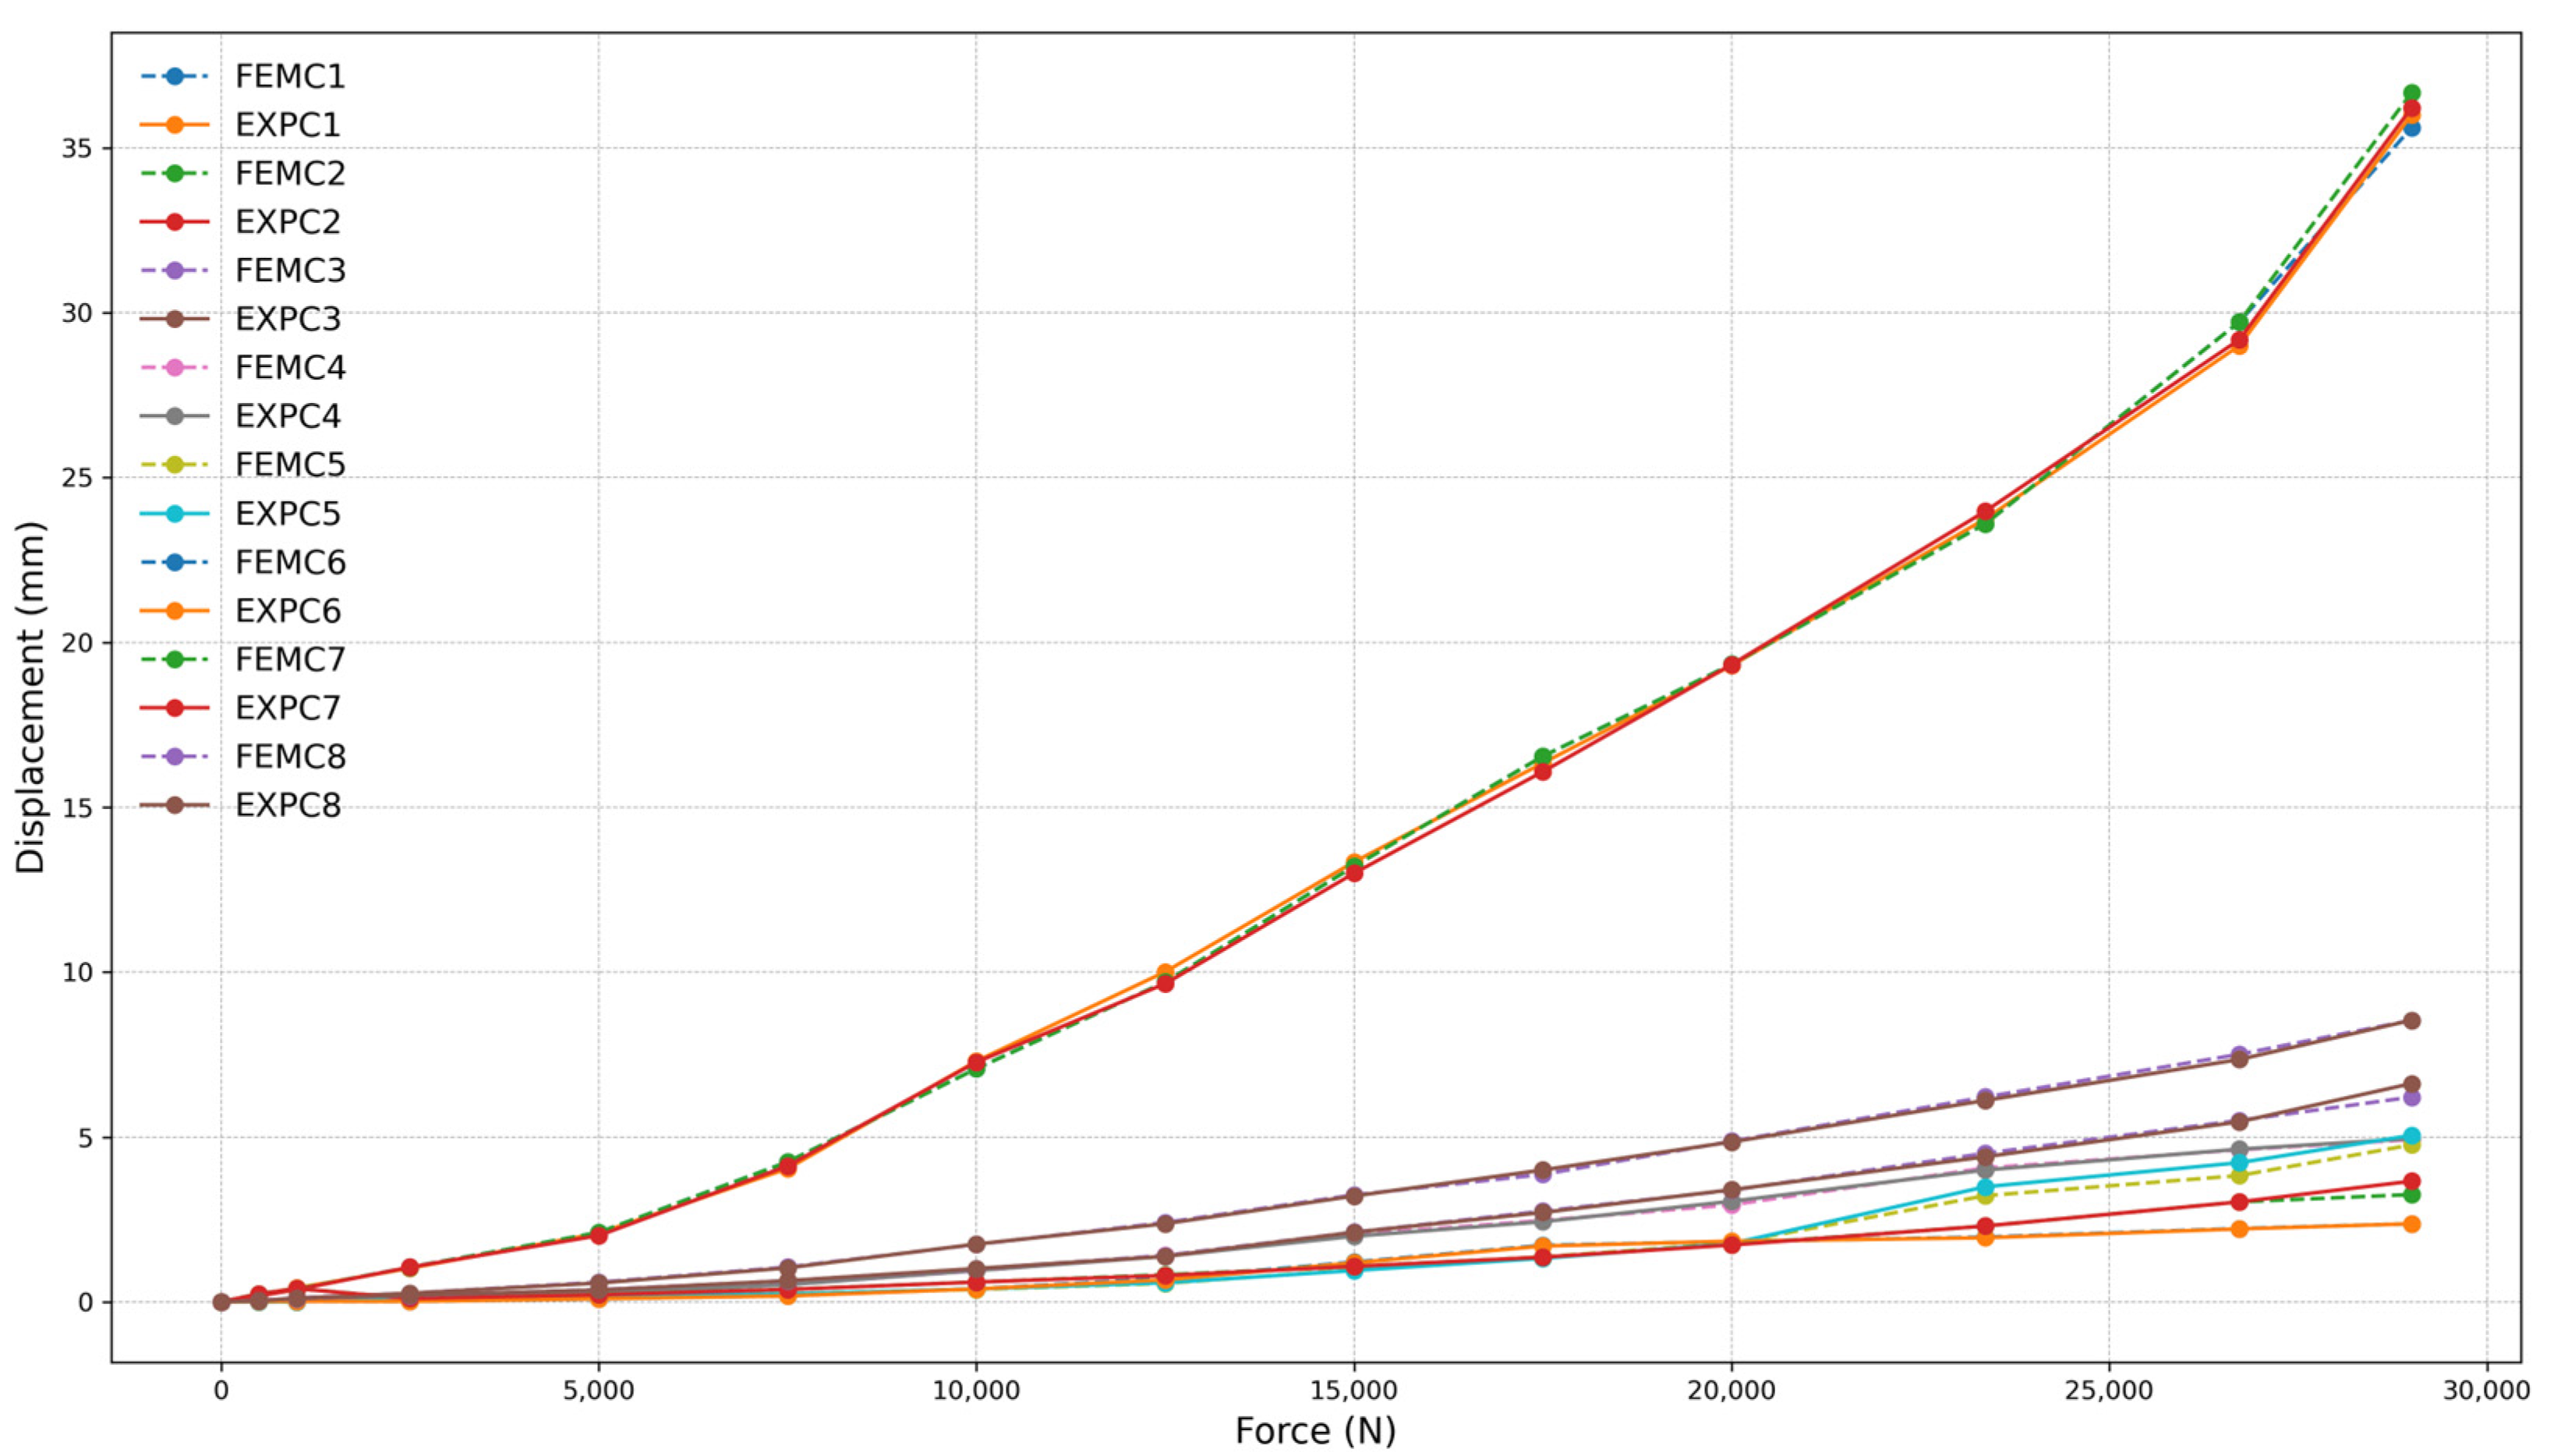
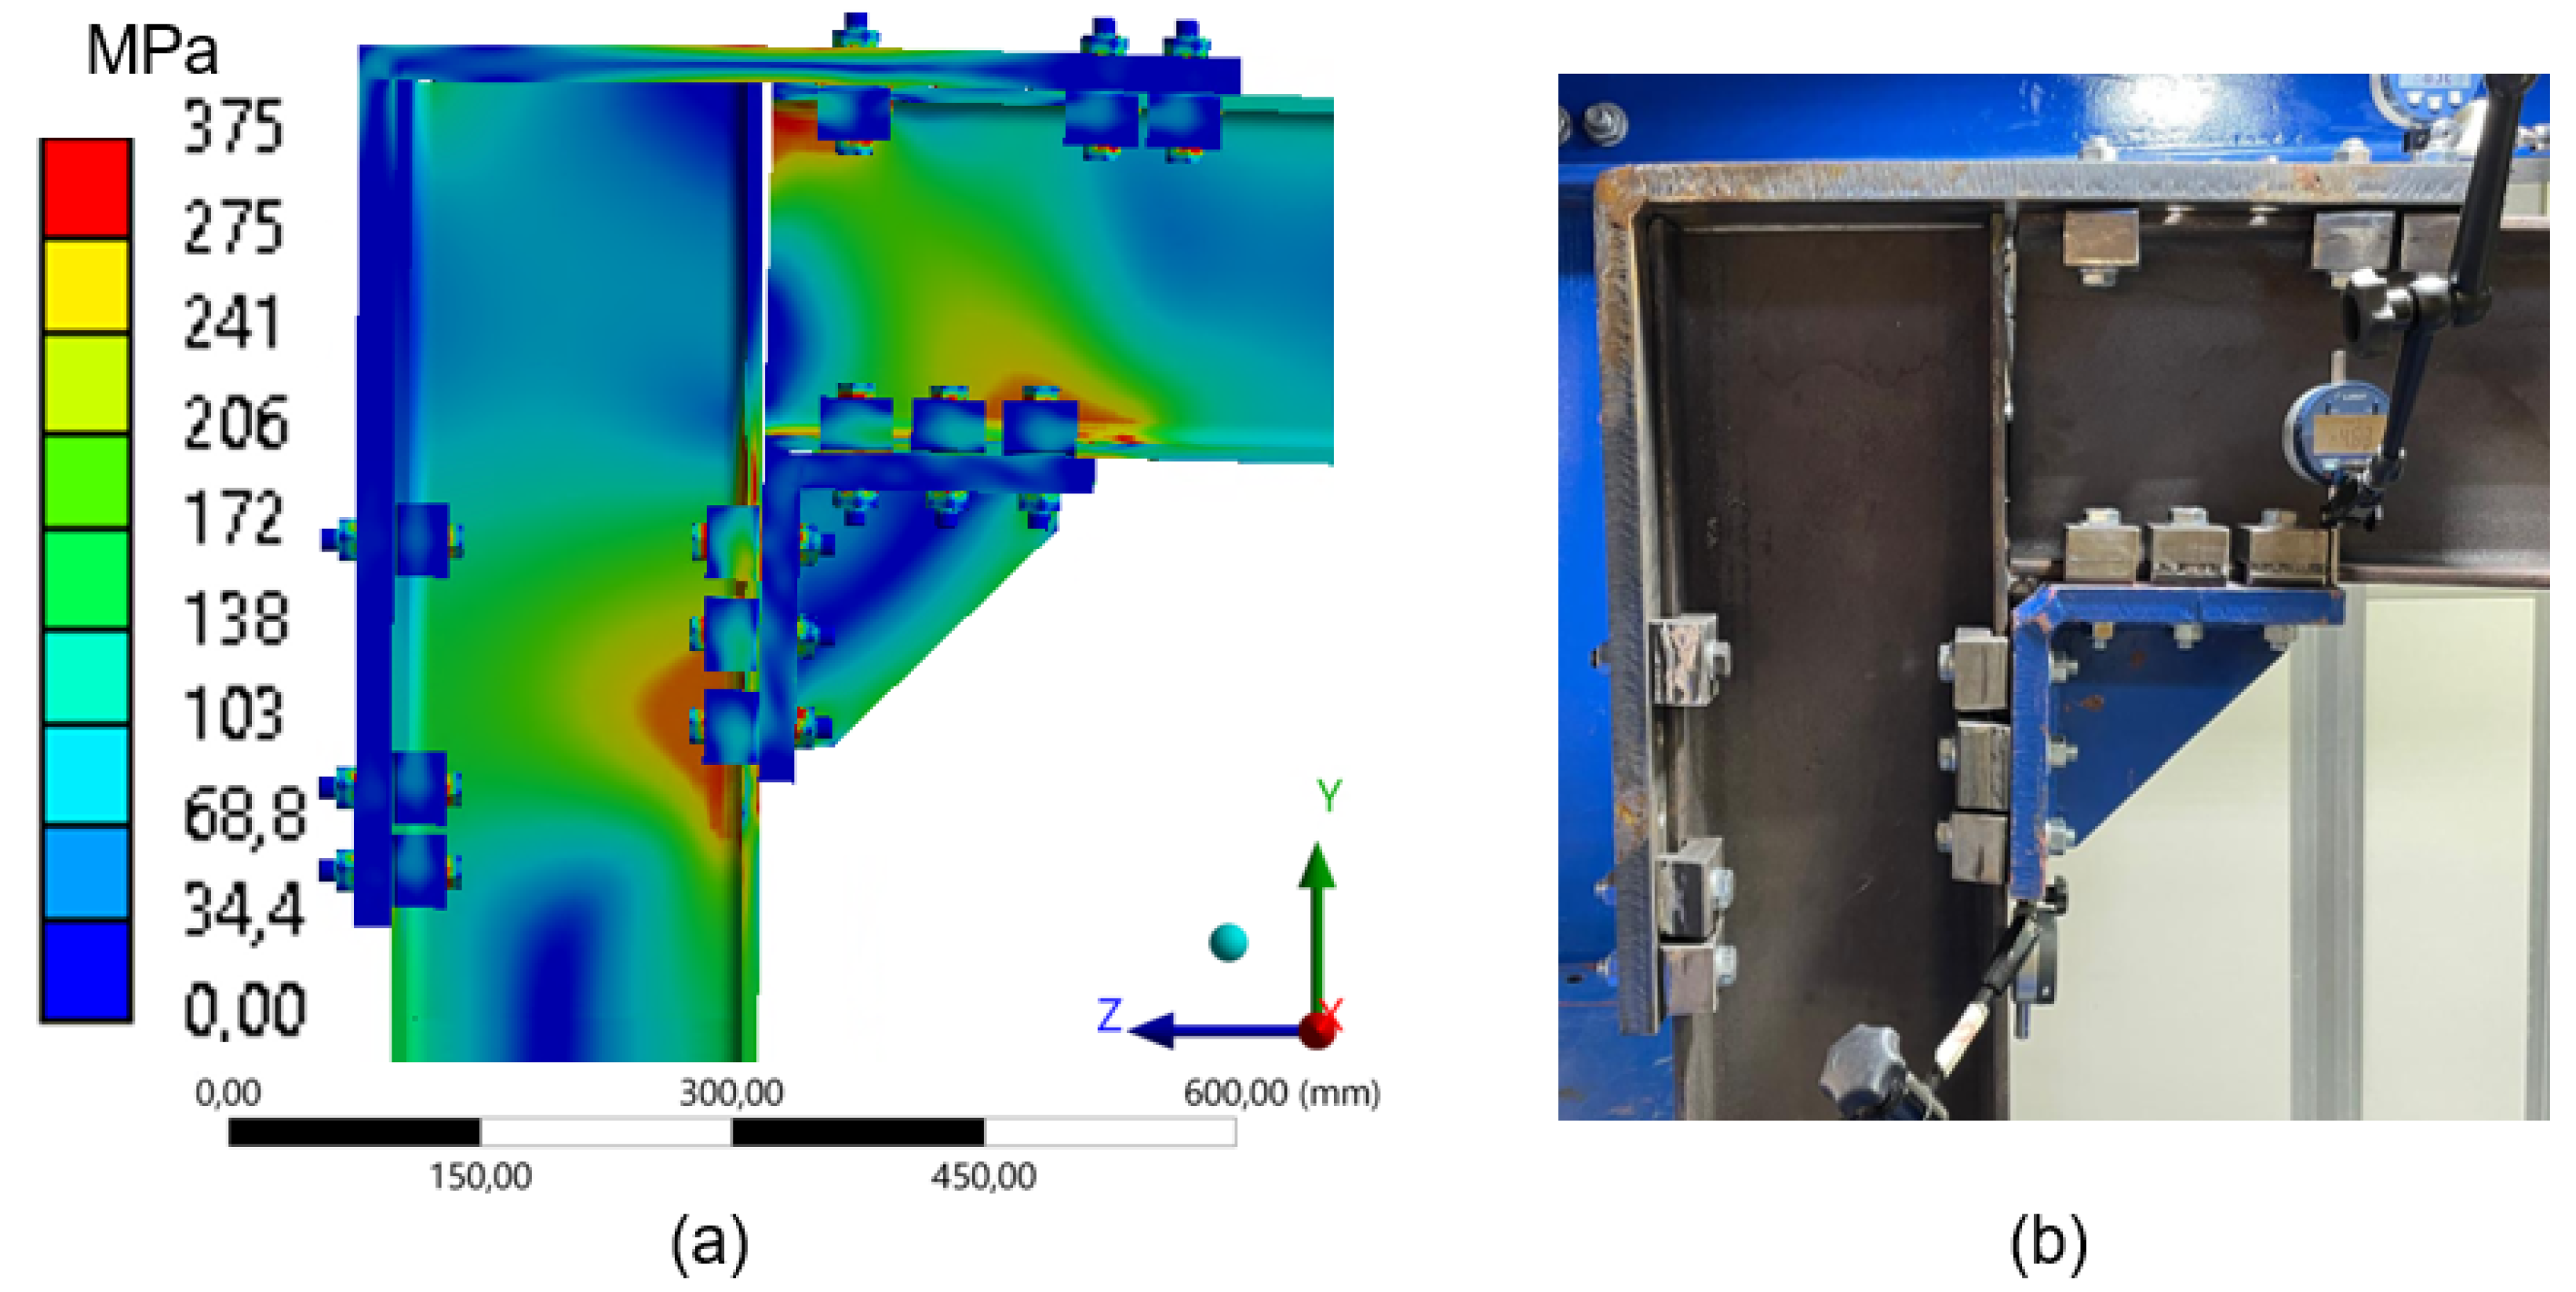
4.1.1. Comparison Between FEM and Experimental Data for the 260 mm Frame
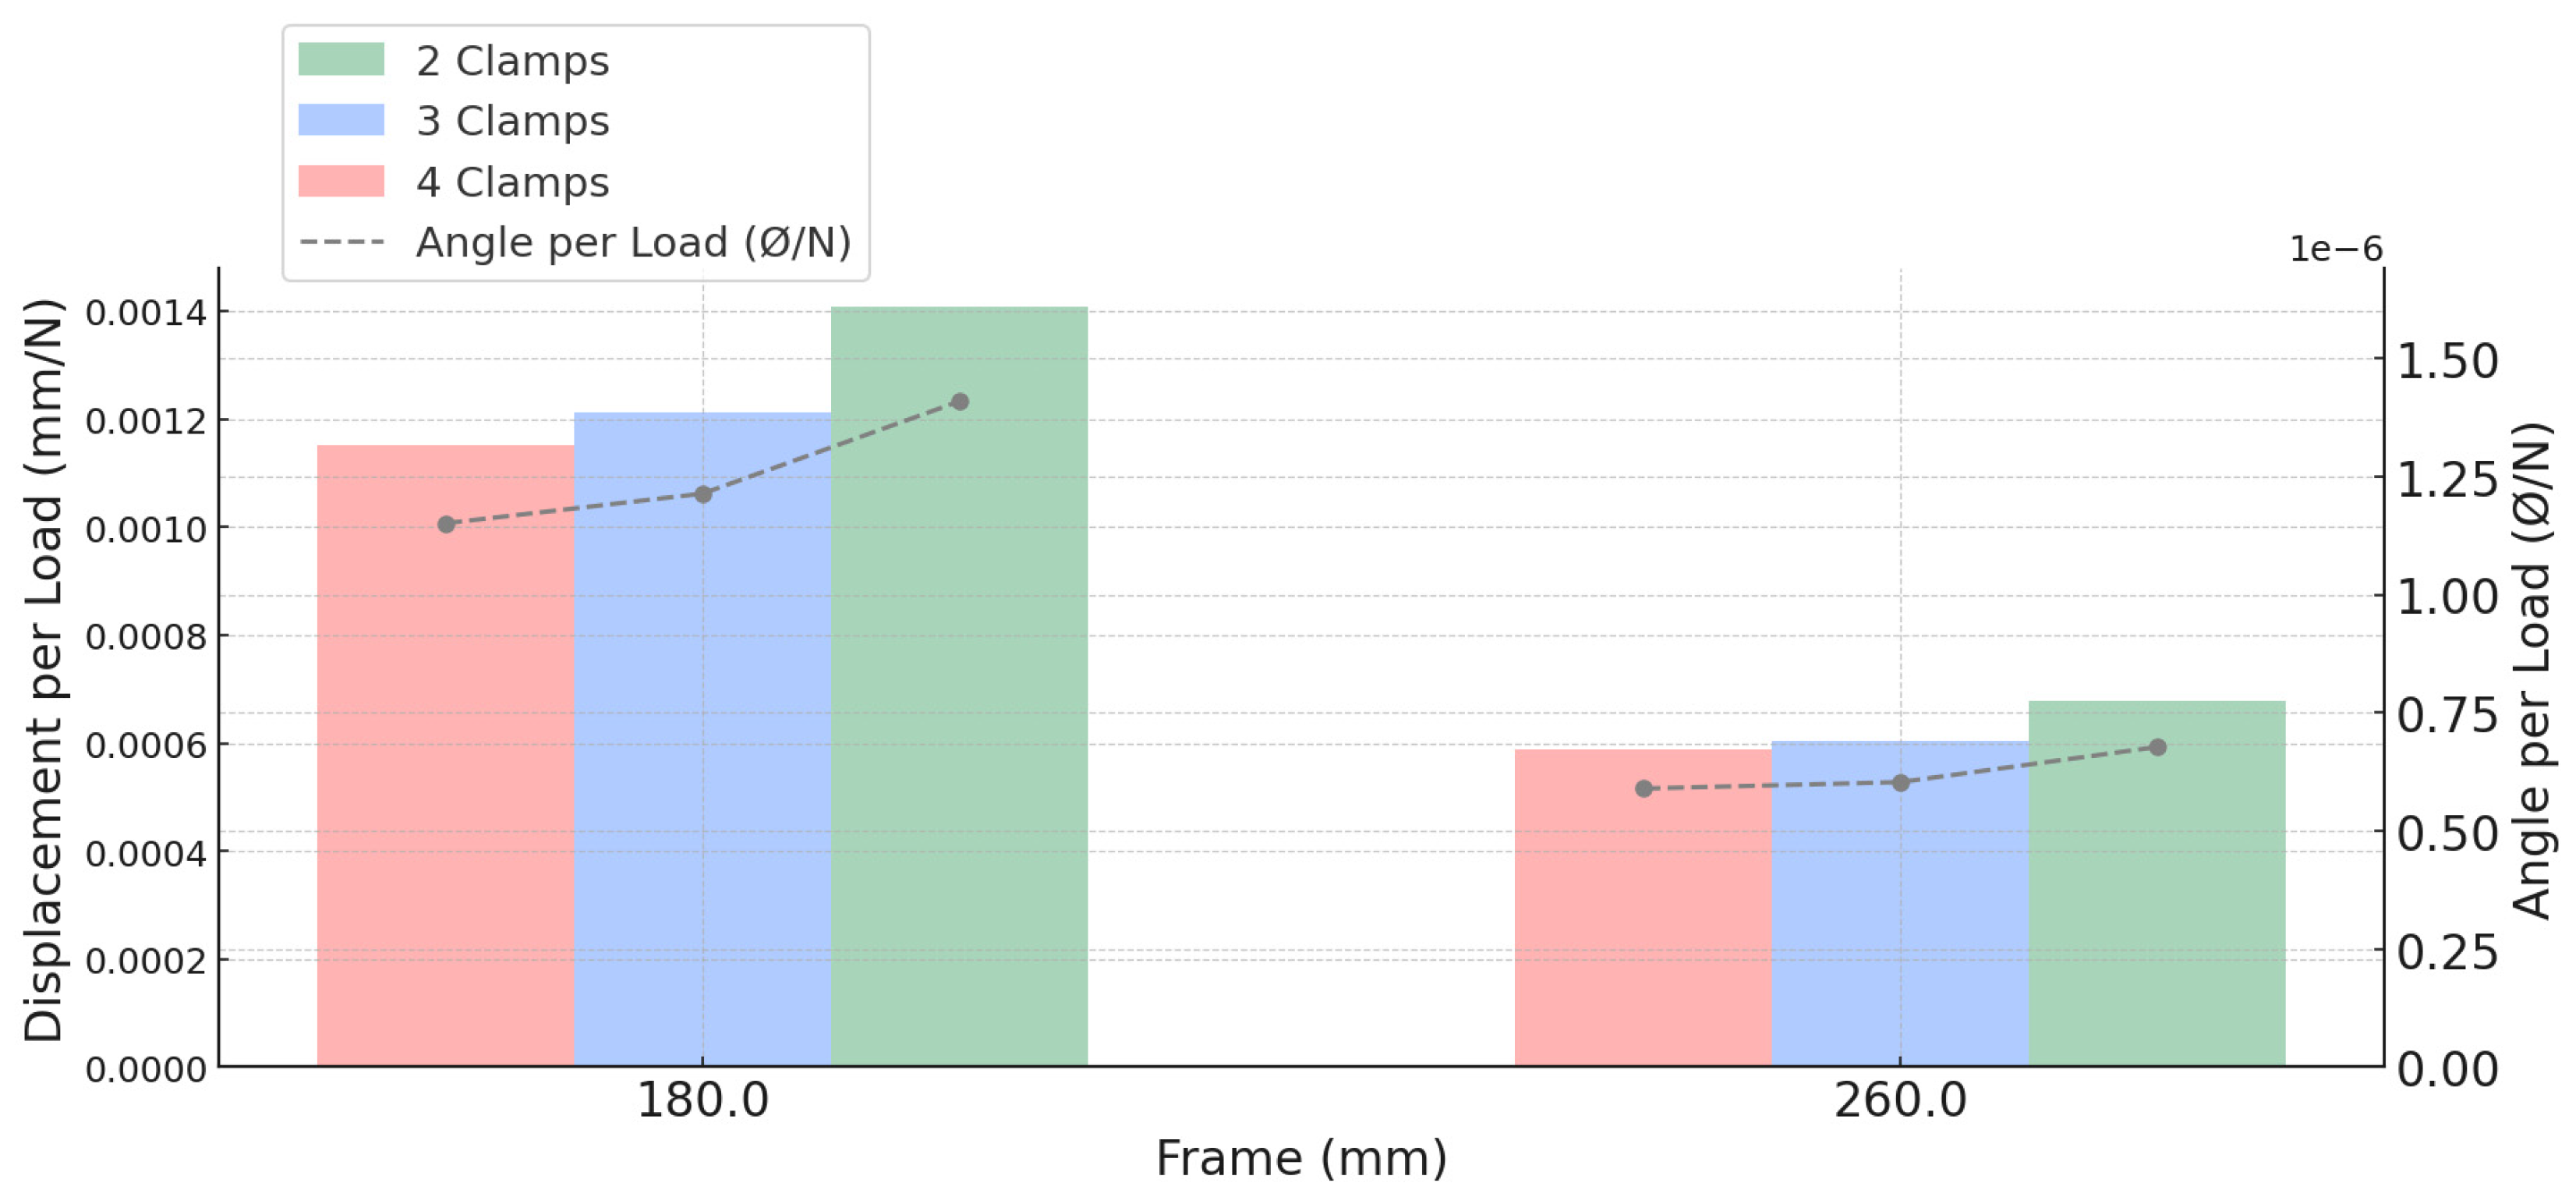
Influence of Clamps and Load Capacity
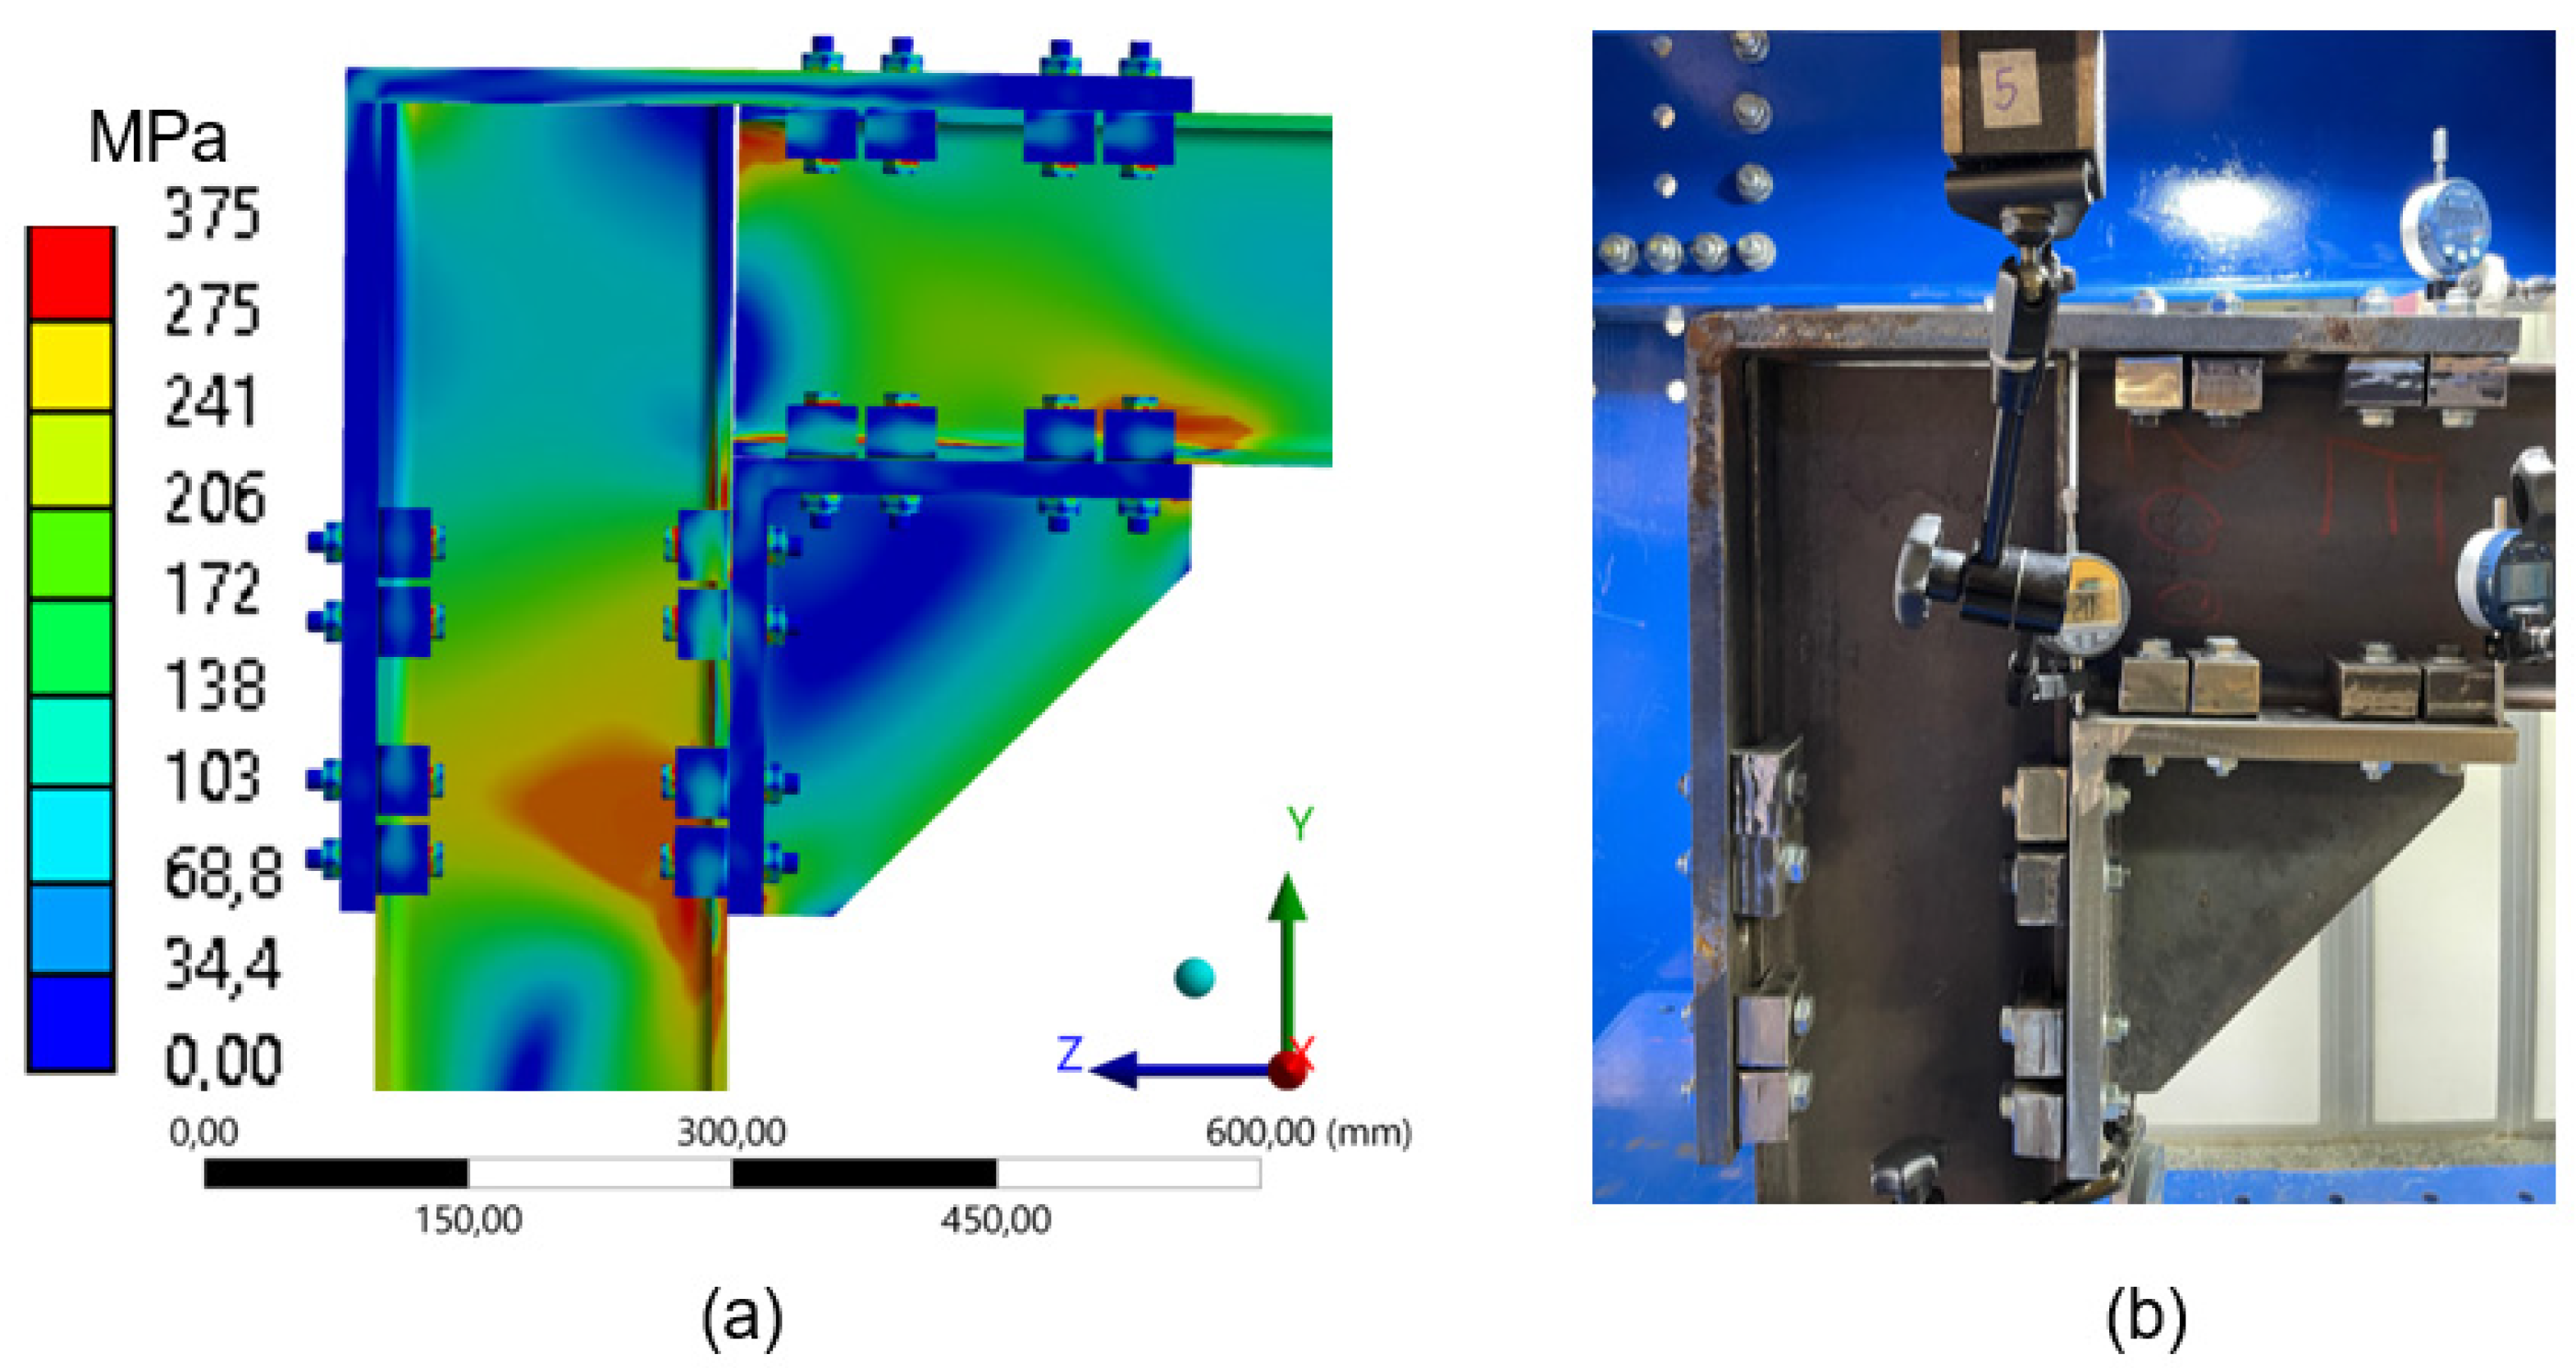
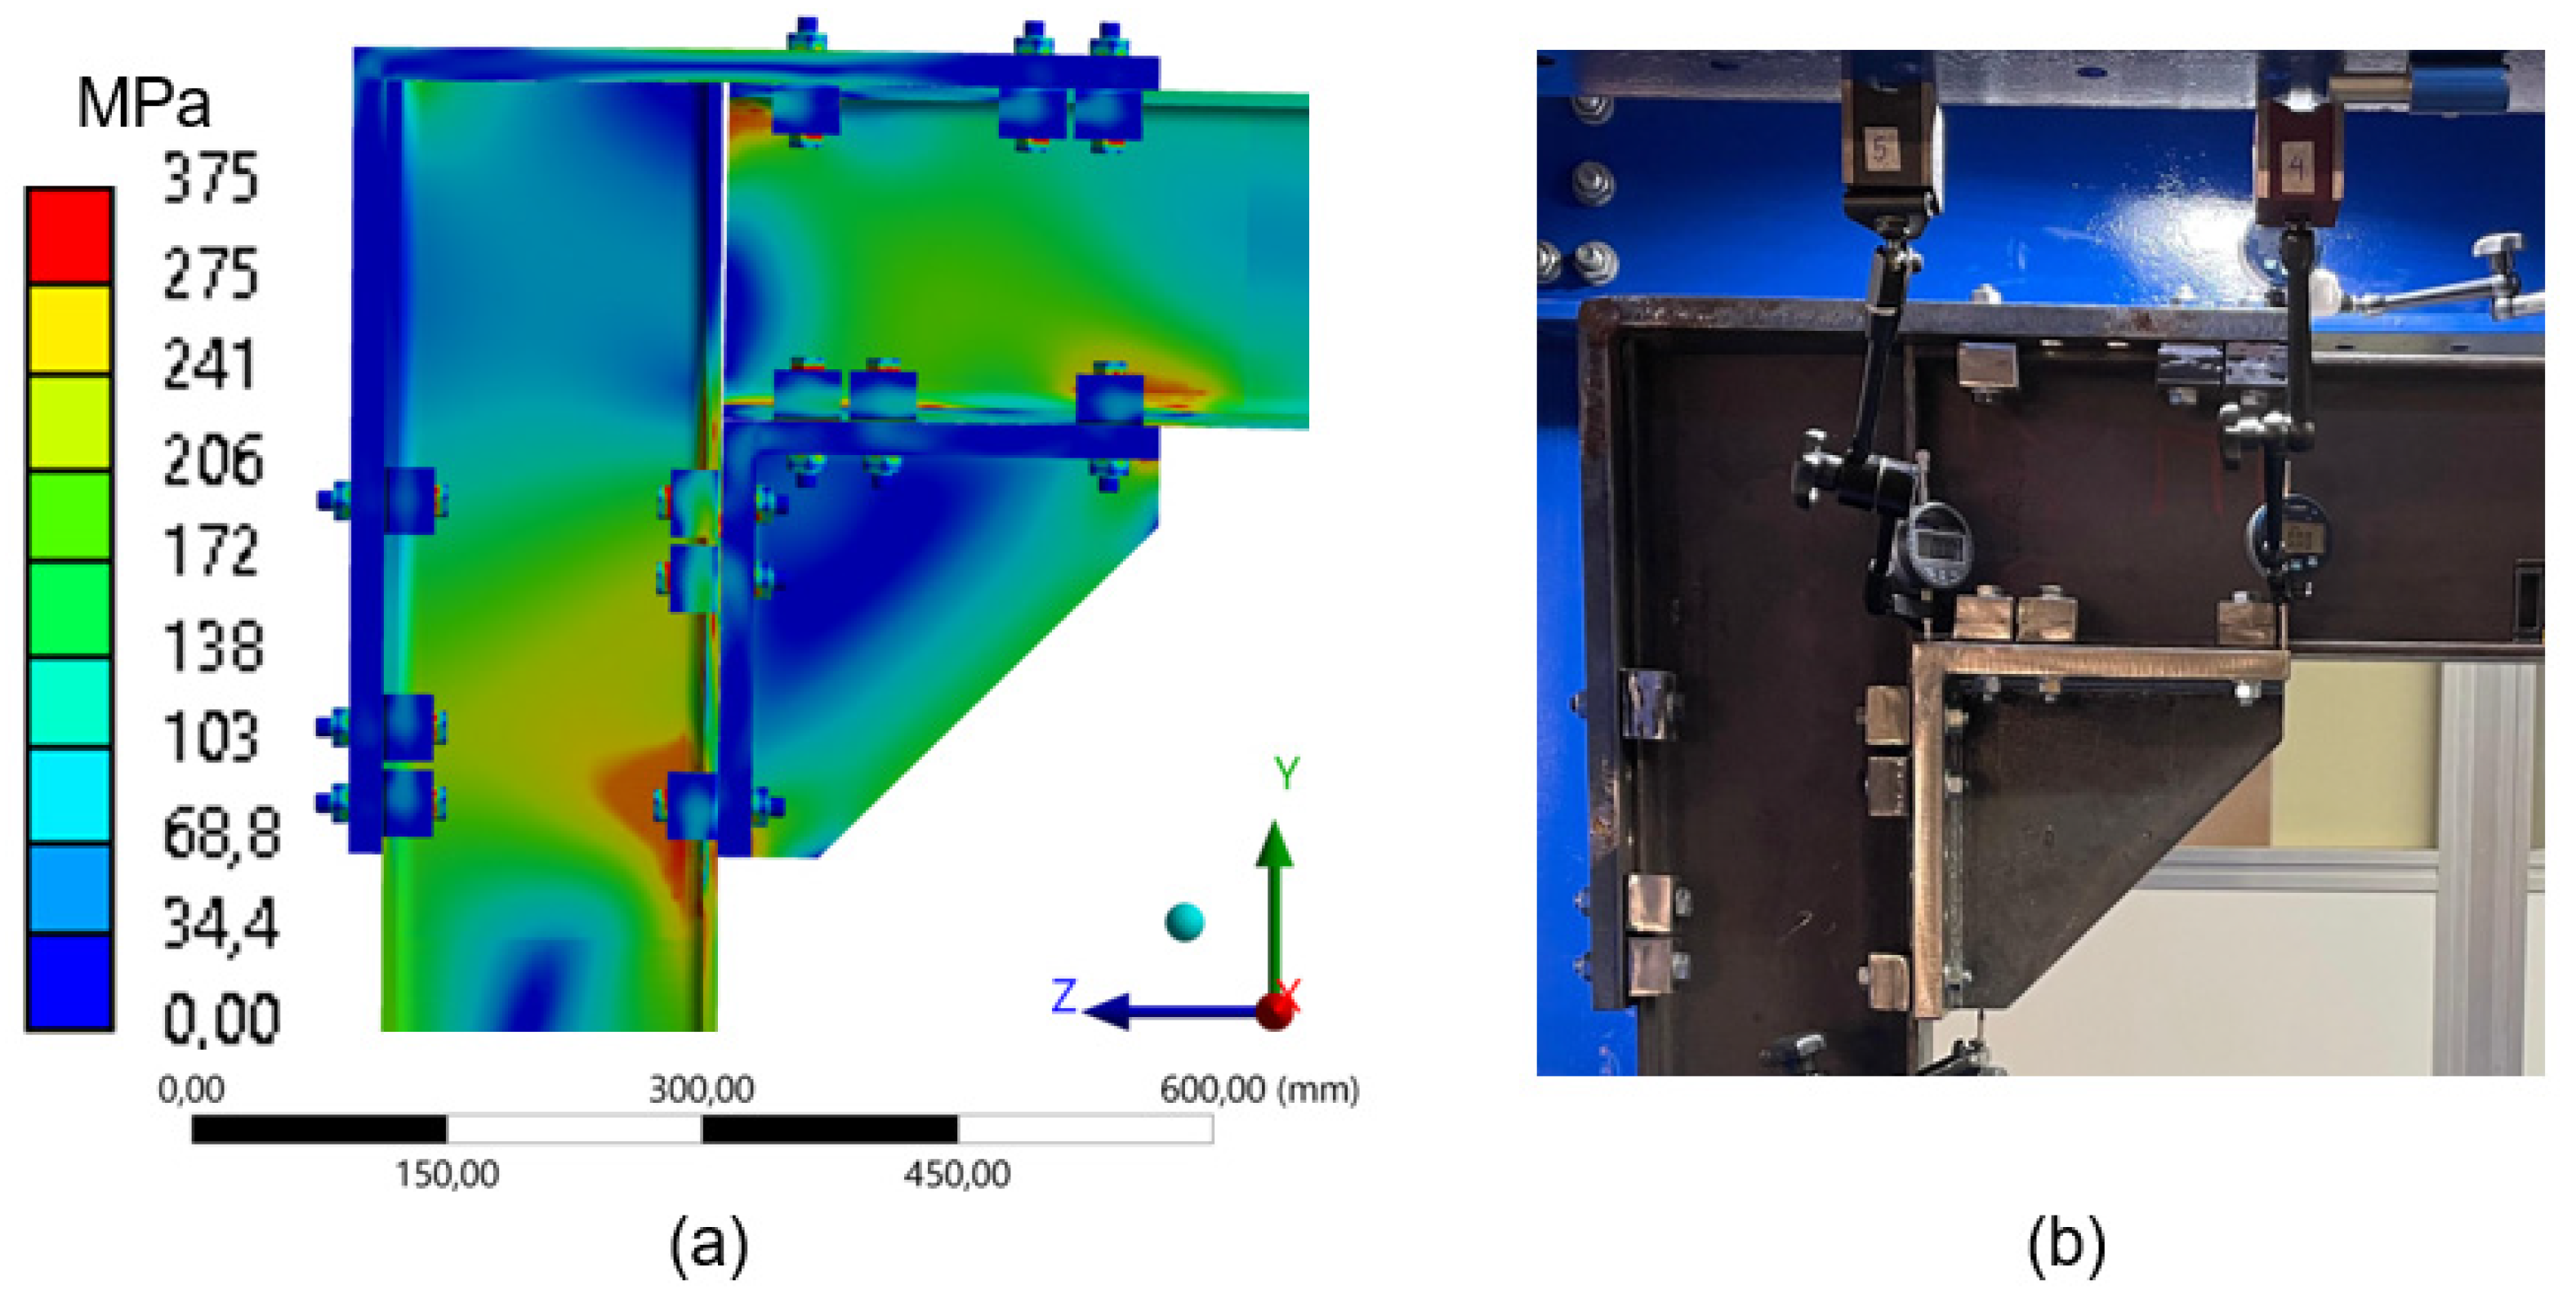
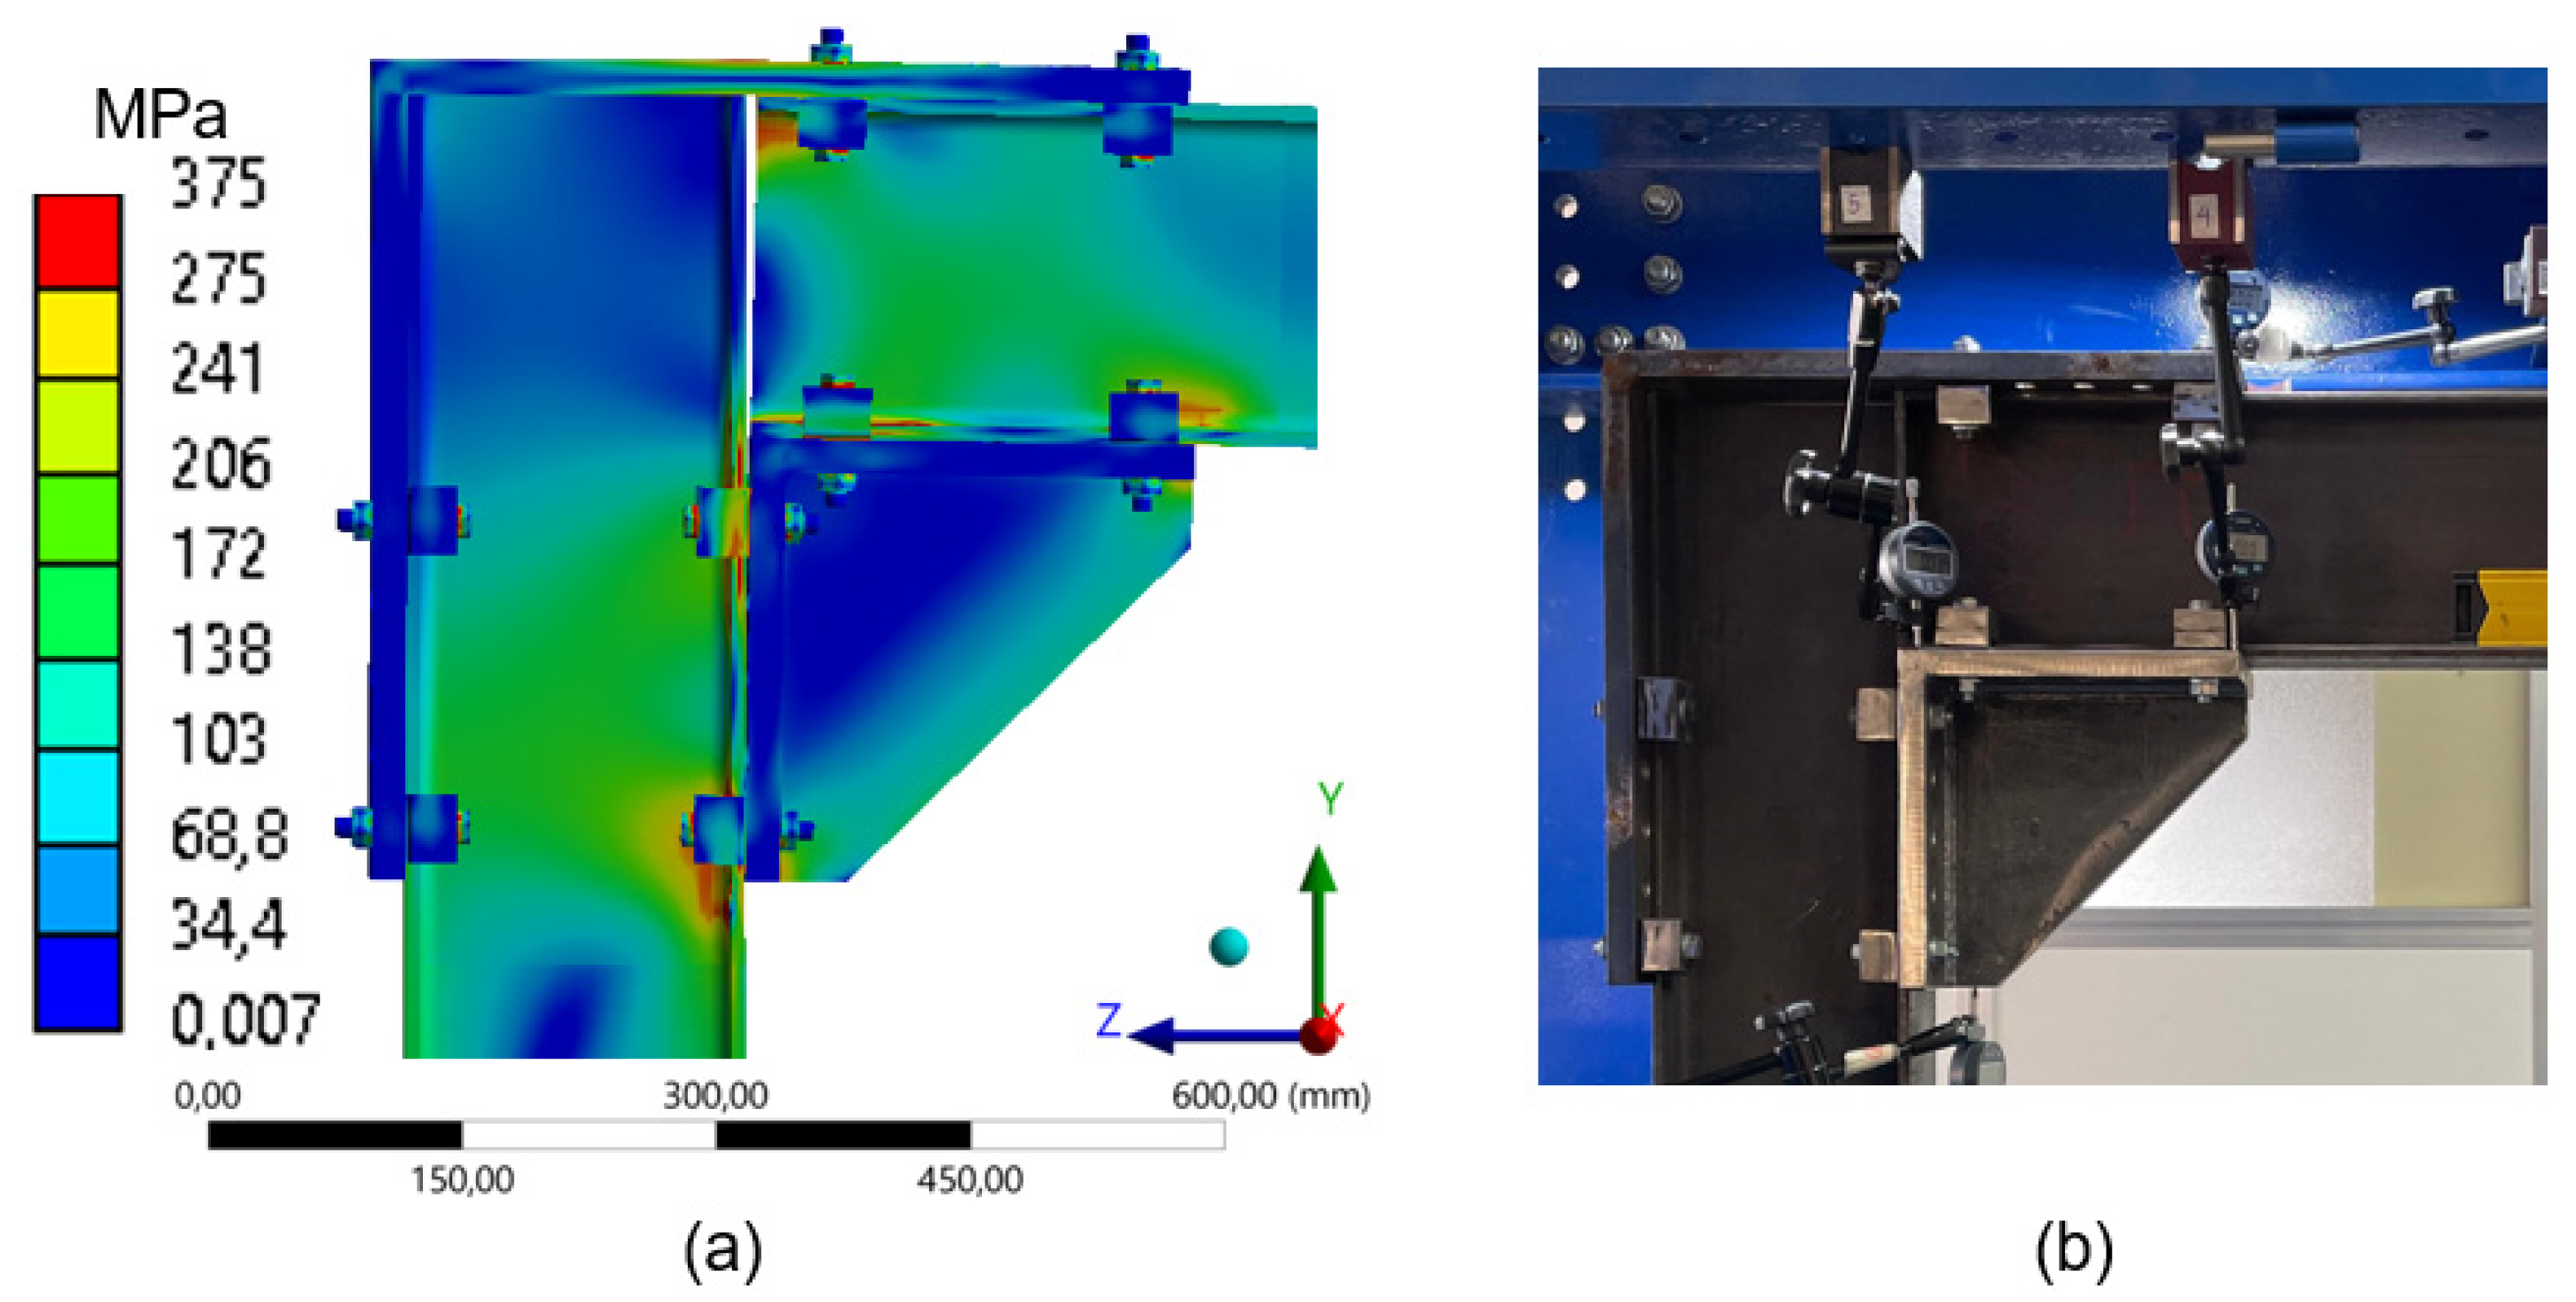
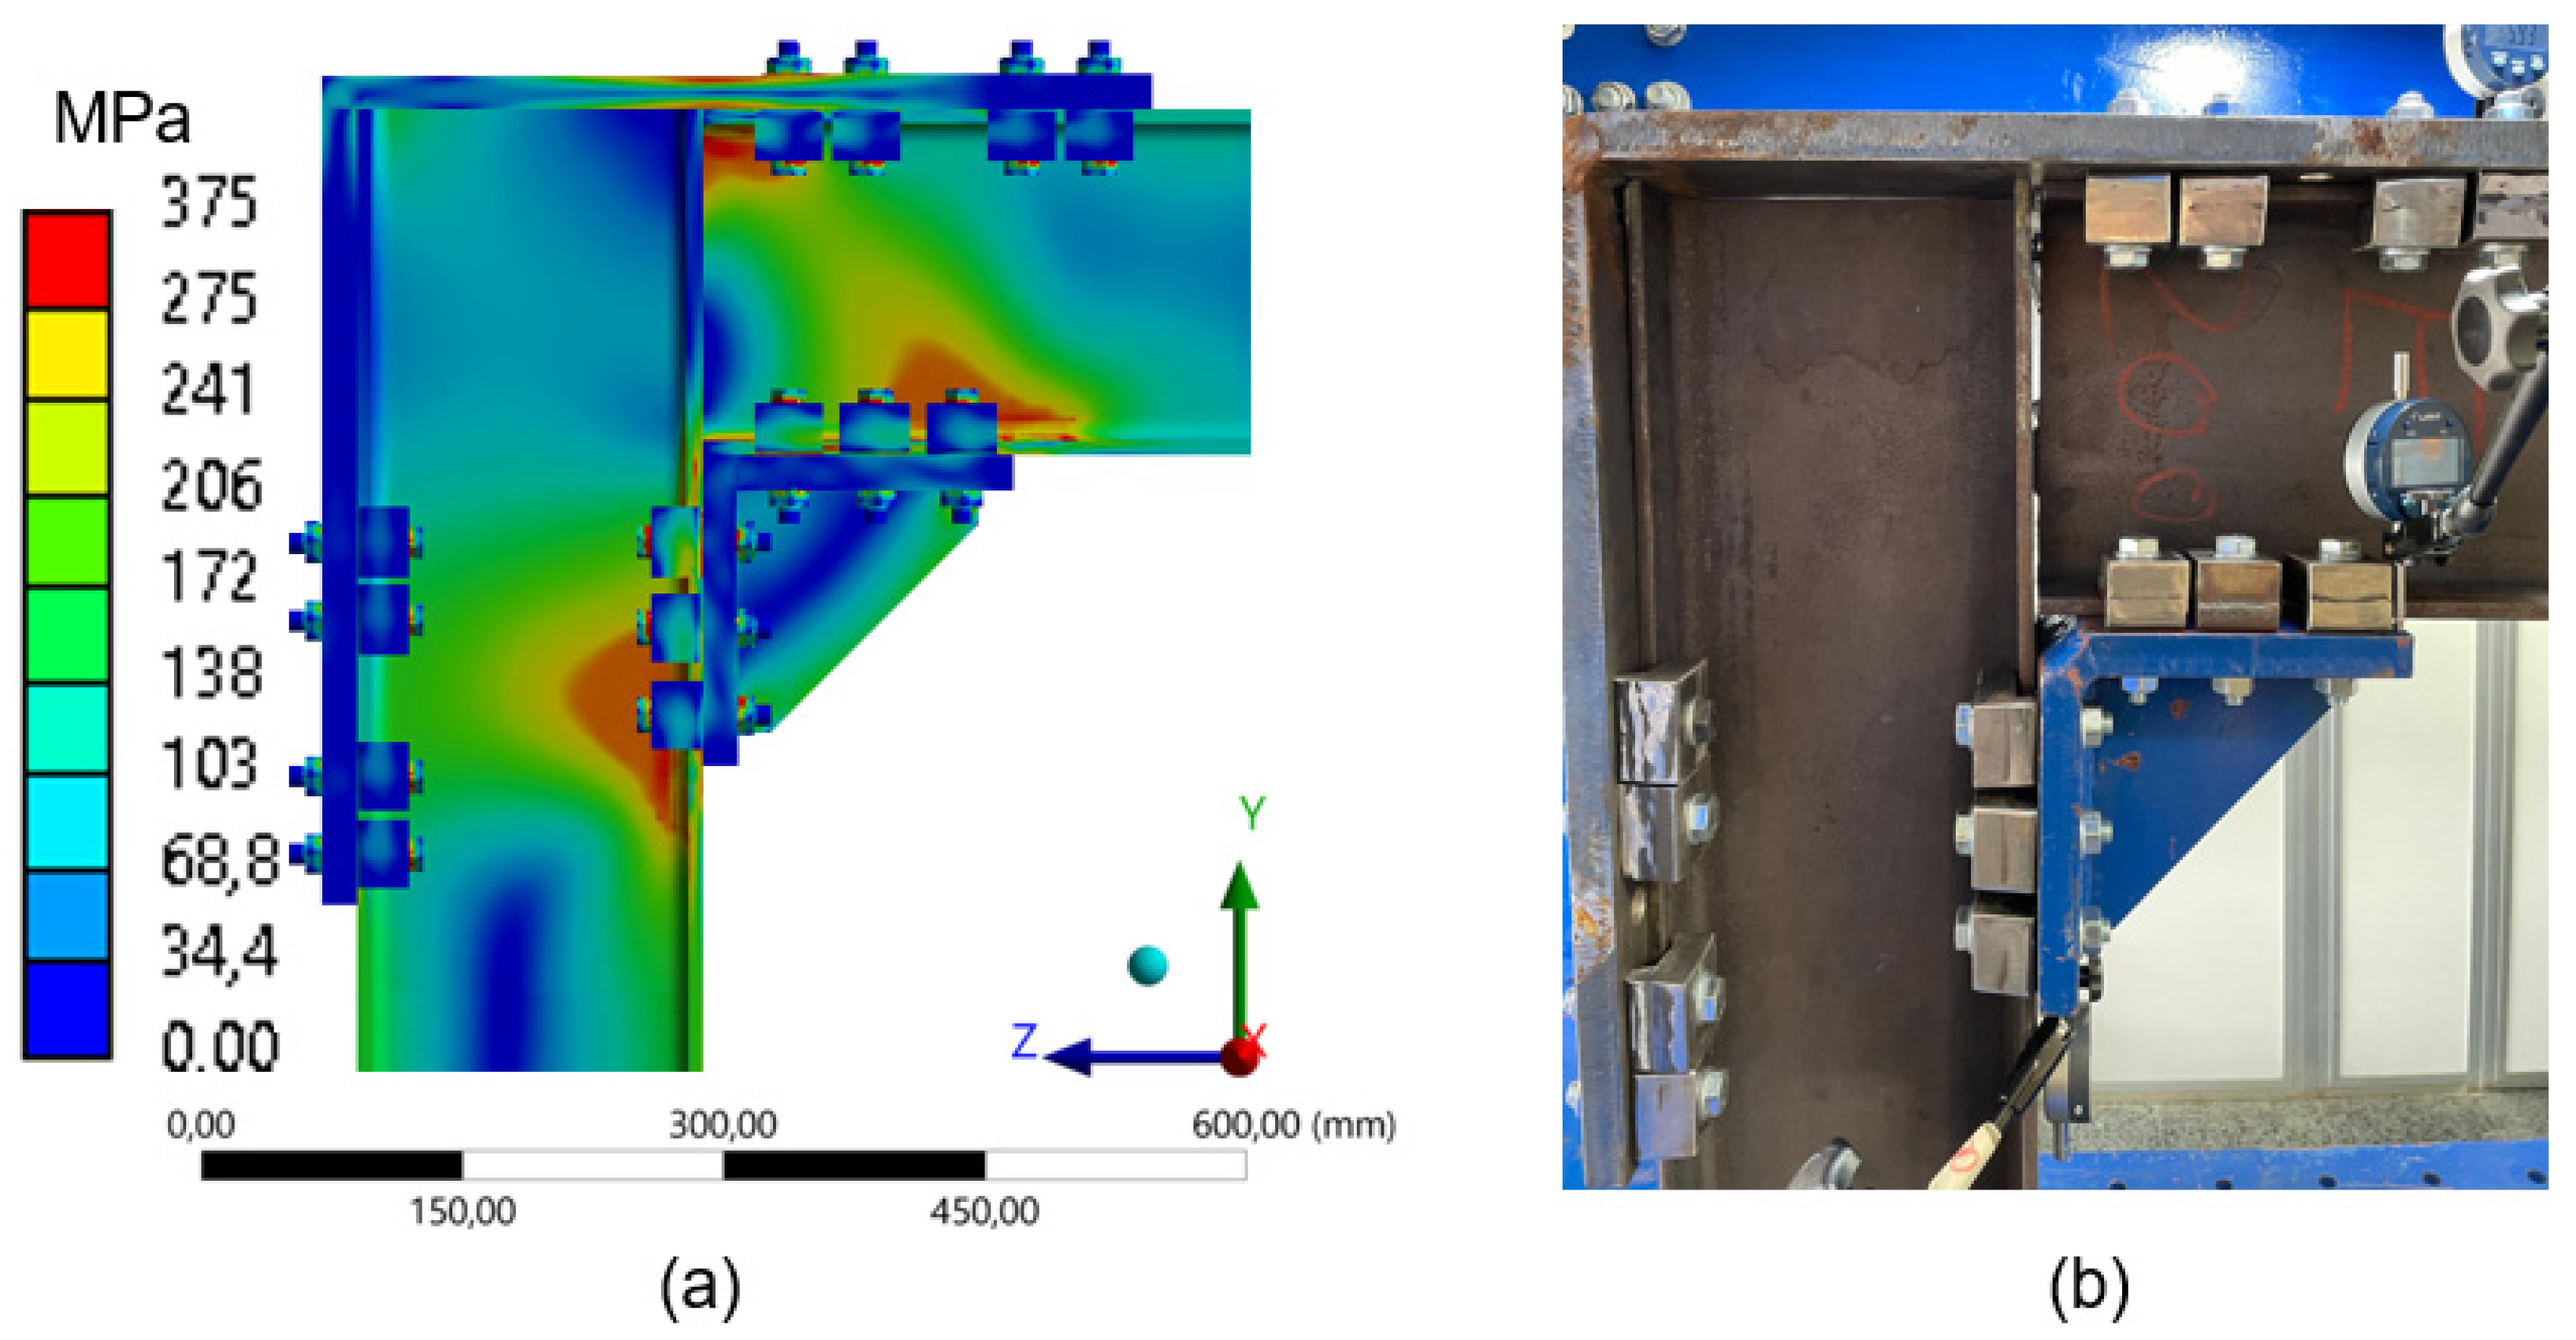
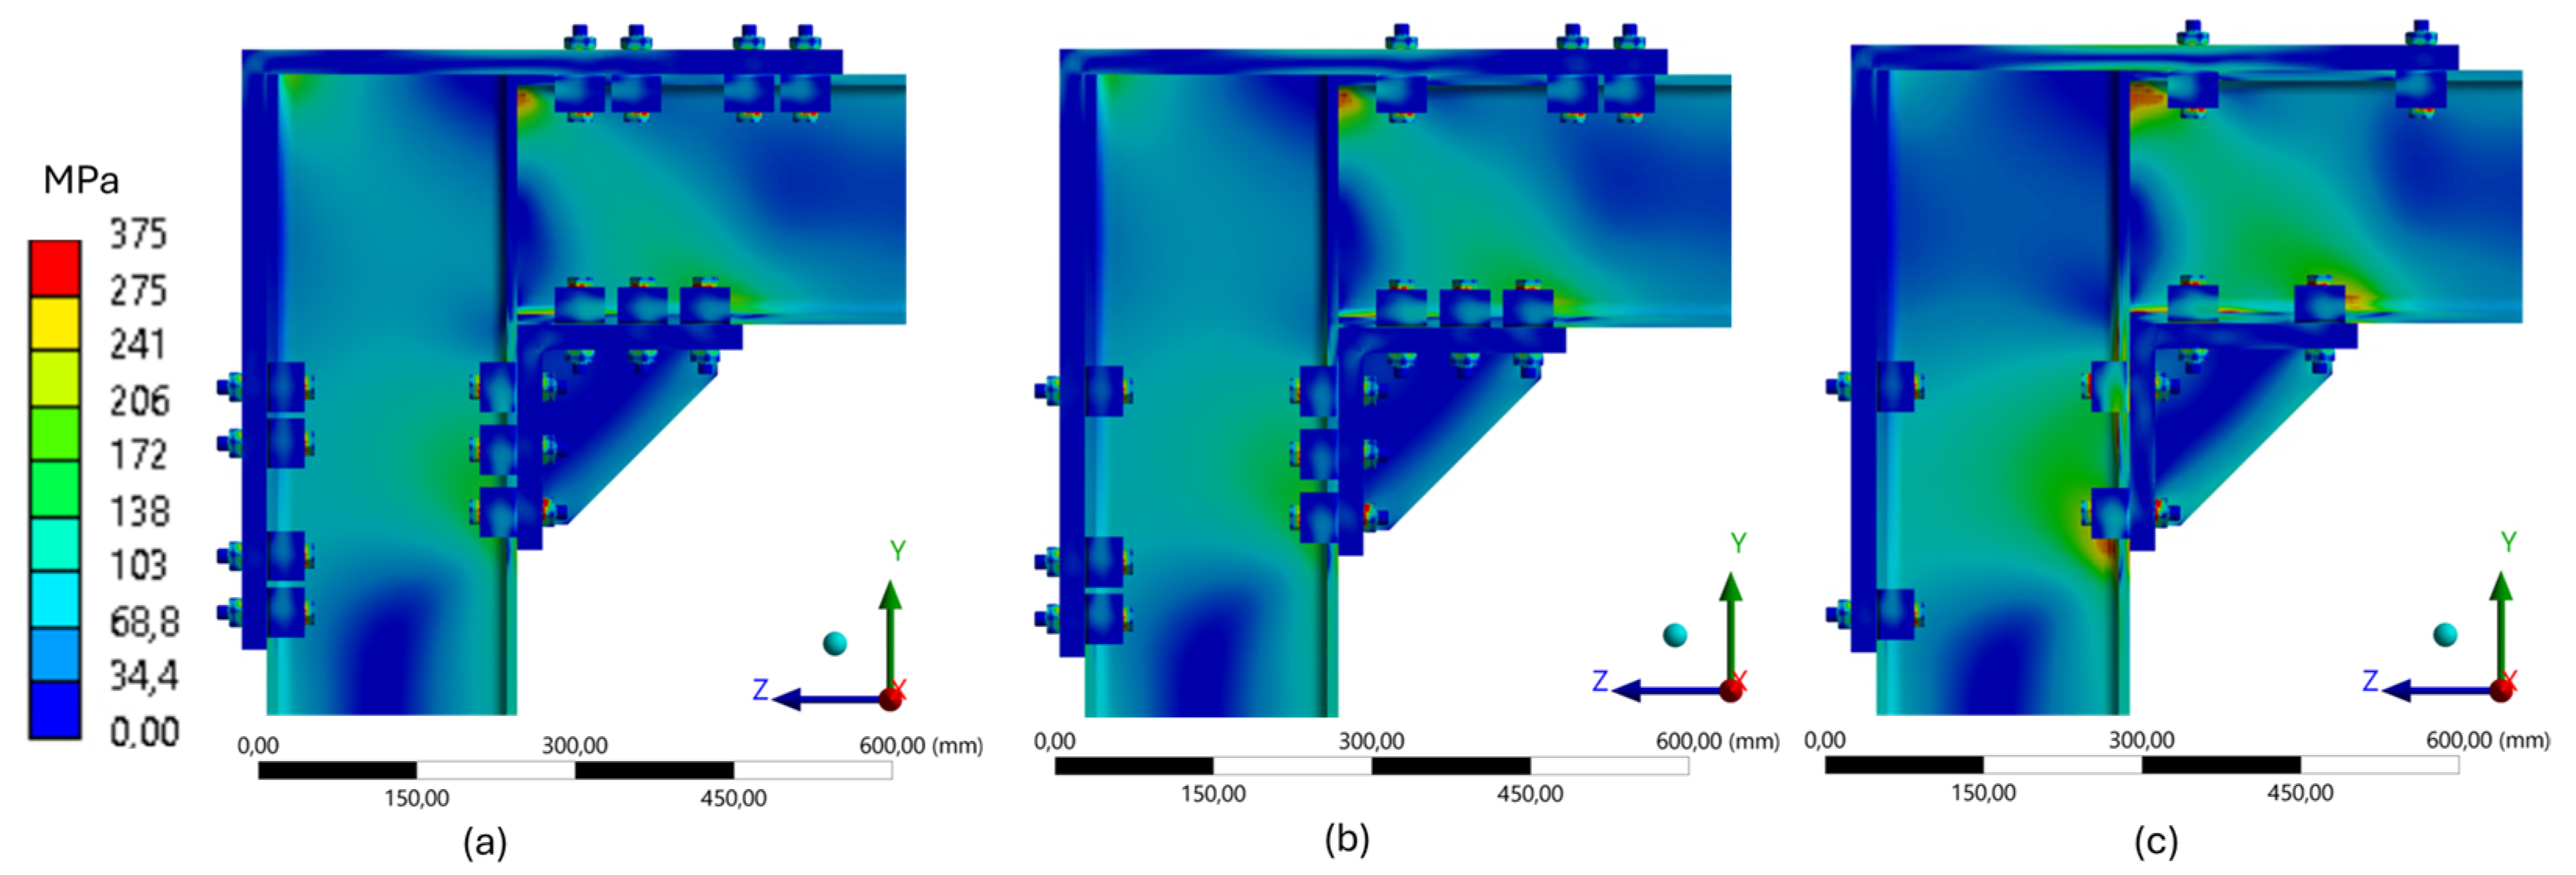
Stress Distributions and the Influence of the Number of Clamps
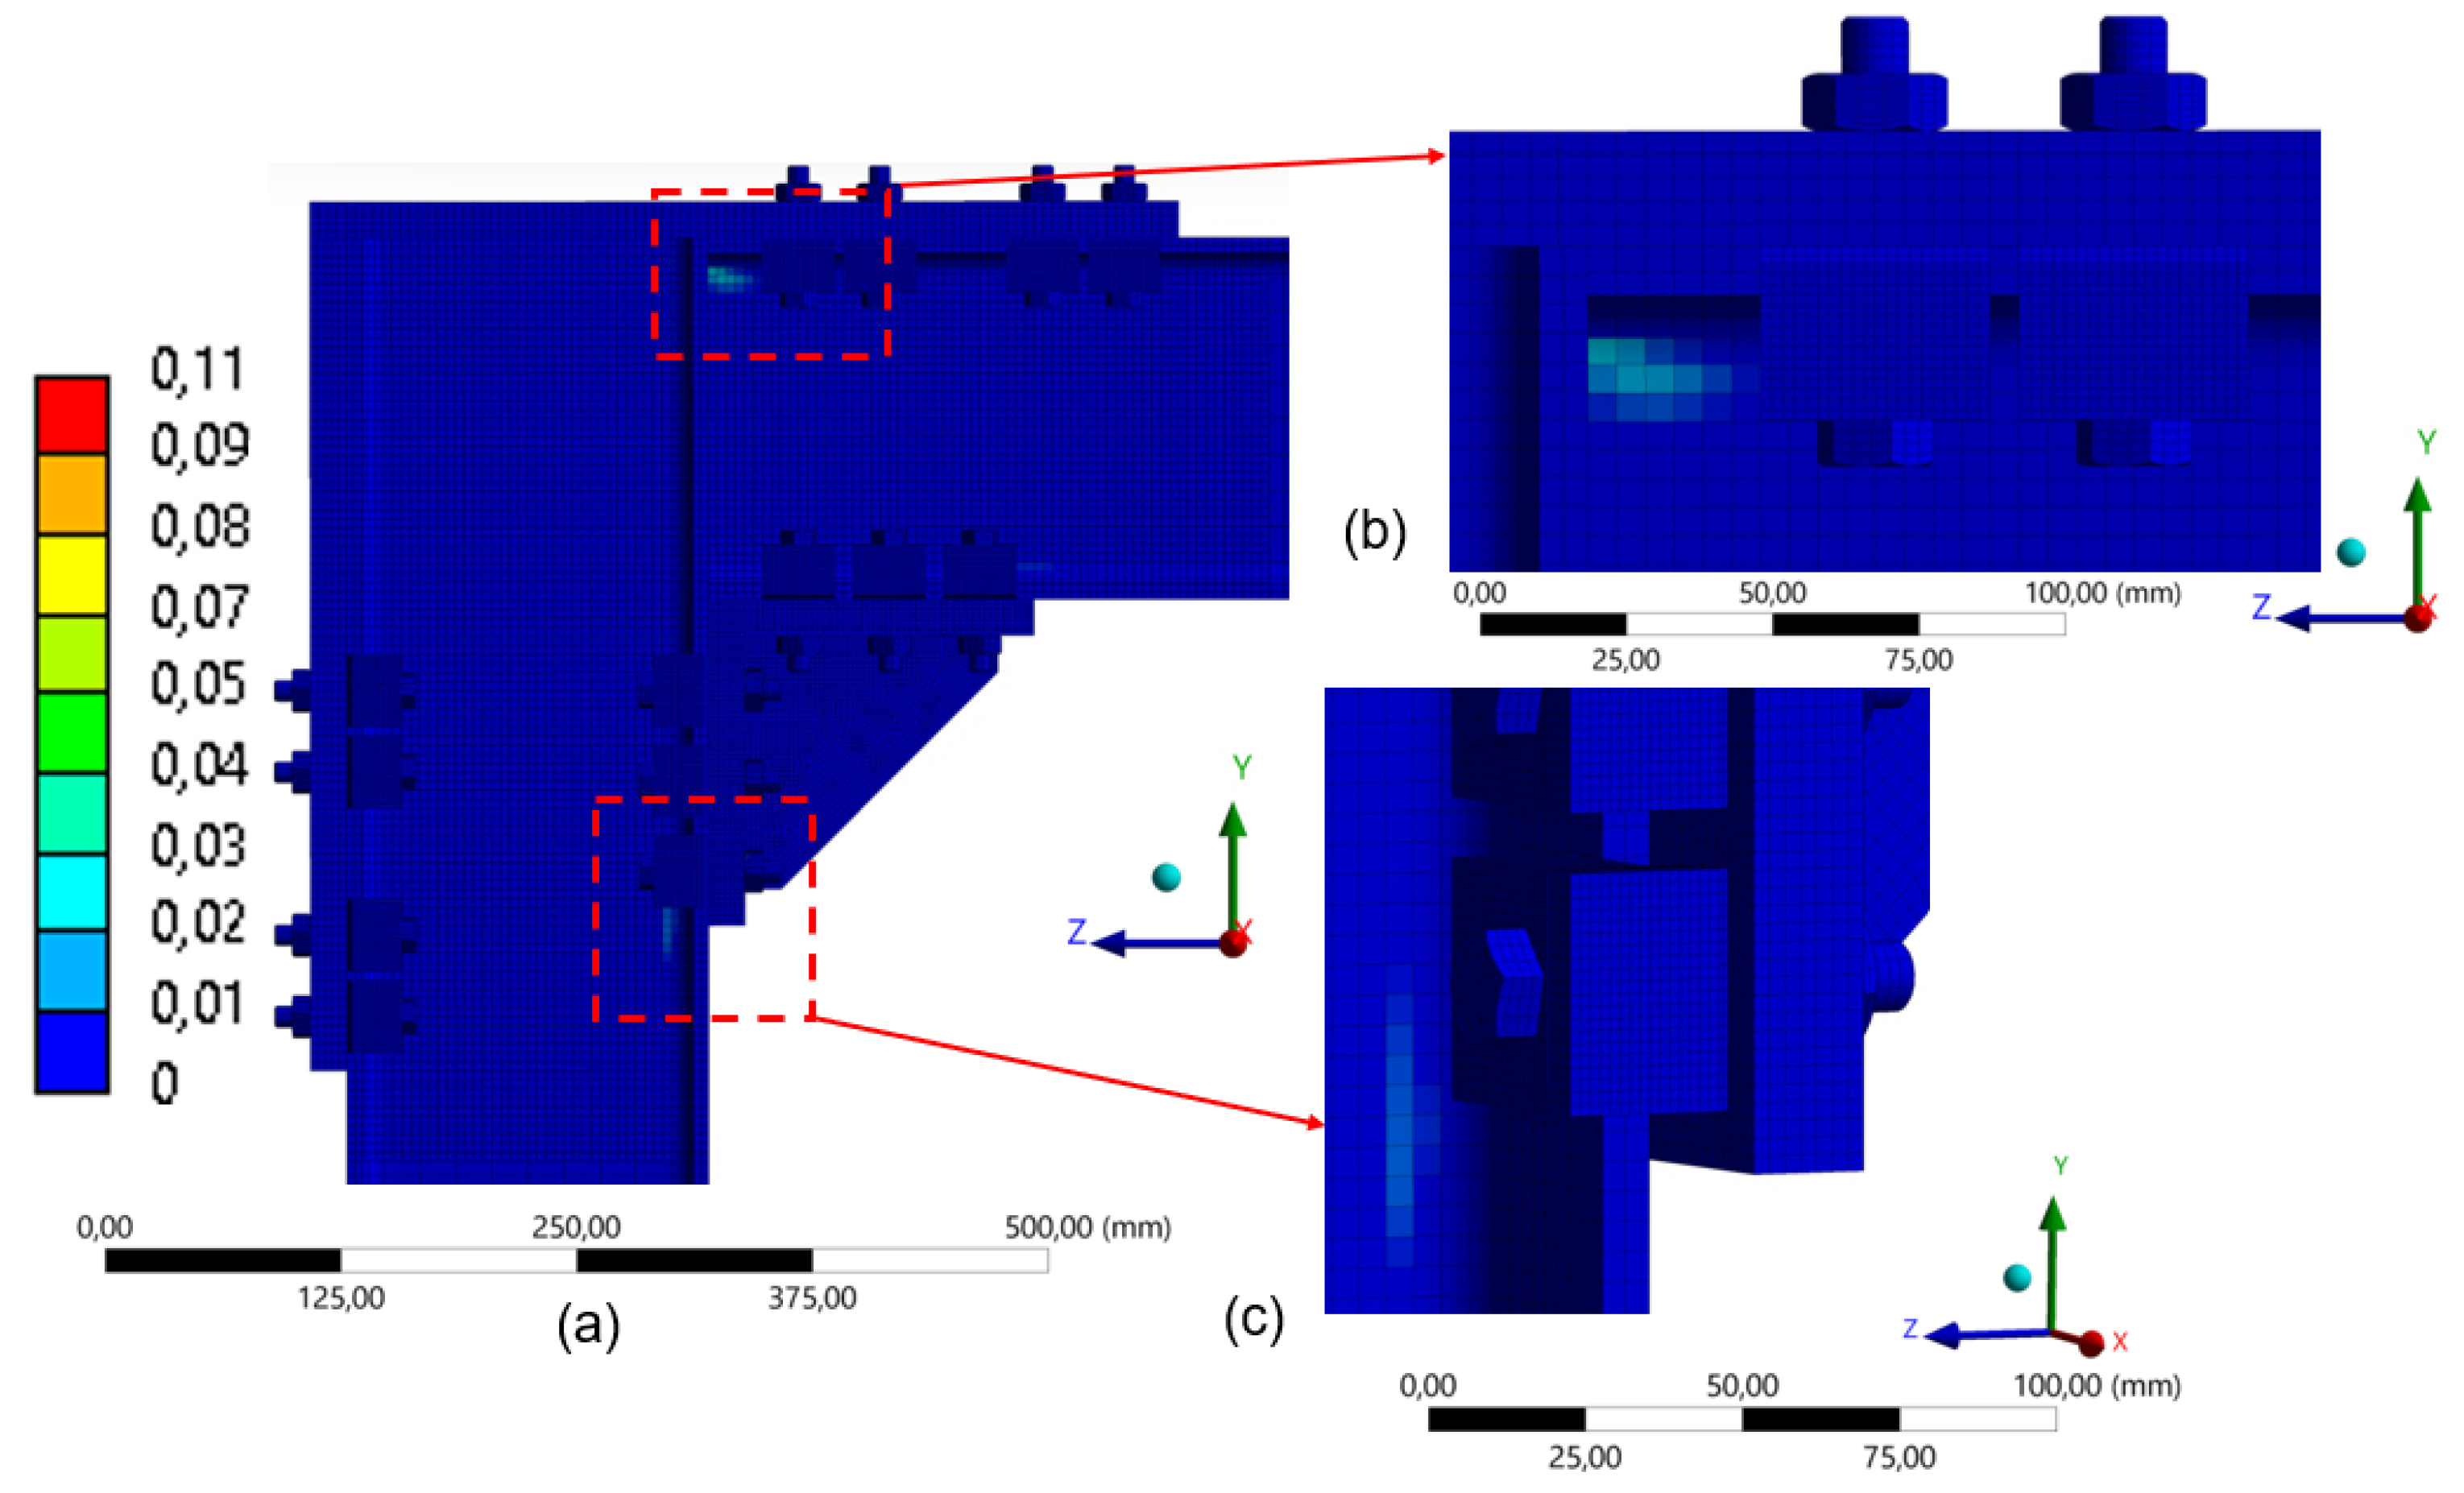
Analysis of Plastic Strain Distribution
Frame Analysis Under the Same Applied Load
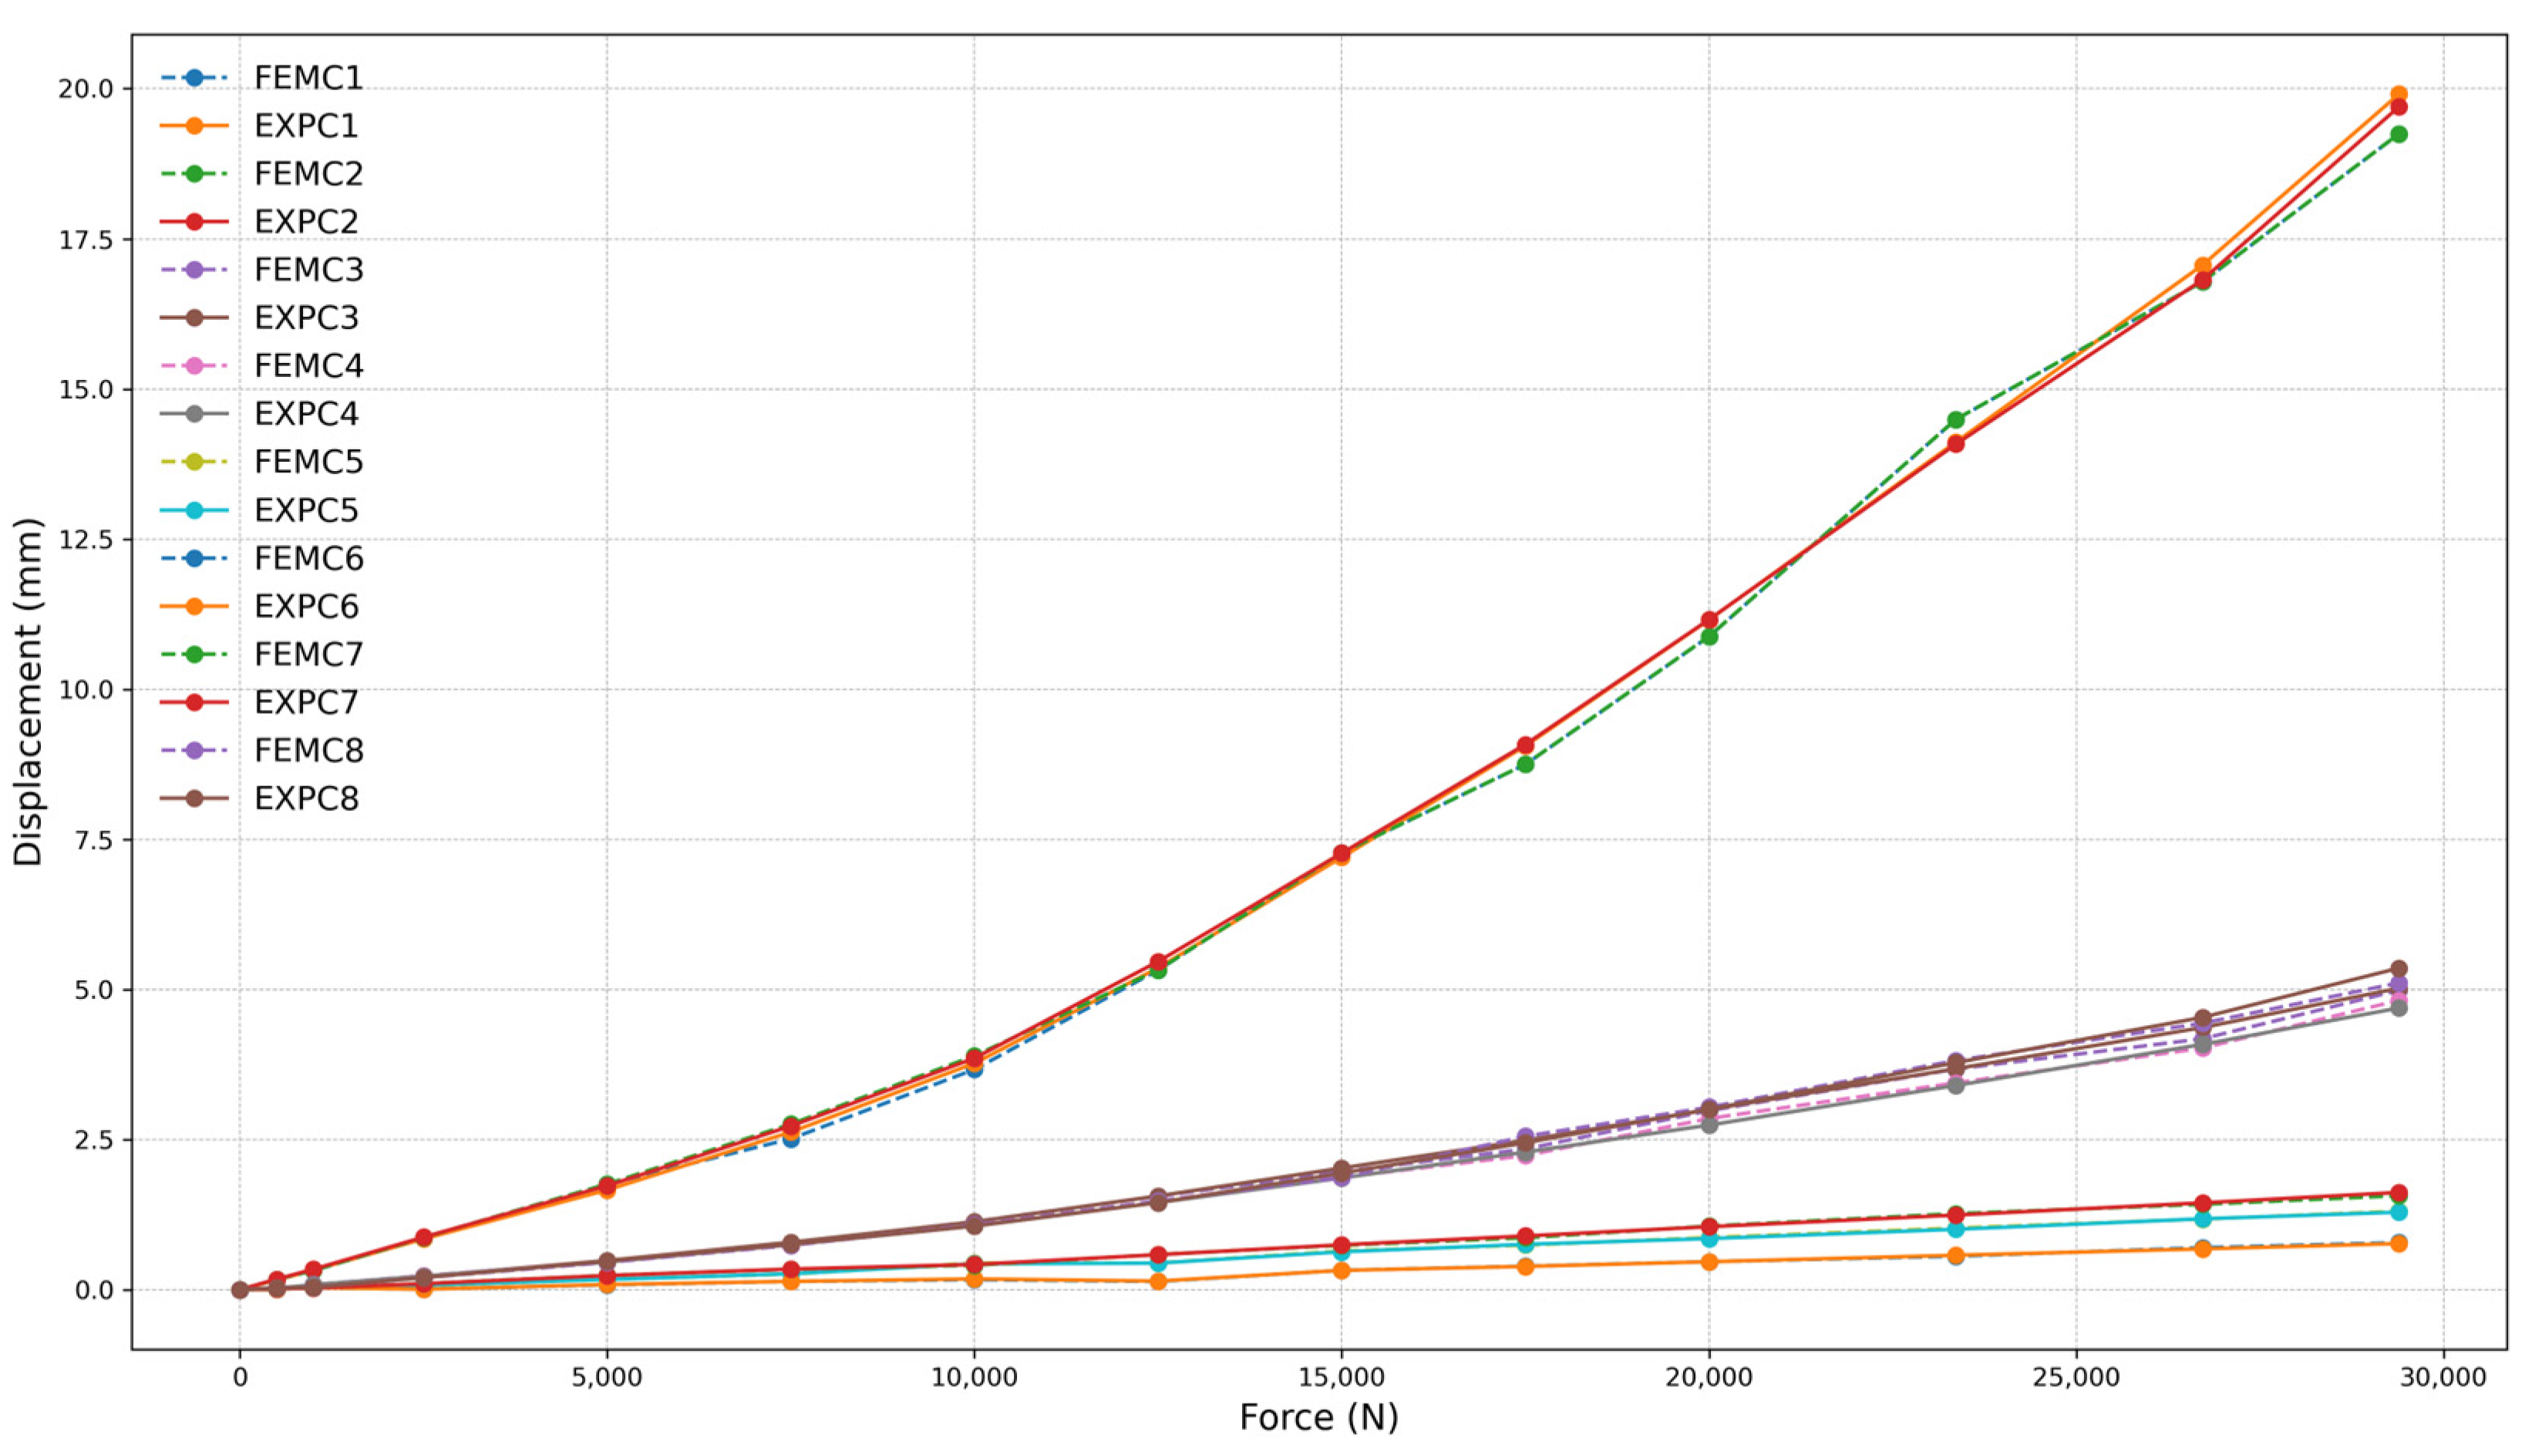
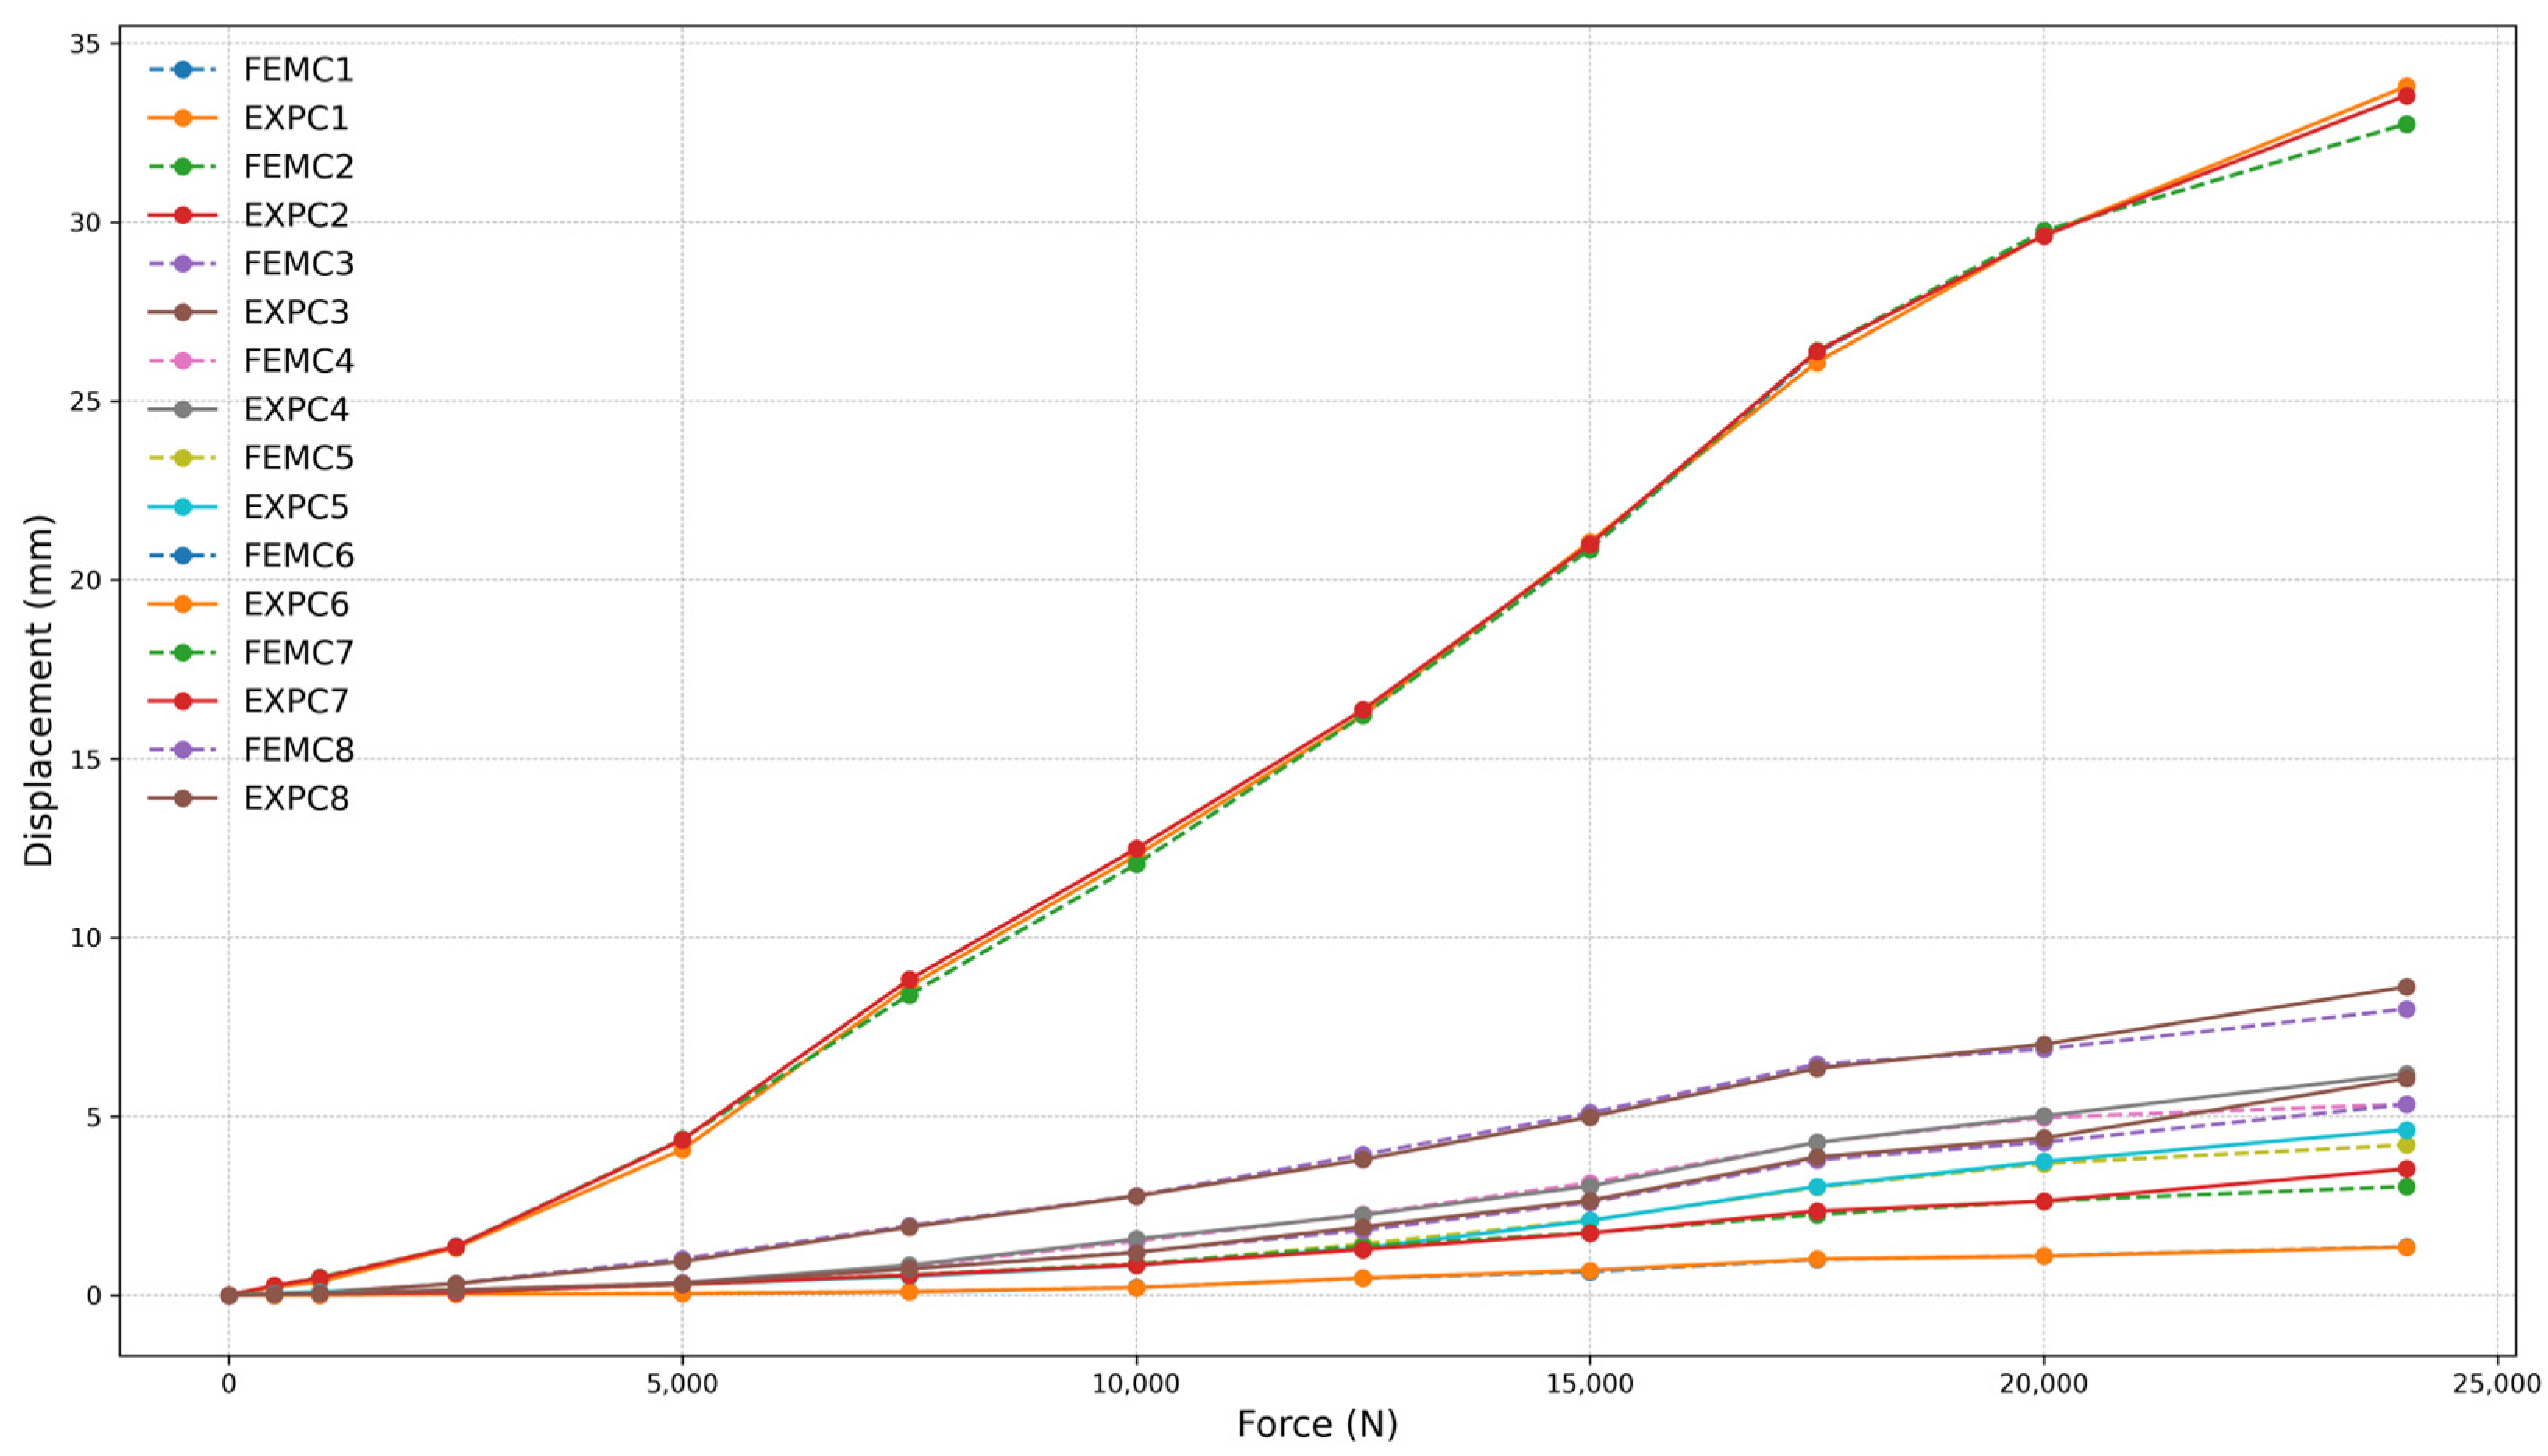
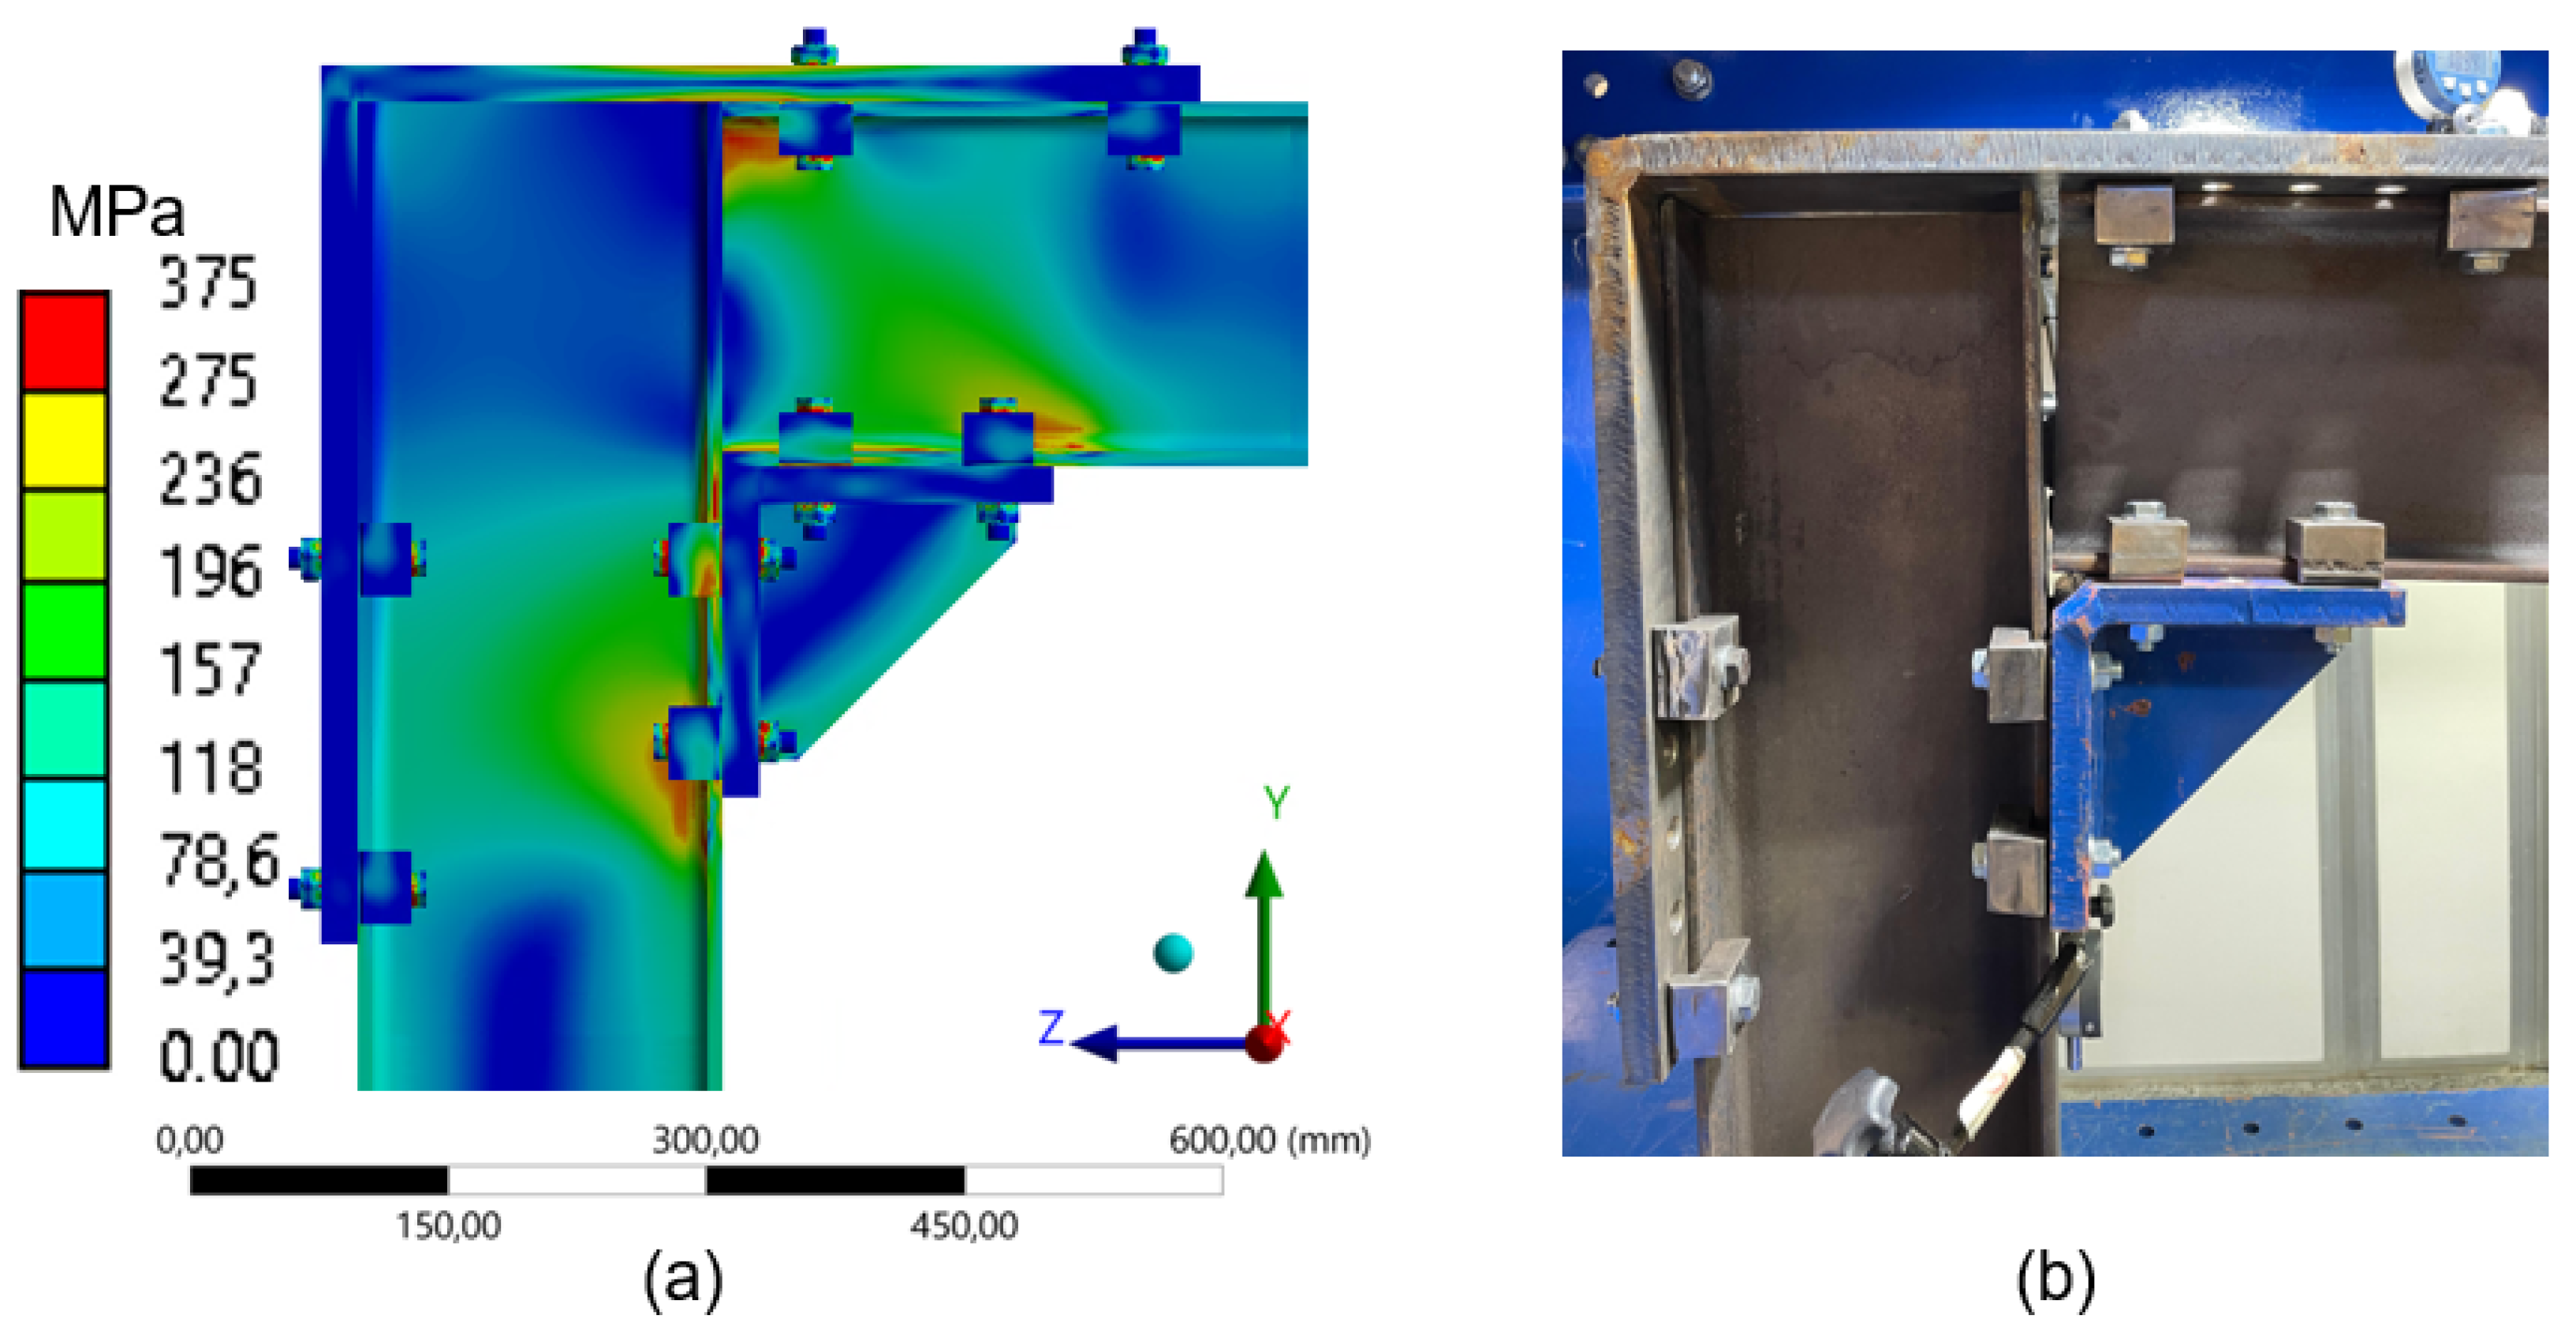
4.1.2. Comparison Between FEM and Experimental Data for the 180 mm Frame
Influence of Clamps and Load Capacity
Stress Distributions and the Influence of the Number of Clamps
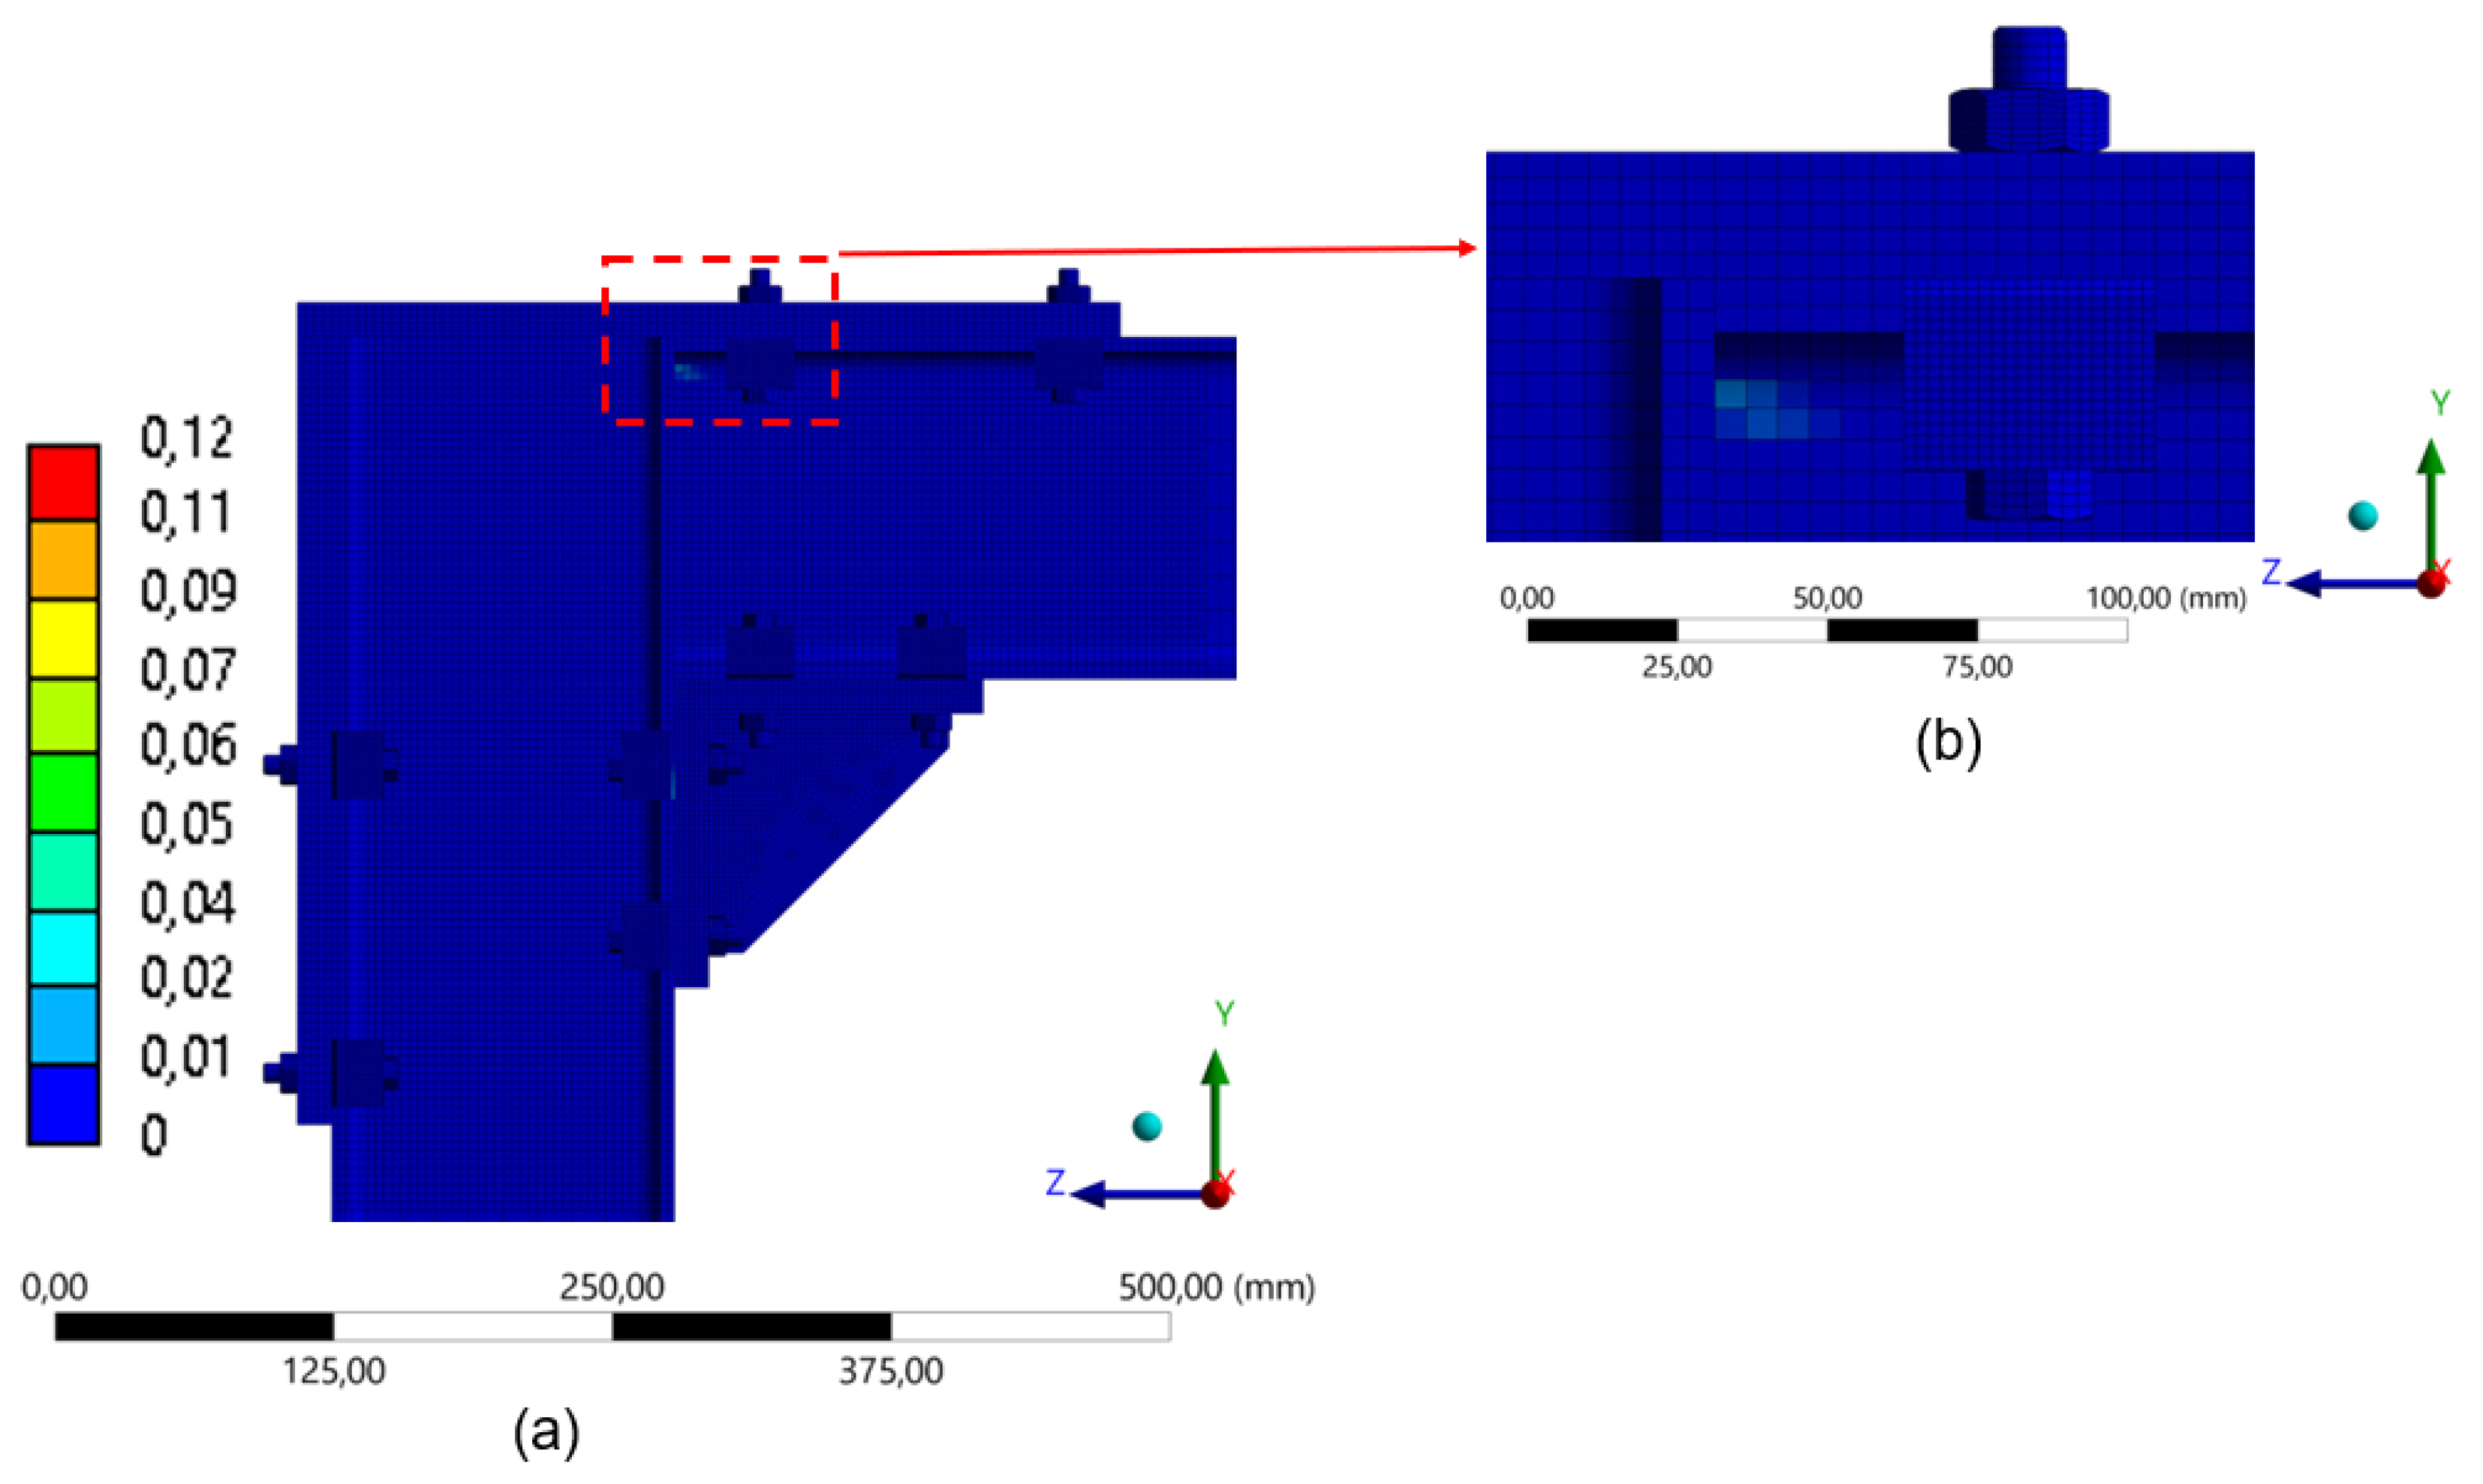
Analysis of Plastic Strain Distribution
Analysis of the 180 mm Frame Under the Same Applied Load
4.2. Comparative Structural Assessment and Design Implications of Clamp-Based Connections
5. Conclusions
- Elastic Response: All configurations remained within the elastic range throughout both experimental and numerical analyses, confirming their applicability in dismountable structural systems;
- Clamp Quantity and Performance: Increasing the number of clamps enhanced stiffness and load capacity, with up to 27.3% gain when moving from two to three clamps, particularly in the 260 mm frame;
- Numerical Validation: FEM simulations showed over 97% correlation with experimental results, supporting their use for future design and parametric studies;
- Frame Geometry Comparison: The 260 mm frame provided superior stiffness and capacity, while the 180 mm frame offered advantages in weight, assembly, and space efficiency;
- Stress and Deformation: Higher stress concentrations were observed in configurations with fewer clamps, yet all systems remained within the elastic range, ensuring safety and performance;
- Sustainability Aspects: The removable clamp design aligns with Design for Deconstruction (DfD), promoting ease of reuse, reduced waste, and extended structural lifecycle;
- Design Guidance: For practical use, clamp-based systems should consider clamp number, preload level, and frame geometry based on loading demands and spatial constraints.
6. Future Work
Author Contributions
Funding
Institutional Review Board Statement
Informed Consent Statement
Data Availability Statement
Conflicts of Interest
References
- Cabaleiro, M.; Conde, B.; González-Gaya, C.; Barros, B. A Novel Fully Removable Walkway System with Non-Invasive Anchors for Structural Health Inspection and Maintenance of Historic Steel Structures. Structures 2023, 53, 1435–1449. [Google Scholar] [CrossRef]
- Cabaleiro, M.; Conde, B.; Riveiro, B.; Caamaño, J.C. Analysis of Steel Connections with Girder Clamps According to the Bolts Preload. J. Constr. Steel Res. 2020, 168, 105866. [Google Scholar] [CrossRef]
- Cabaleiro, M.; Riveiro, B.; Conde, B.; Caamaño, J.C. Analytical T-Stub Model for the Analysis of Clamps in Structural Metal Joints. J. Constr. Steel Res. 2017, 130, 138–147. [Google Scholar] [CrossRef]
- Cavalheiro, F.N.; Cabaleiro, M.; Conde, B.; Barros, B. Integration of Finite Element Simulations and Experimental Validation in the Analysis of Demountable Clamp Joints for Steel Structures. In Proceedings of the World Congress on New Technologies, Barcelona, Spain, 25–27 August 2024; Avestia Publishing: Ottawa, ON, Canada, 2024. [Google Scholar]
- EN 1993-1-8; Eurocode 3—Design of Steel Structures—Part 1-8 Joints. European Committee for Standardization: Brussels, Belgium, 2024.
- UNE-EN 1993-1-1; Eurocódigo 3: Proyecto de Estructuras de Acero 1-1: Reglas Generales y Reglas Para Edificios. Organización Española de Normalización (UNE): Madrid, Spain, 2013.
- Jung, D.S.; Park, S.H.; Kim, T.H.; Han, J.W.; Kim, C.Y. Demountable Bolted Shear Connector for Easy Deconstruction and Reconstruction of Concrete Slabs in Steel–Concrete Bridges. Appl. Sci. 2022, 12, 1508. [Google Scholar] [CrossRef]
- Cabaleiro, M.; Moutinho, C.; González-Gaya, C.; Caetano, E.; Rosales-Prieto, V.F. Analysis of Stiffness of Clamped Joints versus Bolted Joints in Steel Structures by Means of Accelerometers and Shaking Table Tests. Sensors 2021, 21, 4778. [Google Scholar] [CrossRef]
- Deng, E.F.; Lian, J.Y.; Liu, Z.; Zhang, G.C.; Wang, S.B.; Cao, D. Bin Compressive Behavior of a Fully Prefabricated Liftable Connection for Modular Steel Construction. Buildings 2022, 12, 649. [Google Scholar] [CrossRef]
- Zhang, Z. Application of Finite Element Analysis in Structural Analysis and Computer Simulation. Appl. Math. Nonlinear Sci. 2024, 9, 15. [Google Scholar] [CrossRef]
- Liu, Z.; Wang, B.; Li, Y.; Zhang, C.; Wang, Y.; Chu, H. Analysis of Self-Loosening Behavior of High Strength Bolts Based on Accurate Thread Modeling. Eng. Fail. Anal. 2021, 127, 105541. [Google Scholar] [CrossRef]
- Quan, G.; Qi, J.; Wu, H.; Ye, J.; Gao, B.; Xu, N.; Hu, B. Experimental and Numerical Study on the Performance of New Prefabricated Connections for Free-Form Grid Structures. Structures 2022, 36, 1050–1067. [Google Scholar] [CrossRef]
- Zienkiewicz, O.C.; Taylor, R.L.; Zhu, J.Z. The Finite Element Method: Its Basis and Fundamentals; McGraw-Hill: New York, NY, USA, 2005; ISBN 0750663200. [Google Scholar]
- Cavalheiro, F.N.; Cabaleiro, M.; Conde, B.; Bouzas, Ó. Clamp-Based Steel Connections for Structural Reusability: Experimental and Finite Element Analysis in the Elastic Range. Structures 2025, 75, 108767. [Google Scholar] [CrossRef]
- Abdul Ghafar, W.; Zhong, T.; Abid, M.; Faizan, E.; Mohamed, A.; Yosri, A.M. Seismic Performance Investigation of an Innovative Steel Shear Wall with Semi-Rigid Beam-to-Column Connections. Front. Mater. 2022, 9, 1075300. [Google Scholar] [CrossRef]
- Abdul Ghafar, W.; Tao, Z.; Tao, Y.; He, Y.; Wu, L.; Zhang, Z. Experimental and Numerical Study of an Innovative Infill Web-Strips Steel Plate Shear Wall with Rigid Beam-to-Column Connections. Buildings 2022, 12, 1560. [Google Scholar] [CrossRef]
- Quillupangui, I.; Somodi, B.; Kövesdi, B. Overview of FEM-Based Resistance Models for Local Buckling of Welded Steel Box Section Columns. Appl. Sci. 2024, 14, 2029. [Google Scholar] [CrossRef]
- Aldakheel, F.; Hudobivnik, B.; Wriggers, P. Virtual Elements for Finite Thermo-Plasticity Problems. Comput. Mech. 2019, 64, 1347–1360. [Google Scholar] [CrossRef]
- Nagler, M.; Pechstein, A.; Humer, A. A Mixed Finite Element Formulation for Elastoplasticity. Int. J. Numer. Methods Eng. 2022, 123, 5346–5368. [Google Scholar] [CrossRef]
- Niemiro-Maźniak, J.; Lacki, P. Experimental and Numerical Analysis of Joints and Thin-Walled Steel Beams Fabricated through Resistance Spot Welding and Hot-Dip Galvanizing. Thin-Walled Struct. 2024, 202, 112105. [Google Scholar] [CrossRef]
- Liu, X.C.; Liu, Y.K.; Chen, X.; Zhang, A.L. Analysis of Bolted Connection for H-Section Beam and Square Steel Tube Column. Structures 2024, 60, 105945. [Google Scholar] [CrossRef]
- Ahmed, N.Z. Experimental and Numerical Investigation of the Bending Behavior in Nontraditional Steel Beam-to-Beam Tip Connections. Structures 2024, 62, 106260. [Google Scholar] [CrossRef]
- Akinade, O.O.; Oyedele, L.O.; Ajayi, S.O.; Bilal, M.; Alaka, H.A.; Owolabi, H.A.; Bello, S.A.; Jaiyeoba, B.E.; Kadiri, K.O. Design for Deconstruction (DfD): Critical Success Factors for Diverting End-of-Life Waste from Landfills. Waste Manag. 2017, 60, 3–13. [Google Scholar] [CrossRef]
- Kabirifar, K.; Mojtahedi, M.; Wang, C.; Tam, V.W.Y. Construction and Demolition Waste Management Contributing Factors Coupled with Reduce, Reuse, and Recycle Strategies for Effective Waste Management: A Review. J. Clean. Prod. 2020, 263, 121265. [Google Scholar] [CrossRef]
- Torra-Bilal, I.; Mahamid, M.; Baran, E. Cyclic Behaviour of Precast Beam-to-Column Connections: An Experimental and Numerical Investigation. Structures 2022, 35, 939–957. [Google Scholar] [CrossRef]
- IRFAN, S.; SIDDIQUI, F. A Review of Recent Advancements in Finite Element Formulation for Sandwich Plates. Chin. J. Aeronaut. 2019, 32, 785–798. [Google Scholar] [CrossRef]
- ISO9001: 2015; Contact Technology Guide—Ansys 2024/R2. ANSYS, Inc.: Canonsburg, PA, USA, 2024.
- Cabaleiro, M.; Comesaña, R.; González-Gaya, C.; Caamaño, C. Analytical Model for the Fatigue Analysis of Steel Joints by Clamps According to the Lever Length. Materials 2021, 14, 7726. [Google Scholar] [CrossRef] [PubMed]
- UNE-EN 1993-1-8; Eurocode 3: Design of Steel Structures—Part 1-8: Design of joints. Organización Española de Normalización (UNE): Madrid, Spain, 2013.
- ANSI/AISC 360-16; Specification for Structural Steel Buildings. American Institute of Steel Construction (AISC): Chicago, IL, USA, 2016.
- ANSI/AISC 360-22; Specification for Structural Steel Buildings. American Institute of Steel Construction (AISC): Chicago, IL, USA, 2022.
- EN 1090-2:2018+A1; Execution of Steel Structures and Aluminium Structures-Part 2: Technical Requirements for Steel Structures. European Committee for Standardization: Brussels, Belgium, 2024.
- Di Lorenzo, G.; Babilio, E.; Formisano, A.; Landolfo, R. Innovative Steel 3D Trusses for Preservating Archaeological Sites: Design and Preliminary Results. J. Constr. Steel Res. 2019, 154, 105866. [Google Scholar] [CrossRef]
- ISO 4017:2022; Fasteners Head Screws Grades A and B. Organización Española de Normalización (UNE): Madrid, Spain, 2023.
- UNE-EN ISO 898-1; Mechanical Properties of Fasteners Made of Carbon Steel and alloy Steel. Part 1: Bolts, Screws and Studs with Specified Property Classes. Organización Española de Normalización (UNE): Madrid, Spain, 2015.
- UNE-EN 14399-3; Part 3: System HR. Hexagon Bolt and Nut Assemblies. Organización Española de Normalización (UNE): Madrid, Spain, 2016.
- EN 14399-5; High-Strength Structural Bolting Assemblies for Preloading—Part: Plain Washers. Organización Española de Normalización (UNE): Madrid, Spain, 2016.
- UNE-EN ISO 6789-1; Assembly Tools for Screws and Nuts Hand Torque Tools Part 1: Requirements and Methods for Design Conformance Testing and Quality Conformance Testing: Minimum Requirements for Declaration of Conformance. Asociación Española de Normalización: Madrid, Spain, 2019.
- UNE-EN 14399-1; High Strength Structural Bolting Assemblies for Preloading Part 1: General Requirements. Organización Española de Normalización: Madrid, Spain, 2016.
- UNE-EN 10034; Structural Steels I and H Sections Tolerances on Shape and Dimensions. Organización Española de Normalización (UNE): Madrid, Spain, 1994.
- Li, D.; Huang, Z.; Uy, B.; Thai, H.T.; Hou, C. Slenderness Limits for Fabricated S960 Ultra-High-Strength Steel and Composite Columns. J. Constr. Steel Res. 2019, 159, 109–121. [Google Scholar] [CrossRef]
- Tahmasebinia, F.; Wang, Y.; Wu, S.; Ho, J.; Shen, W.; Ma, H.; Sepasgozar, S.M.E.; Marroquin, F.A.; Tsavdaridis, D.; Cai, G.; et al. Advanced Structural Analysis of Innovative Steel-Glass Structures with Respect to the Architectural Design. Buildings 2021, 11, 208. [Google Scholar] [CrossRef]
- Du, Y.; Chen, Z.; Xiong, M.X. Experimental Behavior and Design Method of Rectangular Concrete-Filled Tubular Columns Using Q460 High-Strength Steel. Constr. Build. Mater. 2016, 125, 856–872. [Google Scholar] [CrossRef]
- Du, Y.; Chen, Z.; Liew, J.Y.R.; Xiong, M.X. Rectangular Concrete-Filled Steel Tubular Beam-Columns Using High-Strength Steel: Experiments and Design. J. Constr. Steel Res. 2017, 131, 1–18. [Google Scholar] [CrossRef]
- UNE-EN 1993-1-1:2013/A1; Eurocódigo 3: Proyecto de Estructuras de Acero Parte 1-1: Reglas Generales y Reglas Para Edificios. Organización Española de Normalización (UNE): Madrid, Spain, 2014.
- ANSI/AISC 360-05; Specification for Structural Steel Buildings. American Institute of Steel Construction (AISC): Chicago, IL, USA, 2005.
- Li, L.; Wang, W.; Chen, Y.; Teh, L.H. Column-Wall Failure Mode of Steel Moment Connection with Inner Diaphragm and Catenary Mechanism. Eng. Struct. 2017, 131, 553–563. [Google Scholar] [CrossRef]
- Zhang, H.; Shayan, S.; Rasmussen, K.J.R.; Ellingwood, B.R. System-Based Design of Planar Steel Frames, I: Reliability Framework. J. Constr. Steel Res. 2016, 123, 135–143. [Google Scholar] [CrossRef]
- Tay, C.G.; Koh, C.G.; Liew, J.Y.R. Efficient Progressive Collapse Analysis for Robustness Evaluation of Buildings Experiencing Column Removal. J. Constr. Steel Res. 2016, 122, 395–408. [Google Scholar] [CrossRef]
- Kukla, D.; Kozlowski, A.; Ślęczka, L.; Wójcik-Grząba, I.; Nykiel, D.; Gubernat, S. Innovative Steel Beam-to-Column Joint under Central Column Loss Situation: Experimental Tests and Analytical Model. Eng. Struct. 2025, 326, 119513. [Google Scholar] [CrossRef]
- Ahmat, A.M.A.; Langlois, S.; Labossière, P. Strain Distribution and Failure Modes of Steel Lattice Tower Gusset Plates as a Function of Their Geometry. Structures 2024, 69, 107510. [Google Scholar] [CrossRef]
- Li, D.; Uy, B.; Aslani, F.; Patel, V. Behaviour and Design of Demountable CFST Column-Column Connections under Tension. J. Constr. Steel Res. 2017, 138, 761–773. [Google Scholar] [CrossRef]
- Liu, X.C.; Meng, K.; Chen, X.; Li, Y.M.; Cui, Y. Seismic Performance of Bolted Connection between T-Shaped Section Column and I-Section Beam with L-Stubs. Eng. Struct. 2023, 285, 116022. [Google Scholar] [CrossRef]
- Pournaghshband, A.; Maher, R. Numerical Investigation of Cyclic Behaviour in H-Shaped Stainless-Steel Beam-Columns. J. Constr. Steel Res. 2025, 227, 109370. [Google Scholar] [CrossRef]
- Sarquis, F.R.; de Lima, L.R.O. Numerical Investigation of Short-to-Intermediate Fixed-Ended Stainless Steel Bolted Starred Equal-Leg Angle Columns. J. Constr. Steel Res. 2024, 215, 108557. [Google Scholar] [CrossRef]
- Gao, L.; Wang, Y.; Wang, J.; Yuan, J.; Chen, B.; Bai, L. Experimental and Numerical Investigation on Global-Stability of Welded BS700 High-Strength Steel Beams. J. Constr. Steel Res. 2025, 227, 109373. [Google Scholar] [CrossRef]
- Alrubaidi, M.; Abadel, A.A. Numerical Study on Upgrading Beam-Column Connections in Steel Framed Buildings for Progressive Collapse Mitigation. Structures 2023, 48, 1576–1597. [Google Scholar] [CrossRef]
- Li, S.; Zhi, X.; Zhang, R.; Fan, F. Experimental and Numerical Investigation on the Impact Response of Bolt-Ball Joints. Structures 2024, 64, 106534. [Google Scholar] [CrossRef]
- Broniewicz, E.; Dec, K. Environmental Impact of Demolishing a Steel Structure Design for Disassembly. Energies 2022, 15, 7358. [Google Scholar] [CrossRef]
- Kavoura, F.; Veljkovic, M. Design Strategies for Reusable Structural Components in the Built Environment. In Life-Cycle of Structures and Infrastructure Systems, Proceedings of the 8th International Symposium on Life-Cycle Civil Engineering, IALCCE 2023, Milan, Italy, 2–6 July 2024; CRC Press/Balkema: Leiden, The Netherlands, 2023; pp. 799–806. [Google Scholar]
- Cabaleiro, M.; Conde, B.; González-Gaya, C.; Barros, B. Removable, Reconfigurable, and Sustainable Steel Structures: A State-of-the-Art Review of Clamp-Based Steel Connections. Sustainability 2023, 15, 7808. [Google Scholar] [CrossRef]


| Parts | Young’s Modulus (GPa) | Poisson’s Ratio | Density (kg/m3) | Yield Stress (MPa) |
|---|---|---|---|---|
| Bolt | 210 | 0.300 | 7850 | 640 |
| Nut | 210 | 0.300 | 7850 | 640 |
| Clamp | 210 | 0.300 | 7850 | 275 |
| Steel/Profiles | 210 | 0.300 | 7850 | 275 |
Disclaimer/Publisher’s Note: The statements, opinions and data contained in all publications are solely those of the individual author(s) and contributor(s) and not of MDPI and/or the editor(s). MDPI and/or the editor(s) disclaim responsibility for any injury to people or property resulting from any ideas, methods, instructions or products referred to in the content. |
© 2025 by the authors. Licensee MDPI, Basel, Switzerland. This article is an open access article distributed under the terms and conditions of the Creative Commons Attribution (CC BY) license (https://creativecommons.org/licenses/by/4.0/).
Share and Cite
Cavalheiro, F.N.; Cabaleiro, M.; Conde, B.; Cruz, Y. Elastic Structural Assessment of Clamp-Based Steel Beam-to-Column Connections for Reusable Steel Systems. Appl. Sci. 2025, 15, 5398. https://doi.org/10.3390/app15105398
Cavalheiro FN, Cabaleiro M, Conde B, Cruz Y. Elastic Structural Assessment of Clamp-Based Steel Beam-to-Column Connections for Reusable Steel Systems. Applied Sciences. 2025; 15(10):5398. https://doi.org/10.3390/app15105398
Chicago/Turabian StyleCavalheiro, Fernando Nunes, Manuel Cabaleiro, Borja Conde, and Yago Cruz. 2025. "Elastic Structural Assessment of Clamp-Based Steel Beam-to-Column Connections for Reusable Steel Systems" Applied Sciences 15, no. 10: 5398. https://doi.org/10.3390/app15105398
APA StyleCavalheiro, F. N., Cabaleiro, M., Conde, B., & Cruz, Y. (2025). Elastic Structural Assessment of Clamp-Based Steel Beam-to-Column Connections for Reusable Steel Systems. Applied Sciences, 15(10), 5398. https://doi.org/10.3390/app15105398