Article

Harnessing Semantic and Trajectory Analysis for Real-Time Pedestrian Panic Detection in Crowded Micro-Road Networks

School of Electronic and Information Engineering, Tongji University, Shanghai 201804, China
*
Author to whom correspondence should be addressed.
Appl. Sci. 2025, 15(10), 5394; https://doi.org/10.3390/app15105394
Submission received: 2 April 2025 / Revised: 7 May 2025 / Accepted: 9 May 2025 / Published: 12 May 2025

Abstract

:
Pedestrian panic behavior is a primary cause of overcrowding and stampede accidents in public micro-road network areas with high pedestrian density. However, reliably detecting such behaviors remains challenging due to their inherent complexity, variability, and stochastic nature. Current detection models often rely on single-modality features, which limits their effectiveness in complex and dynamic crowd scenarios. To overcome these limitations, this study proposes a contour-driven multimodal framework that first employs a CNN (CDNet) to estimate density maps and, by analyzing steep contour gradients, automatically delineates a candidate panic zone. Within these potential panic zones, pedestrian trajectories are analyzed through LSTM networks to capture irregular movements, such as counterflow and nonlinear wandering behaviors. Concurrently, semantic recognition based on Transformer models is utilized to identify verbal distress cues extracted through Baidu AI’s real-time speech-to-text conversion. The three embeddings are fused through a lightweight attention-enhanced MLP, enabling end-to-end inference at 40 FPS on a single GPU. To evaluate branch robustness under streaming conditions, the UCF Crowd dataset (150 videos without panic labels) is processed frame-by-frame at 25 FPS solely for density assessment, whereas full panic detection is validated on 30 real Itaewon-Stampede videos and 160 SUMO/Unity simulated emergencies that include explicit panic annotations. The proposed system achieves 91.7% accuracy and 88.2% F1 on the Itaewon set, outperforming all single- or dual-modality baselines and offering a deployable solution for proactive crowd safety monitoring in transport hubs, festivals, and other high-risk venues.

1. Introduction

In large-scale activities and daily transportation hubs, there are a great number of complex pedestrian channels limited by various isolation facilities, which form various micro-road networks to guide crowd movements. Understanding how pedestrians behave in micro-road networks is crucial for safe crowd movement, as abnormal behaviors can significantly impact evacuation efficiency and overall safety [1]. However, one of the most urgent challenges is identifying and managing pedestrian panic [2,3], which can exacerbate the risk of injury or even fatalities during pedestrian crowd movement.
In general, most pedestrian stampede accidents in crowded micro-road networks have shown that pedestrian panic behavior is one of the main causes of overcrowding and stampedes. However, there is still a lack of mature and usable models for identifying panic behaviors because they are complex, variable, and stochastic [2]. Recent advancements in computer vision and sensor technologies have facilitated the development of crowd monitoring systems [4,5]. Traditional approaches, such as surveillance cameras and sensor-based tracking, provide valuable insights into crowd behavior. Nevertheless, these methods often face limitations in real-time panic detection due to their reliance on sparse data, isolated analysis of crowd density, or lack of individual behavioral interpretation [6]. Detecting panic behaviors, such as sudden changes in movement patterns or the formation of dangerous density gradients, requires more sophisticated, multi-dimensional approaches that can capture individual and collective responses to perceived threats [7].
Several studies have investigated the use of density maps to assess crowd congestion and predict potential hazards [8,9]. However, existing methods typically focus on spatial density without considering dynamic factors, such as individual trajectories or semantic cues that may indicate distress. While trajectory analysis has been employed to study pedestrian movement [10], it is often disconnected from the contextual interpretation of behavior. While traditional trajectory modeling often relies on predefined physical assumptions, recent work has explored model-free learning of dynamic systems through multi-layer neural networks [11], suggesting alternative ways to capture complex behaviors without explicit physical modeling. Some recent approaches have attempted to integrate social and psychological factors, such as speech analysis and sentiment detection [12,13]; however, these remain underexplored in crowd panic. While prior work has explored multimodal fusion, many methods rely on simple concatenation without modeling inter-modal relationships. In contrast, recent AIoT-based activity recognition research has demonstrated that structured fusion methods—such as attention-based, hierarchical, or graph neural networks—can better capture complementary features across modalities. As reviewed in [14], these advanced approaches improve behavior recognition but often come with high computational costs, limiting their suitability for real-time public safety applications.
To address this issue, this study proposes a data-driven framework that integrates multiple sources of information—density maps, contour-based analysis, trajectory recognition, and semantic interpretation—to identify and localize panic behaviors in moving crowds. By generating high-resolution density maps and analyzing their contour lines, we can identify regions with unusual density gradients that are likely to signal panic zones. In these zones, individual trajectories are analyzed to detect irregularities, such as sudden changes in direction or speed. Additionally, semantic recognition of verbal cues enabled by speech-to-text conversion via the Baidu AI interface [15] enhances our ability to detect distress signals or panic-related language.
Unlike introducing fundamentally new model architectures, this work focuses on the systematic integration of spatial, temporal, and semantic cues through a contour-triggered progressive fusion strategy and an attention-weighted multimodal aggregator, tailored for real-time panic detection in dense pedestrian networks. This proposed approach represents a significant advancement in crowd safety management, offering a more comprehensive and accurate method for detecting panic behaviors in real-time. By integrating these diverse data sources, we provide a holistic view of crowd dynamics that accounts for spatial and behavioral factors, enabling timely and effective interventions in high-risk scenarios that occur in crowded micro-road networks.
The remainder of this paper is organized as follows: Section 2 reviews related work in the fields of crowd density and panic detection. Section 3 presents the methodology, including the data collection process and the integration of density maps, trajectory analysis, and semantic recognition. Section 4 discusses the experimental results and evaluation. Finally, Section 5 concludes with a discussion of the potential applications of the proposed framework and directions for future research.

2. Related Work

2.1. Crowd Density and Movement Analysis

A micro-road network refers to a network structure composed of passages or streets with different functions, levels, and locations (typically with widths ranging from 2.4 m to 4.2 m) in large event areas. These networks are formed with a certain density and an appropriate layout. During events, such networks bear the burden of large crowds gathering and moving, posing a significant risk of crowd congestion. Crowd density estimation remains one of the most commonly employed approaches in crowd behavior analysis. Initial works in this area largely relied on crowd flow models and density maps to identify potential risks. For instance, Khan et al. proposed a method for crowd density estimation that leveraged deep learning models to predict crowd congestion in real-time crowd density estimation [16], which was effective for detecting congestion in open spaces. However, it failed to account for the behavioral nuances of crowd panic, such as sudden changes in movement patterns and emotional escalation that make it difficult to identify the behavioral cues indicative of panic, which are often characterized by sudden, irregular movements and deviations from the general flow of the crowd [17]. Similarly, Alashban et al. introduced a method using convolutional neural networks (CNNs) to estimate crowd density, achieving promising results in detecting crowded areas [18]. However, their model could not assess sudden shifts in behavior that could signal an emergency or panic situation.

2.2. Panic Behavior Detection

In contrast to density-based methods, some researchers have explored the role of individual behaviors in identifying crowd panic. Zhao et al. incorporated trajectory analysis to track individual movements and detect deviations from normal crowd behavior [19]. Their approach successfully identified individuals who began moving erratically or in the opposite direction to the crowd flow, which is a key indicator of panic. However, trajectory analysis is often limited by the challenge of occlusions and the inability to track individuals in very dense crowds, where individuals may become difficult to distinguish due to visual clutter [20].
Building upon this, Xie et al. proposed a multi-agent model for crowd panic detection that combined trajectory data with crowd density maps [21]. Their model can track individual panic behavior by examining trajectory irregularities, such as increased speed or erratic movement patterns. Although this approach showed promise in simulated environments, it faced challenges when implemented in real-world scenarios in which the sensor data can be noisy or incomplete.
In recent years, the integration of semantic understanding has emerged as a promising approach for panic detection. Sen et al. utilized AI-driven natural language processing (NLP) techniques to identify distress signals through spoken language during crowd events [22]. This method combines video analysis with speech-to-text algorithms to detect panic-related communication, significantly enhancing the predictive performance of panic behaviors. However, this approach requires additional computational resources to processing and analyze speech, which may not always be feasible in real-time scenarios.
Despite these advancements, existing methods often fail to integrate trajectory and semantic features, leading to high false alarm rates and limited adaptability in dynamic crowd scenarios, primarily due to the reliance on sparse data sources or isolated analyses of crowd density or individual behaviors. Related achievements in panic behavior detection are shown in Table 1. It is worth noting that approaches focusing solely on crowd density fail to account for sudden behavioral shifts or irregular trajectories that often accompany panic scenarios. Similarly, trajectory-based methods may not perform well in environments with occlusions or dense crowds, where tracking individual movements becomes impractical.
Our work aims to overcome these limitations by adopting a multi-dimensional approach that combines crowd density maps, trajectory analysis, and semantic recognition to improve the real-time detection of panic behaviors. Integrating these different data sources can provide a more comprehensive and accurate understanding of individual and collective panic responses.

3. Methodology

To detect and analyze pedestrian panic behaviors within crowds effectively, we propose a comprehensive framework that integrates density mapping, contour-based analysis, trajectory recognition, and semantic interpretation. This multimodal approach identifies potential panic zones based on density irregularities and then examines individual behaviors to distinguish between normal and abnormal motion patterns. Furthermore, the semantic recognition of verbal cues provides additional insights into potential distress signals within a crowd. By combining spatial, motion, and semantic data, our method offers a robust solution for real-time panic detection and crowd management. The following section details the technical implementation and methodological steps used to achieve these objectives.

3.1. Crowd Density Measures Panic Risk

Crowd density is a critical metric for measuring spatial congestion and is closely related to the emergence of panic behaviors.

3.1.1. CDNet Framework

In this study, we propose CDNet (Crowd Density Network), a CNN-based deep learning model optimized for crowd density estimation. Unlike conventional CNNs, CDNet integrates an attention mechanism and a contextual enhancement module (CEM) to better capture local and global density variations. The model consists of a Backbone Extractor (BE), Density Perception Module (DPM), Contextual Enhancement Module (CEM), and Density Map Generator (DMG). BE, built on a pre-trained VGG-16, is enhanced with an attention mechanism and additional convolutional layers to improve spatial and semantic feature extraction. DPM processes feature maps from the BE using multi-scale convolutional kernels, allowing the model to adapt to varying crowd densities across spatial resolutions. CEM refines these features by integrating Spatial Pyramid Pooling (SPP) and a Transformer-based self-attention mechanism, generating dynamic weights to emphasize critical density regions. Finally, the DMG fuses the enhanced feature maps to produce the final density map through convolution layers, batch normalization, activation functions, and skip connections, ensuring efficient feature integration and precise density estimation. An overview of the CDNet working principles is presented in Figure 1.
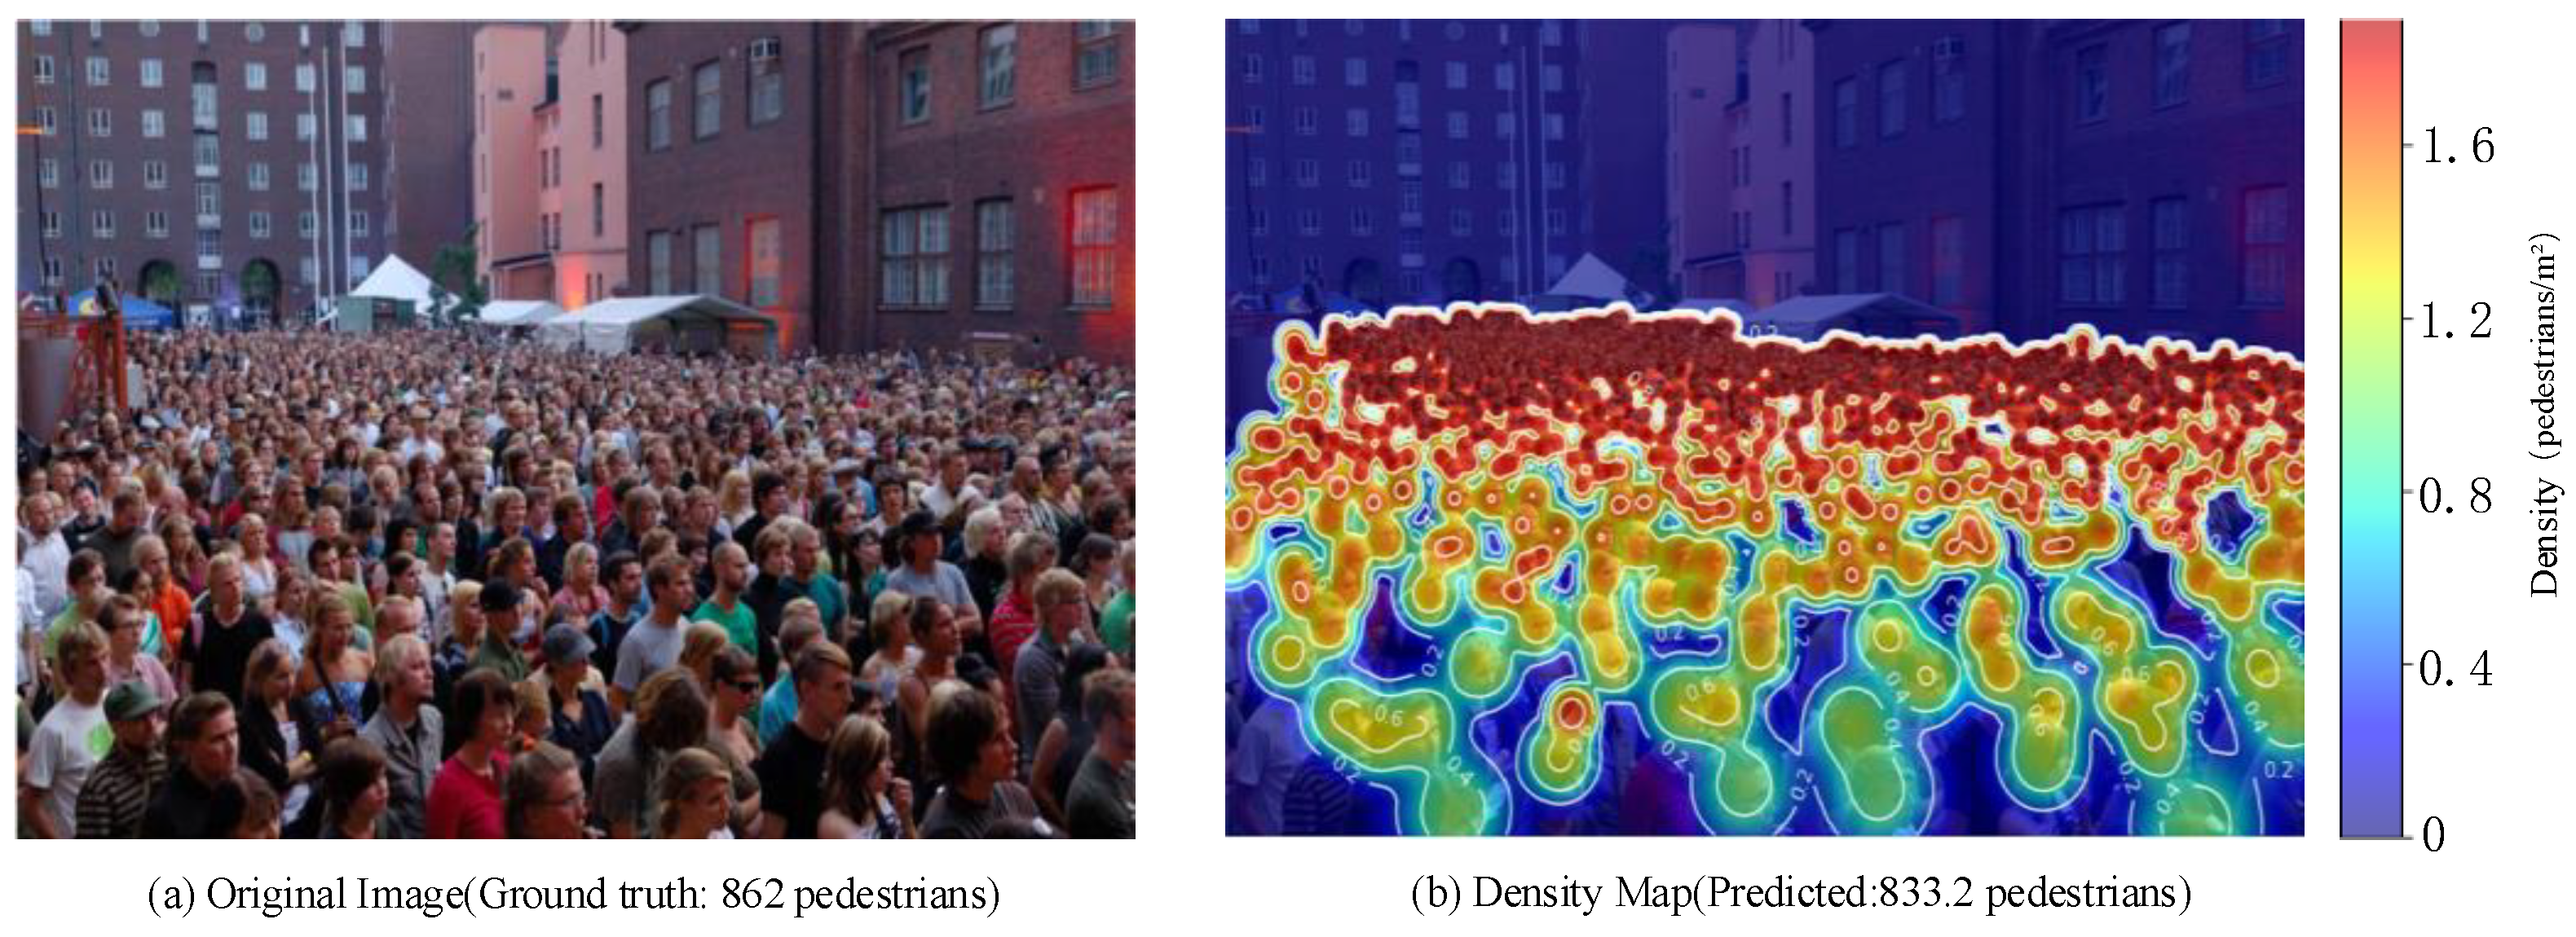
To verify the proposed CDNet, we choose the ShanghaiTech crowd-count dataset [32] as the main dataset to validate our proposed CDNet model. We mainly used the Part A subset for our experiments because high-density scenarios are more challenging and require more robust models than low-density scenarios. We scaled all images to a uniform size (512 × 512) to fit the model inputs and improve the training efficiency. The training uses a custom mixed loss function (MSE + MAE) to optimize the global and local density distributions. The model performance can be comprehensively analyzed through the predicted density map, as shown in Figure 2.

3.1.2. Abnormal Change of Contour Line

Contour is an effective method for describing the distribution of a two-dimensional density map by layers, and it can intuitively represent the change in density distribution in the form of lines. In the crowd density map, each contour line represents the boundary of the same density value, and the number, distribution shape, and area of the contour line reflect the density and changing trend of the crowd in the region. The variation in the number of contours reflects the complexity of the density distribution. For example, when there is a sudden increase in the number of contours, it often indicates a drastic change in the dense distribution of pedestrians in the area. The area surrounded by the contours reflects the size of the high-density region. When the contour area changes significantly in a short period, it may indicate a rapid gathering or dispersion of the crowd.
For image frames continuously captured in the same scene (e.g., every second or every few frames), CDNet performs frame-by-frame inference to generate the corresponding density maps D t ( x , y ) for multiple frames. Here, t represents a discrete time index ( t = 1,2 , 3 , T ) . Each density map D t is typically a matrix with the same resolution as the input image or a downscaled version, where the values represent the estimated number of pedestrians distributed in each pixel region.
(1)
Mathematical Description of Contour Features.
The change in contour quantity can be defined as expressed in Equation (1).
N c = N c t + 1 N c t
where N c t represent the number of contours at time t , and when N c exceeds a predefined threshold τ N , it indicates the presence of abnormal behavior in the current frame. The total change rate of the contour area can be defined as expressed in Equation (2).
A c = i = 1 N A i t + 1 i = 1 N A i t i = 1 N A i t + ϵ
where A i t represent the area of contour i at time t , and ϵ is a smoothing term to avoid division by zero.
(2)
Evaluation Rules of contour line.
To effectively detect panic behavior within a region based on contour features, the following rules are proposed. These rules leverage changes in contour quantity and contour area to evaluate whether anomalies occur.
  • Rules 1: (Abnormal Change in Contour Quantity).
N c > τ N
When the change in contour quantity exceeds the predefined threshold τ N , it may indicate the presence of panic-induced crowding behavior at that time.
  • Rules 2: (Abnormal Change in Contour Area).
A c > τ A  
When the rate of change in contour area exceeds the threshold τ A , it may indicate abnormal crowd gathering or dispersal behavior.
Combining the above two rules, the total fraction s is calculated as shown in Equation (5)
S = ω 1 · N c + ω 2 · A c
where ω 1 and ω 2 are the weights, and if the total score S exceeds a predefined threshold, it is determined that panic behavior has occurred.

3.2. Panic Trajectory Recognition Criterion

After analyzing the abnormal change in the contour line, we can identify regions with potential panic risks on both local and global scales. However, it is limited to relying solely on density maps for behavior detection because density maps lack direct information on individual movements. To solve this problem, we can combine the time series density map and pedestrian trajectory analysis and use the contextual information provided by the density map to help identify the abnormal behavior of individuals. Trajectory sequences encoded as time series velocity and directional changes were fed into a 2-layer LSTM with 128 hidden units per layer, followed by a fully connected layer to classify the trajectory anomalies.
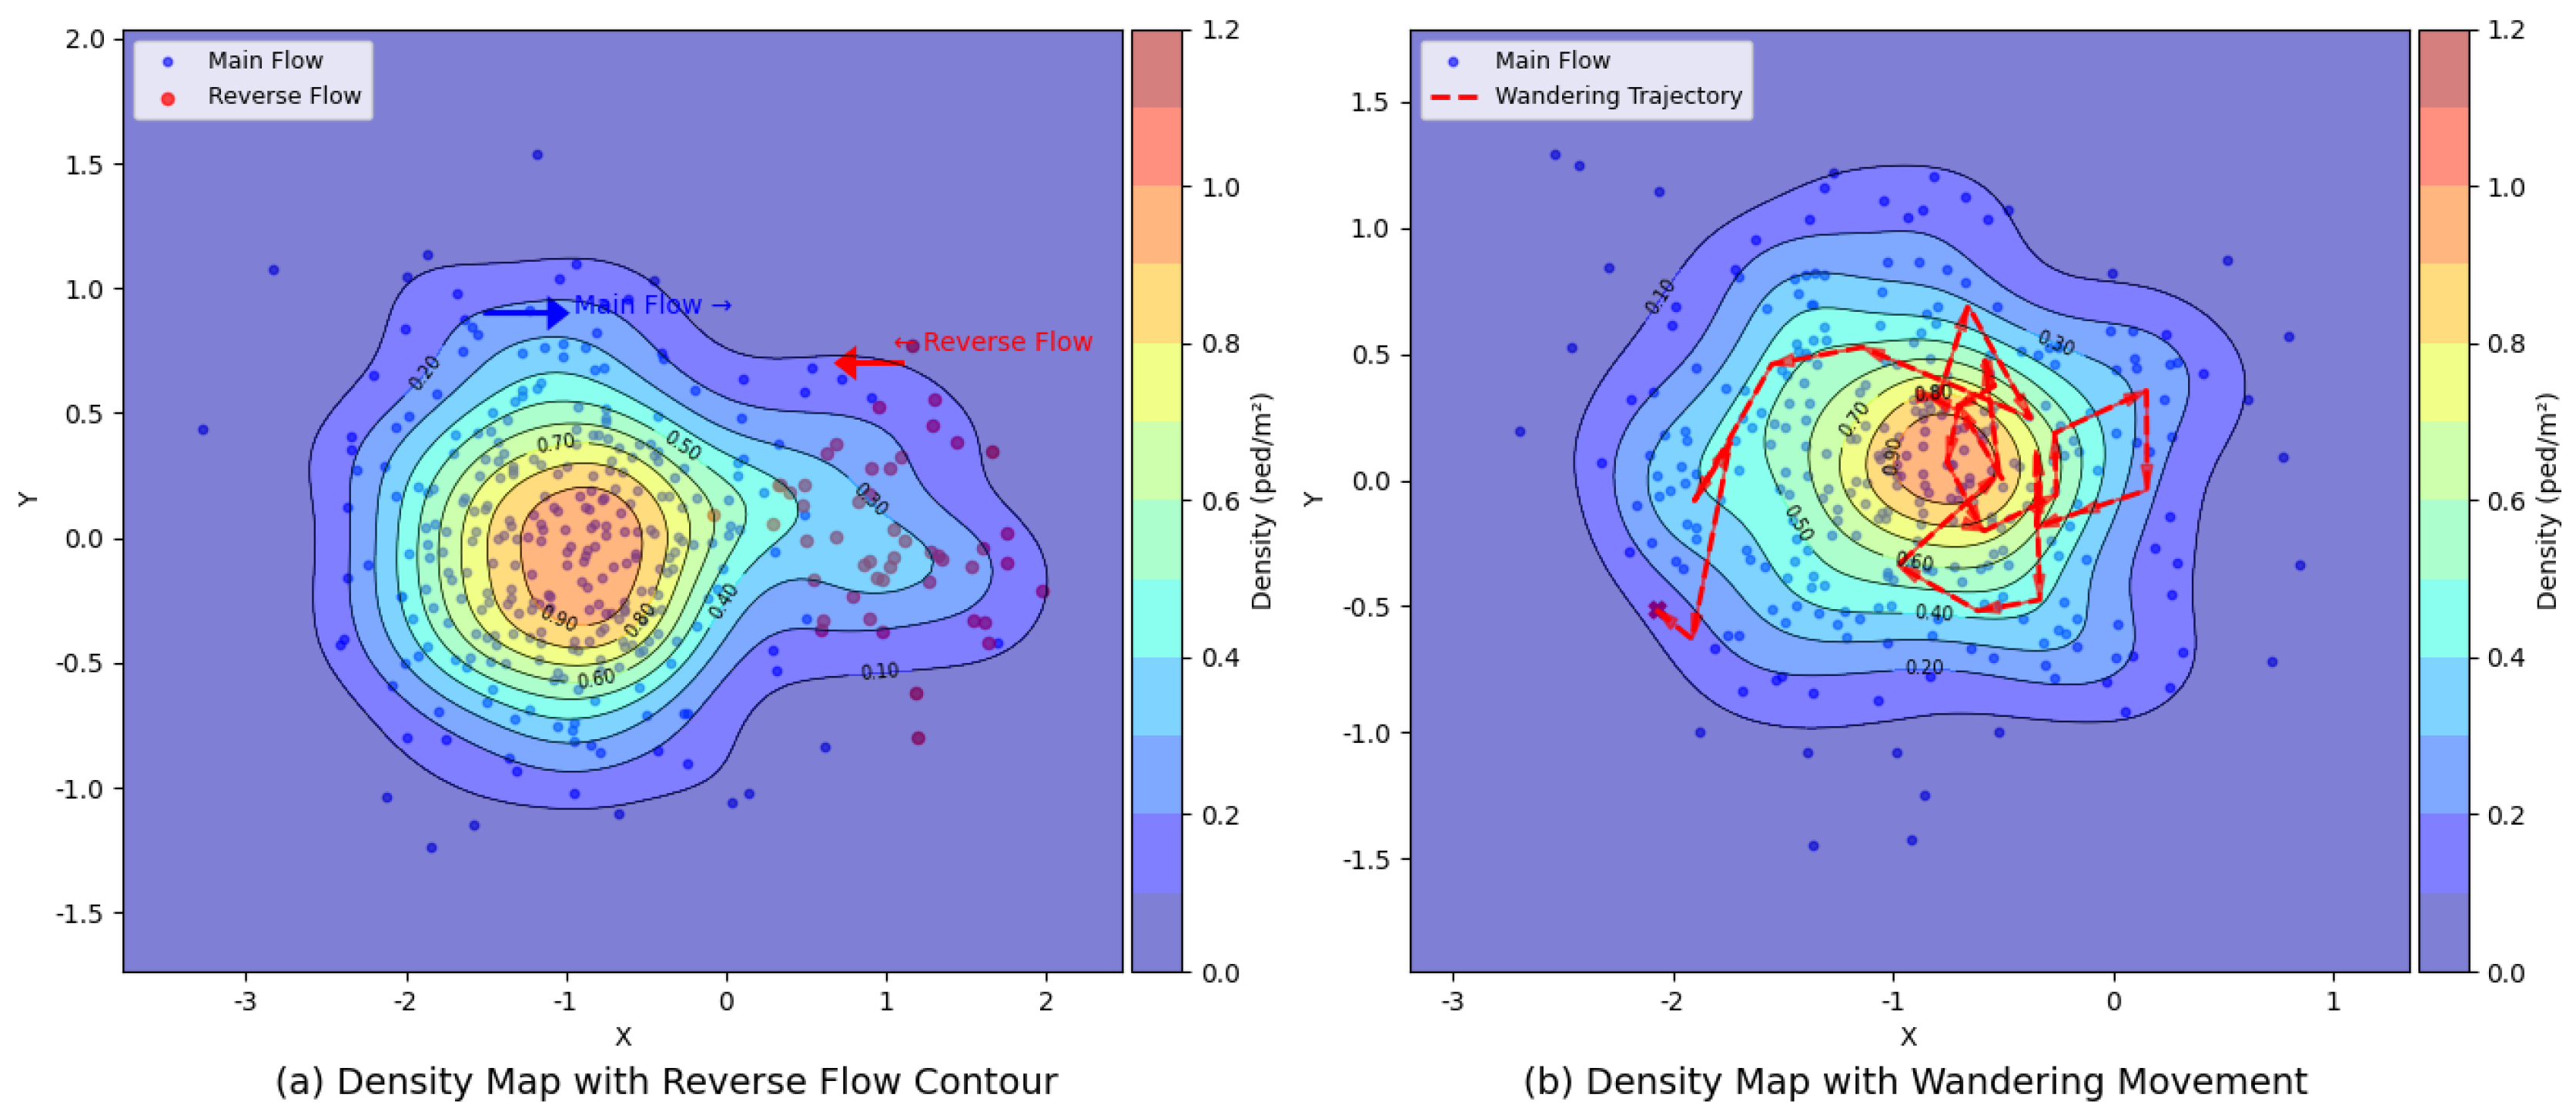
Density maps are usually generated from continuous video frames; therefore, capturing the dynamic features of crowd behavior by analyzing changes in the density map sequence is possible. These dynamic features can provide auxiliary information for detecting individual behaviors. To summarize the possible individual abnormal trajectories, Figure 3 shows two abnormal dynamic trajectories that may occur in different situations, where (a) represents the Density Map with Reverse Flow Contour and (b) represents the Density Map with Wandering Movement.

3.2.1. Countercurrent Trajectory Criterion

Countercurrent movement refers to a movement pattern in which an individual or object travels in a direction opposite to the predominant flow of the subject group.
In this scenario, the direction of the countercurrent entity is contrary to the overall flow, and regions experiencing countercurrent movement often exhibit changes in their density. These changes may include increased density due to the overlap between the countercurrent and the main crowd or unusual density distributions. The criterion for judging countercurrent motion is shown in Equation (6).
θ D = a r c t a n ( D / y D / x )
where θ D represents the direction angle of motion, and if θ m a i n represents the mainstream direction, and the direction angle changes by more than 110°, it is determined that there is a countercurrent, as shown in Equation (7).
θ = θ D θ m a i n

3.2.2. Nonlinear Motion Trajectory Criterion

Nonlinear motion is a movement mode characterized by irregular and nonlinear trajectories. This type of motion typically encompasses behaviors such as wandering, which deviates from the predominant direction of the main group movement. The path of nonlinear motion is generally curved and unpredictable, potentially including loops and random variations. Regions experiencing nonlinear motion often exhibit lower densities with smoothly varying density gradients. However, localized density concentrations can occur in meandering areas. The criterion for judging nonlinear motion is given by Equation (8).
K t = x t + 1 x t y t y t 1 x t x t 1 y t + 1 y t x t + 1 x t 2 + y t + 1 y t 2 3 2
where K t represents curvature of discrete points, and if k ¯ exceeds 0.5, then it is judged that there is nonlinear motion, as shown in Equation (9).
k ¯ = 1 T t = 1 T K t

3.3. Panic Semantic Recognition Criterion

Currently, most existing research focuses on using physical models to predict crowd flow trends and safety evacuation, while there is still a significant gap in the recognition and prediction of abnormal crowd behavior, especially in emergency response strategies under sudden, nonlinear, and complex scenarios. The panic event scenario model, based on the ontology of panic events, takes the panic scenario as the description object, the knowledge elements of the panic scenario as semantic units, the crowd states during the occurrence of panic events as model states, and stampede events caused by large-scale panic events as the model instances. The panic semantic knowledge network is used as a method for scenario representation, which helps construct a panic semantic model capable of semantic analysis and reasoning about panic events. After formalizing the panic semantic model using the Web Ontology Language (OWL), it can be parsed, accessed, and operated by computers to enable semantic reasoning, thereby achieving semantic services.
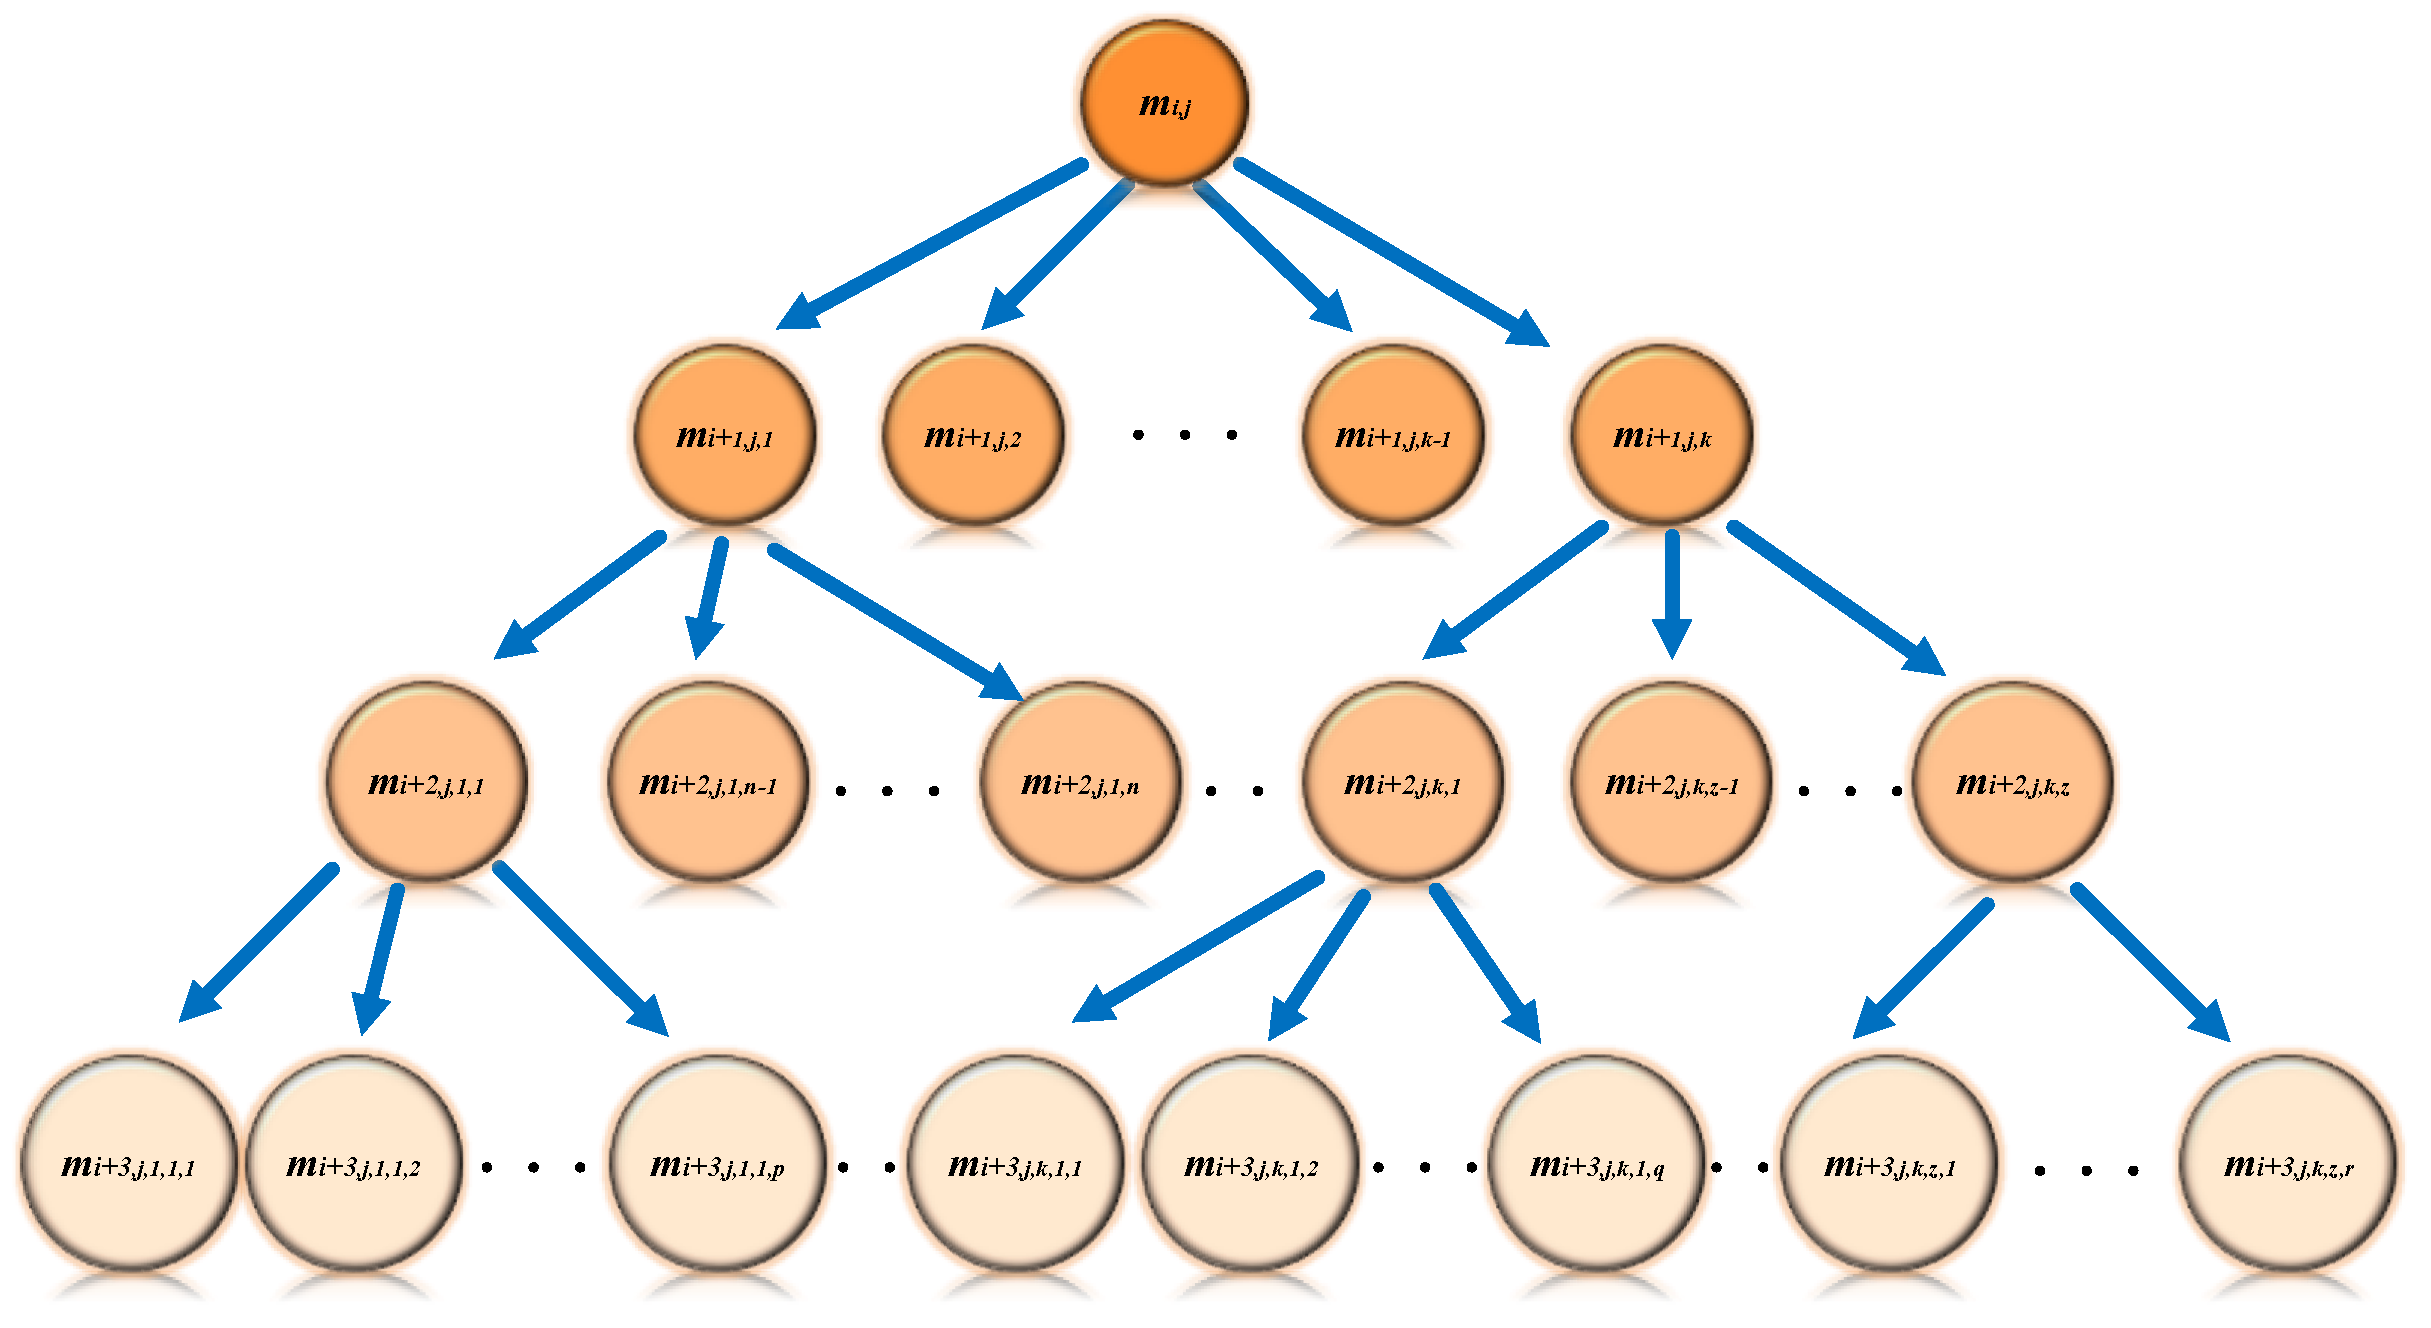
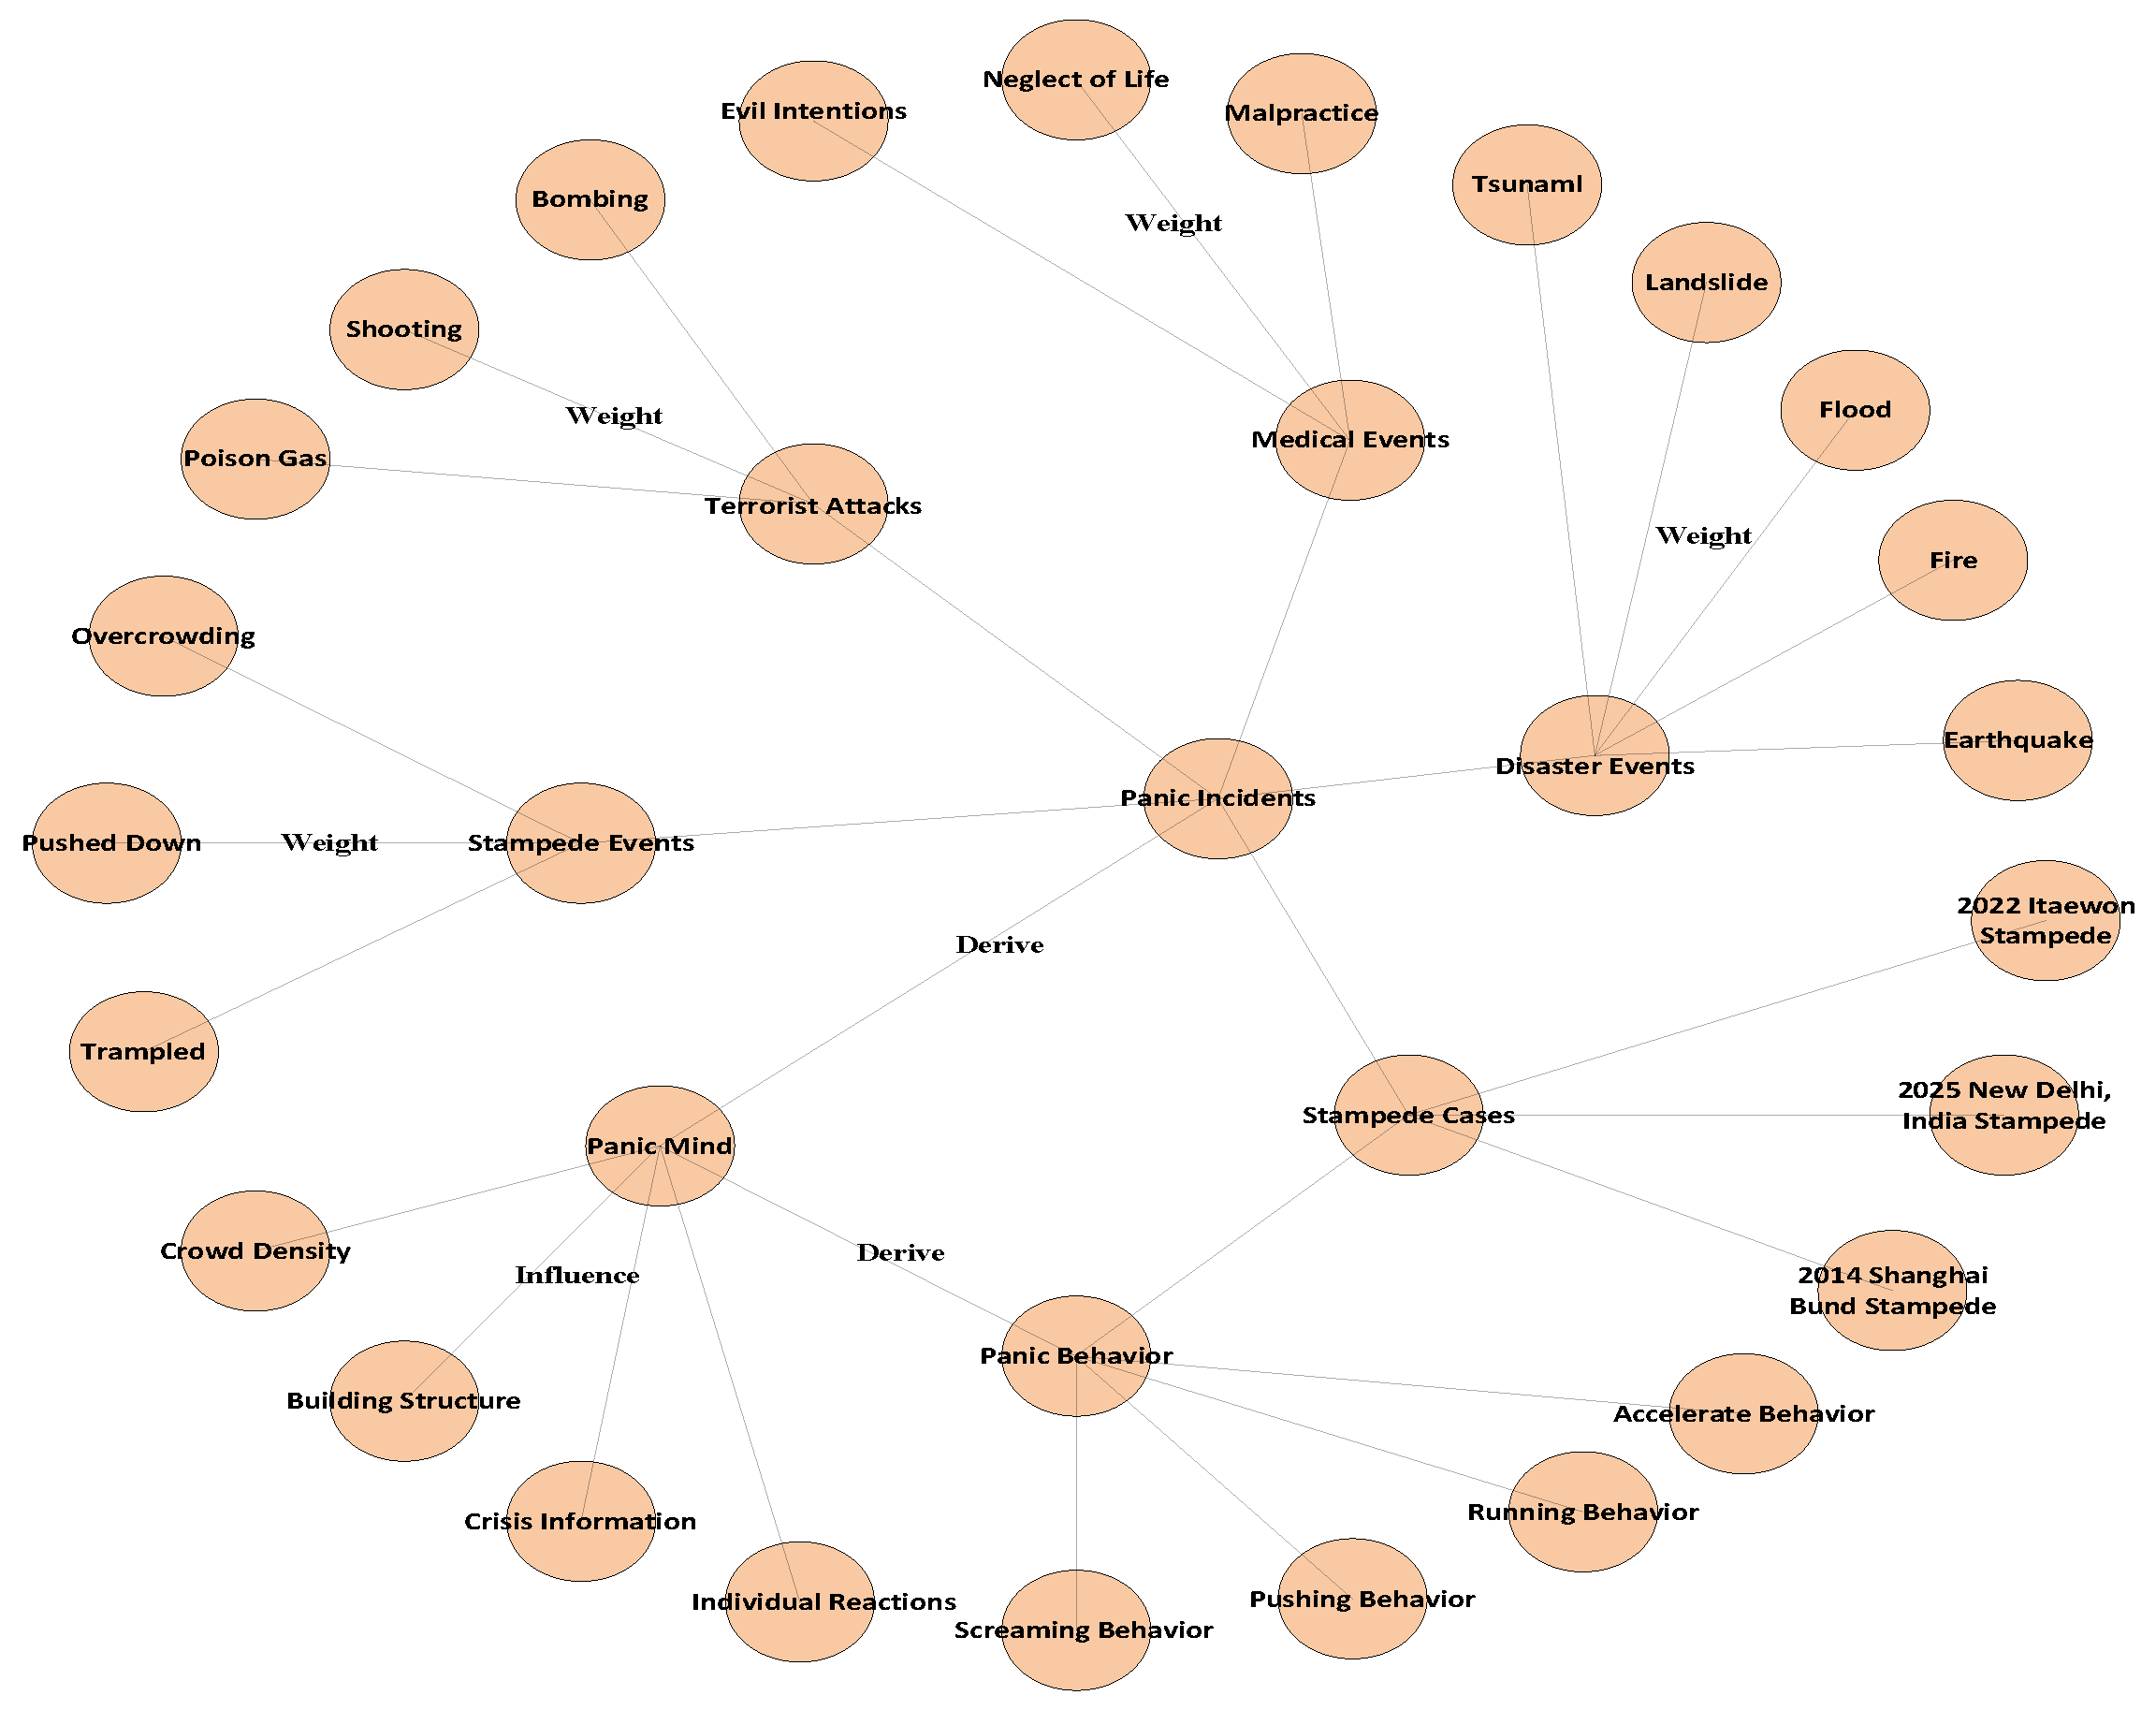
Building upon the panic semantic model, a reasoning network for panic semantics is developed. The model also includes a statistical analysis of the weights of key phrases within the network. In this study, the Baidu AI API [15] is employed for real-time speech recognition, converting audio streams into text. Upon recognition of key phrases such as ‘killing’, ‘help’, or ‘fire’, the system matches them with elements in the panic semantic reasoning network, which helps identify the occurrence of panic scenarios, such as disasters or terrorist attacks. This allows for early warnings and effectively prevents panic behaviors. A reasoning network based on panic semantics is illustrated in Figure 4. The description matrix derivation logic diagram of the inference network based on panic semantics is shown in Figure 5.
Define that when a key phrase recognized by the computer matches the i layer of the panic semantic model, the key phrase requires i + 1 positioning coordinates. The positioning coordinate matrix is shown in Equation (10).
A = { a q + 1 × c o l r } = i , j , , z , r i , j , , z , r + 1 i , j , , z , r + q = A 0 A 1 A q
where i = c o l r 1 , q + 1 represents the total number of keywords at the level where the key segment resides, and A represents the corresponding relationship formed according to the semantic network.
The description matrix of the reasoning network using panic semantics can be expressed by Equations (11) and (12).
M = {   m i , j   } = m A 0 ω A 1 m A 1 m A q 1 m A q ω A 2 ω A q 1 ω A q ,
1 q ω A q = 1
where ω A q represents the weight of q + 1 key segment in this level.
The experimental section uses an audio dataset from real-world settings, covering different types of public events (e.g., concerts, rallies, and festivals). The dataset is processed using the Baidu AI speech recognition API, converted into text form, and keyword extraction is performed using a predefined semantic dictionary. To validate the accuracy of the model, we evaluated its performance in four scenarios, as depicted in Figure 5, and used them as examples to conduct a random survey. The total number of participants in the survey was 300, and the groups were divided as follows:
(1) Elderly group (below 60 years old): 62, among which 29 were male and 33 were female;
(2) Middle-aged group (between 40 and 60 years old): 98, of whom 61 were male and 37 were female;
(3) Youth group (between 16 and 40 years old): 140, of whom 65 were male and 75 were female.
This study employs statistical methods to optimize the survey results and weights. These methods help identify the most influential variables and refine the model parameters, ensuring more accurate and robust data analysis. By adjusting the weights based on these statistical techniques, we can enhance the precision of our predictions regarding panic behavior and improve the overall effectiveness of the semantic model for panic events. The weight information is presented in Table 2.
The results show that the inference network can accurately identify event-related keywords and match them with actual event scenes when recognizing panic behavior. Specifically, in disaster event scenarios, the model achieved an accuracy rate of 87%, while the false alarm rate in normal activity scenarios was below 5%. Moreover, the model is also capable of inferring the event type and potential impact range based on the recognized semantic vocabulary, thereby providing timely early warning information to public safety management departments.
Moreover, to enhance contextual reasoning and mitigate the ambiguity caused by isolated or noisy speech cues, the semantic module employs a Transformer encoder to model phrase-level dependencies. The recognized transcripts are tokenized and encoded via a 4-layer Transformer with eight attention heads, which learns semantic correlations across tokens and attends to informative patterns. This architecture supports disambiguation by leveraging temporal co-occurrence and syntactic context, making the system more robust to dialect variations and acoustic interference. The resulting context-aware semantic embedding is matched against the ontology matrix to produce a more reliable panic probability estimate.

3.4. Fusion-Based Multi-Feature Method for Pedestrian Panic Recognition

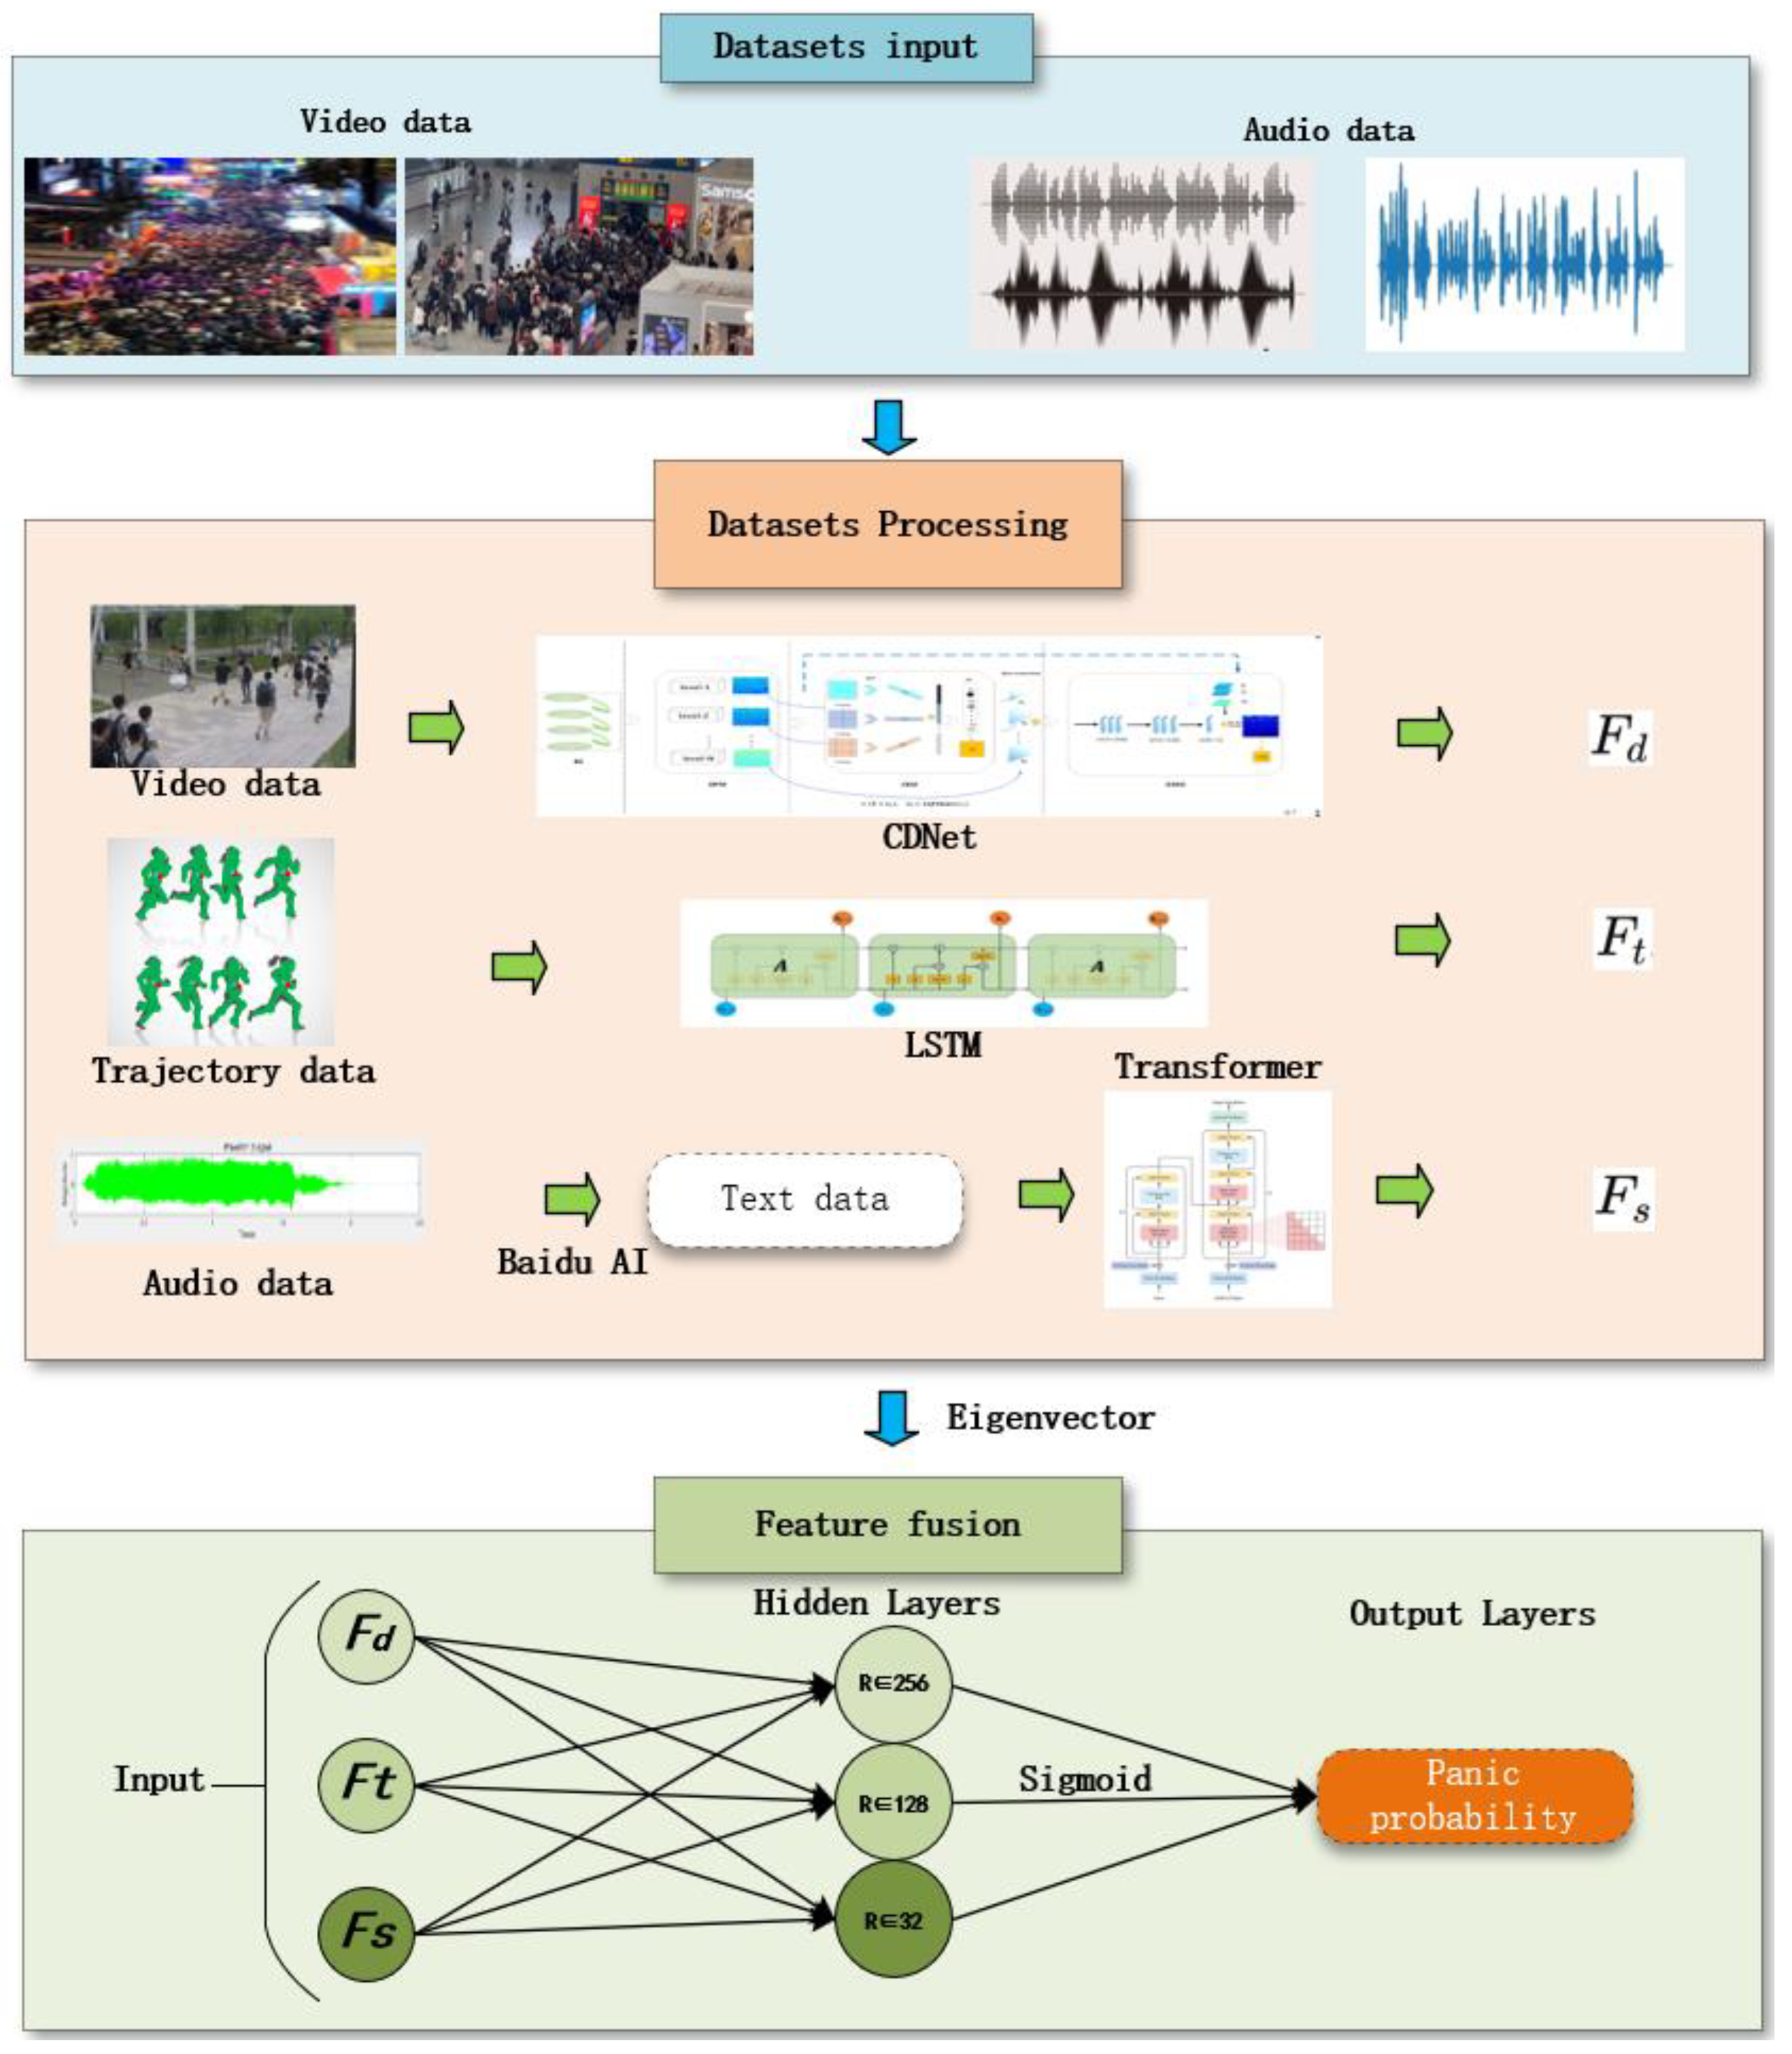
To effectively unify these heterogeneous feature streams, we design a lightweight attention-enhanced MLP fusion module, which adaptively aggregates spatial, temporal, and semantic cues into a compact joint representation for final panic recognition. The proposed framework integrates three complementary feature streams: spatial crowd density distributions, temporal pedestrian trajectories, and semantic verbal cues.
Each modality is processed independently to extract a 512-dimensional high-level embedding, denoted as x i where i d e n s i t y , t r a j e c t o r y , s e m a n t i c .
To achieve effective fusion, each modality-specific embedding is first projected into a shared latent space using a fully connected layer with ReLU activation:
z i = R e L U W i x i ,     W i R 256 × 512
A learnable attention query vector u R 256 is introduced to adaptively weight the three modalities. The attention weights are computed as:
w i = u z i ,     i w i = 1
and the fused representation is obtained as:
z fuse = i w i z i R 256
The fused feature z fuse is further refined by a multi-layer perceptron (MLP) with hidden dimensions of 128 and 32, using GELU activation and a dropout rate of 0.2 to prevent overfitting. Finally, a sigmoid activation outputs the frame-level panic probabilities.
The proposed attention-MLP fusion module introduces only 0.13 million parameters and adds less than 1 ms of inference overhead on an RTX 3080 GPU. Ablation experiments demonstrate that replacing the attention-MLP with naive early concatenation reduces the F1 score on the Itaewon dataset from 0.882 to 0.811, highlighting the importance of the designed fusion strategy. The detailed workflow is illustrated in Figure 6.

4. Experiments

4.1. Experimental Setup

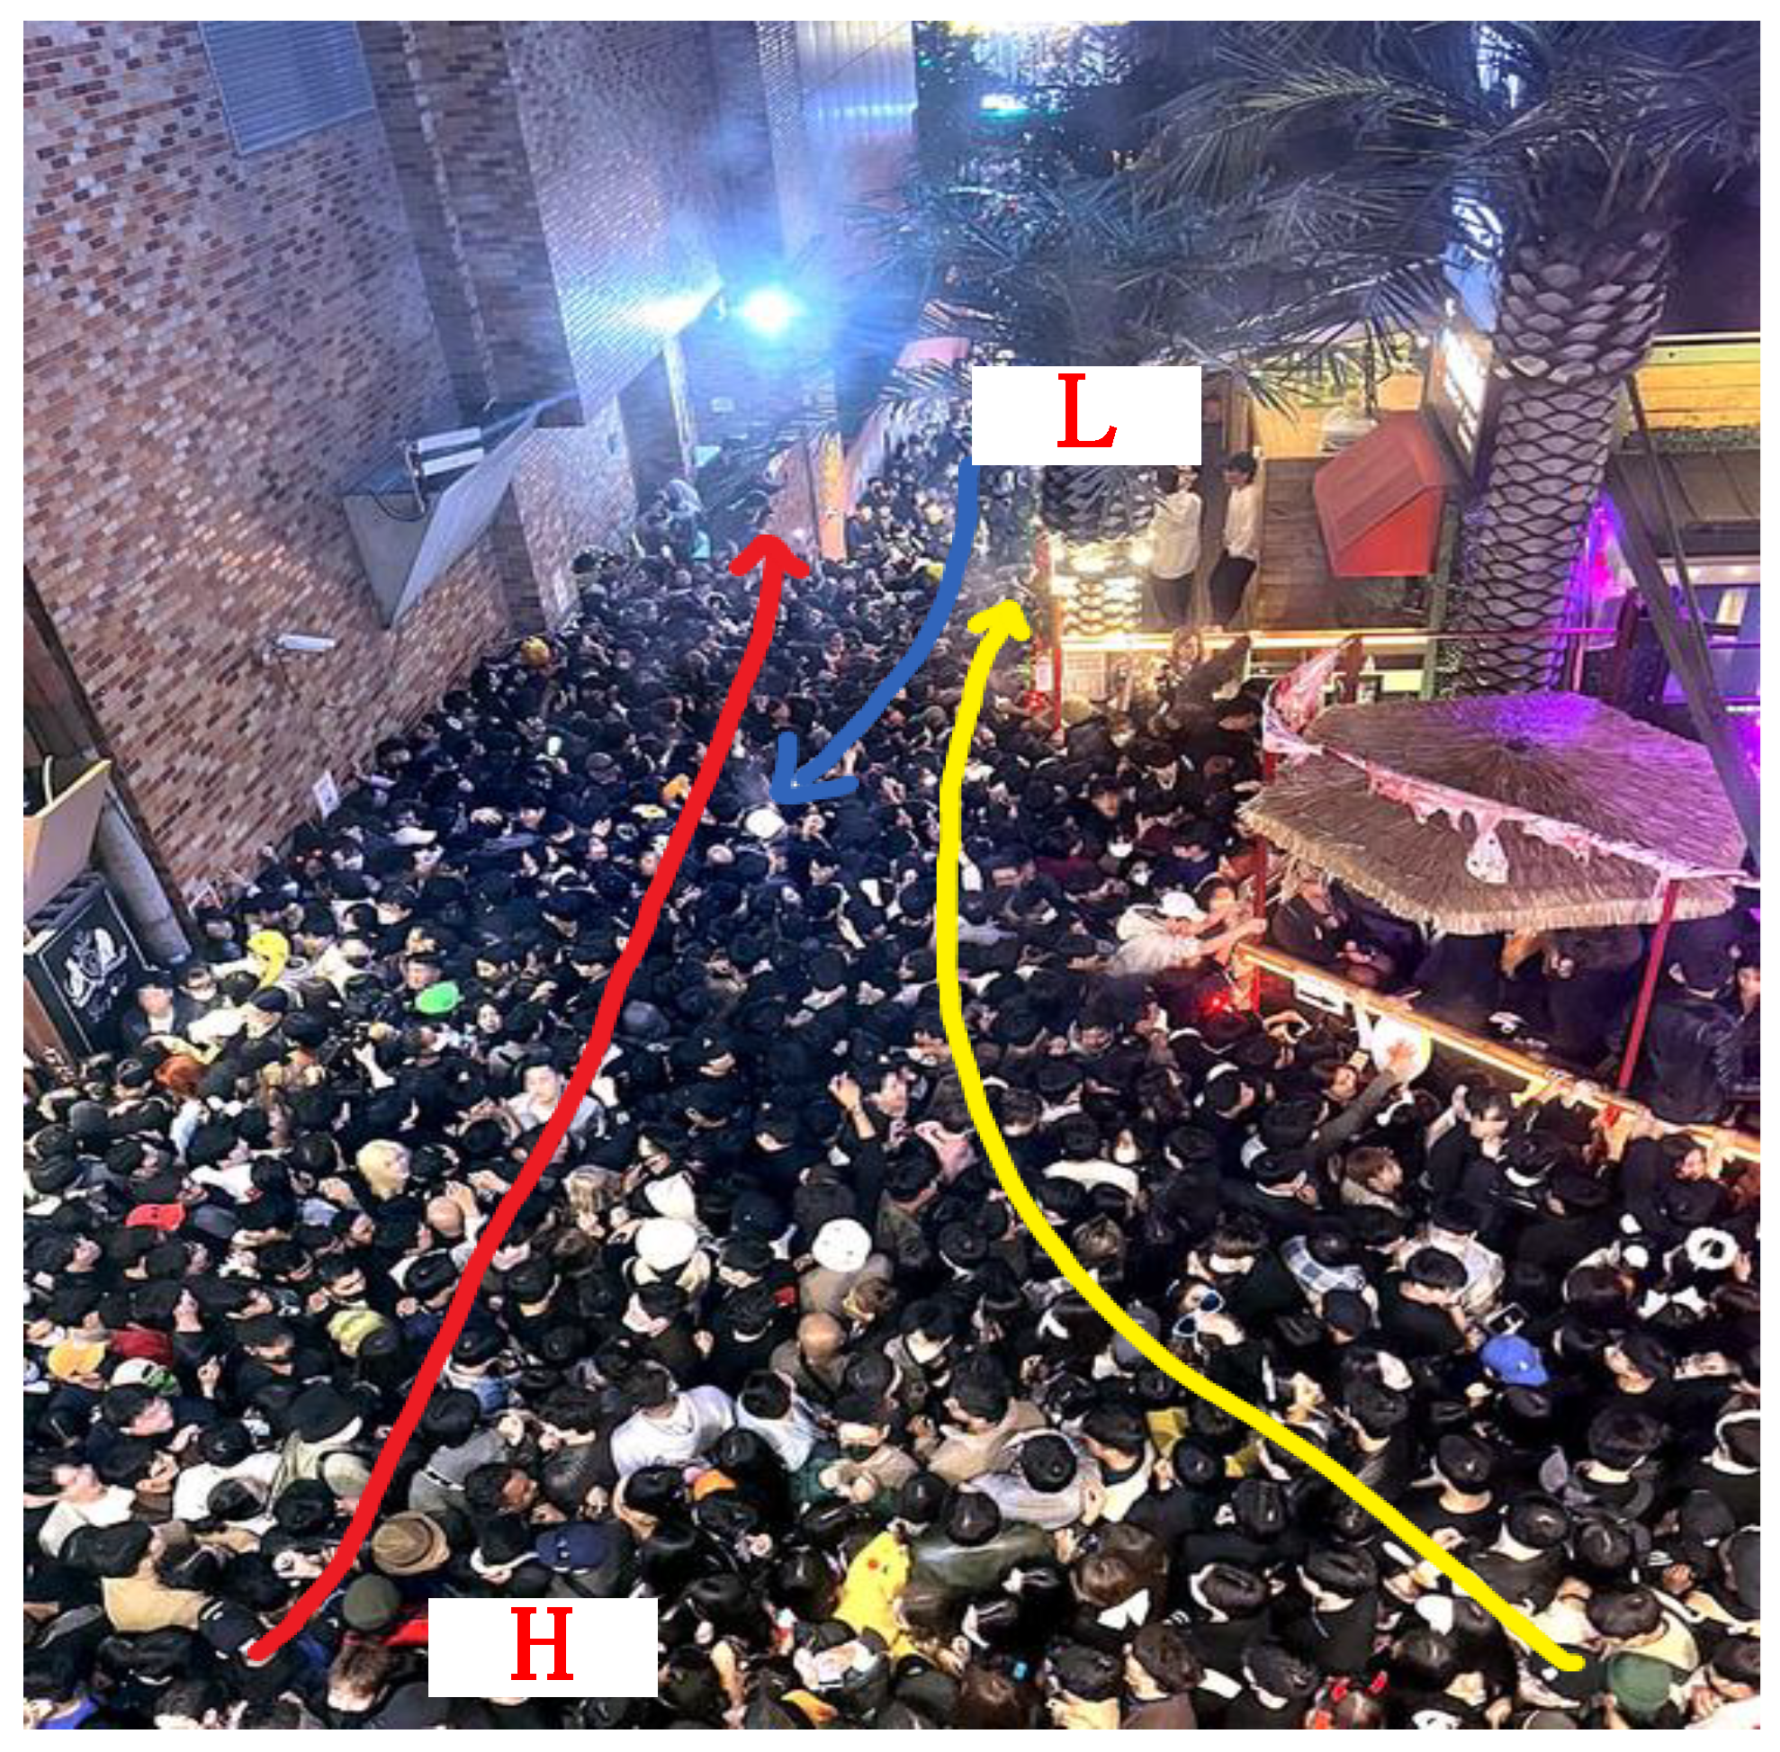
To evaluate the performance of the proposed multimodal panic recognition system, we employed a combination of real-world and simulated datasets. Specifically, we utilized the Stampede in Itaewon, South Korea, on 29 October 2022 [33], as a case study for model validation. On 29 December 2024, real-world videos were collected from the Internet and converted into a dataset to capture the flow of pedestrians on Itaewon’s Y-shaped micro-road, as illustrated in Figure 7. Panic scenarios in the Stampede in Itaewon dataset were annotated by three experienced annotators with an inter-annotator agreement (Cohen’s kappa) of 0.85. This dataset extracts multimodal features, including crowd density maps, trajectory patterns, and semantic cues, to facilitate panic behavior detection.
In addition to real-world data, we incorporated benchmark open-source and simulated datasets to assess the model’s generalization capability. The UCF Crowd dataset [34], a publicly available dataset comprising diverse crowd density scenarios, was utilized to test the proposed model’s robustness across varying congestion levels. Furthermore, we generated synthetic Simulated Panic Behavior Datasets using SUMO (Simulation of Urban Mobility) and Unity 3D, enabling controlled experimentation of pedestrian movement dynamics under sudden emergency scenarios. To adapt to the heterogeneous crowd conditions observed in real-world scenarios such as festivals, rural agglomerations, and nighttime events, the simulation framework should include diverse panic triggers, crowd densities, movement patterns, and lighting variations. These include both structured (e.g., concert-like) and unstructured (e.g., dispersed rural) layouts with synthetic cameras configured for different viewing angles and illumination levels. This diversity aims to bridge the gap between controlled simulations and the unpredictability of real-life emergencies. To create a controlled yet diverse set of panic scenarios, we followed a three-stage pipeline.
  • Traffic simulation;
Origin–destination pairs were randomly generated from a Poisson arrival model ( λ = 0.8 1.2   p e d / s ) and assigned to three canonical micro-road templates (Y-junction, bottleneck corridor, and serpentine queue) implemented in SUMO v1.20. Pedestrians initially walk at 1.8 m/s according to the Wiedemann model.
  • Traffic Panic trigger;
When the local density exceeds 6 ped/m2 or a virtual fire alarm is broadcast, the agents switch to the Helbing social-force model with an elevated desired speed (2.8 m/s) and a reduced personal-space radius (0.25 m), thus generating irregular flow and counter-moving trajectories.
  • Visual rendering;
The resulting trajectories are exported via OpenScenario and imported into Unity 2022 (HDRP). Five camera angles, day/night lighting presets, and ±10% speed noise are sampled to increase appearance diversity. Each run is recorded at 25 FPS, 1280 × 720 px, and H.264, yielding 160 unique video clips. All SUMO configuration files, Unity scenes, and conversion scripts (sumo2unity.py) are publicly available for reproducibility. Table 3 shows the key parameters of the SUMO−Unity simulation pipeline.
While the Itaewon dataset provides a concrete real-world reference, we acknowledge its singular nature. To mitigate potential overfitting and enhance generalization, our evaluation framework leverages the complementary strengths of real and simulation-based datasets to ensure both realism and diversity in recognizing panic scenarios. These simulation-based datasets provide valuable insights into panic-induced deviations in trajectories, abnormal density fluctuations, and distress-related verbal cues, thereby supplementing real-world observations with a broader range of behavioral conditions. Table 4 summarizes the statistical distribution of the datasets used in this study, including the number of video sequences, average crowd density (pedestrian/m2), and annotated panic events. Because panic clips are markedly fewer than non-panic clips, we adopt three complementary strategies to counter class imbalance: (i) focal-loss re-weighting ( γ = 2 , α = 0.75 ) to down-weight easy negative samples while amplifying the contribution of hard, minority-class examples; (ii) a class-balanced sampler that oversamples video segments containing panic frames so that each mini-batch maintains an approximate 1:1 panic/non-panic ratio; and (iii) targeted data augmentation—random spatial cropping, horizontal flipping, and ±10% temporal speed jitter—to increase the diversity of the limited panic samples.
The focal loss for a single sample is defined as
L f o c a l p t = α t 1 p t γ log p t
p t = p ,   y = 1 1 p ,   y = 0
where p is the model’s estimated probability for the positive (panic) class, γ is the focusing parameter that down-weights easy negatives, and α t = α when y = 1 and 1 α otherwise.

Ethical and Privacy Compliance

All Itaewon-Stampede clips in our dataset were retrieved exclusively from public domain sources—the Seoul Metropolitan Police Agency, Seoul Fire & Rescue Service, and three Korean national broadcasters (KBS, MBC, and YTN). Each video is released under a Creative Commons license (CC BY or CC BY-NC) or an equivalent public broadcast license that explicitly permits non-commercial academic reuse.
Before analysis, every clip was fully de-identified: faces were blurred with a 20-pixel Gaussian kernel, and original speech tracks were removed. Because the resulting data contain no personally identifiable information, the study falls under the “public data/non-identifiable” exemption defined by Tongji University’s Research Ethics Guideline and does not require additional Institutional Review Board approval or individual consent. The complete anonymization script and sample frame are provided in the project repository for transparency.

4.2. Case Analysis

To evaluate the practical effectiveness of the proposed multimodal panic recognition system, a case study was conducted using real-world surveillance data from Stampede in Itaewon, which is a high-density transportation hub. The dataset includes video recordings of normal pedestrian movements and panic scenarios, allowing for a detailed assessment of the system’s ability to detect and analyze abnormal behaviors in a complex micro-road network environment.
The input video stream is first processed by CDNet, which generates a crowd density map. Subsequently, contour-based criteria are applied to identify panic regions based on predefined thresholds. Specifically, the contour quantity variation threshold τ N is set to 7, while the contour area variation threshold τ A is set to 30%. The overall panic score S is determined using a threshold of 2.2, where the weights for contour quantity change ( ω 1 ) and contour area change ( ω 2 ) are set to 0.6 and 0.4, respectively, reflecting the greater significance of contour quantity variation in the Itaewon, the results are illustrated in Figure 8, where (a) and (c) represent the judgment results of crowd count and panic area, respectively.
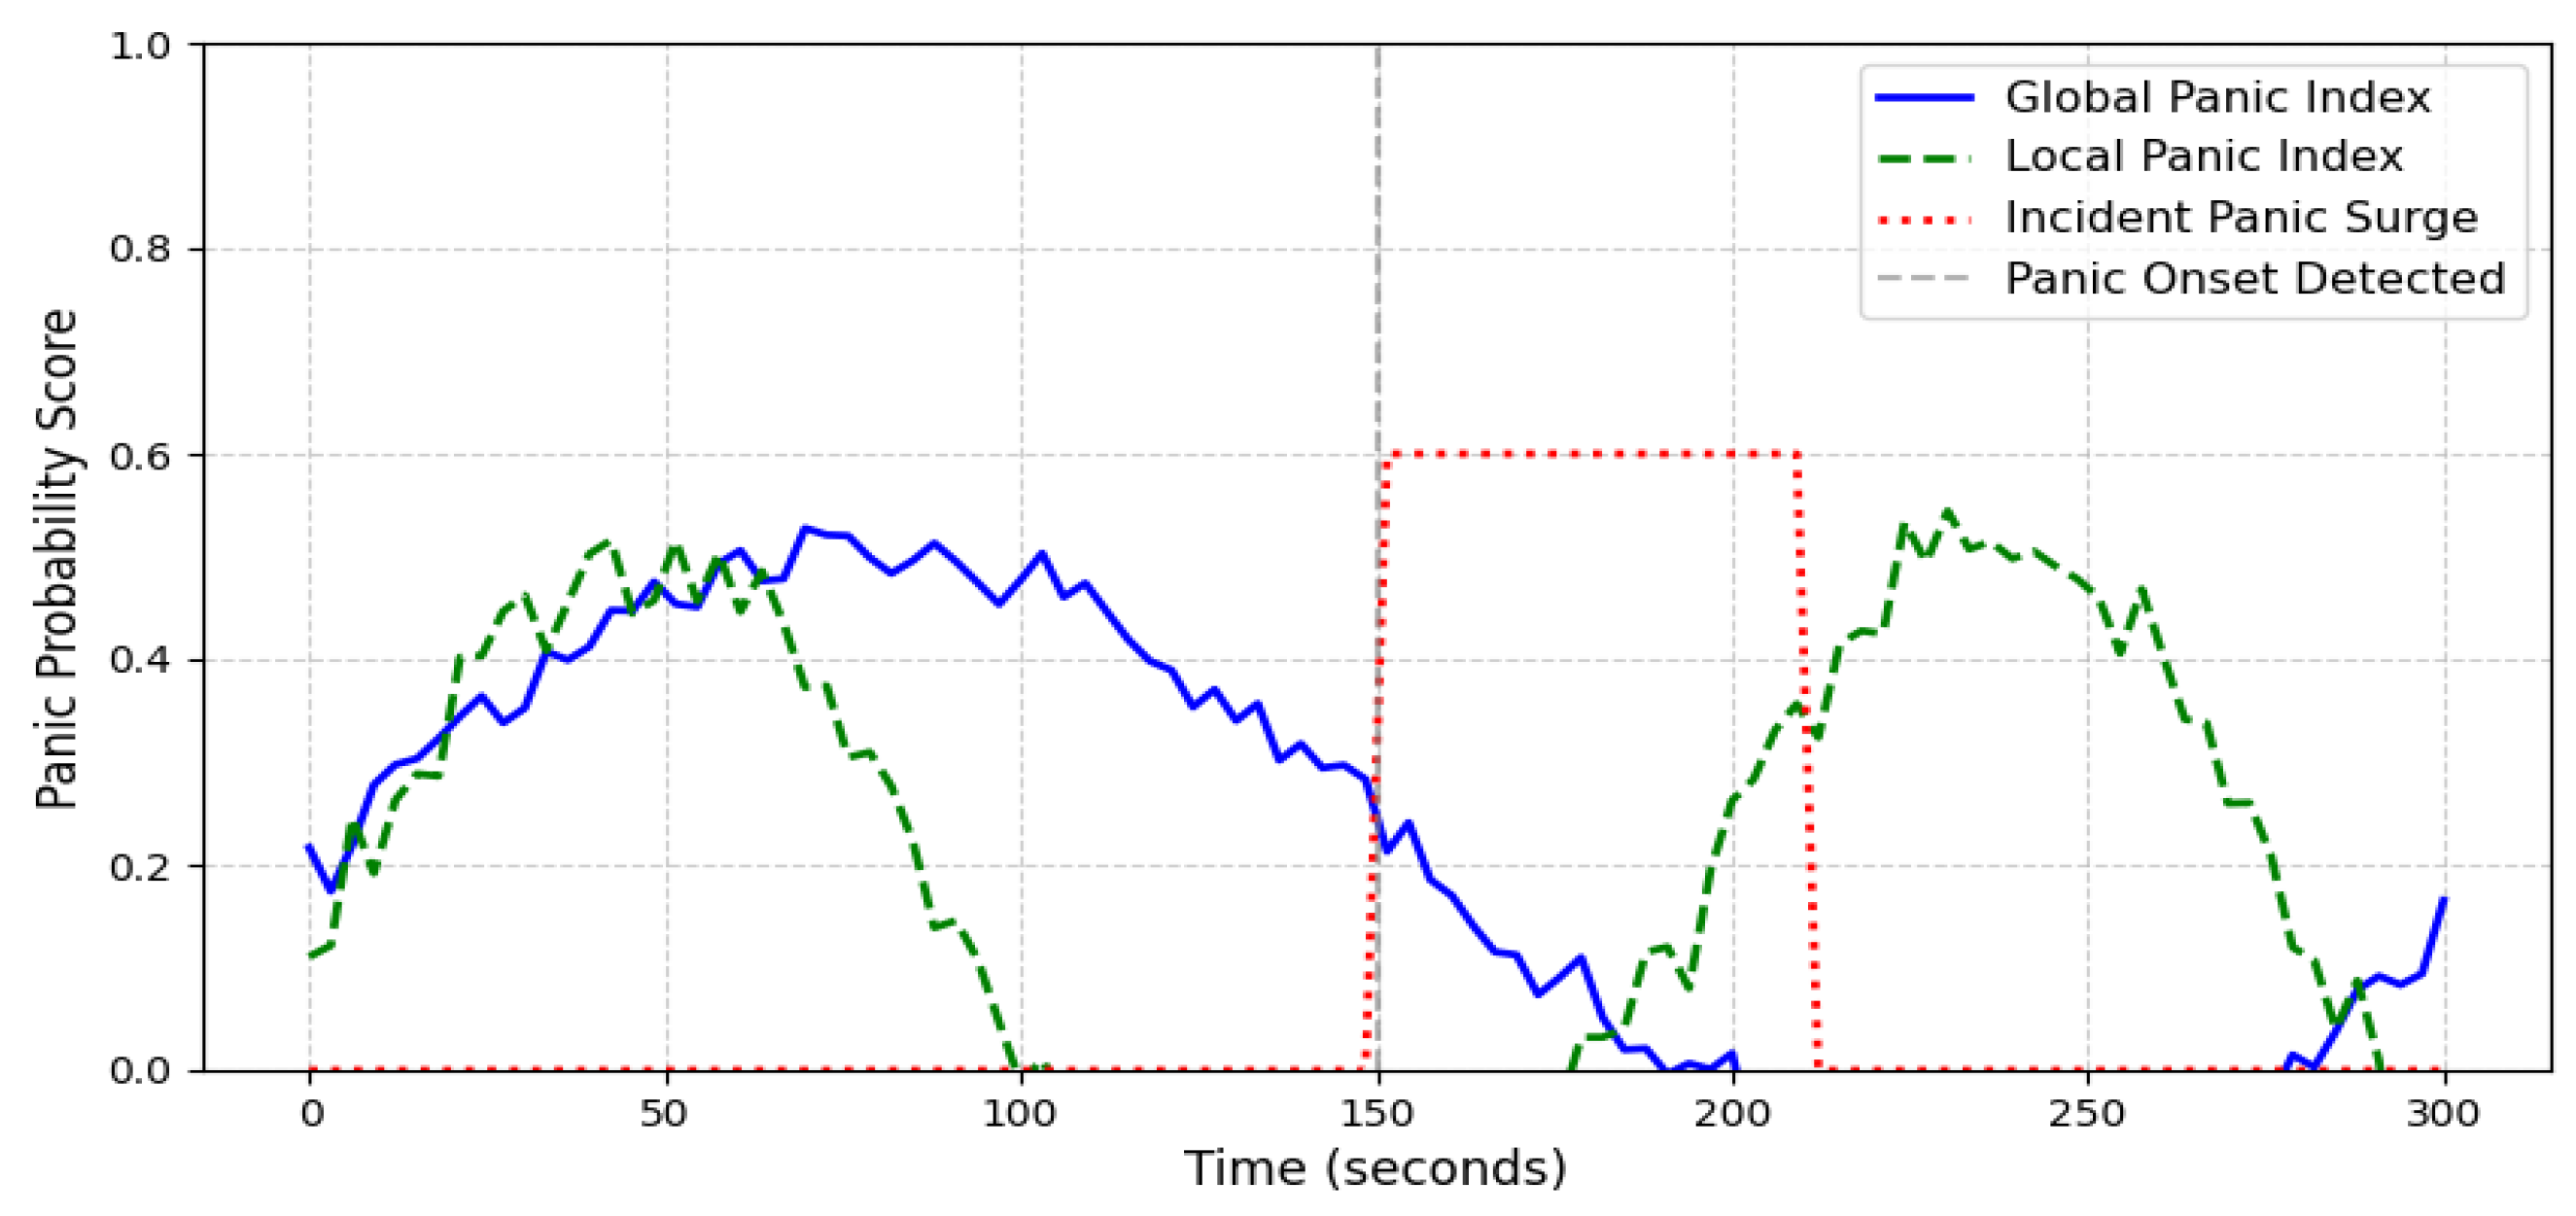
In addition to density-based panic region detection, pedestrian abnormal trajectory data are extracted according to the panic trajectory recognition criteria, which categorize anomalies such as counterflow movements, wandering behaviors, and abrupt directional changes. The extracted abnormal trajectories, including counterflow movements, behaviors, and other deviations from normal pedestrian flow, are processed by the LSTM- based. Trajectory analysis module to generate high-dimensional trajectory feature vectors. Simultaneously, speech and textual data derived from Baidu AI’s semantic analysis are fed into the Transformer-based semantic representation module, which encodes panic-related linguistic features into structured feature vectors. These modality-specific feature embeddings are subsequently fused through a multi-layer perceptron (MLP)-based multi-modal feature fusion framework, where optimized weighting mechanisms are applied to integrate spatial, temporal, and semantic representations. The final panic probability score, which quantifies the likelihood of panic-induced behaviors, is obtained as the output of this fusion process, as illustrated in Figure 9.
The results demonstrate that the proposed system successfully detects panic behaviors before large-scale crowd disturbances occur, allowing early intervention and risk mitigation. The multimodal integration of spatial, temporal, and semantic features enables a more comprehensive understanding of panic propagation, distinguishing true panic events from high-density but non-emergency crowd formations. The system’s performance in the Stampede in Itaewon, South Korea, validates its robustness in real-world, high-density public settings, confirming its potential applicability in intelligent surveillance and emergency response management.

4.3. Evaluation Metrics

To comprehensively assess the effectiveness and real-time feasibility of the proposed multimodal panic recognition system, we employ a hybrid evaluation framework that integrates classification performance metrics with computational efficiency metrics. This dual-faceted evaluation ensures that the model not only achieves high detection accuracy but also meets the stringent latency and throughput requirements necessary for real-time deployment in high-density micro-road network environments.
Furthermore, to evaluate the practical feasibility of the proposed framework, we assessed its end-to-end inference speed. This system achieves real-time inference at a speed of 40 FPS on the RTX 3080 GPU, with an average delay of 71 ms per frame, including density estimation, trajectory modeling, semantic recognition, and final fusion. These results indicate that moderate computational efficiency is suitable for high-end deployment and at the same time encourages future model compression and optimization efforts in resource-constrained environments.

4.3.1. Performance Metrics

The ability of the system to accurately distinguish panic-induced behaviors from normal pedestrian activities is quantified using five key classification metrics: Accuracy, Precision, Recall, F1-score, and AUC-ROC. These metrics collectively assess the model’s effectiveness in minimizing both false negatives (missed panic events) and false positives (erroneous panic alerts) while ensuring robustness under varying crowd densities and pedestrian dynamics.
The accuracy of the model is defined as the ratio of correctly classified samples to the total number of samples, as expressed in Equation (13).
A c u = T P + T N T P + T N + F P + F N  
where T P (True Positives) and T N (True Negatives) represent correctly classified panic and non-panic events, respectively, while F P (False Positives) and F N (False Negatives) denote incorrect classifications. Although accuracy provides an overall performance measure, it may be biased in imbalanced datasets, where panic events occur less frequently.
Precision quantifies the proportion of correctly predicted panic events among all instances classified as panic, as given in Equation (14).
P r e = T P T P + F P
A high precision score indicates a lower occurrence of false alarms, which is critical for ensuring system reliability in real-world deployment scenarios.
Recall, also referred to as sensitivity, measures the proportion of actual panic events that were successfully detected by the system, as formulated in Equation (15).
R e c = T P T P + F N
Since precision and recall present a trade-off, F1-score is employed as a harmonic mean of the two, ensuring a balanced assessment of the detection performance. The F1-score is computed using Equation (16).
F = 2 × P r e × R e c P r e + R e c
A higher F1-score reflects both a reduced false alarm rate and a strong sensitivity to panic events, making it a crucial metric in safety-critical applications.
The Area Under the Curve—Receiver Operating Characteristic (AUC-ROC) is used to evaluate the model’s discrimination ability between panic and non-panic cases across different decision thresholds. The AUC is calculated using Equation (17).
A U C = 0 1 T P R F P R   d ( F P R )
where TPR (True-Positive Rate) and FPR (False-Positive Rate) are plotted at varying thresholds to measure the model’s classification robustness. A model with A U C > 0.9 is considered highly effective in distinguishing between panic and non-panic behaviors. As Table 5 shows, our framework attains 91.7% accuracy, 0.892 precision, 0.873 recall, and an F1 of 0.882, confirming balanced performance on the Itaewon set. The AUC of 0.92 indicates strong separability, and the 71 ms mean latency (batch = 1, RTX 3080) meets real-time requirements.

4.3.2. Ablation Study

To assess the contribution of each modality and the effectiveness of the proposed fusion mechanism, we conducted an ablation study using the UCF Crowd and Simulated Panic Behavior Datasets. The experiments include single-modality models (crowd density, trajectory patterns, and semantic cues), dual-modality combinations (density + trajectory, density + semantic, and trajectory + semantic), and the full multimodal system. In addition, to evaluate the impact of the fusion strategy, we compared the proposed attention-enhanced MLP fusion with a naive early concatenation baseline.
Table 6 summarizes the results of the ablation study, highlighting the impact of different modality configurations and fusion strategies. The results demonstrate that the full model achieves the highest performance, with 91.7% accuracy, 88.2% F1-score, and 40 FPS inference speed, validating the benefit of multimodal integration. Removing any modality causes a significant performance drop, and semantic-only models suffer the most due to noise sensitivity. Among the dual-modality configurations, density + trajectory achieves the best trade-off, with 81.6% accuracy and 83.4% F1-score, highlighting the complementary nature of spatial and temporal cues.
Furthermore, replacing attention-enhanced fusion with naive concatenation reduces the F1-score from 88.2% to 81.1%, confirming that attention-weighted feature aggregation substantially improves fusion effectiveness under heterogeneous input conditions.

4.3.3. Robustness and Error Case Analysis

To evaluate the model’s real-world applicability, we conducted a series of stress tests under degraded input conditions and performed a detailed analysis of misclassified cases. Specifically, we simulated visual and auditory degradations, including Gaussian blur (σ = 3) and motion blur, to mimic low-resolution or fast camera motion, random occlusions covering up to 20% of pedestrian regions, and additive audio noise (SNR = 10 dB) combined with overlapping voices to replicate chaotic environments. Despite these perturbations, the full multimodal model maintained an F1 score of 0.821, demonstrating moderate resilience, primarily attributed to redundancy across modalities. Among the three branches, the semantic module was most affected by noise, with an F1-score drop of approximately 9.8%, while the trajectory and density fusion streams were more robust, with less than a 5% reduction. In addition to these robustness tests, we analyzed 50 false-positive and 50 false-negative frames from the Itaewon dataset. False positives were often triggered by transient crowd compressions—such as people entering or exiting narrow pathways—where no actual panic behavior occurred. Conversely, false negatives typically involved partially occluded panic behaviors like sudden running or screaming, which were only captured by a single modality (e.g., audio-only or motion-only), resulting in insufficient evidence for classification. These observations suggest that, while the system is generally reliable, future improvements should consider incorporating confidence-aware fusion mechanisms and temporal consistency modeling to further reduce misclassifications under uncertain conditions.

5. Conclusions

This study presents a multimodal framework designed to detect pedestrian panic behaviors within crowded micro-road networks. The methodology integrates spatial analysis using convolutional neural networks (CDNet) to identify panic-prone areas based on abnormal crowd density contours, temporal trajectory anomaly detection through LSTM networks to recognize irregular pedestrian movements, and semantic analysis via Transformer models interpreting verbal distress signals converted from real-time speech-to-text using Baidu AI. Additionally, a multi-layer perceptron (MLP)-based multimodal fusion approach effectively integrates these diverse data streams for enhanced panic detection accuracy.
Comprehensive experiments conducted on datasets from the Itaewon-Stampede accident and benchmark datasets validate the efficacy of the proposed approach. The multimodal model achieved 91.7% accuracy, 89.2% precision, 87.3% recall, and an F1-score of 88.2% on the Itaewon dataset, significantly surpassing the single- and dual-modality baselines. A similar performance was maintained in the SUMO/Unity simulations (F1-score 86.9%), demonstrating the framework’s robustness and cross-domain generalizability.
Although the proposed framework achieves strong performance in experimental settings, practical deployment may face constraints such as limited computational resources, adverse environmental conditions, and privacy considerations. Future work will explore model compression, domain adaptation, and multi-camera coordination to enhance the real-world applicability of public safety monitoring. Furthermore, the initial cross-site evaluation of datasets, such as unseen urban festivals, indicates that the proposed model maintains a strong panic recognition ability under different population compositions and environmental conditions without the need for additional fine-tuning. While current trajectory modeling is based on sequence learning via LSTM networks, it may be constrained by the assumptions of trajectory regularity. Future work will explore model-free representations, such as graph-based encoders or adaptive motion embeddings, to enable the system to generalize more effectively across unseen, highly dynamic crowd behaviors.

Author Contributions

Conceptualization, methodology, software, validation, formal analysis, investigation, resources, data curation, writing—original draft preparation, L.H., R.Z. and C.L.; writing—review and editing, B.W., R.Z., A.R. and Y.C., and visualization, L.H., C.L. and Y.M.; supervision and project administration, R.Z. All authors have read and agreed to the published version of the manuscript.

Funding

This research was funded by the National Natural Science Foundation of China (No. 72374154).

Institutional Review Board Statement

Not applicable.

Informed Consent Statement

Not applicable.

Data Availability Statement

The data presented in this study are available on request from the corresponding author. The data are not publicly available due to ethical and privacy restrictions.

Conflicts of Interest

The authors declare no conflicts of interest.

References

  1. Hu, Y.; Bi, Y.; Ren, X.; Huang, S.; Gao, W. Experimental study on the impact of a stationary pedestrian obstacle at the exit on evacuation. Phys. A Stat. Mech. Its Appl. 2023, 626, 129062. [Google Scholar] [CrossRef]
  2. Altamimi, A.B.; Ullah, H. Panic Detection in Crowded Scenes. Engineering. Technol. Appl. Sci. Res. 2020, 10, 5412–5418. [Google Scholar] [CrossRef]
  3. De Iuliis, M.; Battegazzorre, E.; Domaneschi, M.; Cimellaro, G.P.; Bottino, A.G. Large scale simulation of pedestrian seismic evacuation including panic behavior. Sustain. Cities Soc. 2023, 904, 104527. [Google Scholar] [CrossRef]
  4. Jain, D.K.; Zhao, X.; González-Almagro, G.; Gan, C.; Kotecha, K. Multimodal pedestrian detection using metaheuristics with deep convolutional neural network in crowded scenes. Inf. Fusion 2023, 95, 401–414. [Google Scholar] [CrossRef]
  5. López, A.M. Pedestrian Detection Systems. In Wiley Encyclopedia of Electrical and Electronics Engineering; Wiley-Interscience: Hoboken, NJ, USA, 2018. [Google Scholar]
  6. Ganga, B.; Lata, B.T.; Venugopal, K.R. Object detection and crowd analysis using deep learning techniques: Comprehensive review and future directions. Neurocomputing 2024, 597, 127932. [Google Scholar] [CrossRef]
  7. Hamid, A.A.; Monadjemi, S.A.; Bijan, S. ABDviaMSIFAT: Abnormal Crowd Behavior Detection Utilizing a Multi-Source Information Fusion Technique. IEEE Access 2024, 13, 75000–75019. [Google Scholar] [CrossRef]
  8. Lazaridis, L.; Dimou, A.; Daras, P. Abnormal behavior detection in crowded scenes using density heatmaps and optical flow. In Proceedings of the 2018 26th European Signal Processing Conference (EUSIPCO), Rome, Italy, 3–7 September 2018. [Google Scholar]
  9. Sharma, V.K.; Mir, R.N.; Singh, C. Scale-aware CNN for crowd density estimation and crowd behavior analysis. Comput. Electr. Eng. 2023, 106, 108569. [Google Scholar] [CrossRef]
  10. Zhou, S.; Shen, W.; Zeng, D.; Zhang, Z. Unusual event detection in crowded scenes by trajectory analysis. In Proceedings of the 2015 IEEE International Conference on Acoustics, Speech and Signal Processing (ICASSP), South Brisbane, QLD, Australia, 19–24 April 2015. [Google Scholar]
  11. Su, H.; Qi, W.; Hu, Y.; Sandoval, J.; Zhang, L.; Schmirander, Y.; Chen, G.; Aliverti, A.; Knoll, A.; Ferrigno, G.; et al. Towards Model-Free Tool Dynamic Identification and Calibration Using Multi-Layer Neural Network. Sensors 2019, 19, 3636. [Google Scholar] [CrossRef]
  12. Miao, Y.; Yang, J.; Alzahrani, B.; Lv, G.; Alafif, T.; Barnawi, A.; Chen, M. Abnormal behavior learning based on edge computing toward a crowd monitoring system. IEEE Netw. 2022, 36, 90–96. [Google Scholar] [CrossRef]
  13. Tyagi, B.; Nigam, S.; Singh, R. A review of deep learning techniques for crowd behavior analysis. Arch. Comput. Methods Eng. 2022, 29, 5427–5455. [Google Scholar] [CrossRef]
  14. Qi, W.; Xu, X.; Qian, K.; Schuller, B.W.; Fortino, G.; Aliverti, A. A Review of AIoT-based Human Activity Recognition: From Application to Technique. IEEE J. Biomed. Health Inform. 2024, 29, 2425–2438. [Google Scholar] [CrossRef] [PubMed]
  15. Baidu, A.I. Baidu AI Open Platform n.d. Available online: https://ai.baidu.com/ (accessed on 20 August 2024).
  16. Khan, M.A.; Menouar, H.; Hamila, R. LCDnet: A lightweight crowd density estimation model for real-time video surveillance. J. Real-Time Image Process. 2023, 20, 29. [Google Scholar] [CrossRef]
  17. Luo, L.; Xie, S.; Yin, H.; Peng, C.; Ong, Y.-S. Detecting and Quantifying Crowd-level Abnormal Behaviors in Crowd Events. IEEE Trans. Inf. Forensics Secur. 2024, 19, 6810–6823. [Google Scholar] [CrossRef]
  18. Alashban, A.; Alsadan, A.; Alhussainan, N.F.; Ouni, R. Single convolutional neural network with three layers model for crowd density estimation. IEEE Access 2022, 10, 63823–63833. [Google Scholar] [CrossRef]
  19. Zhao, R.; Wang, Y.; Jia, P.; Zhu, W.; Li, C.; Ma, Y.; Li, M. Abnormal behavior detection based on dynamic pedestrian centroid model: Case study on u-turn and fall-down. IEEE Trans. Intell. Transp. Syst. 2023, 24, 8066–8078. [Google Scholar] [CrossRef]
  20. Korbmacher, R.; Dang, H.-T.; Tordeux, A. Predicting pedestrian trajectories at different densities: A multi-criteria empirical analysis. Phys. A Stat. Mech. Its Appl. 2024, 634, 129440. [Google Scholar] [CrossRef]
  21. Xie, C.-Z.T.; Xu, J.; Zhu, B.; Tang, T.-Q.; Lo, S.; Zhang, B.; Tian, Y. Advancing crowd forecasting with graphs across microscopic trajectory to macroscopic dynamics. Inf. Fusion 2024, 106, 102275. [Google Scholar] [CrossRef]
  22. Sen, A.; Rajakumaran, G.; Mahdal, M.; Usharani, S.; Rajasekharan, V.; Vincent, R.; Sugavanan, K. Live event detection for people’s safety using NLP and deep learning. IEEE Access 2024, 12, 6455–6472. [Google Scholar] [CrossRef]
  23. Li, N.; Hou, Y.-B.; Huang, Z.-Q. Implementation of a Real-time Fall Detection Algorithm Based on Body’s Acceleration. J. Chin. Comput. Syst. 2012, 33, 2410–2413. (In Chinese) [Google Scholar]
  24. Pan, D.; Liu, H.; Qu, D.; Zhang, Z. Human Falling Detection Algorithm Based on Multisensor Data Fusion with SVM. Mob. Inf. Syst. 2020, 2020, 8826088. [Google Scholar] [CrossRef]
  25. Li, J.; Huang, Q.; Du, Y.; Zhen, X.; Chen, S.; Shao, L. Variational Abnormal Behavior Detection with Motion Consistency. IEEE Trans. Image Process. 2022, 31, 275–286. [Google Scholar] [CrossRef] [PubMed]
  26. Guo, S.; Bai, Q.; Gao, S.; Zhang, Y.; Li, A. An Analysis Method of Crowd Abnormal Behavior for Video Service Robot. IEEE Access 2019, 7, 169577–169585. [Google Scholar] [CrossRef]
  27. Huo, F.Z. Research on evacuation of people in panic state considering rush behavior. J. Saf. Sci. Technol. 2022, 18, 203–209. (In Chinese) [Google Scholar]
  28. Zhong, S. Panic Crowd Behavior Detection Based on Intersection Density of Motion Vector. Comput. Syst. Appl. 2017, 26, 210–214. (In Chinese) [Google Scholar]
  29. Chang, C.-W.; Chang, C.-Y.; Lin, Y.-Y. A hybrid CNN and LSTM-based deep learning model for abnormal behavior detection. Multimed. Tools Appl. 2022, 81, 11825–11843. [Google Scholar] [CrossRef]
  30. Qiu, J.; Yan, X.; Wang, W.; Wei, W.; Fang, K. Skeleton-Based Abnormal Behavior Detection Using Secure Partitioned Convolutional Neural Network Model. IEEE J. Biomed. Health Inform. 2022, 26, 5829–5840. [Google Scholar] [CrossRef]
  31. Vinothina, V.; George, A. Recognizing Abnormal Behavior in Heterogeneous Crowd using Two Stream CNN. In Proceedings of the 2024 Asia Pacific Conference on Innovation in Technology (APCIT), Mysore, India, 26–27 July 2024. [Google Scholar]
  32. Zhang, Y.; Zhou, D.; Chen, S.; Gao, S.; Ma, Y. Single-Image Crowd Counting via Multi-Column Convolutional Neural Network. In Proceedings of the 2016 IEEE Conference on Computer Vision and Pattern Recognition (CVPR), Las Vegas, NV, USA, 27–30 June 2016. [Google Scholar]
  33. Ha, K.M. Reviewing the Itaewon Halloween crowd crush, Korea 2022: Qualitative content analysis. F1000Research 2023, 12, 829. [Google Scholar] [CrossRef]
  34. Idrees, H.; Tayyab, M.; Athrey, K.; Zhang, D.; Al-Maadeed, S.; Rajpoot, N.; Shah, M. Composition Loss for Counting, Density Map Estimation and Localization in Dense Crowds. arXiv 2018, arXiv:1808.01050. [Google Scholar]
Figure 1. The structure of the proposed neural network for crowd density map estimation.
Applsci 15 05394 g001
Figure 2. The Density map predicted by CDNet.
Applsci 15 05394 g002
Figure 3. Density map with pedestrian abnormal trajectory. Note: The blue dot represents the mainstream movement, the red dot represents the countercurrent movement, and the red broken line represents the wandering movement.
Applsci 15 05394 g003
Figure 4. Description matrix derivation logic diagram of inference network based on panic semantics.
Applsci 15 05394 g004
Figure 5. Inference networks based on panic semantics.
Applsci 15 05394 g005
Figure 6. Pedestrian panic behavior recognition workflow.
Applsci 15 05394 g006
Figure 7. The real scene of the Stampede in Itaewon, South Korea, at around 10:10 p.m. on 29 October 2022. Note that the red, yellow and blue arrows indicate the direction of the flow of pedestrians, and H and L indicate the high and low areas of the micro-road, respectively.
Applsci 15 05394 g007
Figure 8. Microscopic road network-based panic area identification via CDNet and contour analysis. (a) Results of crowd counting using CDNet, in which the predicted number of pedestrians is 313.1 and the actual number of pedestrians is 339. (b) Generated heatmap representing population density. (c) Identified panic areas based on contour analysis, where red area is the judged panic area.
Applsci 15 05394 g008
Figure 9. Result analysis of panic event in the Stampede in Itaewon, South Korea. Note, the steep and non-horizontal transitions of the red dotted panic probability line result from the frame-by-frame computation without temporal smoothing, allowing the model to rapidly respond to sudden panic indicators. Though visually abrupt, these transitions reflect the system’s real-time sensitivity and early warning effectiveness.
Applsci 15 05394 g009
Table 1. Related methods of abnormal behavior detection.
NO.ReferenceMethodData SourceFeatureSusceptible Factor
1Zhao et al. [19]Open pose, dynamic centroid modelExperiment Volunteers, a set of falling activity recordsAcceleration, mass inertial of human body subsegments, and internal constraintsSimple group behavior patterns
2Li et al. [23]Decision tree classifierExperiment Volunteers, a set of falling activity recordsAcceleration, tilting angle, and still timeEnvironment
3Pan et al. [24]Multisensory data fusion with Support Vector Machine (SVM)Experiments of 100 VolunteersAccelerationMulti-noise or multi-source environments
4Li et al. [25]Variational abnormal behavior detection (VABD)UCSD, CUHK, Corridor, ShanghaiTechMotion consistencySensitivity
5Guo et al. [26]Improved k-meansUMNVelocity vectorSensitivity
6Huo et al. [27]Simulation/Move probabilitySensitivity
7Zhong et al. [28]LK optical flow methodUMNIntersection densityEnvironment
8Chang et al. [29]CNN and LSTMFall Detection DatasetFall, downReal-time
9Qiu et al. [30]Partitioned Convolutional Neural Network/Cognitive impairmentSimple group behavior patterns
10Vinothina et al. [31]Two-stream CNNAvenue DatasetRacing, tossing objects, and loiteringFalse positives
Table 2. Statistical table of key segment weights of the semantic recognition criterion.
NO.Event TypeKey WordTurnoutWeightNO.Event TypeKey WordTurnoutWeight
1Medical accidentMurder1520.512StampedeLet me out130.04
3Medical accidentStabbing760.254StampedeDon’t push me320.11
5Medical accidentHelp210.076StampedeSomeone fell570.19
7Medical accidentPay with your life380.138StampedeTrampled to death730.24
9Medical accidentBlack-hearted20.0110StampedeCrushed to death530.18
11Medical accidentDisregard for human life70.0212StampedeCan’t breathe500.17
13Medical accidentMisdiagnosis40.0114StampedeHelp220.07
15Disaster eventLandslide320.1116Terrorist attackKidnapping420.14
17Disaster eventEarthquake570.1918Terrorist attackExplosion360.12
19Disaster eventFire280.0920Terrorist attackBomb480.16
21Disaster eventMudslide230.0822Terrorist attackGun470.16
23Disaster eventFlood450.1524Terrorist attackPoison gas350.11
25Disaster eventTornado420.1426Terrorist attackDead body260.09
27Disaster eventTsunami730.2428Terrorist attackMurder660.22
Table 3. Key parameters of the SUMO–Unity simulation pipeline.
CategoryParameter (Symbol)Value/RangeNote
Arrival processArrival rate/ λ 0.8–1.2 ped/s47
Normal walkingDesired speed/ V 0 1.8 m/s24
Panic triggerDensity threshold4 ped/m215
Panic walkingDesired speed/ V p 2.8 m/sHelbing social-force
RenderingFrame rate25 FPSH.264 export
Domain randomizationSpeed noise±10%Applied per agent
Outputvideo clips160Final simulation dataset
Table 4. The statistical characteristics of related datasets.
DatasetVideos Density   ( Pedestrians / m 2 )Panic Events
Stampede in Itaewon308.747
UCF Crowd1502.824
Simulated Data1604.015
Table 5. Overall Classification Performance of the Itaewon Dataset.
MetricValue
Accuracy0.917
Precision0.892
Recall0.873
F1-score0.882
AUC-ROC0.920
Mean end-to-end latency71 ms
99th-percentile latency96 ms
Note: Metrics are computed frame-wise on all 19,408 annotated frames (30 Itaewon videos), the AUC uses a 0–1 threshold sweep (0.01 step), and latency—measured on a single-batch RTX 3080—covers decoding, inference and post-processing.
Table 6. Performance comparison in ablation study.
Model ConfigurationAccuracy
(%)
F1-Score
(%)
Inference Speed
(FPS)
Density-Only74.576.350
Trajectory-Only77.279.148
Semantic-Only72.874.953
Density + Trajectory81.683.445
Density + Semantic78.980.747
Trajectory + Semantic76.578.249
Full Model91.788.240
Disclaimer/Publisher’s Note: The statements, opinions and data contained in all publications are solely those of the individual author(s) and contributor(s) and not of MDPI and/or the editor(s). MDPI and/or the editor(s) disclaim responsibility for any injury to people or property resulting from any ideas, methods, instructions or products referred to in the content.