Article

Model of Optimization of Process Parameters for Machining of Separate Design Elements of the Product

by
Gulnara Zhetessova
1,
Irina Khrustaleva
2,
Viacheslav Shkodyrev
3,
Olga Zharkevich
1,*,
Aliya Kanatova
4,
Murat Kozhanov
5,
Gulim Tattimbetova
1 and
Gulnur Abdugaliyeva
1
1
Department of Technological Equipment, Engineering and Standardization, Mechanical Engineering Faculty, Abylkas Saginov Karaganda Technical University, Karaganda 100017, Kazakhstan
2
Graduate School of Mechanical Engineering, Institute of Mechanical Engineering, Materials and Transportation, Peter the Great St. Petersburg Polytechnic University, Saint Petersburg 195251, Russia
3
Graduate School of Cyber-Physical Systems Management, Institute of Computer Science and Cyber Security, Peter the Great St. Petersburg Polytechnic University, Saint Petersburg 195251, Russia
4
Department of Communication Systems Technology, Faculty of Energy, Automation, and Telecommunications, Abylkas Saginov Karaganda Technical University, Karaganda 100017, Kazakhstan
5
Department of Information Technology and Security, Faculty of Innovative Technologies, Abylkas Saginov Karaganda Technical University, Karaganda 100017, Kazakhstan
*
Author to whom correspondence should be addressed.
Appl. Sci. 2025, 15(10), 5395; https://doi.org/10.3390/app15105395
Submission received: 2 April 2025 / Revised: 4 May 2025 / Accepted: 8 May 2025 / Published: 12 May 2025
(This article belongs to the Section Mechanical Engineering)

Abstract

:
Optimization of process parameters for manufacturing of individual surfaces and the product as a whole is one of the key tasks of technological preparation of production. Processing of individual design elements of the product is a structurally complex process, which is a clear sequence of actions characterized by a set of parameters. The effectiveness of the optimization process directly depends on the level of detail of the process under study and the optimal choice of targets and control parameters. Thus, for a single design element of the product, the control task is reduced to the structural and parametric optimization of its processing. For this purpose, it is necessary to develop a hierarchical model of structural and parametric optimization of the processing of individual design elements of the product. The paper presents a structural hierarchical model of the design element forming process, describing the sequence of actions and intermediate states of the object at different control levels. The model is based on the structural decomposition of the process and includes three levels: technological processing route, technological transition, and working stroke. For each level, theoretical-multiple models, vector optimization criteria, control parameters, and boundary conditions are defined. The article also demonstrates the application of the model on the example of optimization for the process of shaping a group of threaded holes, where the Pareto-optimization method was used to obtain optimal machining parameters that reduced the labor intensity with an acceptable increase in error and surface roughness. The paper presents the results of controlling the machining process of a group of threaded holes by means of structural optimization of the machining process route and parametric optimization of cutting parameters for each working stroke. Optimal parameters of the machining process for the investigated group of threaded holes are achieved by reducing the number of technological transitions within the technological route of machining, as well as optimizing the value of cutting speed set in the process of tapping with a tapsetter. Thus, as a result of the optimization, the total labor intensity of individual transitions decreased by 18.3%, with an increase in processing error by 12.1%, and deterioration of the roughness parameter by 13.2%, which satisfies the initial conditions of optimization. The obtained results prove the effectiveness of the developed hierarchical model of controlling the process of machining individual design elements of the product through structural and parametric optimization of its individual stages.

1. Introduction

The products manufactured by machine-building enterprises are characterized by a certain set of properties that meet the requirements of potential consumers for the corresponding product [1].
The growth of industrial production in the field of mechanical engineering, observed in recent years, requires enterprises to continuously improve the production process by increasing the efficiency of the implementation of different classes of operations performed in the process of manufacturing products [2,3]. The solution of this problem is based on the structural decomposition of the processes under study, the construction of a clear hierarchy of sub-objectives and their formalization, as well as the formation of an optimal list of target indicators [4].
The process of optimization of technological processes is based on big data analytics, which includes data collection, processing, and analysis based on developed methods and algorithms [5]. Modern digital technologies such as the Internet of Things, cloud computing, big data analytics, and artificial intelligence can significantly improve the efficiency of the production process [6].
Currently, models based on the graph method are widely used to solve process optimization problems [7]. These classes of models allow visualizing the structure of complex production processes and the interrelationships between their individual elements, which can significantly increase the efficiency of the optimization process [8,9]. In spite of this, the graph method cannot be applied to solve any class of problems. This method cannot be applied to those classes of problems that cannot be reduced to algorithms from graph theory. As a disadvantage of this method, we can note the need for high amounts of memory required to solve the problem, which increases in proportion to the number of vertices of the graph.
The ever-increasing complexity of production processes in terms of structural organization and multifactoriality of solved problems inevitably leads to a significant increase in the volume of analyzed data [10]. The introduction of Big Data technologies for optimization of production processes allows for a quick and clear structuring and analysis of large data sets, which helps to increase the efficiency of the multi-criteria optimization process [11,12]. The application of this technology requires significant system resources, which is a key limitation in the effectiveness of its application. The disadvantages of Big Data technology include problems related to privacy and security, data quality and reliability, high implementation and maintenance costs, and difficulties in data integration.
Multi-criteria optimization is a key factor in improving the efficiency of production processes at machine-building enterprises [13]. Such optimization methods as the method of hierarchy analysis [14,15] and the Pareto optimization method [16] are widely used in the development of optimization models.
The method of hierarchy analysis is a mathematical tool of system approach, developed by American mathematician Thomas L. Saaty, which belongs to the class of criterion methods and allows for effectively structuring a complex decision-making problem in the form of a hierarchy, comparing and performing a quantitative evaluation of alternative solutions [17]. This method of multi-criteria optimization is the basis of a number of optimization models of production processes [18,19,20,21,22,23]. The disadvantage of this method is the need to obtain a large amount of data from experts. As a limitation of this method, it can be noted that it is most suitable for those cases where the bulk of the data is based on the preferences of the decision maker in the process of selecting the best solution from a set of existing alternatives.
The essence of the Pareto method is that no indicator of the system can be improved without the deterioration of any other indicator [24]. The result of Pareto optimization is the formation of a Pareto front, which includes a set of optimal non-dominated solutions. The Pareto method is used to solve multi-criteria optimization problems of production processes [25,26,27,28,29]. One of the key classes of problems for a machine-building enterprise is the optimization of the manufacturing process of products on metalworking machines [30]. However, all these studies do not fully describe the choice of parametric optimization methods from the point of view of increasing the efficiency of forming processes. The procedure of forming individual components of a design. The disadvantages of this method can be attributed to the fact that it does not allow you to identify a single optimum solution [31]. This method allows for identifying a set of solutions that are not domain-related to each other, but surpass the lagging solutions in the search area [32].
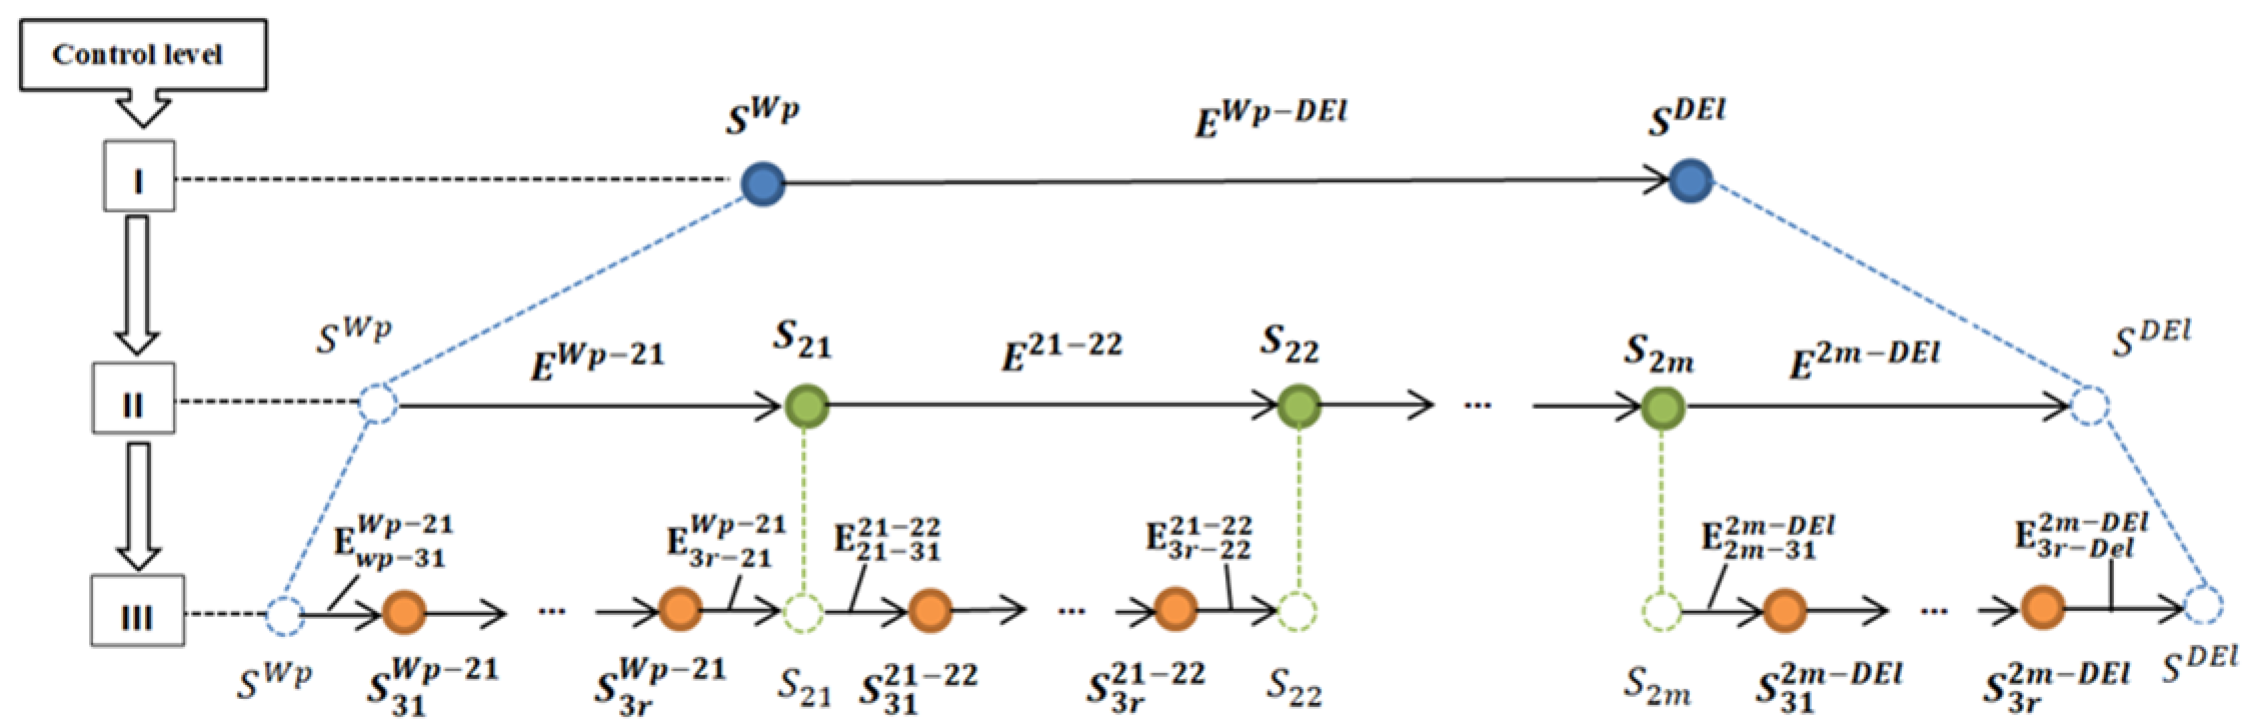
Thus, the purpose of the study is to increase the efficiency of the process of shaping individual design components using multi-criteria optimization methods. To achieve the goal of the study the following tasks are defined: structural analysis of the process of forming individual design elements, based on the decomposition of the process under study; formation of a structural hierarchical model of the process under study on the basis of the graph method; formation of a list of sub-objectives and their mathematical formalization; formation of the structure of vector optimization criterion for each level of control. The object of the study is the process of shaping a design element.
The novelty of the study lies in the development of a structural hierarchical model of the process of processing individual design elements of the product, based on the structural decomposition of the process under study. Allocation of method-levels, based on structural decomposition, allows for increasing the efficiency of management of the process under study due to in-depth analysis of its individual stages on the basis of the formed sets of target indicators and management strategies.

2. Structural Hierarchical Model of the Design Element Processing

The processing of a design element of a product is described by a clear sequence of actions that result in the formation of different states of the object under study, characterized by a set of parameters. The process of changing the structure and properties of the studied design element can be represented in the form of a structural hierarchical model of its shaping process (Figure 1), describing the intermediate states of the object at different levels of control. The presented hierarchical model is based on the structural decomposition of the design element forming process. Within the framework of the proposed model, three control levels describing the intermediate states of the object under study at the individual stages of the production process are defined:
  • Control level No. 1: technological processing route;
  • Control level No. 2: technological transition;
  • Control level No. 3: working stroke.
At the first control level, the object under study has two states (Figure 2): S W p —state of the design element before the molding process (workpiece), and S D E l —state of the design element after realization of the forming process.
At the second level of control, optimization of the parameters of technological transition is performed (Figure 3). Within the framework of this level of control, the change in the properties of the object under study can be described by a graph, the vertices of which characterize its intermediate states S 21 ,…, S 2 m , formed in the process of implementation of individual technological transitions. The branches of the graph E W p 21 ,…, E 2 m D E l characterize the conditions of transition of the control object from the state S 2 ( m 1 ) to the state S 2 m .
The task of the third control level is to optimize the parameters of the working stroke. Within the framework of the third control level, the object under study has r intermediate states S 31 2 m 1 2 m S 3 r 2 m 1 2 m (Figure 4).
The vertices of the graph S 31 2 m 1 2 m   S 3 r 2 m 1 2 m characterize the intermediate states of the control object after the implementation of the corresponding work moves.

3. Theoretical-Multiple Models of Structural Elements of the Surface Forming Process

The structure of the theoretical-multiple models of the r-th working stroke realized in the process of machining the q-th design element W S t q r D E l contains the following elements:
-
Parameters characterizing the type of the q-th design element ( T y p e D E l ) and the type of the processing method used in the process of realization of the r-th work stroke ( T y p e m a c h ).
-
Subsets of parameters characterizing the state of the q-th design element before and after the implementation of the r-th working stroke C o n D E l q r W S t / w p , C o n D E l q r W S t / p r respectively.
-
Subsets of target indicators characterizing the process of implementation of the r-th workflow T r D E l q r W S t nd control parameters of the corresponding process P M e n D E l q r W S t .
Thus, the theoretical-multiple model of the r-th working stroke, realized during the processing of the q-th design element, has the following form:
W S t q r D E l = { T y p e D E l , T y p e m a c h , C o n D E l q r W S t w p C o n D E l q r W S t w p ,
C o n D E l q r W S t / p r C o n D E l q r W S t / p r ,
P M e n D E l q r W S t P M e n D E l q r W S t , T r D E l q r W S t T r D E l q r W S t }
The states of the q-th design element before and after realization of the r-th working stroke are characterized by a set of geometrical parameters M G P r D E l / p r q r W S t and surface texture parameters M S T D E l / p r q r W S t . The selection of appropriate types of geometric parameters, surface texture parameters and accuracy parameters of the elements is based on conformity matrices ( V S T D E l ) q r W S t / p r , ( V T o l D E l ) q r W S t / p r , ( V T o l D E l ) q r W S t / p r .
The subset of target indicators characterizing the process of machining a design element within the r-th working stroke contains parameters describing the type of target indicator ( T y p e T r D E l ) q i and its numerical value ( V o l T r D E l ) q i .
The subset P M e n D E l q r W S t contains parameters characterizing the types of control parameters ( T y p e P M e n D E l ) q i , and the minimum and maximum values they can take ( V o l P M e n D E l ) q i m i n , ( V o l P M e n D E l ) q i m a x .
The selection of types of targets and management parameters is based on compliance matrices ( V P M e n D E l ) q r W S t , ( V T r D E l ) q r W S t .
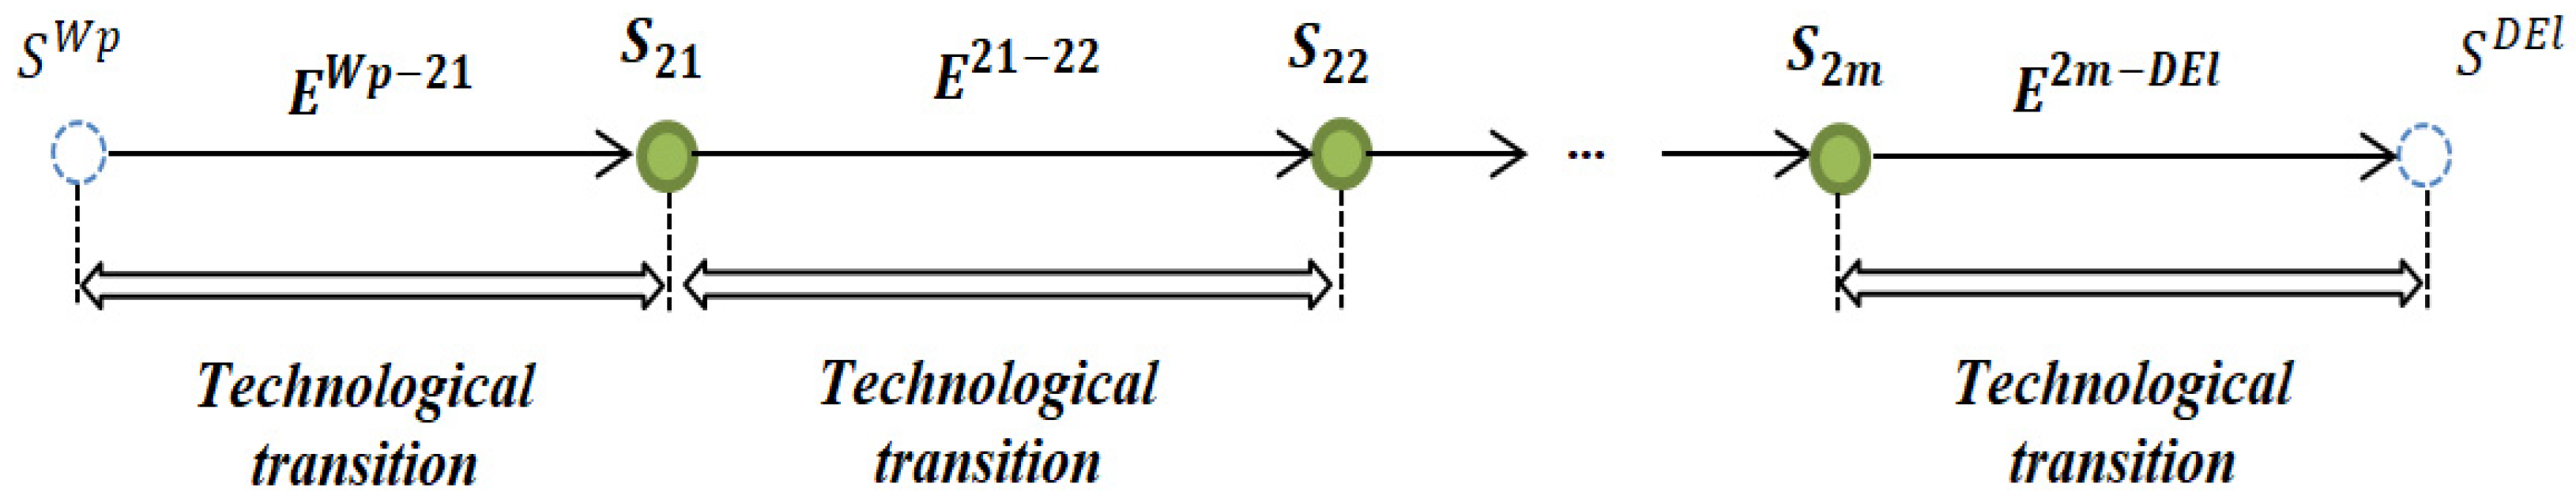
The structure of the theoretical-multiple model of the m-th technological transition realized in the process of machining the q-th design element T e c h T r q m D E l contains the following elements:
-
A subset of elements forming the structure of the m-th technological transition E l D E l q m T e c h T r and a matrix of parameters of correspondence of the r-th working stroke to the m-th technological transition V D E l q m T e c h T r .
-
A subset of states of the q-th design element in the process of realization of the m-th technological transition M c o n D E l q m T e c h T r .
-
Subsets of target indicators characterizing the process of realization of the m-th technological transition T r D E l q m T e c h T r and control parameters of the corresponding process P M e n D E l q m T e c h T r .
Thus, the theoretical-multiple model of the m-th technological transition realized in the process of processing the q-th design element has the following form:
T e c h T r q m D E l   = { E l D E l q m T e c h T r E l D E l q m T e c h T r ,   V D E l q m T e c h T r ,   M c o n D E l q m T e c h T r M c o n D E l q m T e c h T r , P M e n D E l q m T e c h T r P M e n D E l q m T e c h T r ,   T r D E l q m T e c h T r T r D E l q m T e c h T r }
The subset M c o n D E l q m T e c h T r contains parameters characterizing three types of states of the q-th design element: the state of the design element before and after the implementation of the m-th technological transition C o n D E l q m T e c h T r / w p , C o n D E l q m T e c h T r / p r respectively; intermediate states of the design element after the implementation of the working moves performed in the structure of the technological transition C o n D E l q m T e c h T r / I n t .
The structure of subsets of target indicators and control parameters is analogous to the corresponding subsets characterizing the process of implementation of the r-th work stroke.
The matrix of interrelation between the i-th previous working stroke and the j-th subsequent working stroke, realized in the process of execution of the m-th technological transition, has the form:
V D E l q m T e c h T r = ( v W S t D E l ) 11 ( v W S t D E l ) 21 ( v W S t D E l ) ( i 1 ) 1 ( v W S t D E l ) i 1 ( v W S t D E l ) 12 ( v W S t D E l ) 22 ( v W S t D E l ) ( i 1 ) 2 ( v W S t D E l ) i 2 ( v W S t D E l ) 1 ( j 1 ) ( v W S t D E l ) 2 ( j 1 ) ( v W S t D E l ) i 1 ( j 1 ) ( v W S t D E l ) i ( j 1 ) ( v W S t D E l ) 1 j ( v W S t D E l ) 2 j ( v W S t D E l ) i 1 j ( v W S t D E l ) i j
where ( v W S t D E l ) i j —parameter, characterizing the relationship between the i-th preceding working stroke and the j-th subsequent working stroke, realized in the process of m-th technological transition.
The parameter ( v W S t D E l ) i j [ 0 ; r 1 ] , ( v W S t D E l ) i j N , where r—number of working steps implemented in the structure of the m-th technological transition, pcs.
The value of the parameter ( v W S t D E l ) i j = 0 characterizes the absence of a relationship between the i-th and j-th elements in the process of implementing the m-th technological transition. The value of the parameter 1 ( v W S t D E l ) i j r 1 , characterizes the presence of a relationship between the i-th and j-th working steps and determines the ordinal number of their interaction in the process of implementing the m-th technological transition.
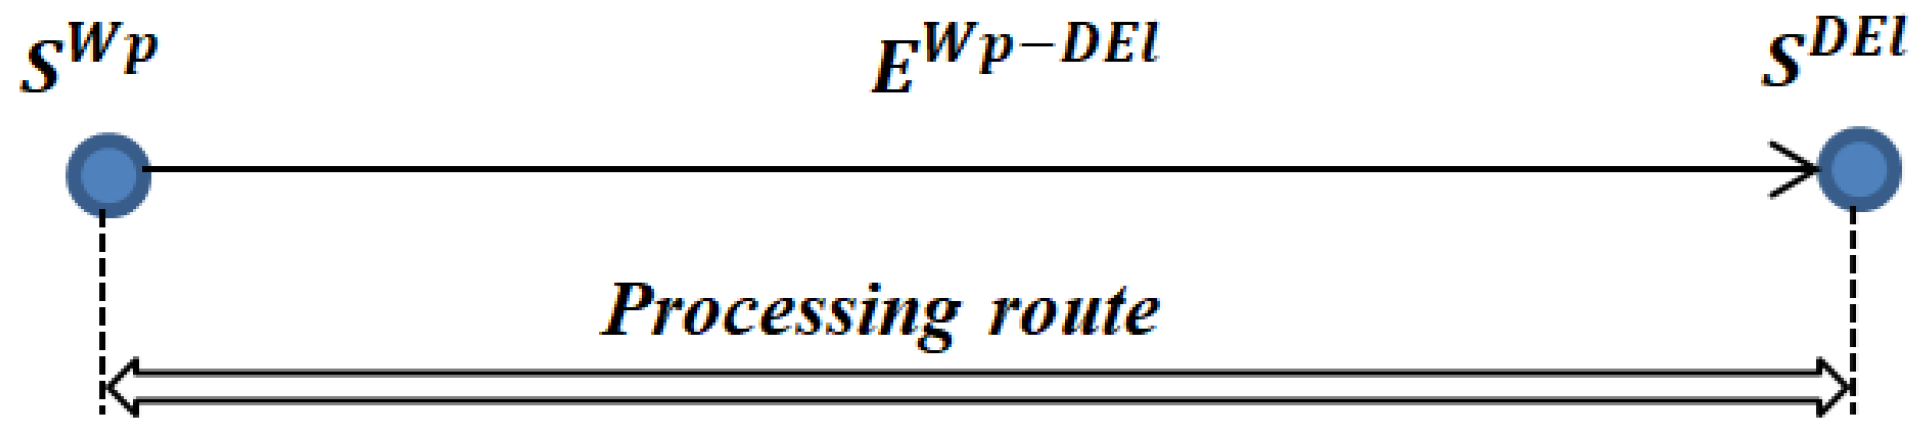
The structure of the theoretical-multiple model of the s-th technological processing route realized during the processing of the q-th design element, T P R q s D E l contains the following elements:
-
A subset of elements forming the structure of the s-th machining process route E l D E l q s T P R and a matrix of parameters of correspondence of the m-th process transition to the s-th machining process route V D E l q s T P R .
-
A subset of states of the q-th design element in the process of realization of the s-th technological processing route M c o n D E l q s T P R .
-
Subsets of target indicators characterizing the process of realization of the s-th technological processing route T r D E l q s T P R R and control parameters of the corresponding process P M e n D E l q s T P R .
Thus, the set-theoretic model of the s-th technological processing route, implemented in the process of processing the q-th design element, has the following form:
W S t q r D E l T P R q s D E l = { E l D E l q s T P R E l D E l q s T P R , V D E l q s T P R , M c o n D E l q s T P R M c o n D E l q s T P R , P M e n D E l q s T P R P M e n D E l q s T P R , T r D E l q s T P R T r D E l q s T P R }
The subset M c o n D E l q s T P R contains parameters characterizing three types of states of the q-th design element: the state of the design element before the implementation of the technological processing route (workpiece)—( C o n D E l q s T P R / w p ); the state of the design element after the implementation of the technological processing route— C o n D E l q s T P R / p r ; intermediate states of the design element after the implementation of the corresponding technological transitions performed in the structure of the technological processing route ( C o n c o n D E l ) q s T P R / I n t .
The structure of the subsets of target indicators and control parameters is similar to the corresponding subsets characterizing the process of implementing the r-th work step. The matrix of the relationship between the i-th preceding technological transition and the j-th subsequent technological transition, implemented within the framework of the s-th technological route of processing the q-th design element, has the form:
V D E l q s T P R = ( v T e c h T r D E l ) 11 ( v T e c h T r D E l ) 21 ( v T e c h T r D E l ) ( i 1 ) 1 ( v T e c h T r D E l ) i 1 ( v T e c h T r D E l ) 12 ( v T e c h T r D E l ) 22 ( v T e c h T r D E l ) ( i 1 ) 2 ( v T e c h T r D E l ) i 2 ( v T e c h T r D E l ) 1 ( j 1 ) ( v T e c h T r D E l ) 2 ( j 1 ) ( v T e c h T r D E l ) i 1 ( j 1 ) ( v T e c h T r D E l ) i ( j 1 ) ( v T e c h T r D E l ) 1 j ( v T e c h T r D E l ) 2 j ( v T e c h T r D E l ) i 1 j ( v T e c h T r D E l ) i j
where ( v T e c h T r D E l ) i j —a parameter characterizing the relationship between the i-th preceding technological transition and the j-th subsequent technological transition, implemented in the structure of the s-th technological route for processing the q-th design element.
The parameter ( v T e c h T r D E l ) i j [ 0 ; m 1 ] , ( v T e c h T r D E l ) i j N , where m—number of technological transitions in the structure of the s-th technological processing route, pcs. The value of the parameter ( v T e c h T r D E l ) i j = 0 characterizes the absence of a relationship between the i-th and j-th technological transitions performed in the structure of the s-th technological processing route.
The value of the parameter 1 v T e c h T r D E l i j m 1 , characterizes the presence of a relationship between the corresponding technological transitions and determines the ordinal number of their interaction in the structure of the s-th technological processing route.

4. Statement of the Problem of Controlling the Processing a Design Element

For the object under study, the control task is the structural and parametric optimization of the process of forming a design element based on the Pareto optimization method. Within the framework of the study, vector optimization criteria, a set of control parameters, and boundary conditions for the implementation of the model are determined for each control level.
For the first level of control, the following structure of the vector optimization criterion is defined:
F K E TMO = ( T T R P D E l q s a v   ( U T R P D E l ) ,   O P E X T R P D E l q s a v ( U T R P D E l ) , ( I q s D E l / G P r ) T R P ( U T R P D E l ) , ( I q s D E l / S T ) j T R P ( U T R P D E l ) )
where T T R P D E l q s a v —a target indicator characterizing the average value of labor intensity of the implementation of the main actions and auxiliary transitions performed within the framework of the s-th technological processing route in the process of forming the q-th design element, min.;
O P E X T R P D E l q s a v —a target indicator characterizing the average value of operating costs arising in the process of performing the main actions and auxiliary transitions implemented within the s-th technological route of processing in the process of forming the q-th design element, c.u.;
( I q s D E l / G P r ) T R P —a target indicator characterizing the level of accuracy of the execution of geometric parameters formed in the process of implementing the s-th technological route of processing the q-th design element;
( I q s D E l / S T ) j T R P —a target indicator characterizing the level of accuracy of the execution of the parameters of the surface texture of the q-th design element, formed in the process of implementing the s-th technological route of processing;
( U T R P D E l ) —a set of parameters for controlling the process of the technological route of processing the design element.
The set of control parameters ( U T R P D E l ) has the following structure:
U T R P D E l = { ( N q D E l ) T e c h T r ( N q D E l ) T r c h T r N ,   ( P r M q m D E l ) T e c h T r ( P r M q m D E l ) i T e c h T r ( M q D E l ) P r M }
where ( N q D E l ) T e c h T r —parameter characterizing the number of technological transitions in the structure of the technological route for processing the q-th design element, pcs.;
( P r M q m D E l ) T e c h T r —parameter characterizing the processing method applied within the m-th technological transition that forms the structure of the technological route for processing the q-th type of design element.
The following boundary conditions are established:
( T T R P D E l q s M A c / a v + T T R P D E l q s A x A c / a v ) ·   N z P r R T T R P D E l z q P r R / σ b a s
( O P E X T R P D E l q s M A c / a v + O P E X T P R D E l q s A x A c / a v ) · N z P r R O P E X T R P D E l z q P r R / b a s
( I T R P D E l / G P r ) q s 1
( I T R P D E l / S T ) q s 1
( E r r a v G P r ) m i T e c h T r I T m i G P r
( T y p e j C r O p t ) S T = 0 ( V o l q m S T ) j n o m ( V o l q m S T ) j c o l   0
( T y p e j C r O p t ) S T = 1 ( V o l q m S T ) j c o l ( V o l q m S T ) j n o m   0
( N q D E l ) m i n T e c h T r ( N q D E l ) T e c h T r ( N q D E l ) m a x T e c h T r ,     ( N q D E l ) T e c h T r N
where T T R P D E l q s M A c / a v —a parameter characterizing the average value of labor intensity of the implementation of the main actions performed during the formation of the q-th design element within the s-th technological processing route, min.;
T T R P D E l q s A x A c / a v —a parameter characterizing the average value of labor intensity of the implementation of auxiliary actions performed during the formation of the q-th design element within the s-th technological processing route, min.;
O P E X T R P D E l q s M A c / a v —a parameter characterizing the average value of operating costs arising in the process of implementing the main actions performed during the formation of the q-th design element within the s-th technological processing route, c.u.;
O P E X T P R D E l q s A x A c / a v —parameter characterizing the average value of operating costs arising in the process of implementing auxiliary actions performed during the formation of the q-th design element within the s-th technological processing route, c.u.;
( T y p e j C r O p t ) S T —parameter characterizing the type of optimization criterion applied for the j-th surface texture parameter;
( V o l q m S T ) j n o m —parameter characterizing the nominal value of the j-th parameter of the surface texture formed as a result of the implementation of the m-th technological transition;
( V o l q m S T ) j c o l —parameter characterizing the calculated value of the j-th parameter of the surface texture formed as a result of the implementation of the m-th technological transition;
T T R P D E l z q P r R / σ b a s —parameter characterizing the basic value of the labor intensity of the implementation of the technological route for processing the q-th design element that forms the structure of the z-th product, taking into account the production program, min;
O P E X T R P D E l z q P r R / b a s —parameter characterizing the basic value of operating costs arising in the process of implementing the technological route of processing the q-th design element that forms the structure of the z-th product, taking into account the release program, c.u.;
( N q D E l ) m a x T e c h T r , ( N q D E l ) m i n T e c h T r —the parameters characterizing the maximum and minimum number of technological transitions in the structure of the technological route of processing the q-th design element, respectively, pcs.;
( N q D E l ) T e c h T r —the parameter characterizing the number of technological transitions in the structure of the technological route of processing the q-th design element, respectively, pcs.
The formation of a set of non-dominant optimal Pareto solutions at the first level of control is carried out on the basis of the following criteria:
T T R P D E l q s a v = m = 1 ( N q n D E l ) N e c h T r ( T T R P D E l q s M A c / a v + T T R P D E l q s A x A c / a v ) m i n O P E X T R P D E l q s a v = O P E X T R P D E l / C T l q s a v + O P E X T R P D E l / w a g q s a v + O P E X T R P D E l / a m q s a v + O P E X T R P D E l / e l q s a v + O P E X T R P D E l / r e p q s a v m i n ( I q s D E l / G P r ) T R P   = i = 1 ( N q G P r ) D E l m = 1 ( N q s D E l ) T e c h T r ( ( E r r q m T e c h T r / G P r ) i a v ( I T q m G P r ) i · ( α q m D e l / G P r ) i ) m i n ( I q s D E l / S T ) T R P = j = 1 ( N q S T ) D E l m = 1 ( N q s D E l ) T e c h T r ( ( δ q m T S ) j · ( α q m D E l / T S ) j ) m a x
where O P E X T R P D E l / C T l q s a v —a parameter characterizing the average value of operating costs for the purchase of a cutting tool used in the process of implementing the s-th technological route for processing the q-th type of design element, c.u.;
O P E X T R P D E l / w a g q s a v —a parameter characterizing the average value of operating costs for paying wages to production workers implementing the main actions and auxiliary transitions performed within the framework of the s-th technological route for processing the q-th type of design element, c.u.;
O P E X T R P D E l / a m q s a v —a parameter characterizing the average value of operating costs for depreciation charges on metalworking equipment used in the process of implementing the main actions and auxiliary transitions performed within the framework of the s-th technological route for processing the q-th type of design element, c.u.;
O P E X T R P D E l / e l q s a v —a parameter characterizing the average value of operating costs for the payment of electricity required to implement the main actions and auxiliary transitions performed within the framework of the s-th technological route for processing the q-th type of design element, c.u.;
O P E X T R P D E l / r e p q s a v —a parameter characterizing the average value of operating costs for the repair and maintenance of metalworking equipment used in the process of implementing the main actions and auxiliary transitions performed within the framework of the s-th technological route for processing the q-th type of design element, c.u.;
( E r r q m T e c h T r / G P r ) i a v —a parameter characterizing the average value of the error in the execution of the i-th geometric parameter of the q-th design element formed in the process of implementing the m-th technological transition, µm;
( I T q m G P r ) i —a parameter characterizing the value of the tolerance field for the i-th geometric parameter of the q-th design element formed in the process of implementing the m-th technological transition, µm;
( α q m D e l / G P r ) i —a parameter characterizing the specific weight of the i-th geometric parameter of the q-th design element formed within the m-th technological transition.
For the second level of control, the following vector optimization criterion is defined:
F D E l T e c h T r = ( T T e c h T r D e l q m a v   ( U T e x h T r D E l ) ,   O P E X T e c h T r D E l q m a v ( U T e x h T r D E l ) , ( I T e c h T r D E l G P r ) q m ( U T e x h T r D E l ) , ( I T e c h P r D e l / S T ) q m ( U T e x h T r D E l ) )
where ( U T e x h T r D E l ) —a set of parameters for controlling the process of implementing a technological transition during the formation of a design element;
T T e c h T r D e l q m a v —target indicator characterizing the average value of labor intensity of implementing the main actions and auxiliary transitions in the process of performing the m-th technological transition performed in the process of forming the q-th design element, min.;
O P E X T e c h T r D E l q m a v —a target indicator characterizing the average value of operating costs arising in the process of implementing the main actions and auxiliary transitions performed within the framework of the m-th technological transition during the formation of the q-th design element;
( I T e c h T r D E l G P r ) q m —target indicator characterizing the level of precision in the execution of geometric parameters describing the configuration of the q-th design element after the implementation of the m-th technological transition;
( I T e c h P r D e l / S T ) q m —target indicator characterizing the level of accuracy of execution of the parameters of the surface texture of the q-th design element after the implementation of the m-th technological transition.
The set of control parameters ( U T e x h T r D E l ) has the following structure:
U T e c h T r D E l = { N q m D E l W S t N q m D E l W S t N ,   t q r D E l t q r D E l t q r D E l m i n ; t q r D E l m a x , s q r D E l a v s q r D E l a v s q r D E l a v m i n ; s q r D E l a v m a x ( v q r D E l ) a v ( v q r D E l ) a v   [ ( v q r D E l ) a v m i n ; ( ( v q r D E l ) a v ) m a x ] }
where N q m D E l W S t —a parameter characterizing the number of working strokes implemented in the structure of the m-th technological transition in the process of forming the q-th design element, pcs.;
t q r D E l —a parameter characterizing the value of the cutting depth within the r-th working element when processing a q-structural element, mm;
t q r K ϶ m i n , ( t q r K ϶ ) m a x —parameters characterizing the minimum and maximum values of cutting depths within the r-th working element during processing of the q-structural element, respectively, mm;
s q r D E l a v —parameters characterizing the minimum and maximum values of cutting depths within the r-th working element during processing of the q-structural element, respectively, mm;
s q r D E l a v m i n , s q r D E l a v m a x —parameters characterizing the minimum and maximum feed rates within the r-th worker during processing of the q-structural element, respectively, mm;
( v q r D E l ) a v —a parameter characterizing the average value of the cutting speed within the r-th working cycle during the processing of a q-structural element, mm/min;
( v q r D E l ) a v m i n , ( ( v q r D E l ) a v ) m a x —parameters characterizing the minimum and maximum values of the cutting speed within the r-th working when processing the q-design element, respectively, m/min.
For the second control, the following boundary conditions are defined:
m = 1 ( N q s D E l ) T e c h T r T T e c h T r D E l q m a v T T R P D E l q s a v
m = 1 ( N q s D E l ) T e c h T r O P E X T e c h T r D E l q m a v O P E X T R P D E l q s a v
( I T e c h T r D E l / G P r ) q m 1
( E r r q r G P r / W S t ) i a v ( I T q r G P r ) i
( N q m D E l ) m i n W S t ( N q m D E l ) W S t ( N q m D E l ) m a x W s t
( t q r D E l ) m i n t q r D E l ( t q r D E l ) m a x
For the second level of control, the following criteria for the formation of non-dominating optimal solutions according to Pareto are defined:
T T e c h T r D E l q m a v = ( T T e c h T r D E l ) q m M A c / a v + ( T M A c / a v D E l ) q m A x A c / a v m i n O P E X T e c h T r D E l q m a v =   O P E X T e c h T r D E l q m C T l + O P E X T e c h T r D E l q m a m + O P E X T e c h T r D E l q m w a g + O P E X T e c h T r D E l q m r e p + O P E X T e c h T r D E l q m e l m i n ( I T e c h T r D E l / G P r ) q m =   r = 1 ( N q m W S t ) D E l i = 1 ( N r i G P r ) W S t ( ( E r r q r G P r / W S t ) i a v ( I T q r G P r ) i · ( α q r G P r / T e c h T r ) i )   m i n ( I T e c h P r D e l / S T ) q m = j = 1 ( N q S T ) D E l m = 1 ( N q m D E l ) W S t ( ( δ q r T S ) j · ( α q r D E l / T S ) j ) m a x
where O P E X T e c h T r D E l q m C T l —parameter characterizing the amount of operating costs for the purchase of a cutting tool used to implement the m-th technological transition performed in the process of forming the q-th design element, c.u.;
O P E X T e c h T r D E l q m w a g —parameter characterizing the amount of operating costs for the wages of a production worker implementing the main actions and auxiliary transitions performed within the m-th technological transition during the formation of the q-th design element, c.u.;
O P E X T e c h T r D E l q m a m —parameter characterizing the amount of operating costs for depreciation charges on metalworking equipment used in the process of implementing the main actions and auxiliary transitions performed within the m-th technological transition during the formation of the q-th design element, y.e;
O P E X T e c h T r D E l q m e l —parameter characterizing the amount of operating costs for payment of electricity required for implementation of main actions and auxiliary transitions performed within the m-th technological transition during shaping of the q-th design element, c.u.;
O P E X T e c h T r D E l q m r e p —parameter characterizing the amount of operating costs for repair and maintenance of metalworking equipment used for implementation of main actions and auxiliary transitions performed within the m-th technological transition during shaping of the q-th design element, c.u.;
( E r r q r G P r / W S t ) i a v —parameter characterizing the average value of the error in execution of the i-th geometric parameter formed in the process of implementation of the r-th working stroke during shaping of the q-th design element, μm;
( I T q r G P r ) i —parameter characterizing the value of the tolerance field of the i-th geometric parameter describing the configuration of the q-th design element in the process of implementing the r-th working stroke, μm.;
( α q r G P r / T e c h T r ) i —parameter characterizing the specific weight of the i-th geometric parameter describing the configuration of the q-th design element formed within the r-th working stroke.
The process of implementing the working stroke is controlled on the basis of a vector optimization criterion, which has the following structure:
F D E l W S t = ( T W S t D E l q r M A c U W S t D E l ,   O P E X W S t D E l q r M A c U W S t D E l , ( I W S t D E l / G P r ) q r U W S t D E l )
where U W S t D E l —a set of parameters for controlling the process of implementing the working stroke;
T W S t D E l q r M A c —target indicator characterizing the amount of labor intensity of implementing the main actions in the process of performing the r-th working stroke during the formation of the q-th design element, min.;
O P E X W S t D E l q r M A c —target indicator characterizing the amount of operating costs arising in the process of performing the r-th working stroke, during the formation of the q-th design element, min.;
( I W S t D E l / G P r ) q r —target indicator characterizing the level of accuracy of execution of the parameters of the surface texture of the q-th design element, formed in the process of implementing the m-th technological transition.
The set of control parameters ( U W S t D E l ) has the following structure:
( U W S t D E l ) = { s q r D E l s q r D E l [ s q r D E l m i n ; ( s q r D E l ) m a x ] ,   v q r D E l v q r D E l [ v q r D E l m i n ; ( v q r D E l ) m a x ] }
where s q r D E l —parameter characterizing the feed rate within the r-th working cycle during processing of the q-design element, mm/rev;
v q r D E l —parameter characterizing the cutting speed within the r-th working cycle during processing of the q-design element, mm/min;
s q r D E l m i n , ( s q r D E l ) m a x —parameters characterizing the minimum and maximum feed rates within the r-th working cycle during processing of the q-design element, respectively, mm/rev;
v q r D E l m i n , ( v q r D E l ) m a x —parameters characterizing the minimum and maximum cutting speeds within the r-th working cycle during processing of the q-design element, respectively, mm/min.
For the third control, the following boundary conditions are defined:
r = 1 ( N q m D E l ) W S t T W S t D E l q r M A c ( T T e c h T r D E l ) q m M A c / a v
r = 1 ( N q m D E l ) W S t O P E X W S t D E l q r M A c O P E X T e c h T r D E l q m a v v f a s · ( L f a s D E l ) q m T e c h T r
( E r r q r G P r ) i c o l . I T r i G P r
( s q r D E l ) m i n s q r D E l ( s q r D E l ) m a x
( v q r D E l ) m i n v q r D E l ( v q r D E l ) m a x
The formation of non-dominant optimal Pareto solutions at the third level of management is carried out on the basis of the following criteria:
T P X D E l q r M A c = ( l q D E l ) · ( h q m D E l ) a v t q r D E l · s q r D E l · v q r D E l m i n O P E X W S t D E l q r M A c =     O P E X W S t D E l q r M A c / w a g + O P E X W S t D e l q r M A c / a m + O P E X W S t D e l q r M A c / e l + O P E X W S t D e l q r M A c / r e p m i n ( I W S t D E l / G P r ) q r   m i n
where O P E X W S t D E l q r M A c / w a g —parameter characterizing the amount of operating costs for the wages of a production worker implementing the r-th work step performed in the process of forming the q-th design element, c.г;
O P E X W S t D e l q r M A c / a m —parameter characterizing the amount of operating costs for depreciation charges on metalworking equipment used in the process of implementing the r-th work step performed in the process of forming the q-th design element, c.u.;
O P E X W S t D e l q r M A c / e l —a parameter characterizing the amount of operating costs for the payment of electricity required to implement the r-th working stroke performed in the process of forming the q-th design element, c.u.;
O P E X W S t D e l q r M A c / r e p —a parameter characterizing the amount of operating costs for the repair and maintenance of metalworking equipment used in the process of implementing the r-th working stroke performed during the formation of the q-th design element, c.u.

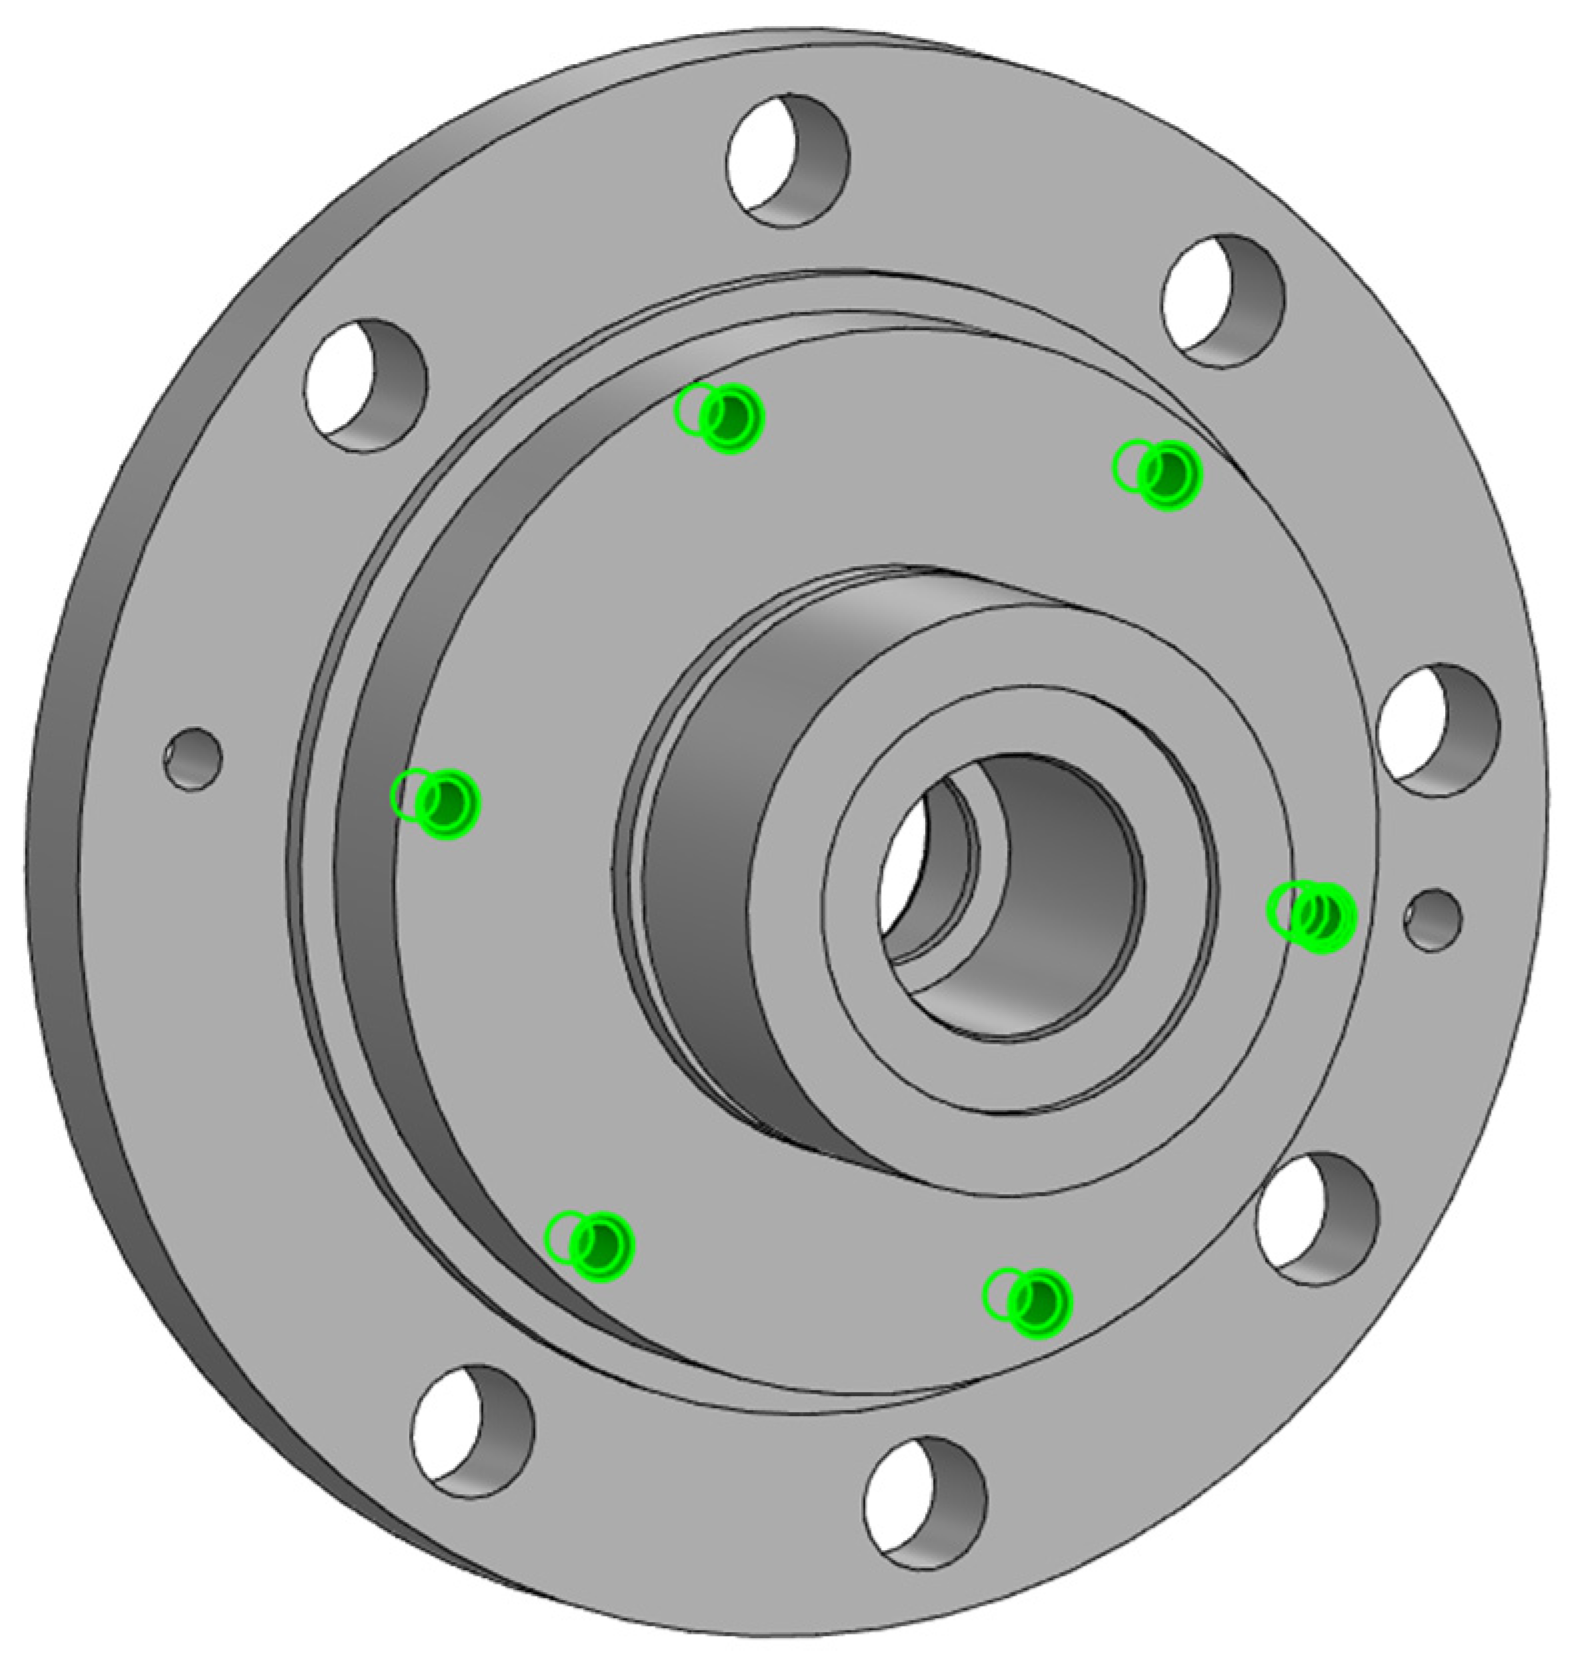
5. Optimization of the Process of Forming a Group of Threaded Holes

The study solved the problem of optimizing the process parameters of the forming process of a group of threaded holes M12 × 1.5-6H (6 pcs.) belonging to the “Flange” part (Figure 5), made of heat-resistant steel 14 × 17H2.
The graph of acceptable variants of technological routes for forming the studied group of holes is presented in Figure 6.
Within the framework of the current technological process, the studied group of threaded holes has the following parameters of the technological processing route:
N q D E l T e c h P r = 3 P r M q 1 D E l T e c h T r = Centering ,   P r M q 2 D E l T e c h T r = Drilling   8.6 ,   ( P r M q 3 D E l ) T e c h T r = Tapping
The current technological processing route is characterized by the following values of cutting parameters and target indicators:
( T T R P D E l ) q =   0.56 ;   ( O P E X T R P D E l ) q = 0.1 ;   ( I q D E l / G P r ) T R P = 0.126 ;   ( I q D E l / T S ) T M O   =   0.113 .
C e n t e r i n g :   v c e n t = 34 ;   s c e n t = 0.1
D r i l l i n g   8,6 :   v d r = 32 ;   s d r = 0.09
Tapping :   v t a p = 6 ;   s t a p = 1.5
The processing of a group of holes is carried out on a Biglia 1250 turning center.
For the studied group of threaded holes, the following optimization task was defined: reducing the labor intensity of the process of forming a group of threaded holes by 15%, while reducing the accuracy and surface quality by no more than 20%.
According to the graph of the process of forming the studied group of threaded holes (Figure 7), at the first level, the control parameters have the following ranges of values:
( N q D E l ) T e c h P r = { 2,3 }
( N q D E l ) T e c h P r = 2 ( P r M q 1 D E l ) T e c h T r = Three - flute   drilling ,  
( P r M q 2 K ϶ ) T e c h T r = { Tapping ,   T h r e a d   m i l l i n g }
( N q D E l ) T e c h P r = 3 ( P r M q 1 D E l ) T e c h T r = { C e n t e r i n g }
( P r M q 2 K ϶ ) T e c h T r = { D r i l l i n g   8.6 }
  ( P r M q 3 D E l ) T e c h T r = { Tapping ,   T h r e a d   m i l l i n g }
Within the first level of management, an optimization strategy has been defined: T T M O D E l q n a v   =   m i n .
Thus, in accordance with the graph presented in Figure 7, the optimal technological route for forming a group of threaded holes is the technological route TRP No. 3, characterized by the following parameters:
( F D E l T R P ) 3 = 0.46 ,   8.28 ,   0.152 ,   0.128
U T R P D E l 3 = { 2 ,   { T h r e e f l u t e   d r i l l i n g   ,   Tapping     } }
Within the second control level, the number of working strokes was determined, and the ranges of variation of the processing parameters were specified. For the selected technological route of forming the design element, the control parameter N q m D E l W S t has the following values: N q 1 D E l W S t = 1 , N q 2 D E l W S t = 1 . Within the second control level, the following optimization strategies were defined: T T e c h T r D E l q 1 c p = m i n , ( I T e c h T r D E l / G P r ) q m = m i n .
At the second level, the control parameters have the following valid values:
N q 1 D E l W S t = { 1 } ;   N q 2 D E l W S t = { 1 }
s q 1 D E l a v = 0.09 ,   0.095 ,   0.105 ,   0.11 , s q 2 D E l a v = { 1,5 }
v q 1 D E l a v = 36.5 ,   39.7,41.2,42.5 ,   v q 2 D E l a v = { 10,12,15,17 }
Thus, according to graph 8, the optimal cutting tool options for technological transitions 1 and 2 are Drill No. 2 and Tap No. 1, respectively (Figure 8). The following ranges of variation of cutting modes are established: s q 1 D E l [ 0.09 ; 0.13 ] v q 1 D E l [ 35 ; 50 ] ; s q 2 D E l = 1.5 ; v q 2 D E l [ 8 ; 12 ] .
Within the third control level, the values of cutting modes are set for working strokes implemented within the technological route of forming a design element. For the third control level, the following ranges of variation of cutting parameters are set:
N q 1 D E l W S t = 1 ;   N q 2 D E l S W t = { 1 }
s q 1 D E l = 0.09 ; 0.13 ,     s q 2 D E l = { 1,5 }
v q 1 D e l = 35 ; 50 ,     v q 2 D E l = [ 8 ; 12 ]
The following optimization strategies are defined:
-
technological transition №1: T W S t D E l q 1 M A c = m i n ;
-
technological transition №1: ( I W S t D E l / G P r ) q 2 = m i n .
According to the graphs presented in Figure 9 and Figure 10, the optimal points characterizing the process of implementing work steps are the states of the system with the following values of target indicators:
T W S t D E l q 1 M A c =   0.06 ;   O P E X W S t D E l q 1 O Д = 17.5 ;   ( I W S t D E l / G P r ) q 1 = 0.152 T W S t D E l q 2 M A c =   1.098 ;   O P E X W S t D E l q 2 M A c =   20.475 ;   ( I W S t D E l / G P r ) q 2 = 0.115 .
According to the selected optimization strategy, the following optimal cutting parameters were established: s q 1 D E l = 0.13 ; v q 1 D E l = 50; s q 2 D E l = 1.5; v q 2 D E l = 8.
The formation of a set of non-dominant Pareto-optimal solutions at each level of control was performed using a genetic algorithm based on the sequential selection, combination, and variation of initial parameters. As a result of analyzing the corresponding combinations of parameters, non-dominant sets of solutions that are Pareto-optimal were identified.

6. Conclusions

In the course of the research, a hierarchical model was developed for the optimization of process parameters for machining of individual design elements. For the corresponding elements of the investigated process (technological route of machining, technological transition, working stroke), parametrized models were developed characterizing the process of realization of the corresponding stages of machining.
The application of the developed model for optimizing structural elements was demonstrated using the example of optimizing the process of forming a group of threaded holes of the “Flange” part. In the course of the research, four variants of technological routes for machining a group of threaded holes, as well as technological equipment (cutting tools) used in the process of their machining, were analyzed. Based on the results of the optimization, the technological route for machining a group of holes and the cutting tool used were adjusted. Changing the conditions of implementation of the process of machining a group of threaded holes was performed on the basis of the analysis of the values of target indicators, forming vector optimization criteria for each level of control, as well as the established optimization strategies for each structural element of the process under study.
As a result of the optimization, the labor intensity of performing a group of threaded holes decreased by 18.3%, while the increase in the processing error was 12.1%, and the increase in the surface roughness parameter was 13.2%. The obtained results are satisfactory as they meet the optimization conditions, as a result of which we can conclude that the goal of the work has been fully achieved. The model for optimizing the parameters of the process of forming threaded holes presented in the work can be considered as a basic element of a complex model for optimizing the parameters of the technological process of manufacturing a product. This model can be used to optimize the parameters of the process of forming geometric elements of various types that form the structure of the product. This model can be applied to optimize the parameters of the machining process of design elements of various types that form the structure of the product.
The developed hierarchical model of the investigated process is based on the structural analysis of the processing of individual design elements of the product. According to the results of the analysis, the class of elements—working stroke, to which no further decomposition can be applied, is defined. In this regard, we can conclude that the structure of the proposed model and the number of control levels are optimal.
In the process of the study, a deep structural analysis of the process with the definition of the elements has been carried out.
The optimization model presented in the paper is a basic prototype in which the process optimization is performed based on the analysis of four groups of parameters: labor intensity, operational costs, accuracy of geometric parameters, and surface texture parameters. Within the framework of the described model, the issues of optimization of such groups of parameters as the accuracy of achieving tolerances of the shape of design elements, mutual arrangement of design elements, as well as parameters characterizing physical and mechanical properties of the element were not considered. Expanding the possibilities of application of the described optimization model is possible by increasing the number of groups of target parameters.

Author Contributions

Conceptualization, G.Z. and I.K.; methodology, V.S.; software, I.K. and A.K.; validation, V.S., M.K. and O.Z.; formal analysis, V.S. and A.K.; investigation, I.K.; resources, G.T. and I.K.; data curation, O.Z., G.T. and G.A.; writing—original draft preparation, I.K. and V.S.; writing—review and editing, G.Z., O.Z. and A.K.; visualization, M.K.; supervision, I.K.; project administration, G.Z.; funding acquisition, G.Z. All authors have read and agreed to the published version of the manuscript.

Funding

This research is funded by the Science Committee of the Ministry of Science and Higher Education of the Republic of Kazakhstan under grant AP23490796 “Development of digital models of the production process based on multi-criteria analysis of BigData management within the framework of technological preparation of production of mechanical engineering enterprises” (2024–2026).

Institutional Review Board Statement

Not applicable.

Informed Consent Statement

Not applicable.

Data Availability Statement

The original contributions presented in this study are included in the article. Further inquiries can be directed to the corresponding author.

Conflicts of Interest

The authors declare no conflicts of interest.

References

  1. Khrustaleva, I.N.; Lyubomudrov, S.A.; Larionova, T.A.; Brovkina, Y.Y. Increasing the efficiency of technological preparation for the production of the manufacture components equipment for the mineral resource complex. J. Min. Inst. 2021, 249, 417–426. [Google Scholar] [CrossRef]
  2. Zhetessova, G.; Nikonova, T.; Yurchenko, V.; Zharkevich, O. The development of the computer-aided design system for production process of component part maching for single-piece production and repair conditions. J. Appl. Eng. Sci. 2019, 17, 599–609. [Google Scholar] [CrossRef]
  3. Sahno, J.; Shevtshenko, E.; Zahharov, R. Framework for Continuous Improvement of Production and Product Throughput. Process. Procedia Eng. 2015, 100, 511–519. [Google Scholar]
  4. Khrustaleva, I.; Khrustalev, M.; Brovkina, Y.; Khokhlovskiy, V.; Shkodyrev, V. The Model for optimizing cutting parameters for processing products on metal-cutting machines. Cybern. Phys. 2024, 13, 111–122. [Google Scholar] [CrossRef]
  5. Li, X.; Liu, D.; Sun, J.; Zhu, Z. Challenges of Industrial Engineering in Big Data Environment and Its new Directions on Extension Intelligence. Procedia Comput. Sci. 2022, 214, 1561–1567. [Google Scholar] [CrossRef]
  6. Nguyen, H.D.; Tran, K.P.; Zeng, X.; Koehl, L.; Castagliola, P.; Bruniaux, P. Industrial Internet of Things, Big Data, and Artificial Intelligence in the Smart Factory: A survey and perspective. In Proceedings of the SSAT International Conference on Data Science in Business, Finance and Industry, Da Nang, Vietnam, 3–5 July 2019; pp. 1–6. Available online: https://www.researchgate.net/publication/333531793 (accessed on 5 January 2020).
  7. Li, L.; Yang, M.; Makanda, I.L.D.; Jiang, P. Meta-knowledge triple driven multi-modal knowledge graph construction method and application in production line control with Gantt charts. J. Manuf. Syst. 2025, 80, 224–242. [Google Scholar] [CrossRef]
  8. Hussong, M.; Ruediger-Flore, P.; Klar, M.; Kloft, M.; Aurich, J.C. Selection of manufacturing processes using graph neural networks. J. Manuf. Syst. 2025, 80, 176–193. [Google Scholar] [CrossRef]
  9. Celino, I.; Carriero, V.A.; Azzini, A.; Baroni, I.; Scrocca, M. Procedural knowledge management in Industry 5.0: Challenges and opportunities for knowledge graphs. J. Web Semant. 2025, 84, 100850. [Google Scholar] [CrossRef]
  10. Zhou, Y. Integrated development of industrial and regional economy using big data technology. Comput. Electr. Eng. 2023, 109 Pt A, 108764. [Google Scholar] [CrossRef]
  11. Yang, B. Research on Vehicle Detection and Recognition Technology Based on Artificial Intelligence. Microprocess. Microsyst. 2023, in press. [Google Scholar] [CrossRef]
  12. Cakir, A.; Akın, Ö.; Deniz, H.F. Enabling real-time big data solutions for manufacturing at scale. J. Big Data 2022, 9, 118. [Google Scholar] [CrossRef]
  13. Al-Majali, B.H.; Zobaa, A.F. Analyzing bi-objective optimization Pareto fronts using square shape slope index and NSGA-II: A multi-criteria decision-making approach. Expert Syst. Appl. 2025, 272, 26765. [Google Scholar] [CrossRef]
  14. Wu, H.; Cai, X.; Feng, M. Risk management of engineering projects installation using Analytic Hierarchy Process. Infrastruct. Asset Manag. 2024, 12, 57–69. [Google Scholar] [CrossRef]
  15. Jantassova, D.; Kozhanov, M.; Shebalina, O. Digital Platform as a Tool for Internationalization: Model for Formation of International Competences’ Database Applying of Hierarchy Analysis Method. J. Theor. Appl. Inf. Technol. 2021, 99, 4942–4957. [Google Scholar]
  16. Ponsi, F.; Bassoli, E.; Vincenzi, L. A multi-objective optimization approach for FE model updating based on a selection criterion of the preferred Pareto-optimal solution. Structures 2021, 33, 916–934. [Google Scholar] [CrossRef]
  17. Li, J.; Jing, S.; Cai, J.; Xu, H.; Sun, P.; Cao, Y.; Jiang, S.; Jia, S.; Lu, Z.; Li, G. A method for optimizing different geometric shields of D-T neutron generators by combining BP neural network and Analytic Hierarchy Process. Comput. Phys. Commun. 2025, 307, 109397. [Google Scholar] [CrossRef]
  18. Nelfiyanti, N.; Mohamed, N.; Rashid, M.F.F.A.; Ramadhan, A.I. Parameters of effects in decision making of automotive assembly line using the Analytical Hierarchy Process method. CIRP J. Manuf. Sci. Technol. 2022, 37, 370–377. [Google Scholar] [CrossRef]
  19. Zio, S.D.; Gordon, T.J. Exploring a method to reduce inconsistency in the group Analytic Hierarchy Process using the Delphi method and Nudge theory. Futures 2024, 161, 103413. [Google Scholar] [CrossRef]
  20. Guidi, G.; Goffo, G.; Violante, A.C. Application of the Analytic Hierarchy Process (AHP) method to identify the most suitable approach for managing irradiated graphite. Nucl. Eng. Technol. 2024, 56, 4820–4825. [Google Scholar] [CrossRef]
  21. Wątróbski, J.; Karczmarczyk, A.; Rymaszewski, S. Multi-criteria decision making approach to production line optimization. Procedia Comput. Sci. 2020, 176, 3820–3830. [Google Scholar] [CrossRef]
  22. Stoycheva, S.; Marchese, D.; Paul, C.; Padoan, S.; Juhmani, A.; Linkov, I. Multi-criteria decision analysis framework for sustainable manufacturing in automotive industry. J. Clean. Prod. 2018, 187, 257–272. [Google Scholar] [CrossRef]
  23. Zhetessova, G.S.; Zharkevich, O.M.; Shakhatova, A.T.; Khrustaleva, I.N.; Shkodyrev, V.P. Additive Optimization Method for Choosing CNC Machines for Technological Preparation of Machine-Building Production. Mater. Mech. Eng. Technol. 2024, 3, 32–37. [Google Scholar] [CrossRef]
  24. Oliveira, L.; Paiva, A.; Campos, P.; Paiva, E.; Balestrassi, P.P. Prediction capability of Pareto optimal solutions: A multi-criteria optimization strategy based on model capability ratios. Precis. Eng. 2019, 59, 185–210. [Google Scholar] [CrossRef]
  25. Hu, Y.; Qu, Y.; Li, W.; Huang, Y. A Pareto Front searching algorithm based on reinforcement learning for constrained multiobjective optimization. Inf. Sci. 2025, 705, 121985. [Google Scholar] [CrossRef]
  26. Sedak, M.; Rosić, M.; Rosić, B. Multi-Objective Hybrid Sailfish Optimization Algorithm for Planetary Gearbox and Mechanical Engineering Design Optimization Problems. CMES -Comput. Model. Eng. Sci. 2025, 142, 2111–2145. [Google Scholar] [CrossRef]
  27. Selvarajan, L.; Venkataramanan, K.; Nair, A.; Srinivasan, V.P. Simultaneous multi-response Jaya optimization and Pareto front visualization in EDM drilling of MoSi2-SiC composites. Expert Syst. Appl. 2023, 230, 120669. [Google Scholar] [CrossRef]
  28. Ravichandran, S.; Manoharan, P.; Sinha, D.K.; Jangir, P.; Abualigah, L.; Alghamdi, T.A.H. Multi-objective resistance-capacitance optimization algorithm: An effective multi-objective algorithm for engineering design problems. Heliyon 2024, 10, e35921. [Google Scholar] [CrossRef]
  29. Xu, J.; Chen, X.; Cao, W.; Wu, M. Multi-objective trajectory planning in the multiple strata drilling process: A bi-directional constrained co-evolutionary optimizer with Pareto front learning. Expert Syst. Appl. 2024, 238 Pt F, 122119. [Google Scholar] [CrossRef]
  30. Matisková, D.; Balog, M.; Husár, J. Criteria for the optimization of production processes in machining of metallic materials. Manag. Syst. Prod. Eng. 2018, 26, 227–230. [Google Scholar] [CrossRef]
  31. Yeung, D.; Zhang, Y. Bi-Objective Optimization: A Pareto Method with Analytical Solutions. Appl. Math. 2023, 14, 57–81. [Google Scholar] [CrossRef]
  32. Chengar, O.; Savkova, E.; Vladimirova, E.; Sapozhnikov, N. Pareto optimization using the method of ant colony. MATEC Web Conf. 2017, 129, 03013. [Google Scholar] [CrossRef]
Figure 1. Structural hierarchical model of the design element forming process.
Applsci 15 05395 g001
Figure 2. Graph of the design element shaping process at the first control level.
Applsci 15 05395 g002
Figure 3. Graph of the design element shaping process at the second control level.
Applsci 15 05395 g003
Figure 4. Graph of the design element forming process at the third control level.
Applsci 15 05395 g004
Figure 5. Solid model of the part “Flange”.
Applsci 15 05395 g005
Figure 6. Structural hierarchical model of the process of processing a group of holes M12 × 1,5-6H: SWp—state of the threaded hole before realization of the technological processing route (workpiece); SDEl—state of the threaded hole after realization of the technological processing route; S 21 , S 22 —state of the threaded hole after realization of the 1st—2-th technological transition; S 31 21 D E l , S 32 21 D E l , S 3 ( r 1 ) 21 D E l , S 3 r 21 D E l —state of the threaded hole after 1st…r—one working stroke.
Applsci 15 05395 g006
Figure 7. Graph of dependence of target indicators within the first level of management.
Applsci 15 05395 g007
Figure 8. Graphs of the dependence of target indicators within the second level of management: (a) drilling a hole with a three-flute drill; (b) cutting a thread with a tap.
Applsci 15 05395 g008
Figure 9. Graphs of the dependence of target indicators within the third level of management for the drilling process: red symbols—Pareto-optimal solutions; blue symbols—Solutions that are not Pareto-optimal.
Applsci 15 05395 g009
Figure 10. Graph of the dependence of target indicators within the third level of management for the process of tapping.
Applsci 15 05395 g010
Disclaimer/Publisher’s Note: The statements, opinions and data contained in all publications are solely those of the individual author(s) and contributor(s) and not of MDPI and/or the editor(s). MDPI and/or the editor(s) disclaim responsibility for any injury to people or property resulting from any ideas, methods, instructions or products referred to in the content.

