1. Introduction
With the rapid development of Internet technology, the cinema movie industry presents a vigorous development trend, and a huge amount of streaming movie resources continue to emerge and are widely spread around the world [
1]. Against such a background, the accurate prediction of key indicators such as the split box office of streaming movies is of vital significance for movie producers, distribution platforms, and related practitioners [
2].
In recent years, scholars have conducted research on movie box office prediction and provided some solutions. Li et al. [
3] combined Independent Component Analysis (ICA) and Least Squares Support Vector Machine (LSSVM) with the movie’s schedule, the Baidu index of Internet searches, and other indicators to create a hybrid model with a higher prediction accuracy; He et al. [
4] used the superposition method to create an index system with consumer characteristics, movie product characteristics, and digital environment characteristics by integrating distributed random tree forest, extreme random tree, and generalized linear models. Compared with the characteristics of a digital environment, this model has a stronger generalization ability in box office prediction from the perspective of fusion, and the accuracy rate is as high as 99.1%. Su et al. [
5] used multivariate linear regression and the back propagation (BP) neural network algorithm on IWOM quantities (such as the number of ratings, micro-drama reviews, and news) and discovered that although IWOM efficacy has a smaller impact, these quantities substantially enhance movie box office performance, and the predictive value is increased by 28.9% in comparison with the linear regression model. Similarly, Li et al. [
6] found that the critical values of both the happiness index and movie box office varied linearly with the increase in the degrees of freedom and showed nonlinear characteristics through the optimized hierarchical long-short-term memory (HI-LSTM) model, which provided rich information for the prediction model; the use of the generalized Hurst function and Rennie’s function enhanced the model’s ability to recognize complex data structures; and the model achieved an accuracy of 92.4% in predicting the box office. Fahoum et al. [
7] used the Weighted K nearest neighbor (K-Nearest Neighbors, KNN) algorithm to study the market potential prediction of sci-fi movies. The results showed that the number of audience votes, the movie’s running time, and the Internet Movie Database (IMDB) ratings all significantly positively correlated with box office performance, and the model’s accuracy reached 93%.
The results of the experiment demonstrate that even though previous research has produced certain results, the following shortcomings persist: (1) in terms of feature extraction, the combined effects of holidays, platform exclusivity, and other factors relating to movie characteristics and time series have not been fully considered, resulting in an imperfect feature system; (2) in terms of data processing, some models do not use effective data expansion strategies, so their means of generalization ability is weak, and it is difficult to cope with the complex market environment; (3) in terms of information focusing, most models are unable to filter key information dynamically and are easily disrupted by irrelevant information, which reduces their prediction accuracy.
In summary, the traditional movie prediction model suffers from the insufficient consideration of features and is susceptible to the interference of irrelevant information, which leads to low prediction accuracy. A movie prediction algorithm based on multidimensional feature fusion with enhanced attention network is proposed. First, the internal correlation of movie data is mined using bi-directional long-term and short-term memory networks to improve the extraction of movie features, and then the attention mechanism module is used to mine the key information of different periods and genres of movies, giving different degrees of importance. Finally, the feature information of the movie is evaluated from four perspectives, and these features are combined to output the prediction results of the streaming movie breakdown box office and other key indicators, which solves the problem of the insufficient coupling of complex features in traditional methods and improves the prediction results of the model. The model outperforms other popular models in many evaluation metrics, which can provide a solid foundation for decision making in streaming movie operation, promotion and other matters.
The main contributions of this paper are summarized as follows:
- (1)
Design a feature fusion mechanism to innovatively integrate the film’s own influence factor, time series dynamic factor, platform operation, and other features to solve the limitation of single-dimension features in movie prediction, and deeply combine with long-short-term memory (LSTM) to construct the time series feature interaction space, so as to build a comprehensive database for online movie heat rating prediction, and make the prediction comprehensive and comprehensive, with information from many aspects. This can effectively solve the problem of the insufficient coupling of complex features in traditional methods.
- (2)
Aiming at the time sensitivity and genre variability of movies, the attention mechanism is designed to dynamically adjust the weight allocation of LSTM hidden state and static features, dynamically assign different importance to LSTM output and each feature, capture key information, eliminate irrelevant interference, and strongly improve the prediction accuracy.
- (3)
Data flipping and scaling operations are used to expand data scale and enrich diversity, enhance the model’s ability to understand and grasp the changes in data structure and magnitude, and strengthen the generalization performance, so as to successfully solve the overfitting problem caused by data sparsity in the field of online movies, in order to adapt to the complexity and variability of the online movie market.
The rest of this paper is structured as follows.
Section 2 states the relevant work of time prediction models.
Section 3 provides a detailed description of the proposed FFLSTMEA model, as well as the multi-dimensional feature fusion and enhanced attention network movie prediction algorithm.
Section 4 presents and analyzes the experimental results.
Section 5 summarizes all the work and provides an outlook for future work.
2. Related Work
The history of research in time prediction modeling is one of continuous evolution and gradual transition from traditional statistical methods to modern deep learning techniques. The increasing need for complicated time series data processing in data science is reflected in this evolution process. Initially, statistical techniques like autoregressive (AR) models, moving average (MA) models, and autoregressive moving averages (ARMAs) were the primary means of time series prediction. However, the simple statistical model has some limitations in the process of time prediction [
8], so in order to overcome these limitations, ARIMA [
9] was introduced into time series forecasting. And with the advent of the big data era, the rapid development of deep learning has brought a brand new breakthrough in temporal prediction modeling. The recurrent neural network (RNN) model and its variant, LSTM, successfully capture the complex long-term dependencies in sequential data by virtue of their built-in recurrent structure and gating units. Based on the LSTM network model, Wang et al. [
10] modified the starting weights and thresholds to increase the economic forecasting effect of the LSTM model, which was used to predict economic indicators. Han et al. [
11] corrected the commonly employed LSTM in time series under the consideration of multivariate scenarios and selected the stock prices for forecasting. Wang et al. [
12] employed STL decomposition to characterize the iron ore futures price, and then designed a convolutional neural network (CNN)-LSTM model combined with self-attention in order to predict iron ore futures prices, before finally performing comparative experiments. Xu et al. [
13] utilized the Massively Parallel Long Short-Term Memory (MHPLSTM) model in an emotion recognition task and merged the outputs of the MHPLSTM model through a splicing layer to further improve the translation quality. In the processing of small-sample data, Duan et al. [
14] improved the network topology, used Euclidean Paradigm (Second Norm, L2) regularization to enhance small-sample models’ adaptation capacity, and improved the robustness of the model to noise by reducing the model’s sensitivity to noise.
With the advancement of technology, neural networks and other advanced technologies have been introduced into movie-related research. Yu et al. [
15] created a neural network-related model with a multi-feature attention mechanism by mining and integrating various features related to movies. Then, with the help of attention systems, different weights can be assigned to different features to improve the ability to capture user personalized preferences and generate more accurate movie customization recommendation services that are consistent with user interests. In a multimodal sentiment analysis, Qi et al. [
16] aimed to extract features from different modal data, using the attention mechanism to achieve data enhancement and the reorganization and fusion of the extracted features, so that the fused features could better reflect the emotional information in the data, thus improving the accuracy and effectiveness of multimodal sentiment analysis. By focusing on the visual modality of movie posters, Xia et al. [
17] focused on feature fusion through the multimodal Transformer, added the attention mechanism to the poster features in the fusion process, efficiently integrated more modal information with the poster’s visual content to give the movie recommendation algorithm deeper and more useful feature inputs, and ultimately realized a more reasonable and accurate movie recommendation. Zhang et al. [
18] used the neural network model’s potent nonlinear fitting capability to model and analyze the various elements influencing a movie’s box office performance. He also mined audience sentiments and other movie-related data and combined them to create a box office prediction model that should more accurately forecast a movie’s box office performance. Pardo-Sixtos et al. [
19] used a hierarchical attention mechanism (HAM), which may serve as the foundation for a movie recommendation system, to forecast a movie’s performance from the viewpoint of the viewer. An HAM, which can capture the importance of movie-related features from different levels, and the Transformer architecture, which helps to handle long sequential data, etc., were combined to build a model to achieve an automatic and reasonable rating for movies, which assists the user to better understand the quality level of the movie. Thao et al. [
20] adopted a multimodal fusion approach to integrate data from different modalities (such as video, audio, and other movie-related data modalities), and at the same time, applied the self-attention mechanism in the fusion process to highlight the key information related to the audience’s emotion in each modality, and predict the emotional state of moviegoers. Madongo et al. [
21] employed recurrent neural networks to conduct the deep feature mining of movie trailers, and due to the fact that recurrent neural networks are good at dealing with sequential data, they are able to capture the time-series features in these kind of video data, which can help users better understand the quality level of the trailers. Because recurrent neural networks are good at processing sequence data, they can effectively capture the time series features in video data such as trailers, and to successfully forecast the movie’s ultimate box office income, build the related box office revenue prediction model using the in-depth characteristics that were mined.
Furthermore, throughout the past two years, a few sophisticated models have been put forth: By eliminating the trend component and utilizing the attention mechanism, TDformer increases the precision and effectiveness of time series forecasting [
22]; By employing a multi-scale pyramid structure to capture the intricacy of the data, SageFormer enhances multi-variate time series forecasting [
23]. SageFormer emphasizes temporal correlation, which is particularly suited for the task of long-term multivariate forecasting [
24]; Crossformer provides more accurate forecasts by using cross-dimensional dependencies to capture the intrinsic relationship of the data [
25].
Time prediction models have evolved from traditional statistical methods to deep learning techniques, and deep learning RNNs and their variants have been applied in multiple fields and explored in small-sample processing. In movie-related research, neural networks are employed in personalized recommendation, multimodal analysis, box office prediction, etc. However, there are problems such as insufficient feature integration, inaccurate focusing of information, and data processing limitations in the task of streaming movie prediction. In this paper, the FFLSTMEA model is enriched by multi-dimensional feature fusion and an attention mechanism to accurately focus the key information, and data flipping and scaling are employed to expand the rich data, compared with CNN, LSTM, BiLSTM, GRU, Transformer, CNN-Transformer, TDformer, MTPNet, SageFormer, Crossformer, and other models in the short-term prediction of the key indicators of streaming movies in terms of accuracy and stability, thus providing a more reliable basis for the decision making in the operation and promotion of streaming movies to compensate for the shortcomings despite the existing advantages.
3. FFLSTMEA
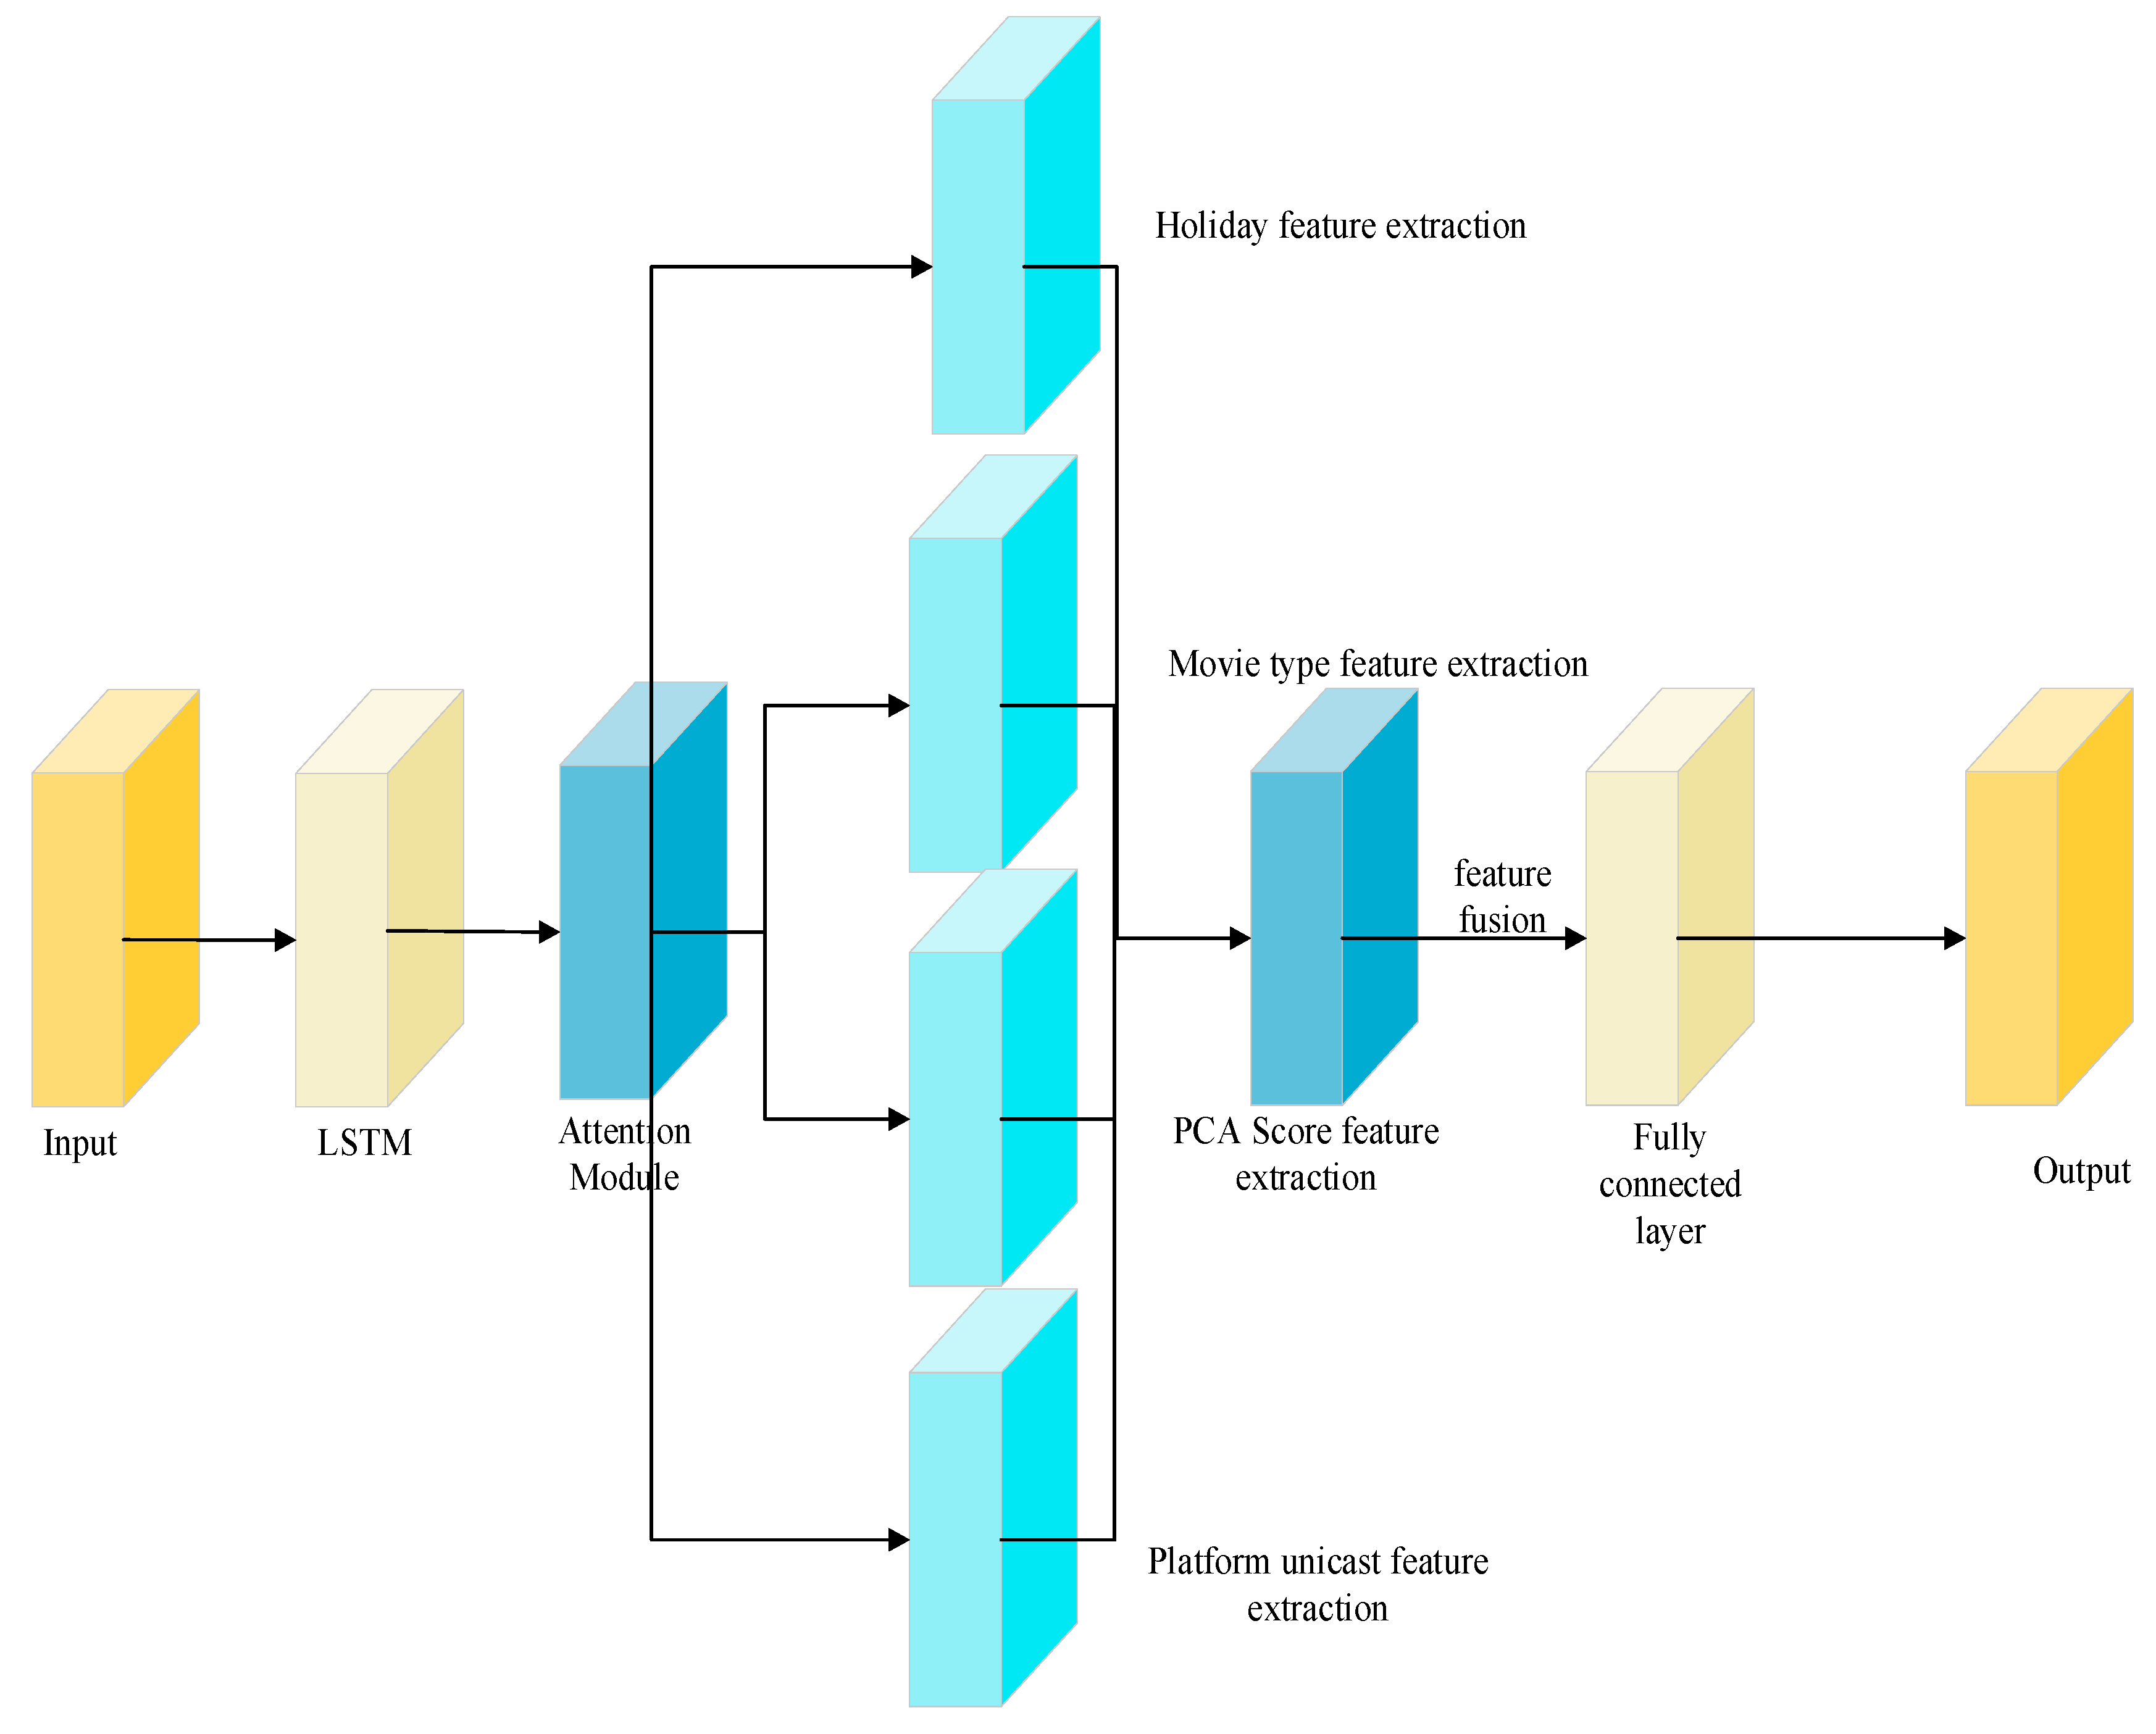
A multi-dimensional feature fusion and enhanced attention stream movie prediction algorithm is proposed, and the FFLSTMEA model graph is constructed, as illustrated in
Figure 1, to address the issues of numerous influencing factors, complex data features, and limited data in the streaming movie prediction task. The workflow is as follows: firstly, the two-way long-term and short-term memory network is used to mine the internal correlation of movie data, and then the attention mechanism module is used to mine the key information of different periods and types of movies, giving different degrees of importance. Then, the movie’s feature information is then assessed from four perspectives, including whether to broadcast the movie alone on the platform, principle component analysis (PCA) time series reduction in dimension scoring, holiday feature extraction, type feature extraction, and other multi-dimensional data. Finally, the features are combined to output the prediction results of key indicators such as the Sub Ledger box office of streaming movies. The model outperforms other popular models for a number of indicators of assessment, which can serve as a solid foundation for decisions about streaming movie operations, promotion, and other matters.
3.1. Data Preprocessing
The data are preprocessed to increase the prediction accuracy of the data. The quality of the data have a significant impact on the model’s efficacy, and problems such as dimension, missing values, and noise directly affect how well the subsequent model performs. The main task is to thoroughly detect the original data and find, fix, or remove any anomalous data records in order to guarantee the model’s efficient application. In this study, the data preprocessing process includes key steps such as dimensionless processing, the reasonable elimination of missing values, and the appropriate conversion of discrete features.
3.1.1. Dimensionless Data
Dimensionless: a data processing technique aimed at standardizing data with different units of measurement or scales to the same scale or adjusting them to a specific probability distribution pattern such as Equation (1). This method successfully reduces the detrimental influence of extreme eigenvalues on model correctness while simultaneously greatly increasing modeling efficiency. Due to the high degree of noise in the sample data, this study scales the data using a standardized method that is less vulnerable to outliers in order to guarantee data quality.
The above formula is to centralize by and scale by , that is, to obtain the sequence . Where is the sequence to be converted, and and are the mean and standard deviation, respectively.
3.1.2. Missing Data Processing
Missing fields are common in raw data obtained during actual business operations. If a particular value is hastily chosen to fill in such missing values based on the type and meaning of the feature, the final estimation result may be biased. Consequently, when the volume of data is sufficiently large, removing records with missing fields can guarantee the accuracy and dependability of the analytical results.
3.2. LSTM
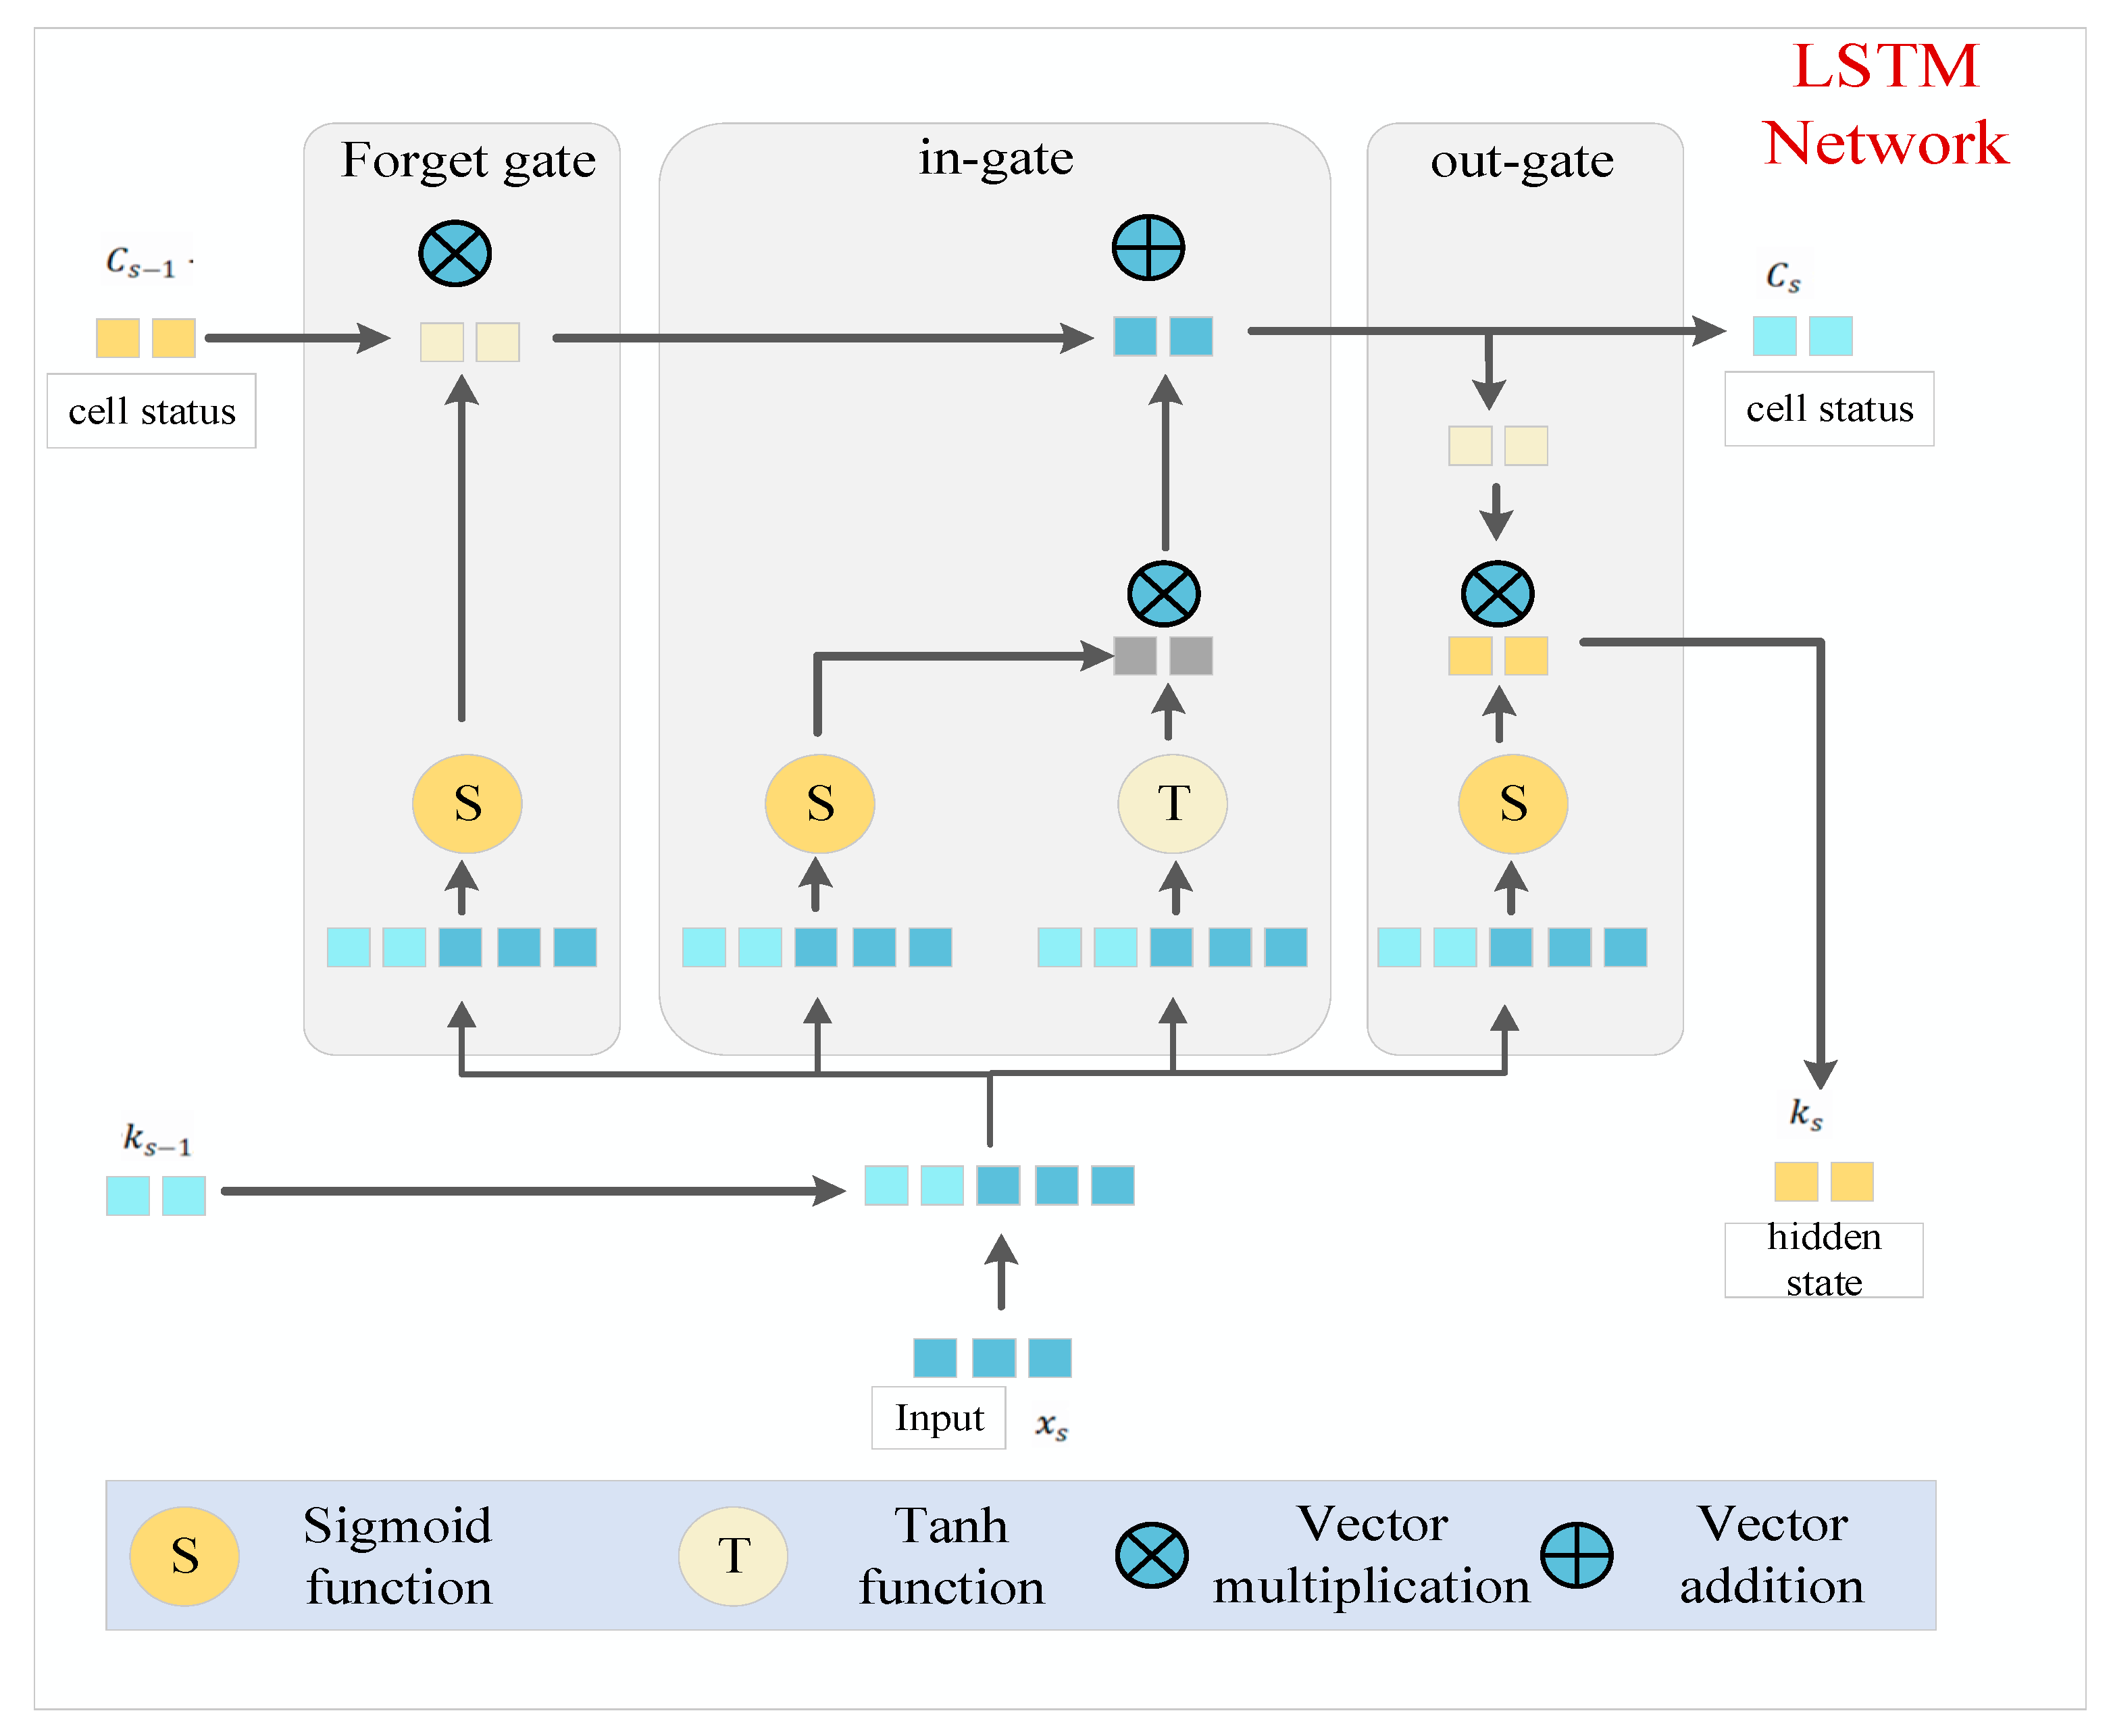
The LSTM network model is a special form of an RNN, which integrates memory units and gating mechanisms to cope with the problem of gradient disappearance and gradient explosion encountered by traditional RNNs when dealing with long sequences of data. The schematic structure of the LSTM model is illustrated in
Figure 2 below.
The core of the LSTM model, i.e., the cell state, is labeled with the letter C in the diagram. This state runs throughout the time series and is responsible for storing and transferring information. The cell state is updated at each time step to capture and preserve the long-term dependencies within the sequence. Memory cell states are represented by at the previous time step and at the current time step. Information flow is controlled by the LSTM model’s gating mechanism. The three gates that comprise an LSTM cell are the input, forget, and output gates. To ascertain the degree of information flow, all three gates employ a sigmoid activation function, whose output spans from 0 to 1, signifying the proportion of information that passes through.
Input Gate: accountable for controlling the entry of fresh data into the memory cell. This gate determines which data should be stored in the memory cell based on the current input and the hidden state of the previous instant.
Forgetting gate: responsible for determining whether the information in the memory unit of the previous moment should be continuously retained to the memory unit of the current moment. Through the processing of the forgetting gate, LSTM can selectively discard unimportant past information.
Output gate: decides if the data in the memory cell at that precise time are transferred to the concealed state. This gate generates the present moment’s output based on the present input value, the state of the memory cell, and the concealed state of the previous moment.
Memory unit: in charge of storing the intrinsic states of neurons as the central part of LSTM. Long-term dependencies in the sequence data can be captured and maintained by LSTM thanks to its ability to save, read, reset, and update the long-history data.
At moment t, the LSTM neural network [
26] is defined by Equation (2) as follows:
where sigmoid and tanh are the activation functions of the two neural networks, respectively, and
stands for the recursive connection weights of their respective thresholds.
3.3. Feature Fusion
Feature fusion in streaming movie prediction improves the model performance by integrating multidimensional features based on the effective integration and synergistic utilization of different feature information.
For holiday features, let the holiday feature vector be , where denotes the feature value related to the ith holiday (e.g., type of holiday, association with weekend, etc.), which reflects the influence of the time periodicity law on the movie’s box office, and its relationship with the box office can be determined by a specific time function or statistical analysis. The vector of factors influencing the movie’s own characteristics is set as , where can be the quantitative value of the subject matter, cast, and other factors (e.g., obtained by scoring the popularity of the actors, the subject matter heat rating, etc.), which accurately depict the possible impact of the movie’s inherent merit on viewers.
In order to extract the principal components of the historical split box office data of the movie data and analyze them, the data are processed by a dimensionality reduction analysis using PCA, and the PCA time series dimensionality reduction scoring is set to P. Using the comprehensive eigenvalues obtained from the principal component analysis of the original time series data, the calculation process can be expressed as follows: set the matrix of the original movie data to be ( dimensions, is the number of samples, and is the number of eigencounts); firstly, compute the covariance matrix of the movie data, and then solve to obtain the eigenvalues and eigenvectors of these data; according to the size of the eigenvalues, the main eigenvectors are selected to represent the main features of the movie data; and finally, form the projection matrix , and then .
Whether the platform-exclusive broadcast feature is set as 1 or 0 (1 for exclusive broadcast, 0 for non-exclusive broadcast), this feature directly affects the distribution channel and exposure of the movie. When combining these features with LSTM, in the model, LSTM learns the sequence of historical split box office data, and L (the feature representation associated with split box office acquired during a sequence of time-step hidden state processing) is set as the LSTM’s output.
In the process of feature fusion, each feature is first linearly transformed to fit the fusion dimension; e.g., the holiday feature is transformed to by the linear layer , the movie’s own characteristic influence factor is transformed to by , the PCA time series downscaling score is transformed to by , and the whether-platform-only feature is transformed to .
Then, feature fusion is performed and the fused feature vector is as follows:
Finally, the completely connected layer maps the fused features to the expected output, so that the predicted value .
Through such a feature fusion approach, the model is able to deeply excavate the intrinsic correlation relationship between different features, so as to improve the prediction accuracy and generalization ability, in order to better cope with the task of predicting key indicators such as streaming movie split box office, and to provide powerful support for relevant decision making.
3.4. Attention Mechanism
The theoretical principle of the attention mechanism in streaming movie prediction model is mainly to focus on key information and improve the model performance by assigning different weights to different features and time series information.
The model’s LSTM output sequence is , where represents the hidden state of dimension at time step .
First, this model uses as an input to calculate the attention distribution for the production of Query, Key, and Value in the attention mechanism. A query vector : is generated by a linear layer (dimension ).
Similarly, the key vector : is generated by a linear layer (dimension ).
And the value vector : is generated by the linear layer (dimension is ).
Then, attention scores are calculated using Scaled Dot-Product Attention. The attention score
is calculated as follows:
where
denotes the matrix multiplication of the transpose of the query vector
and the key vector
, and
is a scaling factor used to prevent the gradient from disappearing or exploding due to too large an attention score.
Next, the attention scores are then standardized using the softmax algorithm to obtain attention weights:
Finally, the attended output
is then obtained by weighting and adding the value vector
in accordance with the attention weights:
In this streaming movie prediction model, in addition to applying the attention mechanism to the LSTM output, other features (e.g., the holiday feature is transformed to by the linear layer , the movie’s own characteristic influence factor is transformed to by , the PCA time series downscaling score is transformed to by , and the whether-platform-only feature is transformed into by .
Then, feature fusion is performed, and the fused feature vector is:
Finally, the completely connected layer maps the fused features to the expected output, so that the predicted value .
The adaptive weighting architecture enables the context-sensitive modulation of temporal and cross-feature dependencies across input dimensions, effectively prioritizing critical temporal patterns through learned relevance scoring. This design addresses the dynamic nature of streaming movie performance metrics by establishing responsive information filters that evolve with input variations, thereby enhancing predictive precision and robustness in modeling evolving revenue distribution patterns.
3.5. Data Enhancement
Streaming movie data are often relatively limited and have certain limitations, so data enhancement can effectively expand the data scale and enrich the diversity of data.
Data flipping: Let the original box office data sequence be , and the data flipping operation is to invert the sequence to obtain the flipped data sequence . Mathematically, this is equivalent to performing a reversal operation on the sequence index; i.e., , where . In this way, the model can learn the feature performance of the data in a different order; for the split box office data sequence, the forward and reverse sequences may contain different trend information; for example, the upward trend shows different patterns in the forward and reverse sequences, which helps the model to better understand the symmetric and asymmetric features of the data, and improves the ability of grasping the overall structure of the data. In the process of data enhancement, for each set of original data x and its corresponding label y (e.g., subsequent box office data), a set of flipped data and flipped label (also flipped for subsequent box office data) are generated and added to the training dataset, so as to expand the data scale and enrich the diversity of data.
Data scaling: Let the original split box office data sequence be , and the data scaling operation introduces a scaling factor (randomly generated in the given range ), where the scaled data sequence . Mathematically, it is represented as , where . This operation simulates the changes in movie split box office under different magnitudes, even though the fluctuation range of movie split box office in the original dataset is limited; after scaled enhancement, the model is able to reach out to a wider range of scenarios of changes in the split box office, and enhances the adaptability and sensitivity to the changes in the data magnitude. In data enhancement, for each set of original data and its label , a set of scaled data and corresponding scaled label (i.e., ) are generated and added to the training set, which can successfully increase the size and variety of the training data, lessen the model’s undue reliance on a particular data distribution, and enhance the model’s capacity for generalization, so as to make the model more adaptive and sensitive to the changes in data magnitude. In the face of complex and changing streaming movie market data, the model can more robustly and accurately predict the relevant indicators of the movie, and provide a more reliable basis and support for movie operation, promotion, and other decisions.
In summary, the two data enhancement strategies, data flipping and data scaling, transform the original data from different perspectives, enrich the feature information and distribution of the data, and enhance the model’s capacity for training and adaption to better handle the difficulties posed by data constraints and the intricacy of the streaming movie prediction assignment.
4. Results
4.1. Introduction to the Dataset
At present, domestic and foreign movie streaming services mainly adopt the parallel distribution modes of Subscription Video-on-Demand (SVOD) and Transactional Video-on-Demand (TVOD) [
27]. Because there are relatively more movies adopting the former as a distribution model, this paper mainly analyzes streaming movies adopting the SVOD distribution model. The data for this study come from the iQIYI streaming movie list applet (
https://piaofang.maoyan.com/dashboard/web-heat, accessed on 20 February 2024), which collects data on streaming movies released on the iQIYI platform between January 2020 and December 2023 using the SVOD distribution mode. Web movies with missing data due to the settings of this platform were deleted and processed and not considered to be placed in the scope of subsequent analysis. Afterwards, continuous variables such as streaming movie data were standardized, and five variables including the split box office details of streaming movies released for fourteen days, whether they were released during the holidays, and the types of movies were considered, combining a total of 55 dynamic and static characteristics before and after the release of streaming movies, of which the main features are shown in the following
Table 1.
4.1.1. Box Office Revenue Life Cycle
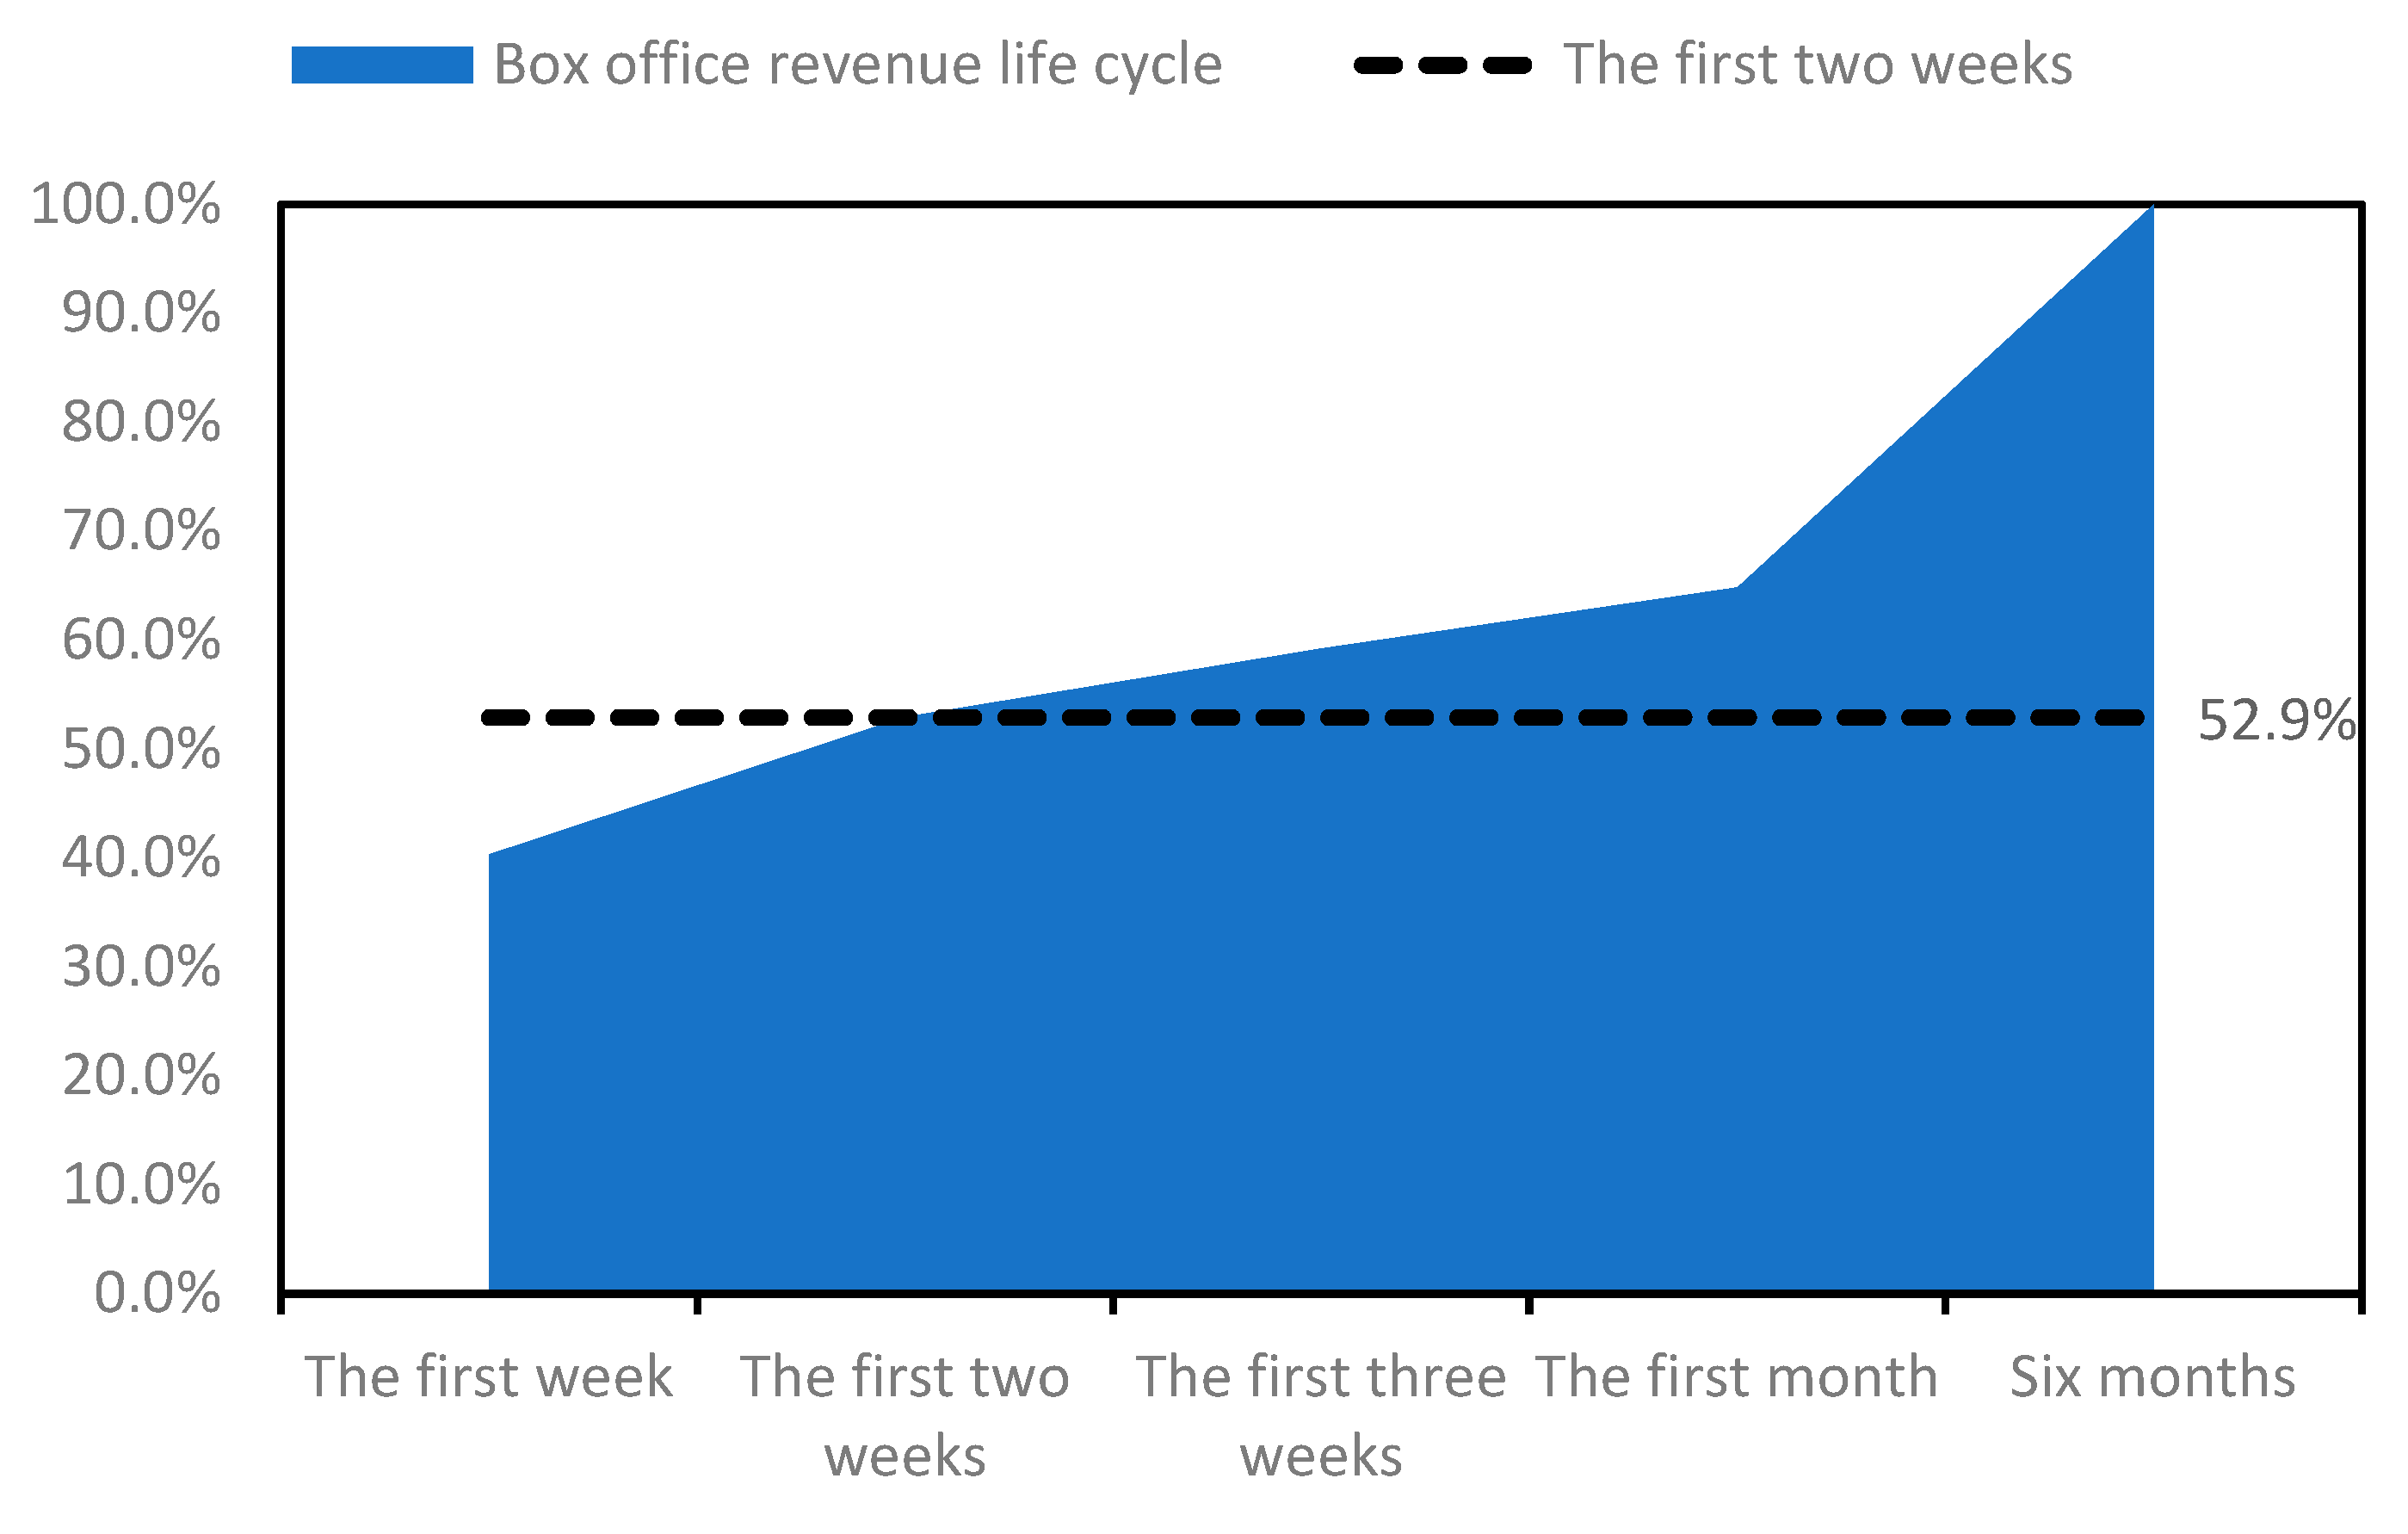
One of the most important metrics for assessing the profitability and economic relevance for movie producers is the revenue distribution ticket sales of streaming movies. According to the iQIYI streaming movie rankings, the lifecycle of a streaming movie is defined as 180 days. As illustrated in
Figure 3, the iQIYI Streaming Movie Market Insights Report released in 2020 indicates that the cumulative revenue-sharing box office during the first week accounts for 40.3% of the total box office throughout the movie’s lifecycle. This metric typically reflects the strongest performance of a streaming movie during its entire lifecycle. Furthermore, many box office prediction models for theatrical releases also incorporate first-week box office figures as a significant factor for predicting total box office revenue. Generally, a better first-week revenue-sharing box office performance is associated with higher cumulative box office revenue. In order to provide rolling projections until the fourteenth day, this study chooses the revenue-sharing box office for the first seven days of release, aiming to achieve an accurate and effective assessment of 50% of the total revenue throughout the streaming movie’s lifecycle.
4.1.2. Movie Genre Impact Factor
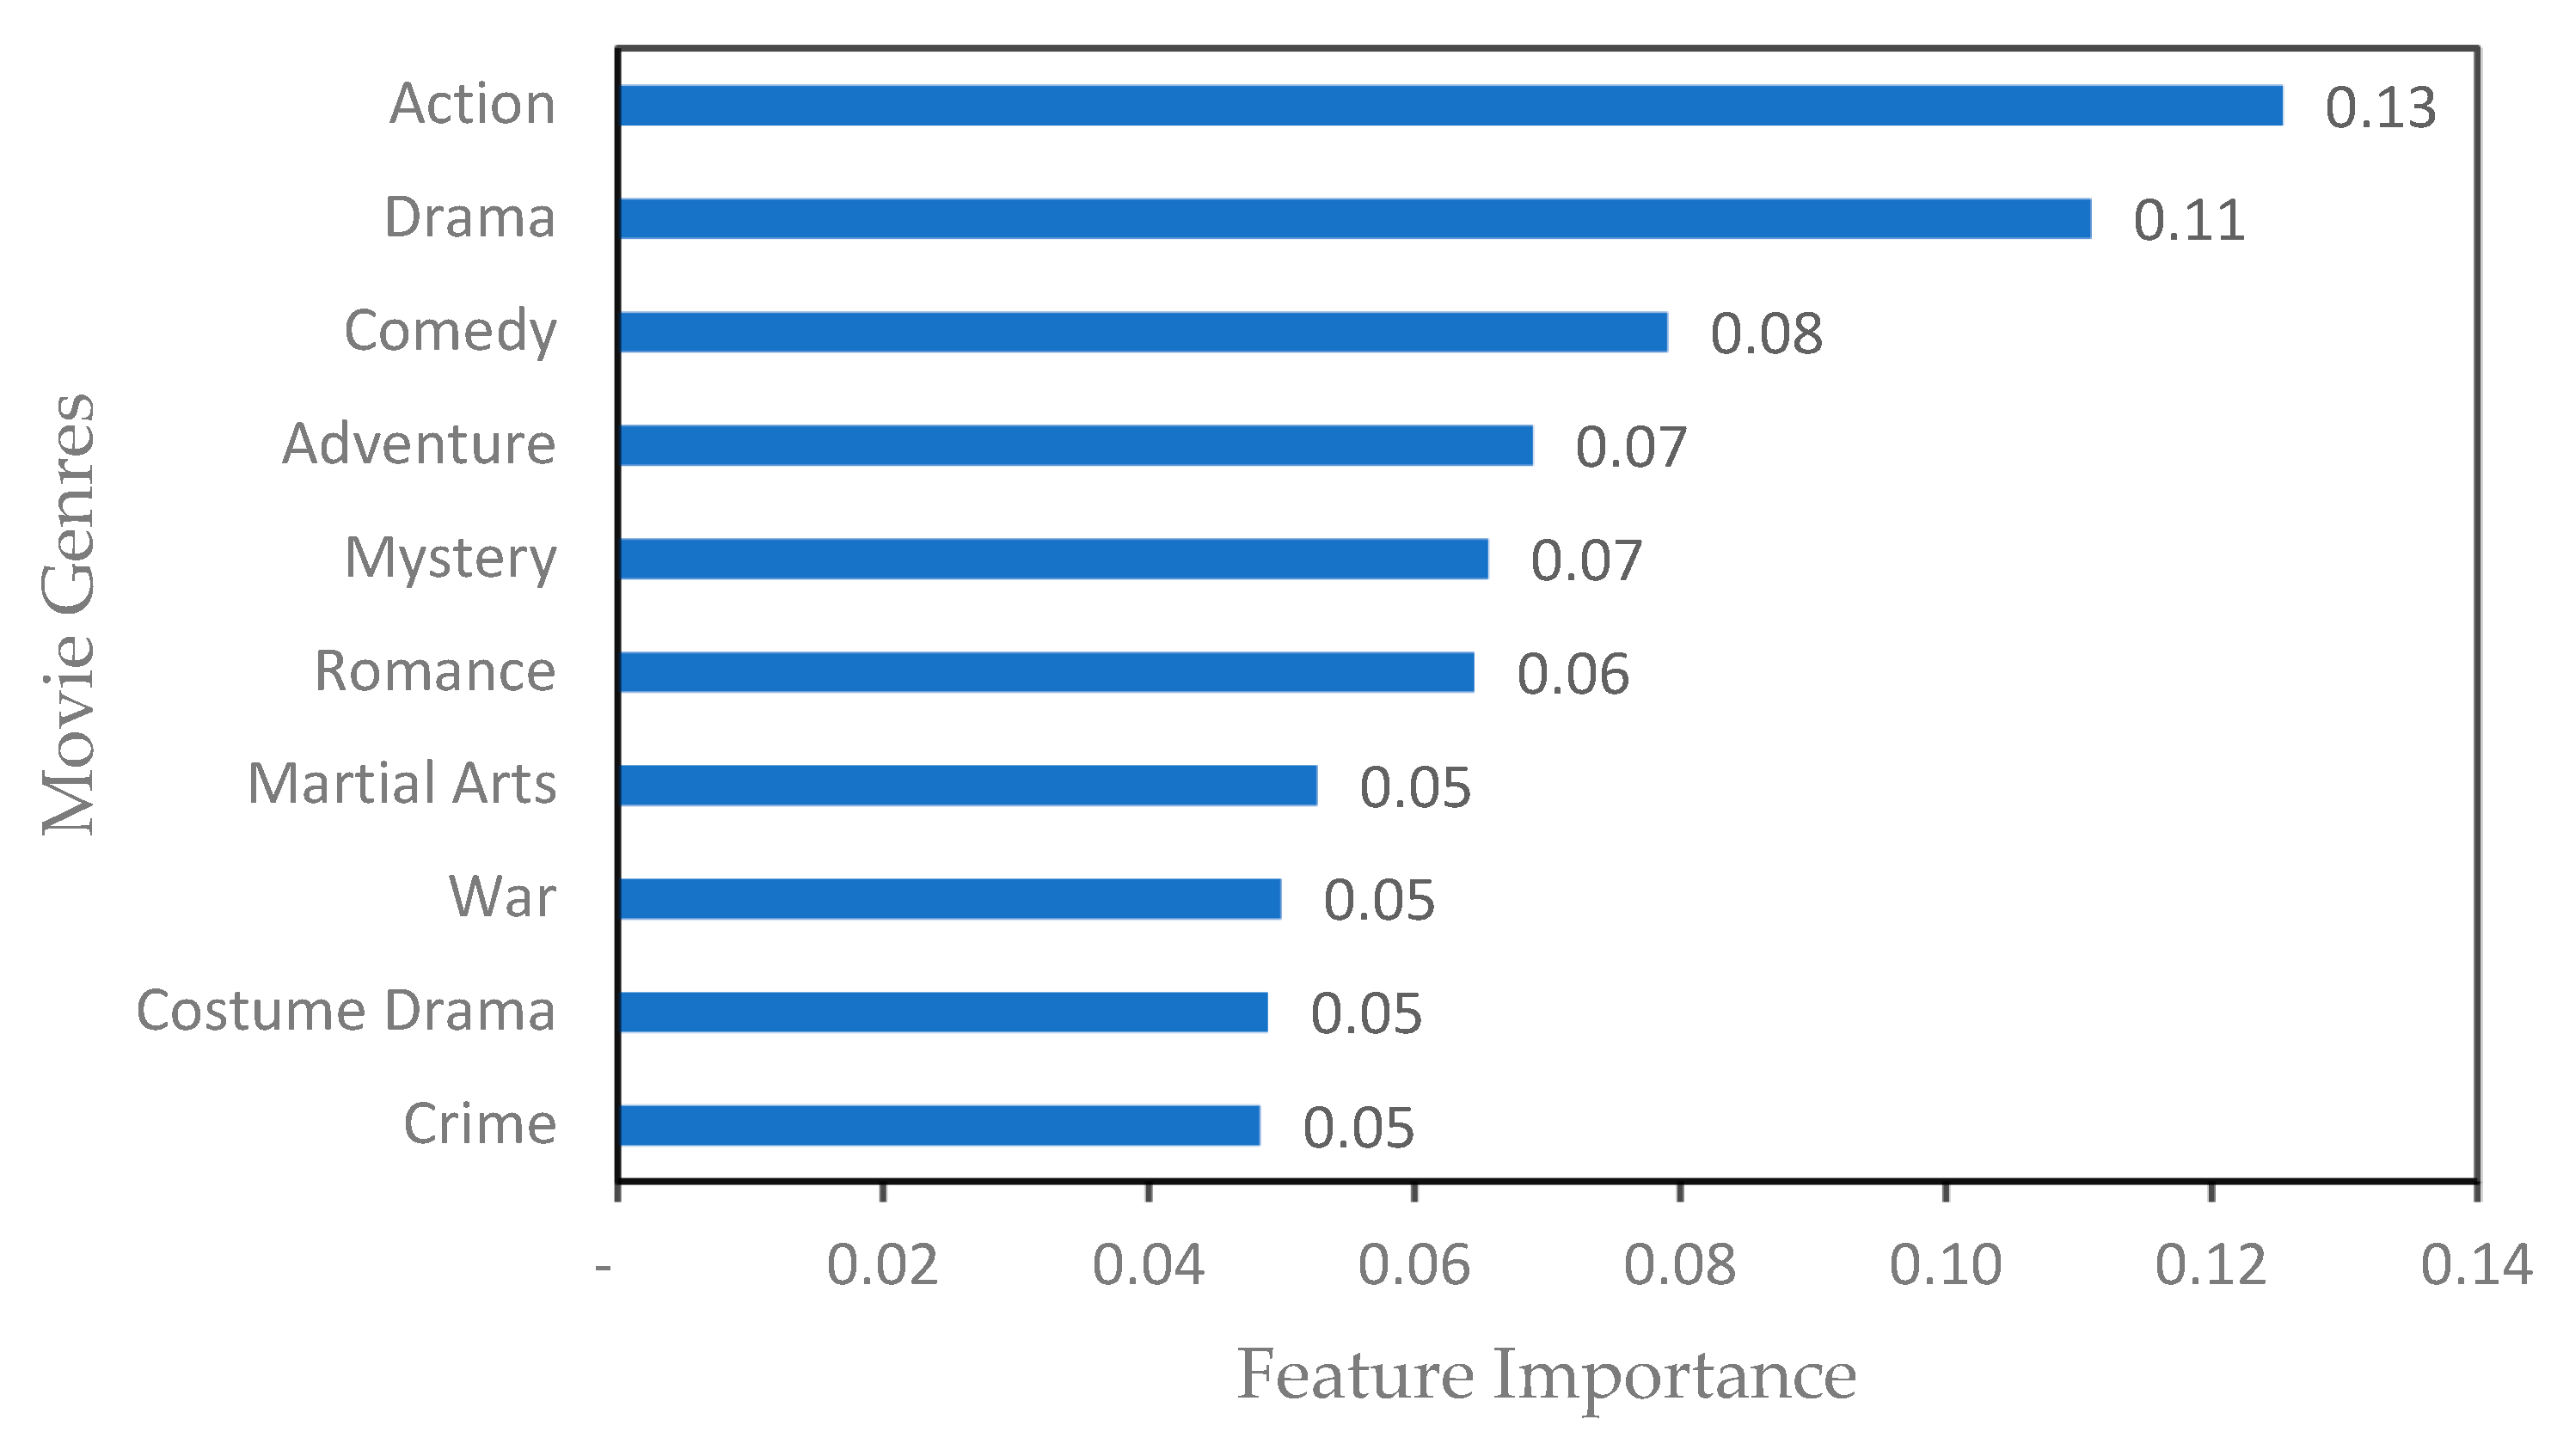
In this study, the attribute columns of 41 movie genres are used as characteristics, and the final split box office of each movie is input into the Random Forest model as the target variable to obtain the influence weight of each movie genre and sort it, and the results of the importance of movie genres shown in
Figure 4 are basically consistent with the conclusions regarding the distribution of box office genres in the Annual Report on Streaming Movies 2022, which is in line with the cognition. When a movie falls into more than one genre, the effect weights of each genre are added together, and the genres are described in order to determine the genre influence factor variable.
4.1.3. Director–Actor Impact Factor
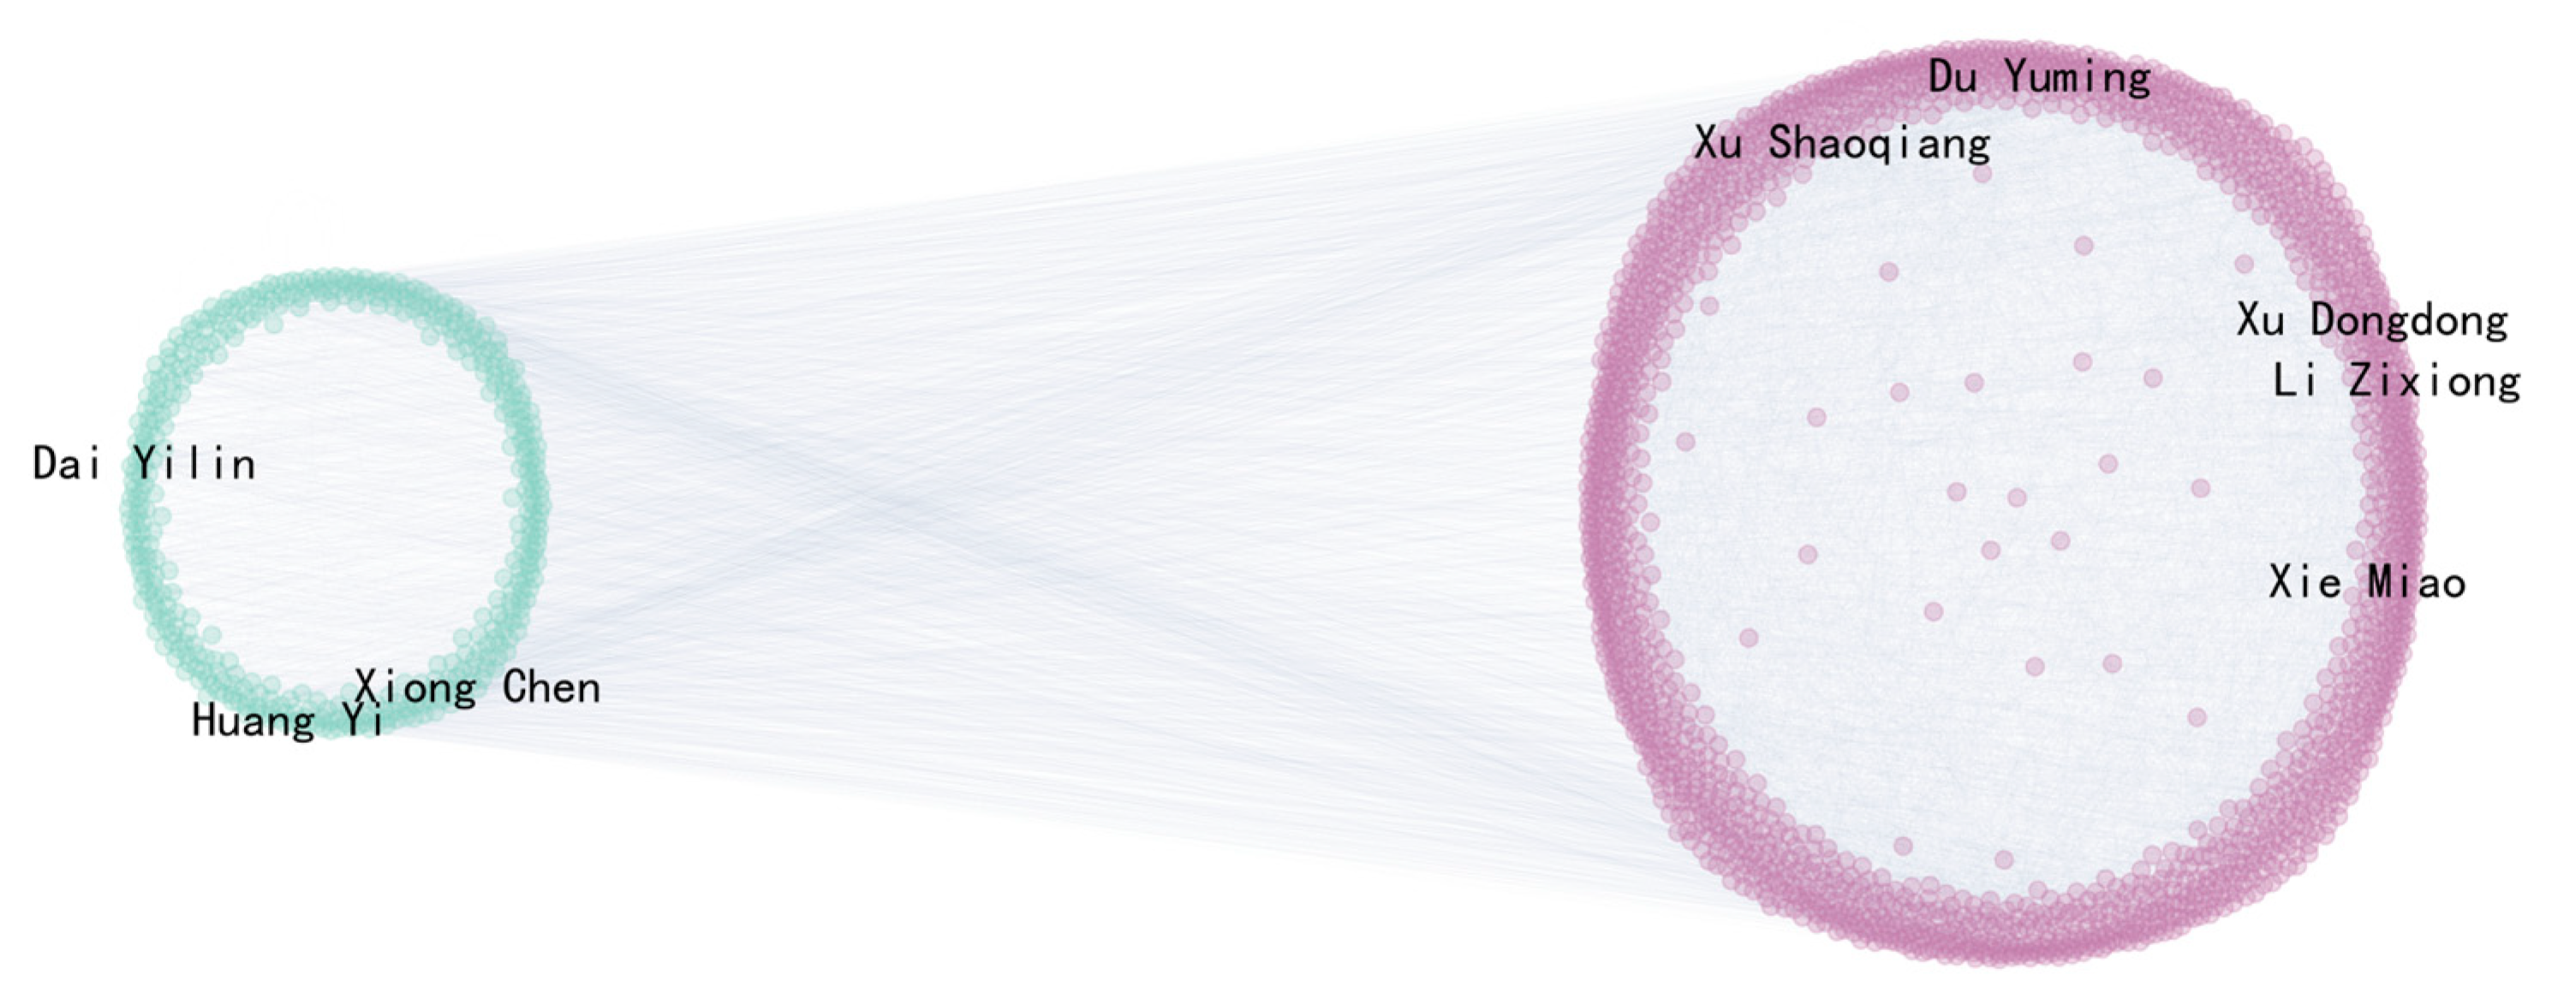
The core purpose of building an actor–director collaboration network graph is to provide structured collaboration features for the proposed model FFLSTMEA. This network graph extracts the director–actor network influencing factors of each movie composite by quantifying the node degree and other indexes, and transforms them into multidimensional features for input into the prediction model. Combined with feature fusion and the attention mechanism, it dynamically focuses on the key collaboration features to improve the accuracy of predicting the movie’s split box office.
The directors and lead actors of streaming movies were selected as network nodes. Considering the complexity and diversity of actors in streaming movies, the top five leading actors are selected for each movie to ensure the representativeness of the collected data and the depth of the study. An undirected weighted graph is created when two actors or directors work together on the same movie, creating an edge in the network between these two nodes. The edge’s weight represents how often the two actors or directors have worked together; the higher the weight, the more often these two performers have worked together. The actor and director cooperation network is shown in
Figure 5. Through network analysis, the degree, number centrality, proximity centrality, and structural hole constraint degree of each node are calculated, and then the metric values of all the participants of the movie are aggregated and then averaged to characterize the network attributes of the movie. If a movie contains multiple directors and actors, the corresponding metric values take into account the contributions of all participants to obtain a combined director–actor network influence factor for each movie. This approach ensures that the network characteristics of each movie accurately reflect the position and role of all its participants in the collaborative network.
4.1.4. Streaming Movie Platform Revenue Rules
According to the platform revenue rules disclosed by iQIYI, it can be seen that the streaming movie share price is differentiated according to exclusive broadcasting and non-exclusive broadcasting: the pricing is RMB 1.5/h for exclusive broadcasting streaming movies, and RMB 1.05/hour for non-exclusive broadcasting streaming movies. According to the new 2022 iQIYI streaming movie revenue rules, the split amount = members’ effective viewing hours (hours) * single movie split price (RMB/hour), and movie practitioners can make future streaming platform distribution plans based on the split unit price. When a streaming movie is platform-exclusive, it indicates that spectators may only see it on that particular streaming platform and that the movie’s broadcasting rights are limited to that platform. For the producer, choosing platform exclusivity may mean attracting more publicity and promotional resources, which can greatly increase the popularity of their work and its revenue on that platform. This study will consider the impact of platform exclusivity on the box office of streaming movie distribution, whereby if the movie is exclusively added to the iQIYI platform, it takes the value of 1, and non-exclusive distribution takes the value of 0.
4.2. Introduction to Evaluation Indicators
In order to evaluate the performance of the FFLSTMEA model proposed in this article in short-term prediction tasks of key indicators such as streaming movie revenue sharing and box office, the mean absolute error (MAE), mean squared error (MSE), root mean square error (RMSE), and mean absolute percentage error (MAPE) were used to quantify the difference between predicted and true values. The suggested model’s explanatory power on data variance was measured using the Coefficient of Determination (R-squared) to gauge the degree of fit between expected and actual values. The degree of variation between predicted and true values was also assessed.
The MAE is primarily used to calculate the average absolute error between the actual and expected box office receipts for streaming movies. On average, it shows the degree of deviation between the expected and actual values in an intelligible manner, and its formula [
28] is as follows:
where
represents the true observed value of the ith sample,
represents the model predicted value of the
sample, and
is the number of samples. The smaller the value of the MAE, the smaller the average deviation of the model predicted value from the true value, and the higher the predictive accuracy of the model.
The Formula (9) determines the average squared error between the true and anticipated values, which is what the MSE measures:
Larger mistakes are given greater weight in the computation since the MSE squares the errors. The MSE is more focused on penalizing larger errors than the MAE. In practice, if the model produces individually large prediction errors, the value of the MSE will increase significantly, thus reflecting the model’s poor performance on these outliers.
The RMSE, which is determined using the following formula, quantifies the sample standard deviation between the actual and anticipated streaming movie split box office values [
28]:
The RMSE is similar to the MSE, but it restores the magnitude of the error to the same level as the original data due to the open-square operation, making it easier to understand in a practical sense. For example, if the box office data are based on a specific box office counting unit, the value of the RMSE is the size of the average prediction error for each sample (according to the corresponding counting unit). The RMSE takes into account the errors of all samples and numerically visualizes the average deviation of the model’s prediction from the true value, which is complementary to the MAE and provides a more comprehensive assessment of the model’s accuracy.
The formula for calculating MAPE, which measures the average percentage error of the projected value in relation to the real value, is as follows:
The benefit of the MAPE is that it can remove the impact of scale and provide the prediction error as a percentage, which is useful when comparing data from other models or scales. For the streaming movie box office in different movie types and time periods, the MAE and RMSE may be difficult to compare directly due to the difference in magnitude, while MAPE can provide a relatively uniform evaluation standard.
The coefficient of determination (R-squared), which is determined using the following formula, is used to assess how well the model fits the data:
where
is the mean value of the real observations. The better the model fits the data, the more it can explain the majority of the data’s variability; conversely, the closer the R-squared number is to 0, the less the model fits the data, and there may be problems such as irrational model structure and inaccurate parameter estimation.
The effectiveness of the FFLSTMEA model in the duty of forecasting streaming movie-related indices may be thoroughly and precisely evaluated by thoroughly examining these evaluation indexes, thus providing strong support for the optimization and adjustment of the model as well as its application in practical application scenarios such as streaming movie operation and promotion. For example, movie producers, distribution platforms, and other related business entities can rely on these indicators to assess the reliability of the model prediction, and then rationally conduct movie operations, marketing, and investment decision making to enhance the efficacy and efficiency of the streaming movie industry.
4.3. Comparative Experimental Analysis
To verify the effectiveness of the proposed algorithm, all experiments in this paper are conducted under the same hardware and software environments: the hardware environment is an Intel (R) Core i7-10700K CPU @3.80 GHz, with 32.0 GB RAM and an NVIDIA GeForce RTX 2060 SUPER graphics card. The software environment is Python3.7 built using Pycharm and the Pytorch1.13 deep learning environment for experimentation.
Table 2 shows the results of the comparison experiments of different models (CNN, LSTM, BiLSTM, GRU, Transformer, CNN-Transformer, FFLSTMEA) in terms of a number of metrics (MAE, MSE, RMSE, R-squared, MAPE). MAE: The lower the value, the better the performance, among which the MAE value of 3.50 of FFLSTMEA is the best (red), followed by BiLSTM’s 3.59 (blue), and the third best is MTPNet’s 3.61 (light green). MSE: The lower the value, the better the performance. MAE: The lower the value, the better the performance, among which FFLSTMEA’s MAE is 3.50 (red), followed by BiLSTM’s 3.59 (blue), and the third best is MTPNet’s 3.61 (light green). MSE: the lower the value, the better the performance, among which SageFormer’s MSE is 26.12 (red), followed by GRU’s 27.15 (blue), and the third best is BiLSTM’s 27.88 (light green). RMSE: the lower the value, the better the performance, with GRU’s RMSE value of 5.21 being the best (red), followed by BiLSTM’s and FFLSTMEA’s 5.28 (blue), and MTPNet’s 5.33 (light green). R-squared: the higher the value, the better the model fit, with FFLSTMEA’s 0.87 being the best (red), followed by FFLSTMEA’s 0.85 (blue), and FFLSTMEA’s 0.86 (light green). R-squared: the higher the value, the better the model fit, with 0.87 for FFLSTMEA (red), followed by 0.81 for MTPNet (blue), and 0.79 for Crossformer (light green). MAPE: the lower the value, the better the model fit, with 19.82 for BiLSTM (red), followed by 22.38 for LSTM (blue), and 23.11 for Crossformer (light green). SRCC: The larger the value, the better the model fit, 0.89 (red) for FFLSTMEA, 0.83 (blue) for MTPNet, and 0.81 (light green) for Crossformer. By comparing the quantitative indexes, the model proposed in this paper achieves better prediction results.
The proposed FFLSTMEA model performs well in several key indicators, e.g., the evaluation index MAE value is 3.50 and R-squared value is 0.87, which represents an obvious advantage compared with other models; this is because the MAE and R-squared indexes are used to measure the data fitting effect, because the proposed model FFLSTMEA realizes multi-featured data fusion during data processing and prediction, so compared with other common models such as CNN, LSTM, and Transformer, it achieves better prediction results, and uses the attention mechanism in the prediction process to focus on the key information of the prediction results. Because the proposed model FFLSTMEA realizes multi-feature data fusion in the data processing and prediction process, it achieves better prediction results than other common models such as CNN, LSTM, and Transformer, and focuses on the key information of the prediction results by using the attention mechanism during the prediction process, which means the proposed model achieves better prediction results compared to the latest models such as TDformer, MTPNet, and SageFormer. The RMSE value of FFLSTMEA is 5.28, which is comparable to the evaluation indexes of some comparative models, because the RMSE reflects the global error mean and takes into account the errors of all samples, and the proposed model’s standardized operation of dimensionless and outlier removal in data preprocessing is not purely for the purpose of reducing errors, but enhances the model’s ability to resist disturbances of sudden market fluctuations by improving the quality of data. By improving the data quality, it enhances the anti-interference ability of the model against sudden market fluctuations, so that the model can still maintain stable output under extreme scenarios. Therefore, it makes the FFLSTMEA model comparable to the prediction accuracy of the frontier method, which reflects the rationality of the FFLSTMEA model design. Overall, the proposed model achieves better prediction results compared with the comparison algorithms, reflecting the effectiveness and superiority of FFLSTMEA in this experimental scenario.
4.4. Analysis of Ablation Experiments
Figure 6 shows the point and line diagrams of ablation experiments, involving LSTM, FFL, FFLA, and FFLSTMEA algorithms, which correspond to the indicators of MAE and RMSE, MSE, R-squared, and MAPE from (a) to (d), respectively, and illustrate the variations in each algorithm’s performance using point and line diagrams in the relevant indicators, which makes it easier to analyze the particular impacts of the algorithms in the ablation tests.
Table 3 demonstrates the results of the ablation experiments of the FFLSTMEA algorithm proposed in this paper, and the performance of each metric (MAE, MSE, RMSE, R-squared, and MAPE) in different cases is observed by setting the three modules, namely, feature fusion, attentional mechanism, and data enhancement, with or without any modules. Without any modules: The corresponding values are follows: MAE is 4.11, MSE is 39.54, RMSE is 6.29 (light green), R-squared is 0.73, and MAPE is 22.38 (blue). Among the metrics, this is the initial base performance case. Adding feature fusion only: MAE is reduced to 3.81 (light green), MSE is reduced to 27.83 (blue), RMSE is 5.28 (blue), R-squared is increased to 0.79 (light green), and MAPE is 22.73. After adding the feature fusion module, it is evident that the majority of the indexes have been optimized and that the outcome has improved when compared to the initial state. Adding feature fusion and the attention mechanism: MAE is further reduced to 3.58 (blue), MSE is reduced to 24.41 (red), RMSE reaches 4.94 (red), R-squared is improved to 0.81 (blue), and MAPE is 22.19 (red). This shows that with the addition of the attention mechanism, the indicators are further optimized and the effect continues to improve compared to when only feature fusion is included. With the addition of feature fusion, the attention mechanism, and data enhancement: MAE is 3.50 (red), MSE is 27.92 (light green), RMSE is 5.28 (blue), R-squared reaches 0.87 (red), and MAPE is 24.40, which shows that after adding the data enhancement module, the overall performance of some indicators can still be maintained at a high level or even continue to be optimized, especially in the case of the R-squared indicator, and the overall effect is gradually improved in the process of adding modules.
From the ablation experiment results, it can be clearly seen that as the three modules of feature fusion, attention mechanism, and data enhancement are added in turn, most of the evaluation indexes show a gradual positive trend, which fully reflects the positive role of each module for the algorithm to improve the effect of the algorithm, but also provides indirect evidence of the algorithm’s general rationality and effectiveness, emphasizing how the modules work together to produce a cumulative algorithmic impact. It also serves as evidence of the algorithm’s overall efficacy and rationale, emphasizing how the combined activity of all modules steadily improves the algorithm impact.
4.5. Analysis of Projected Results
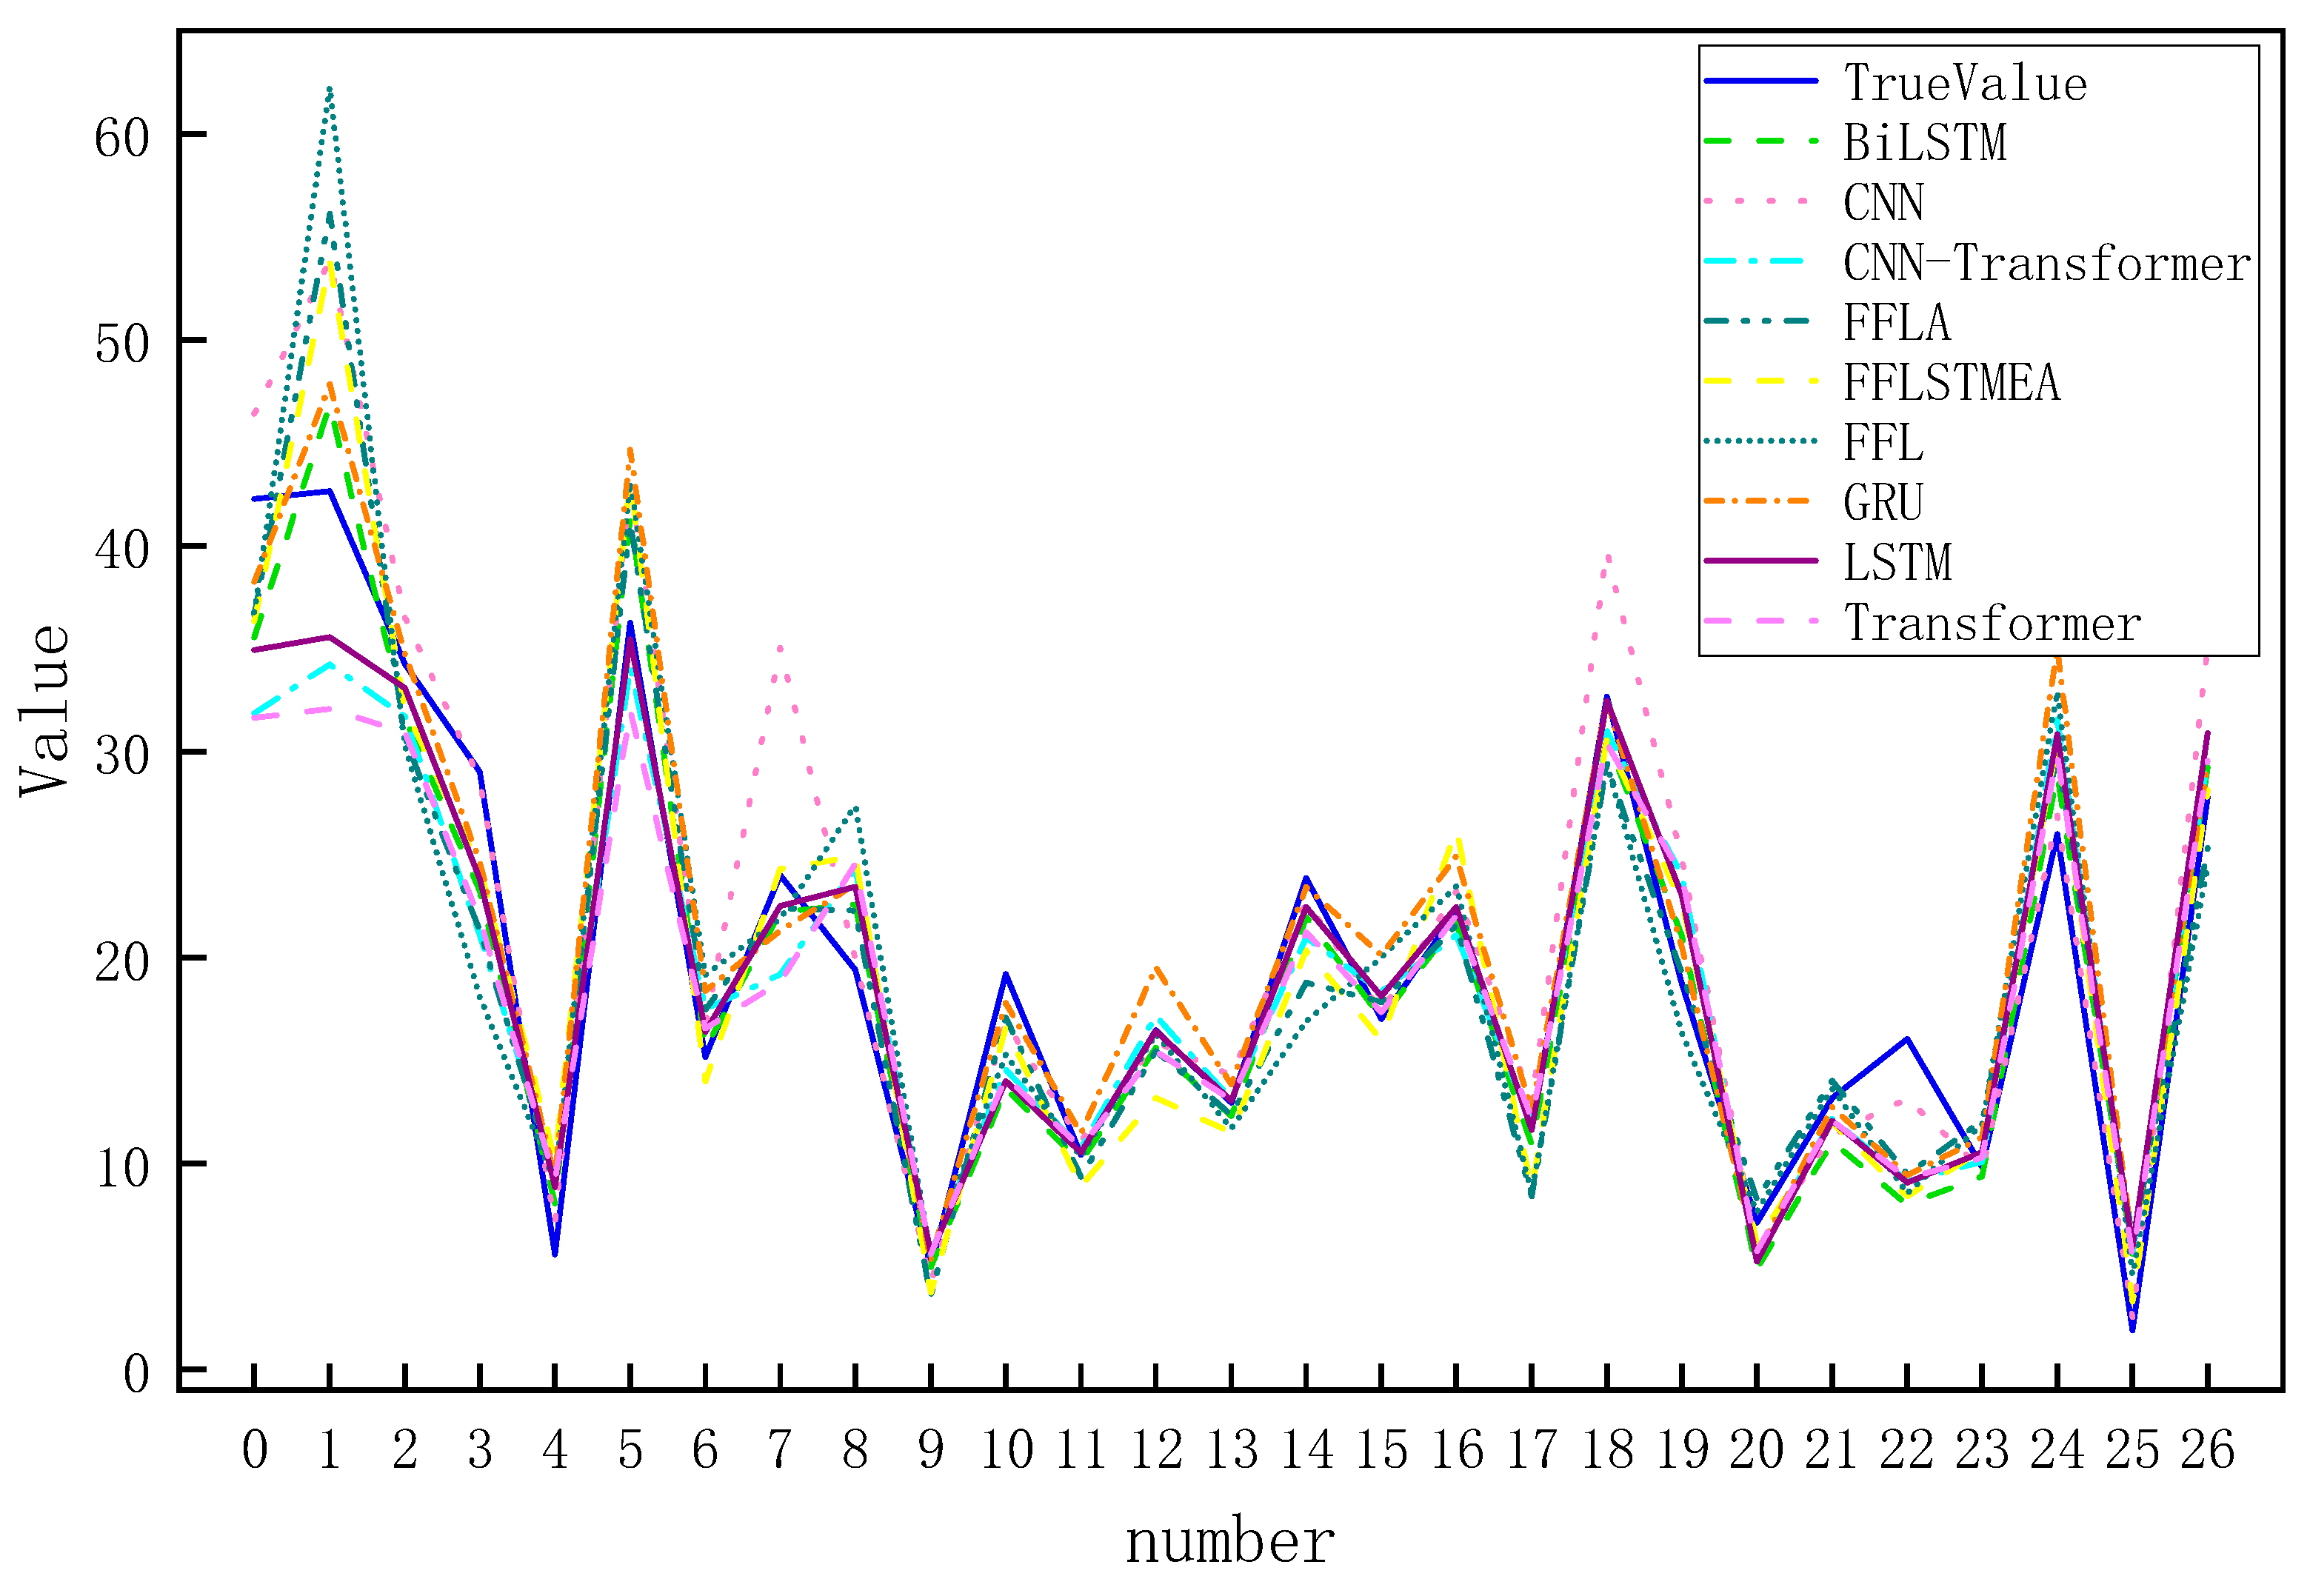
Figure 7 shows the comparison curves of different algorithms, including TrueValue, BiLSTM, CNN, CNN-Transformer, FFL, FFLA, FFLEA, GRU, LSTM, and Transformer. Among these algorithms, TrueValue serves as a benchmark, and the proximity of other algorithms’ curves reflects their strengths and weaknesses; the BiLSTM curve fluctuates, and some intervals deviate from the real value; the CNN curve differs from the real value and the deviation increases in the latter part; the CNN-Transformer curve has a large deviation interval even though it tries to improve; the GRU curve has an insufficient response at peaks and troughs; and the LSTM curve has an insufficient response at peaks and troughs, as well as not being sufficiently large. The GRU curve is not responsive enough at the peaks and valleys; the LSTM curve has a lag or overfitting situation that causes the deviation to increase; and the Transformer has a significant deviation in certain intervals in a specific scene. Compared with the comparative methods, the proposed model has fewer prediction errors than the traditional LSTM and FFL in the initial stage (No. 0–10), which is attributed to the effective modeling of the early data dynamics by the multi-scale feature fusion module; secondly, in the complex fluctuation intervals (No. 10–20), the proposed model significantly outperforms the CNN and other models, and almost overlaps with the real value, which verifies the validity of the attention mechanism. Finally, in the long-tailed prediction interval (serial numbers 20–26), the proposed model can also be better approximated. It can be seen from the analysis that the FFLSTMEA model shows strong data comprehension and prediction ability in terms of accuracy, capturing key information precisely through unique feature extraction or data processing mechanisms, and performs well in different intervals in terms of stability; however, there are some problems in the proposed model that need to be improved, such as in the prediction of extreme events (e.g., step change in the box office data), the accuracy of the prediction results needs to be improved, and secondly, the number of parameters in the model needs to be improved. The second is that the number of model parameters increases compared to standard LSTM, which leads to time-consuming training. These results confirm that FFLSTMEA achieves the deep mining of movie box office temporal features by fusing the progressive optimization framework of feature selection (FFL) and attention modification (FFLA), etc., while keeping the computational efficiency controllable, and provides a new technological path for dynamic prediction in complex market environments.
5. Conclusions
The FFLSTMEA model is put forth in this research to solve the issues of finiteness, data characteristics, and various influencing variables in the streaming movie prediction job. The FFLSTMEA model integrates multi-dimensional features through feature fusion and combines them with long- and short-term memory networks to explore the intrinsic associations of features; focuses on the key information with the help of the attention mechanism and assigns it dynamically; and expands the scale and diversity of the data by using data flipping and scaling. The experimental results show that the FFLSTMEA model delivers excellent performance in the evaluation indexes, such as having an MAE value of 3.50, MSE value of 27.92, RMSE value of 5.28, R-squared value of 0.87, and MAPE value of 24.40, demonstrating better prediction accuracy and stability compared with other models such as CNN and LSTM, and it can provide a reliable basis for decision making in streaming movie operation and promotion. In the process of practical application, FFLSTMEA model can be deployed in the real-time decision-making system of streaming media platforms to realize rolling box office prediction by dynamically integrating multi-source features. In real-time scenarios, the system obtains user behavior data, social media heat index and platform scheduling information in real time via APIs to achieve box office prediction and drive personalized recommendation resource allocation, advertising space bidding adjustment and regional scheduling optimization.
In the future, the FFLSTMEA model will integrate social media public opinion, real-time user review sentiment and cross-platform search trends to build a multimodal data-driven prediction framework to achieve the long-term accurate prediction of key indicators such as online movie share box office. On the other hand, with the continuous growth of data volume and the improvement of hardware computing power, more complex and efficient neural network architectures and optimization algorithms can be researched to further explore the deep information of the data, and enhance the model’s adaptability and generalization ability, so as to better cope with the prediction challenges brought by the rapid changes in the online movie market, and help the online movie industry to achieve more scientific and reasonable resource allocation and business planning.


