Article

Research on the Remanence Measurement Method of Transformers Based on the Degaussing Hysteresis Loop

1
National Key Laboratory of Transmission and Transformation Equipment Technology, Chongqing University, Chongqing 400044, China
2
State Grid Chongqing Electric Power Company Qijiang Power Supply Branch, Chongqing 400044, China
3
China Southern Power Grid Corporation Limited Ultra High Voltage Transmission Company Electric Power Research Institute, Guangzhou 510000, China
*
Authors to whom correspondence should be addressed.
Appl. Sci. 2025, 15(10), 5375; https://doi.org/10.3390/app15105375
Submission received: 4 March 2025 / Revised: 15 April 2025 / Accepted: 7 May 2025 / Published: 12 May 2025
(This article belongs to the Section Electrical, Electronics and Communications Engineering)

Abstract

:
The residual magnetism of the iron core of power transformers can cause an excitation inrush current, posing a threat to the safe and stable operation of the power grid. This paper proposes a transformer remanence measurement method based on a demagnetization hysteresis loop to address the problems of large errors, complex operation, and poor universality in existing remanence measurement methods. This method is designed for off-grid transformers to avoid potential interference to the power grid caused by current pulses during the measurement process. This method constructs an RLC oscillation circuit that utilizes capacitor energy storage and iron core magnetic field energy conversion, combined with the dynamic characteristics of hysteresis loops, to achieve accurate measurement of residual magnetism and synchronous demagnetization. The effectiveness of this method has been verified through residual magnetism measurement experiments on ring transformers and large converter transformers, and it can be applied in specific engineering practice operations. Theoretical analysis shows that the charging range of energy storage capacitors is affected by the hysteresis characteristics of the iron core and the saturation magnetic flux, and the residual magnetization value can be directly calculated based on the difference in the intersection point of the longitudinal axis of the demagnetization hysteresis loop. Simulation and experimental results show that the measurement error of the proposed method is less than 5%—significantly better than traditional methods. This method does not require complex control strategies, has high precision and efficiency, and can provide reliable technical support for residual magnetism detection and suppression of off-grid power transformers.

1. Introduction

As the core equipment in the power system, the regular operation of the power transformer is crucial to the stability and security of the power grid. However, the remanence of the transformer core significantly impacts its operational performance. Once remanence is generated, it does not disappear automatically [1]. The presence of remanence causes rapid magnetic saturation of the core and generates an excitation inrush current, the peak of which can reach six to eight times the rated current [2], seriously affecting the safe and stable operation of the transformer and the power grid. For example, in March 2016, the excitation inrush current generated when the No. 1 main transformer at Guandu Station in Henan Province was put into operation caused periodic distortion of the 500 kV bus voltage at the nearby Zhongzhou converter station, resulting in DC power fluctuations [3]. Similarly, in August 2015, the no-load closing of the 500 kV No. 4 booster transformer at Suizhong Power Plant generated an excitation inrush current, leading to multiple commutation failures in the Kaolin DC project [4]. It is evident that the inrush current threatens the mechanical stability and dielectric strength of the transformer winding and disrupts the regular operation of the power system. Therefore, accurate measurement of remanence is an important task to prevent the inrush current from endangering the safety of the power grid.
Currently, the measurement methods for core remanence in power transformers primarily include empirical estimation of remanence, calculation methods based on core magnetization models, voltage integration methods, remanence measurement methods based on the excitation inrush current, and residual magnetic field measurement methods based on leakage. The empirical estimation of remanence relies on prior operating experience, resulting in significant errors and an inability to predict the direction of remanence. The remanence magnetism calculation method based on the core magnetization model allows for the estimation of remanence without transformer operation, but the magnetization models differ among transformers, making establishment challenging and prone to large errors. The voltage integration method is the most widely employed for measuring remanence, yet it also exhibits substantial errors [5]. The remanence measurement method based on excitation inrush current is cumbersome to operate but significantly enhances measurement accuracy; however, it remains restricted to simulation and analysis, with ongoing challenges in practical application. The residual magnetic flux measurement method based on transformer flux leakage is currently the most accurate method available, but it is still confined to the simulation stage, and there are unresolved issues concerning the establishment of the theoretical model for three-phase transformers [6].
Researchers have proposed using artificial intelligence to solve the important task of predicting the magnetic properties of permanent magnets based on rare earth metal alloys. The author studied the effectiveness of eight machine learning methods in predicting the magnetic remanence of Sm-Co magnets. The results indicate that only machine learning ensemble methods can provide sufficient predictive models, with the random forest algorithm achieving the highest prediction accuracy. However, current artificial intelligence methods are still limited to measuring the magnetic properties of specific materials, and there is no measurement and demagnetization method for residual magnetism of transformer cores under actual working conditions. Environmental and aging factors are often overlooked but are crucial. Long-term thermal cycling can degrade the insulation system, accelerate partial discharge, alter the crystal structure of silicon steel sheets, and ultimately affect the hysteresis characteristics.
To sum up, the precise measurement of core remanence in power transformers is crucial for ensuring the safe and stable operation of the power grid. Although various measurement methods exist, some errors persist. Therefore, further research and improvement in remanence magnetic field measurement methods to enhance their accuracy, reliability, and applicability are urgent issues to be addressed in the field of power systems [7,8].
To address the aforementioned issues, this paper presents a remanence measurement method based on the degaussing hysteresis loop, which determines the size of the energy storage capacitor through theoretical calculations. The energy stored in the capacitor is then released to generate an attenuation oscillation current for the transformer, thereby achieving the dual objectives of remanence measurement and demagnetization. Experimental research conducted on the toroidal transformer demonstrates that this method effectively measures the transformer’s remanence. The remanence can be obtained not only through the hysteresis loop following measurement but also by ensuring the demagnetization effect. Additionally, the time required for this process is significantly reduced [9,10].

2. The Principle of Remanence Generation and Elimination

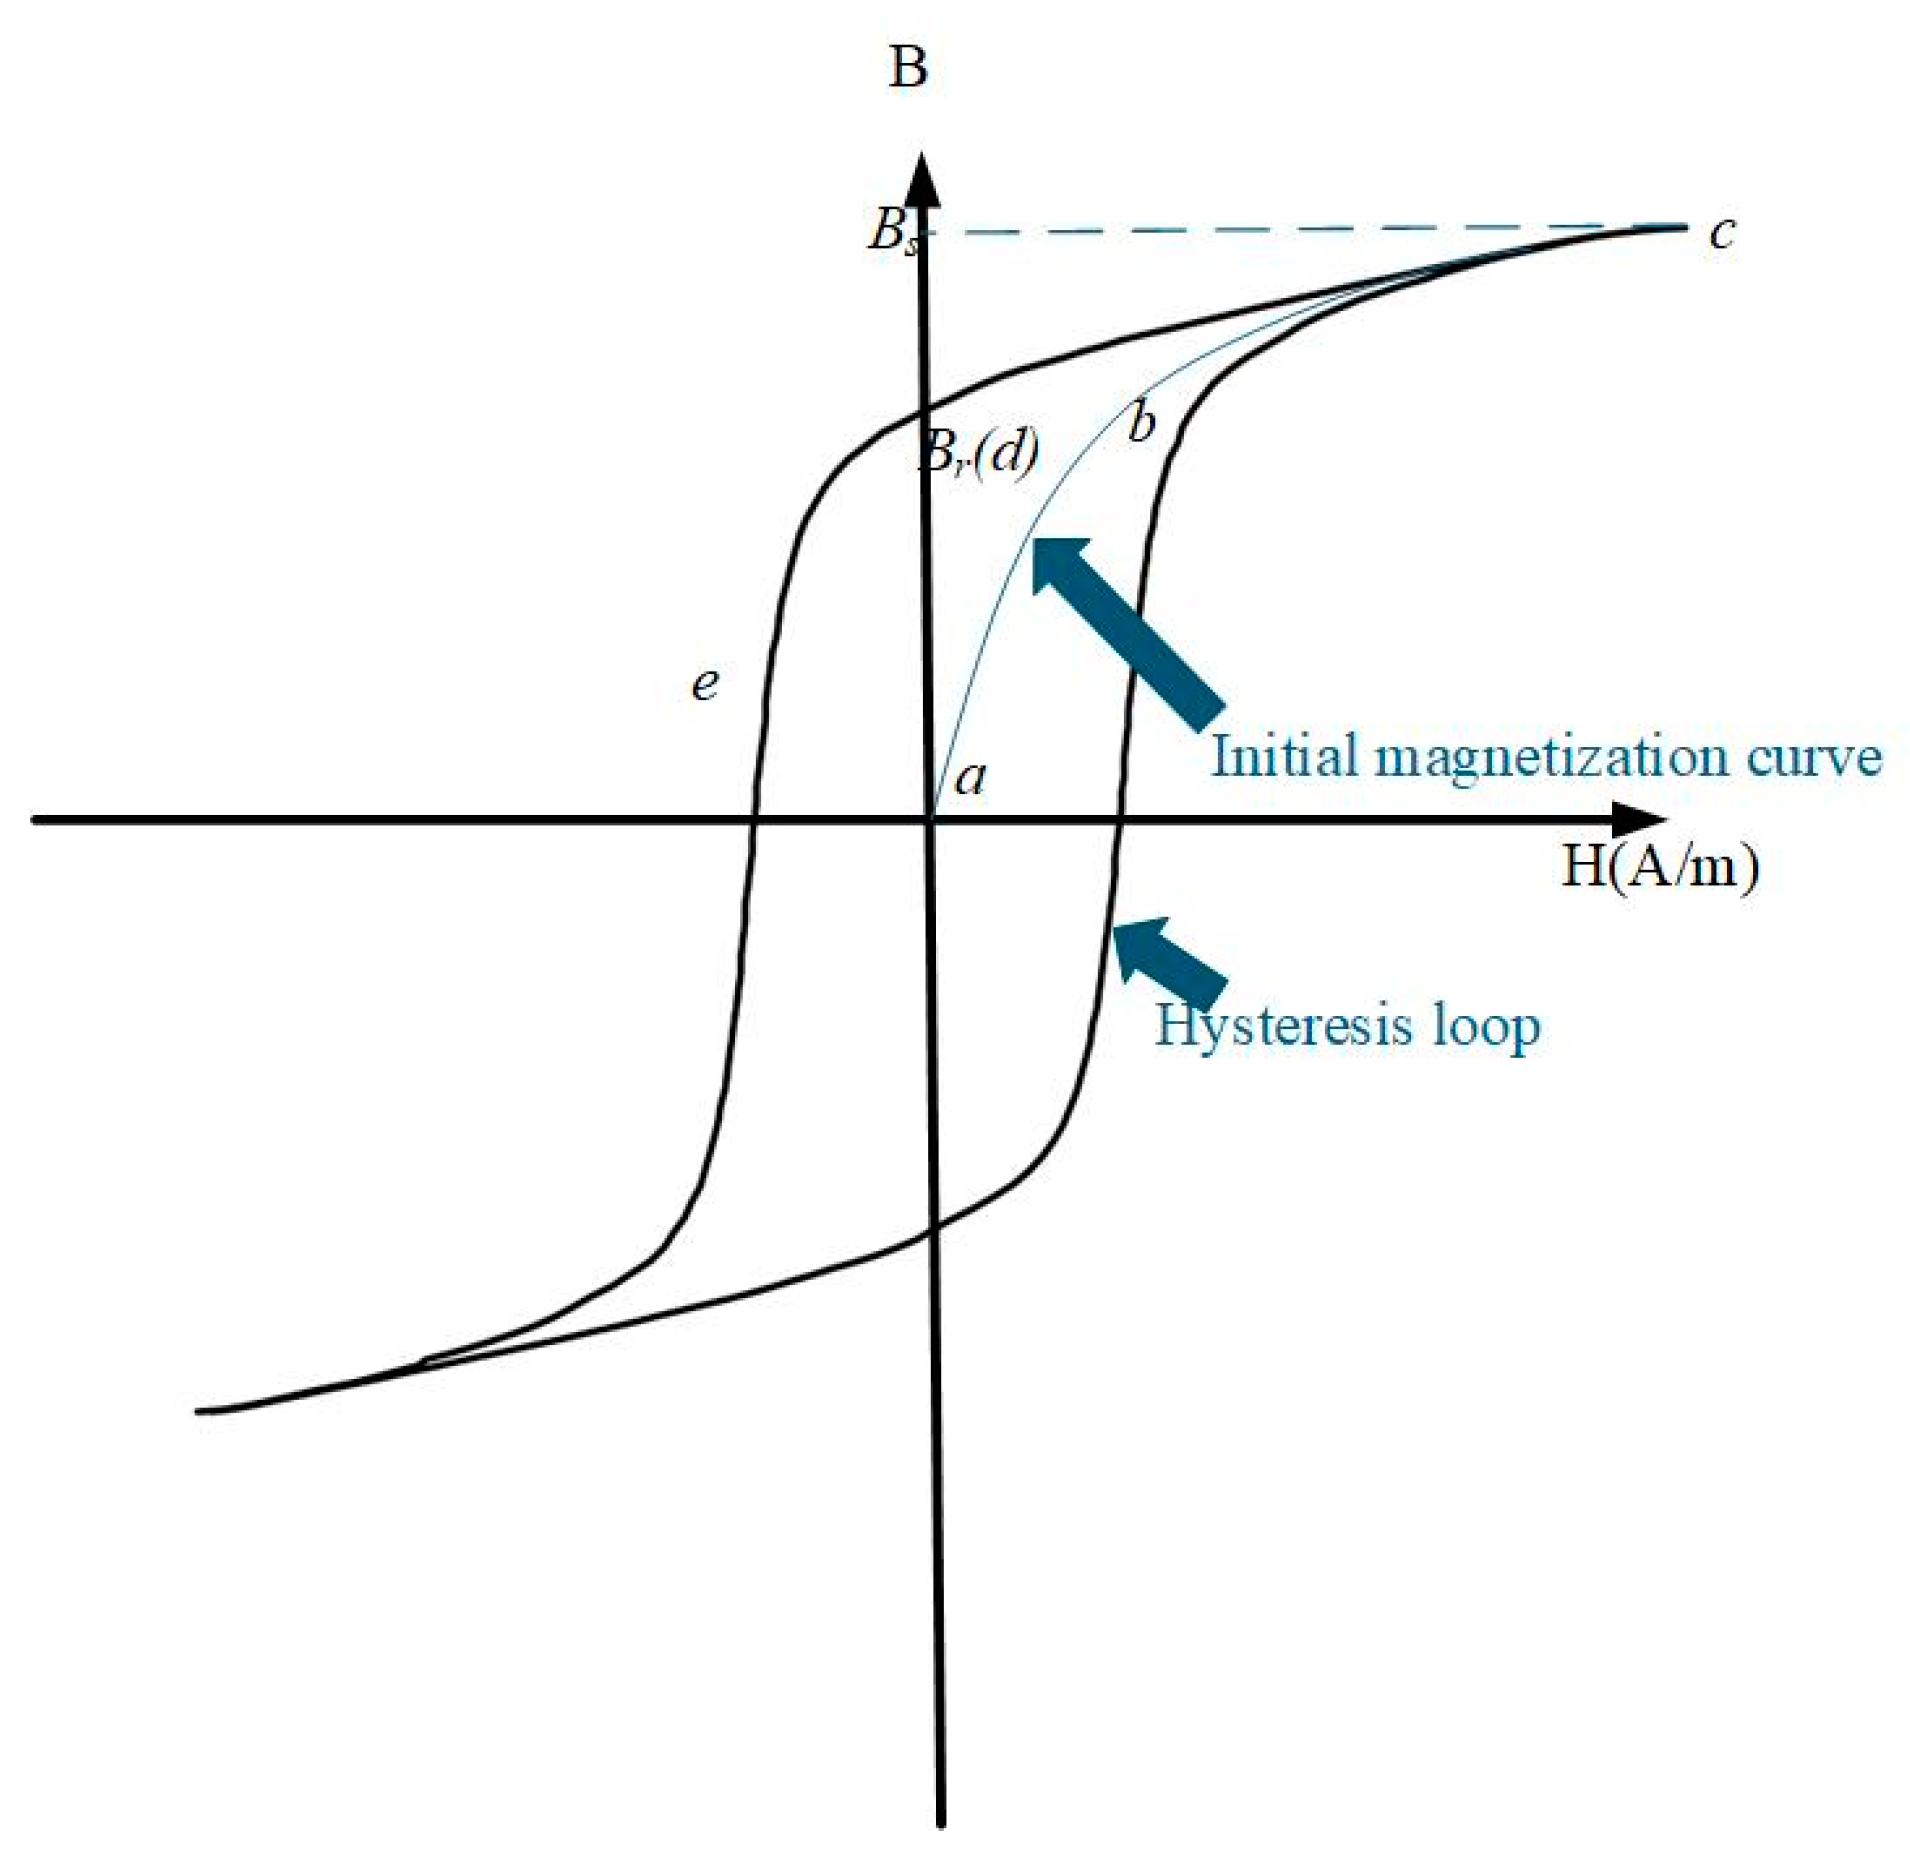
2.1. Remanence Generation

The core of a transformer is typically constructed from stacked ferromagnetic materials that exhibit high permeability and low loss, and all magnetic materials tend to retain their magnetism. Changes in magnetic flux density consistently lag behind changes in magnetic field strength, a phenomenon known as hysteresis. As illustrated in Figure 1, the magnetization process of the iron core can be broadly classified into four stages [11,12,13]:
Initial unmagnetized state (point a): The material is in an unmagnetized state where H = 0 and B = 0.
Magnetization process (a to b to c): As the applied magnetic field intensity H gradually increases, the magnetic induction intensity B also increases. In the initial phase, B increases linearly with H, corresponding to the reversible arrangement of the magnetic domains. As H continues to increase, the magnetic domains gradually and irreversibly align, resulting in a slowdown in the rate at which B increases, until B reaches the saturation value Bs when H is sufficiently large.
Demagnetization process (c to d): As H gradually decreases from the maximum value to zero, B does not immediately return to zero; instead, due to the hysteresis phenomenon, B gradually decreases, and ultimately, when H = 0, the material still maintains a certain magnetic induction intensity Br, which is the residual magnetic induction intensity. The point d here is Br (d).
Reverse magnetization process (d to e): The magnetic induction intensity B decreases gradually until B = 0 when the reverse magnetic field H is applied. At this point, the required reverse H value is called coercivity (Hc).
Transformers possess multiple sources of remanence, with the most common being the DC resistance test conducted after the circuit breaker is opened. For large devices, the actual current measured during the DC resistance test is relatively high (typically ≥ 20 A), and the remanence in the core is considerably greater [14,15]. In practical engineering applications, AC excitation is frequently employed to gradually reduce the hysteresis loop. This can be accomplished by maintaining the excitation voltage for a specific duration while gradually decreasing the excitation voltage, or by gradually increasing the excitation frequency while keeping the excitation voltage constant [16].

2.2. The Principle of Demagnetization of Remanence in the Core

The principle of demagnetization of remanent magnetism in the core is primarily achieved by applying a gradually decreasing alternating magnetic field, which continuously deflects and reverses the magnetic domains within the core, ultimately accomplishing the goal of demagnetization [17,18].
The magnetic domain is the fundamental magnetic unit within ferromagnetic material, and the magnetic moments within it are oriented in the same direction. In the unmagnetized state, the arrangement of magnetic domains is disordered, causing the material as a whole to lack magnetism. When an external magnetic field is applied, the magnetic domain is reoriented such that the direction of its magnetic moment aligns with the direction of the external magnetic field, leading to the magnetization of the material. Within the transformer core, the reorientation of the magnetic domains serves as the foundation for the magnetization and demagnetization processes [19].
In the degaussing process, the intensity of the applied alternating magnetic field gradually decreases, and the direction of the magnetic moment of the magnetic domain is continuously adjusted in response to the changing magnetic field. When the strength of the alternating magnetic field reaches zero, the direction of the magnetic moment of the magnetic domain becomes disordered, and the remanence within the core is eliminated. This process can be illustrated by a hysteresis loop, the area of which represents the energy loss during magnetization and demagnetization. The domain deflection process is depicted in Figure 2 [20,21,22].
The demagnetization techniques for power transformers encompass several methods, including the direct current (DC) method, polarity reversal method, micro pulse demagnetization method, and constant voltage frequency conversion method. The DC method, as outlined in the “Guidelines for DC Demagnetization Test of Power Transformers”, employs a current source with alternating directions and reduced amplitude for degaussing. The polarity reversal method leverages the symmetrical properties of the hysteresis loop to achieve effective demagnetization by varying the DC application time of different polarities. The micro pulse demagnetization method employs small bipolar pulses to reduce the core flux, thereby increasing the excitation inductance and controlling the current value for demagnetization. This oscillation demagnetization method utilizes an RLC oscillation circuit to generate an attenuating oscillation current during the demagnetization process [23,24,25].

3. Remanence Measurement Method Based on Degaussing Hysteresis Loop

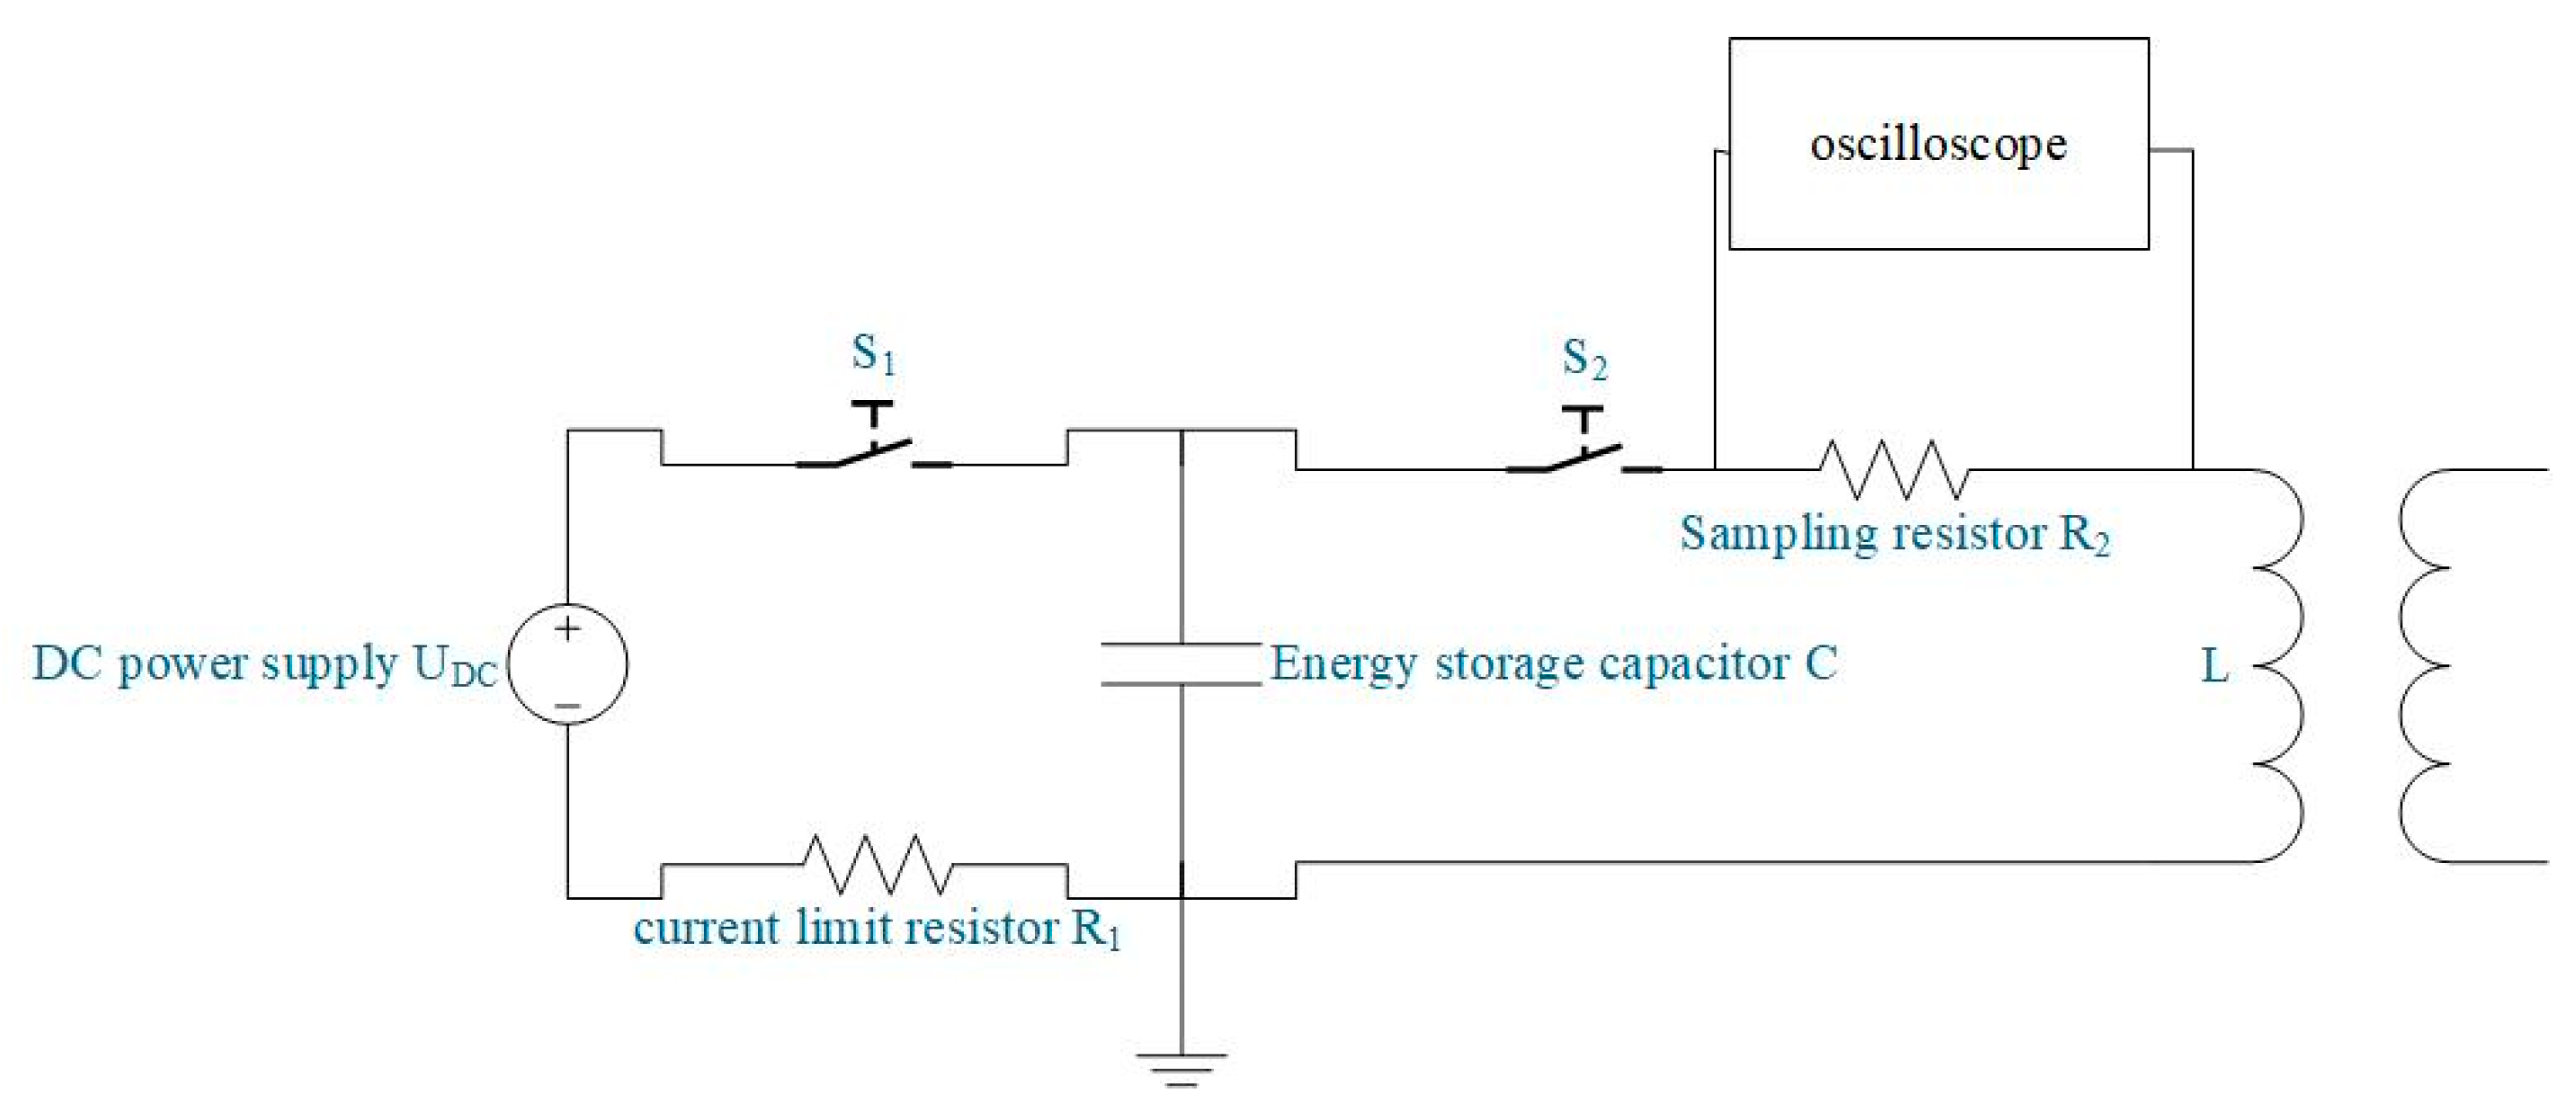
3.1. Principle of Attenuation Oscillation of Energy Storage Capacitors

When there is remanence in the transformer core, the internal remanence can be considered remanence energy, and the excess energy is dissipated in the form of RLC oscillation due to the mutual cancellation of the applied energy and the initial remanence energy. In the degaussing process, voltage and current curves are collected, the flux is calculated through voltage integration, and the degaussing hysteresis loop diagram of the flux and current is plotted. In the case of sufficient degaussing, the initial remanence measurement is determined by calculating the difference between the starting point and the endpoint before and after degaussing [26,27].
The method proposed in this paper includes a remanence measurement circuit consisting of an energy storage capacitor, a transformer core, and its windings. This method connects an energy storage capacitor that stores charge with a coil of a converter transformer. When the circuit current is low, the electric field energy within the capacitor is converted into the magnetic field energy of the core. When core saturation is reached, indicating that the magnetic field energy is fully stored, the remaining energy is reabsorbed into the capacitor. Oscillation is generated by the mutual conversion between the electric field energy of the capacitor and the magnetic field energy of the core. The oscillation period depends on the equivalent inductance of the coil of the converter transformer core, resulting in domain deflection between the attenuated magnetic field generated by the coil and the transformer core. A capacitor is connected to the transformer to form an RLC oscillation circuit.
The equivalent circuit diagram is shown in Figure 3, and based on the relationship between voltage and current for capacitance and inductance, the circuit equation forms the RCL differential equation, as shown in Equation (1).
L C d 2 U C d t 2 + R 2 C d U C d t + U C = 0
Let U c = A e α t substitute Equation (1) to obtain the characteristic Equation (2):
L C α 2 + R 2 C α + 1 = 0
When an attenuated oscillation occurs in a circuit, the condition of Equation (3) is satisfied:
ζ = R 2 2 C L < 1
The current change in the line should be as shown in Equation (4):
I C = e R 2 2 L t ( A 1 cos ( ω d t ) + A 2 sin ( ω d t ) )
Wherein ω d = 1 L C ( R 2 2 L ) 2 , A 1 = I C 0 = 0   A 2 . Specifically:
A 2 = d I C d t ( 0 ) + R 2 2 L A 1 ω d
Simplify Equation (5) to obtain:
A 2 = U C ( 0 ) L ω d
Equation (4) can be reduced to:
I c = e R 2 2 L t U C ( 0 ) ω d L sin ( ω d t )
After obtaining the relevant data of the voltage and current transformers, the voltage and current are exported at each time, the current change curve is drawn, and the magnetic flux change curve is obtained according to Equation (8).
ψ ( t ) = t 0 t u L ( t ) d t + ψ ( t 0 )

3.2. Determination of the Size of Capacitor Energy Storage

According to the capacitor energy calculation in Formula (9), the energy stored in the capacitor is determined by the voltage across both sides of the capacitor and the capacitance itself. When the energy storage of the capacitor is too low, it can result in incomplete degaussing, which compromises measurement accuracy.
W C = 1 2 C U C 2
To ensure the accuracy of the remanence measurement, it is essential to address the issue of capacitor charge in advance, specifically by determining the capacitor’s energy storage size based on the maximum saturation level of the converter transformer core. Regardless of the remanence present at this moment, it can be mitigated by the damping oscillation current released by the capacitor, thereby facilitating precise measurement. However, indiscriminately increasing the capacitance size C or the voltage UC across the capacitor will result in prolonged degaussing hysteresis loop shrinkage or prevent the circuit current from diminishing oscillation. Thus, a method is required to establish the relationship between saturation flux, stored electrical energy, and voltage.
The factory report of the converter transformer contains the B-H hysteresis curve of the silicon steel sheet used in the transformer’s core, or the technical report for the hysteresis curve specific to the material of the silicon steel sheet in the core can be referred to [28].
In the B-H curve, coercivity is defined as the reverse magnetic field strength Hc required to reduce the magnetic induction intensity B from saturation to zero. Specifically, in the hysteresis loop, coercivity corresponds to the strength of the reverse magnetic field when the magnetic induction intensity B reaches zero. In the diagram, this is typically represented in the demagnetization curve, which illustrates the process of reverse demagnetization from the saturation state, and when the value of the B-axis is zero, the value of the H-axis represents the coercivity Hc [15,29,30].
From Formula (10) for the calculation of energy density, it can be seen that the energy per unit volume in the core of the converter transformer must meet the following conditions:
u = 1 2 B r H c
Here, u denotes energy per unit volume in joules per cubic meter (J/m3). If it is necessary to calculate the total energy W demag required for the whole magnetic core, the energy per unit volume shall be multiplied by the volume V of the magnetic core, and the result is shown in Equation (11):
W demag = u × V = 1 2 B r H c V
The available capacitance energy must satisfy Equation (12):
W c W demag + W R
where WR is the energy dissipated by the resistor during this period, and its magnitude is presented in Equation (13).
W R = I C 2 R 2
Simultaneously with the above formula, Equation (12) can be rewritten as Equation (14):
1 2 C U c 2 1 2 B r H c V + e R 2 L t U C ( 0 ) 2 R 2 L 2 ( 1 L C ( R 2 2 L ) 2 ) sin 2 ( 1 L C ( R 2 2 L ) 2 t )
The range of values for C of the energy storage capacitor is as follows:
C B r H C V U c ( 0 ) 2 ( 1 2 R 2 L )
In the case of unknown remanence, in order to ensure that the energy of the energy storage capacitor can fully meet the needs of remanence measurement and demagnetization, the remanence magnitude B r is replaced with the saturation magnetic induction intensity B s . Then, Equation (15) can be changed to:
C B s H C V U c ( 0 ) 2 ( 1 2 R 2 L )
At the same time, the energy storage capacitor should place the circuit in an attenuation oscillation state, so the final value range of the capacitance should be obtained by combining Equation (3):
4 L C B s H C V U c ( 0 ) 2 ( 1 2 R 2 L )
In summary, Equation (17) allows for the determination of the upper and lower limits of the capacitor C’s set value while simultaneously achieving core degaussing in the shortest amount of time possible.

3.3. Verification Method of Remanence Measurement Results

According to the principle of remanence generation, the excitation inductance will vary with the change in instantaneous permeability under different levels of remanence, and the calculation formula for the excitation inductance is shown in Equation (18).
L = N × μ S N I l I = N 2 μ S l
In the above equation, N represents the number of turns of the coil, μ denotes the permeability, S indicates the cross-sectional area, and l signifies the length of the magnetic circuit [15,31,32,33].
According to the “DL/T 2225-2021 DC Demagnetization Test Guidelines for Power Transformers”, the conclusion of the remanence measurement can be established by comparing the excitation inductance values before and after the remanence measurement.

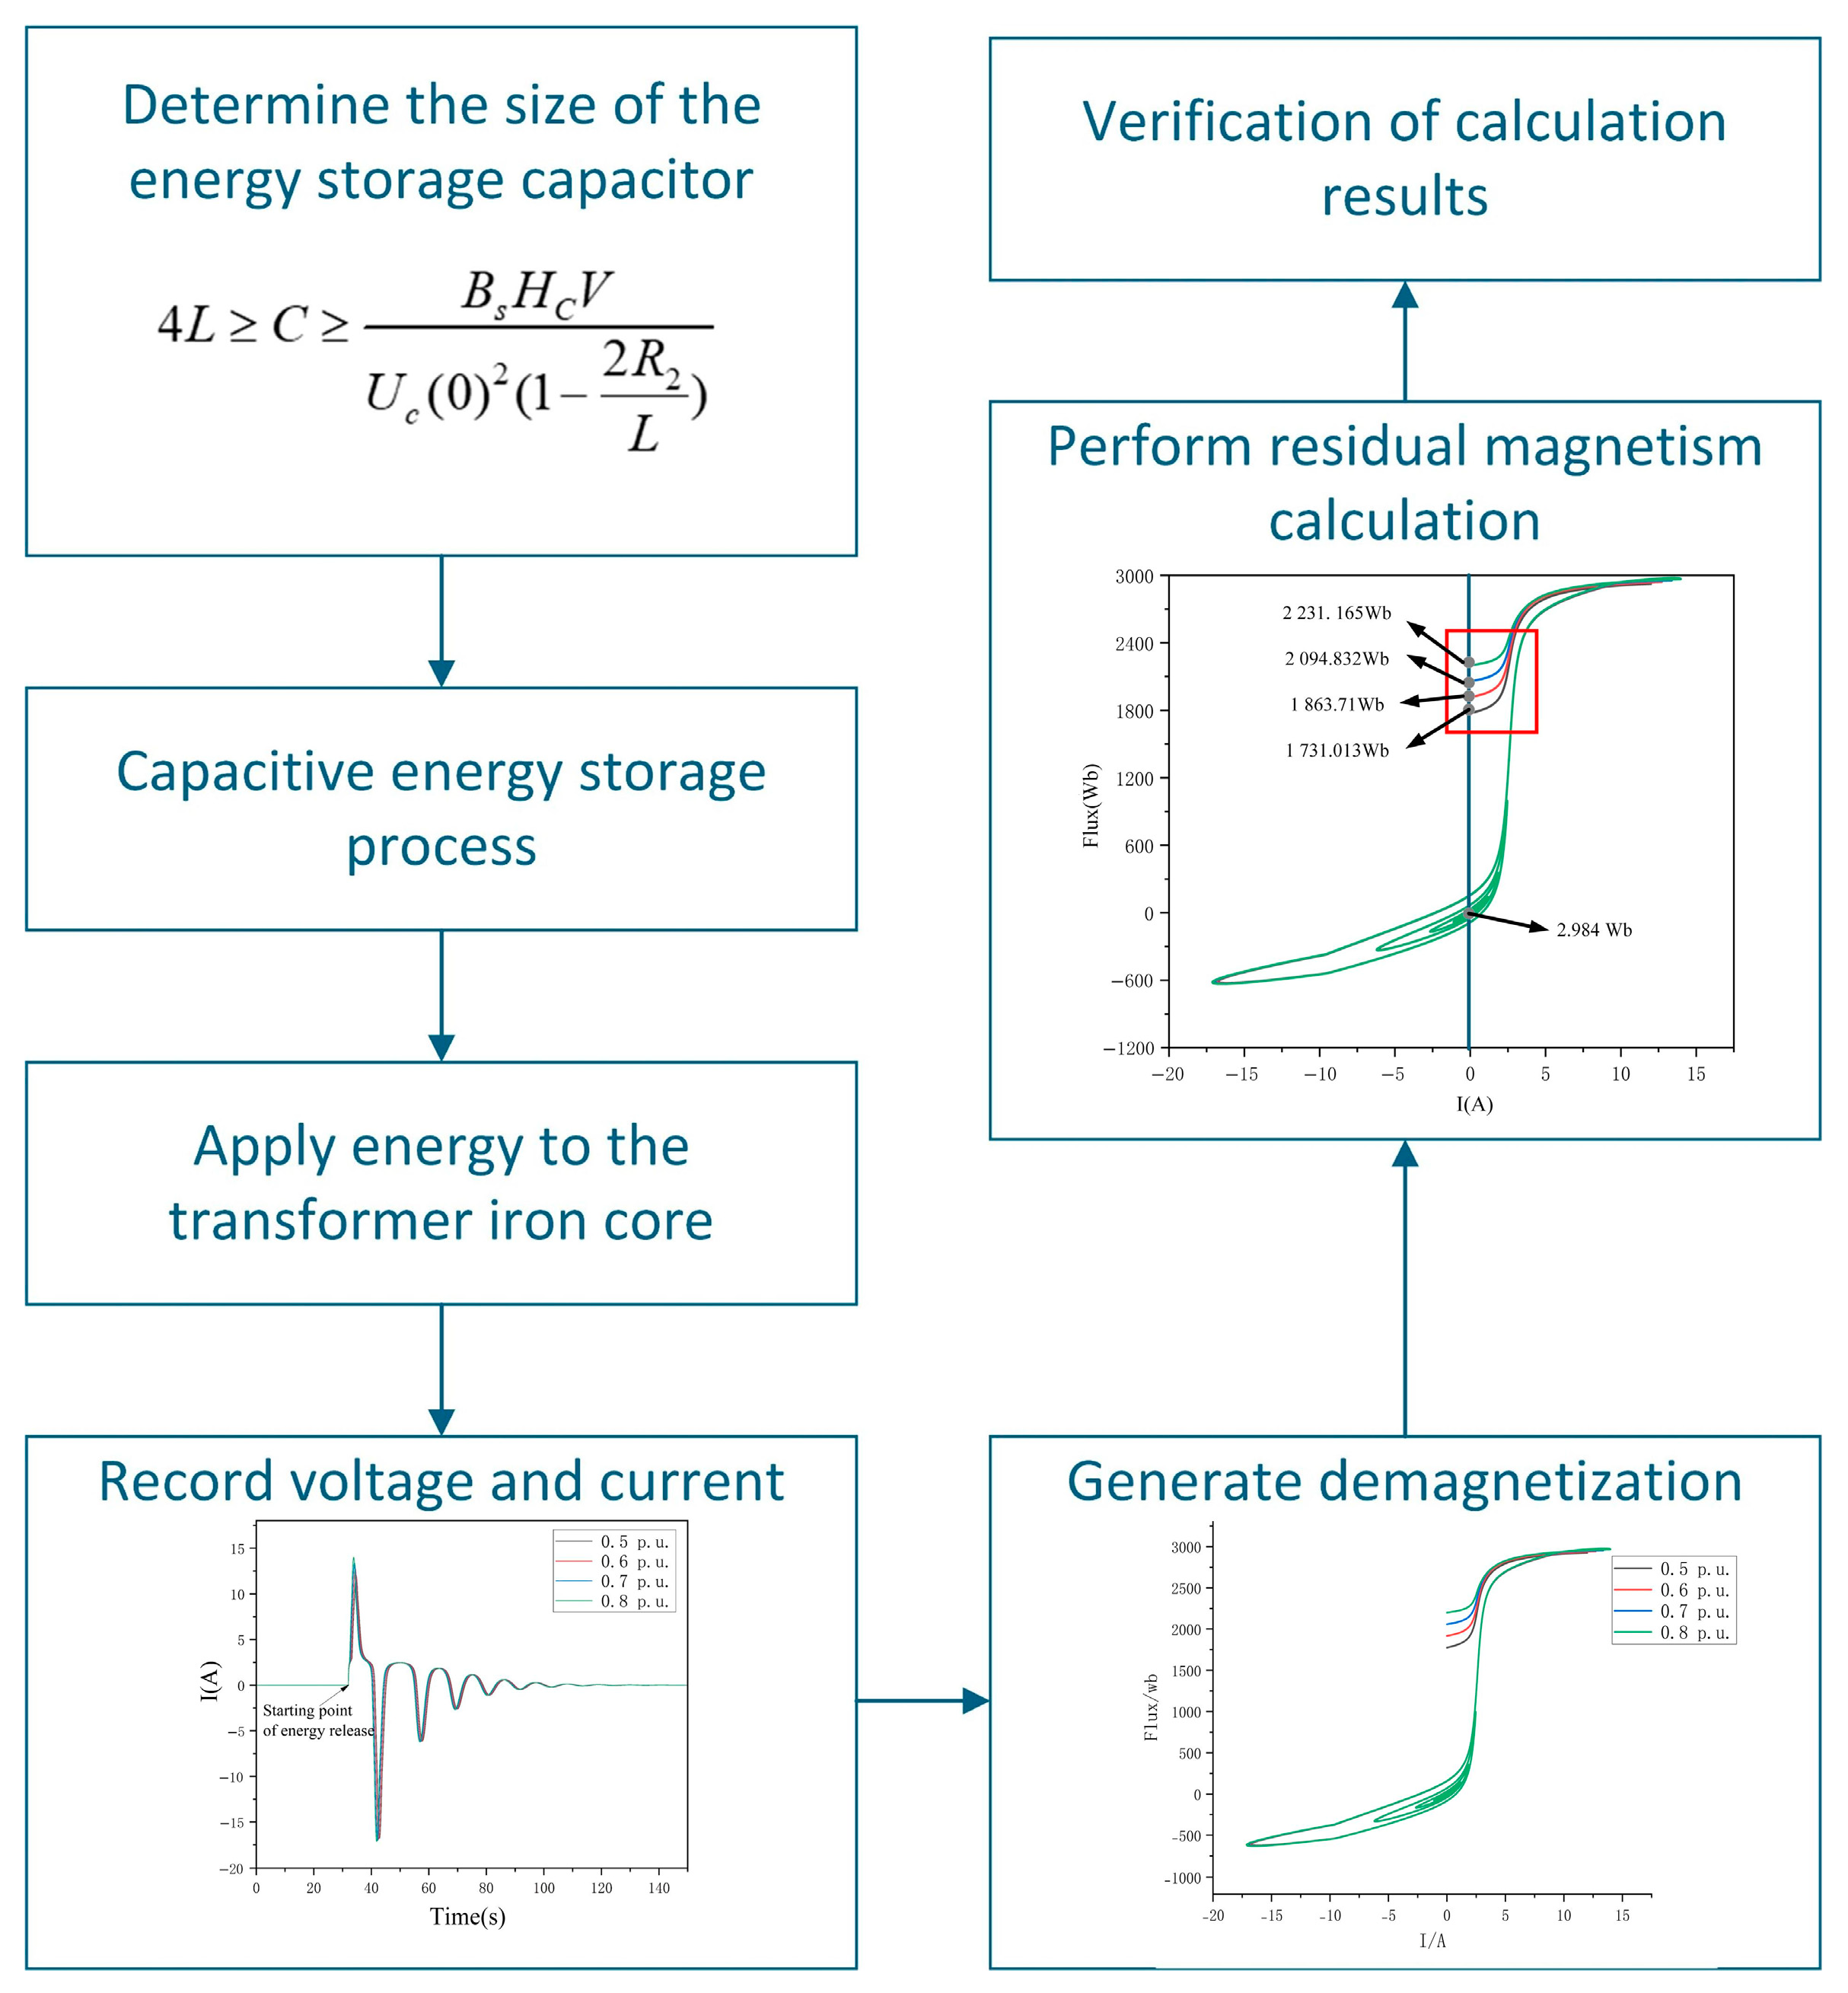
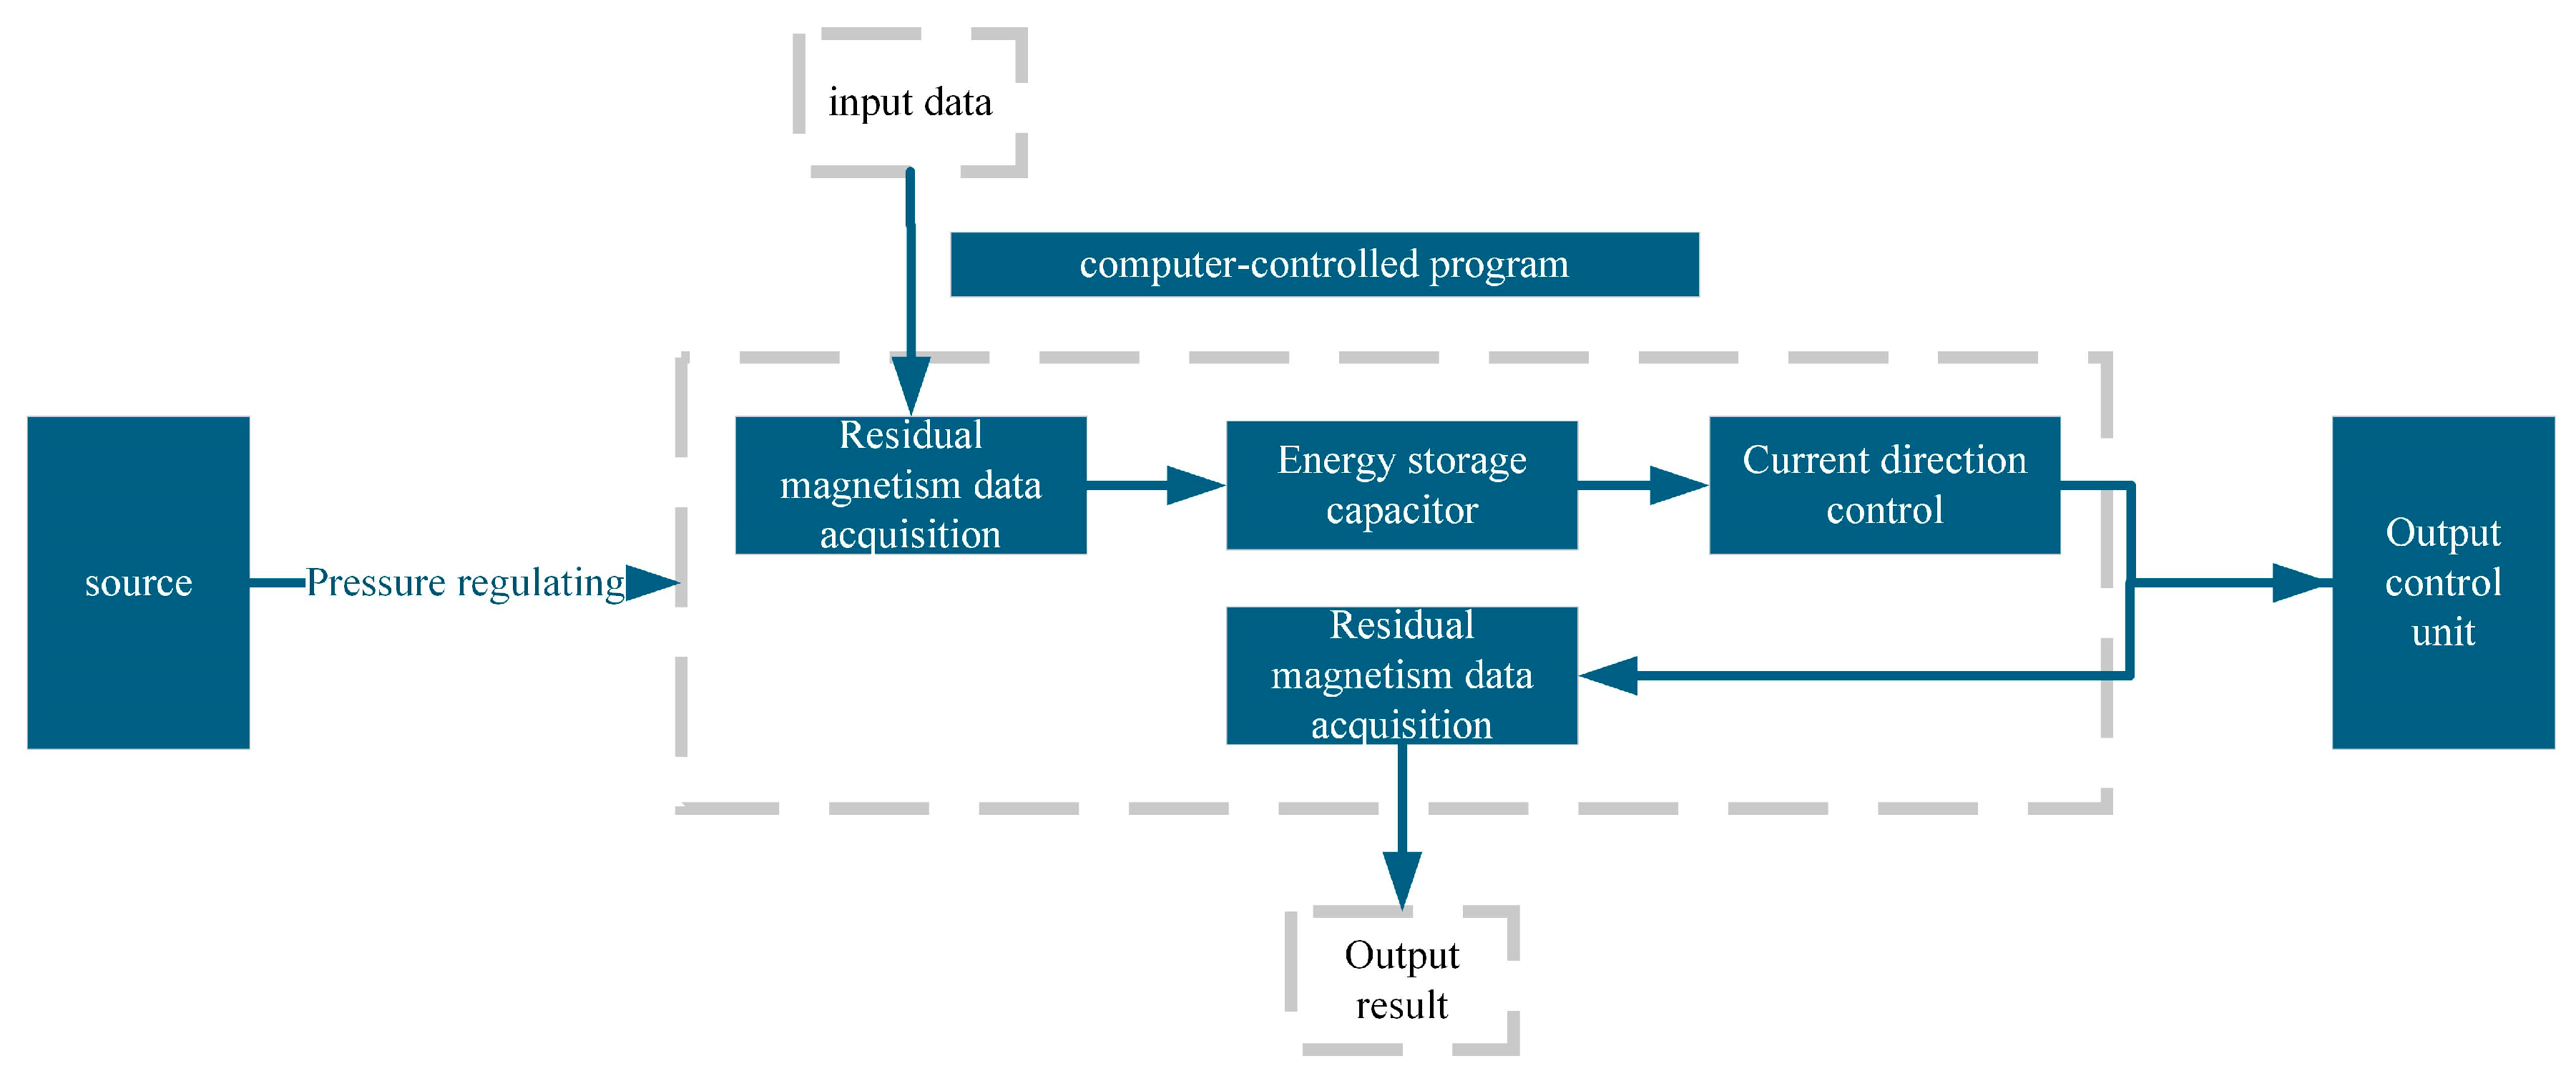
3.4. Overall Methodology Flow

The overall process of this method is illustrated in Figure 4, and the specific method flow can be divided into the following steps:
  • Calculate the energy storage capacitance according to Equation (17).
  • Apply DC voltage to the energy storage capacitor to make the voltage reach Uc(0).
  • After the capacitor voltage is reached and stabilized, the attenuation oscillation current is released to the transformer winding.
  • Record the voltage and current data during the release process.
  • Convert the voltage and current data into a demagnetization hysteresis loop.
  • Calculate the remanence based on the demagnetization hysteresis loop.
  • Verify the calculation results based on the change in excitation inductance of the transformer.

4. Analysis of the Simulation Results of the Proposed Method
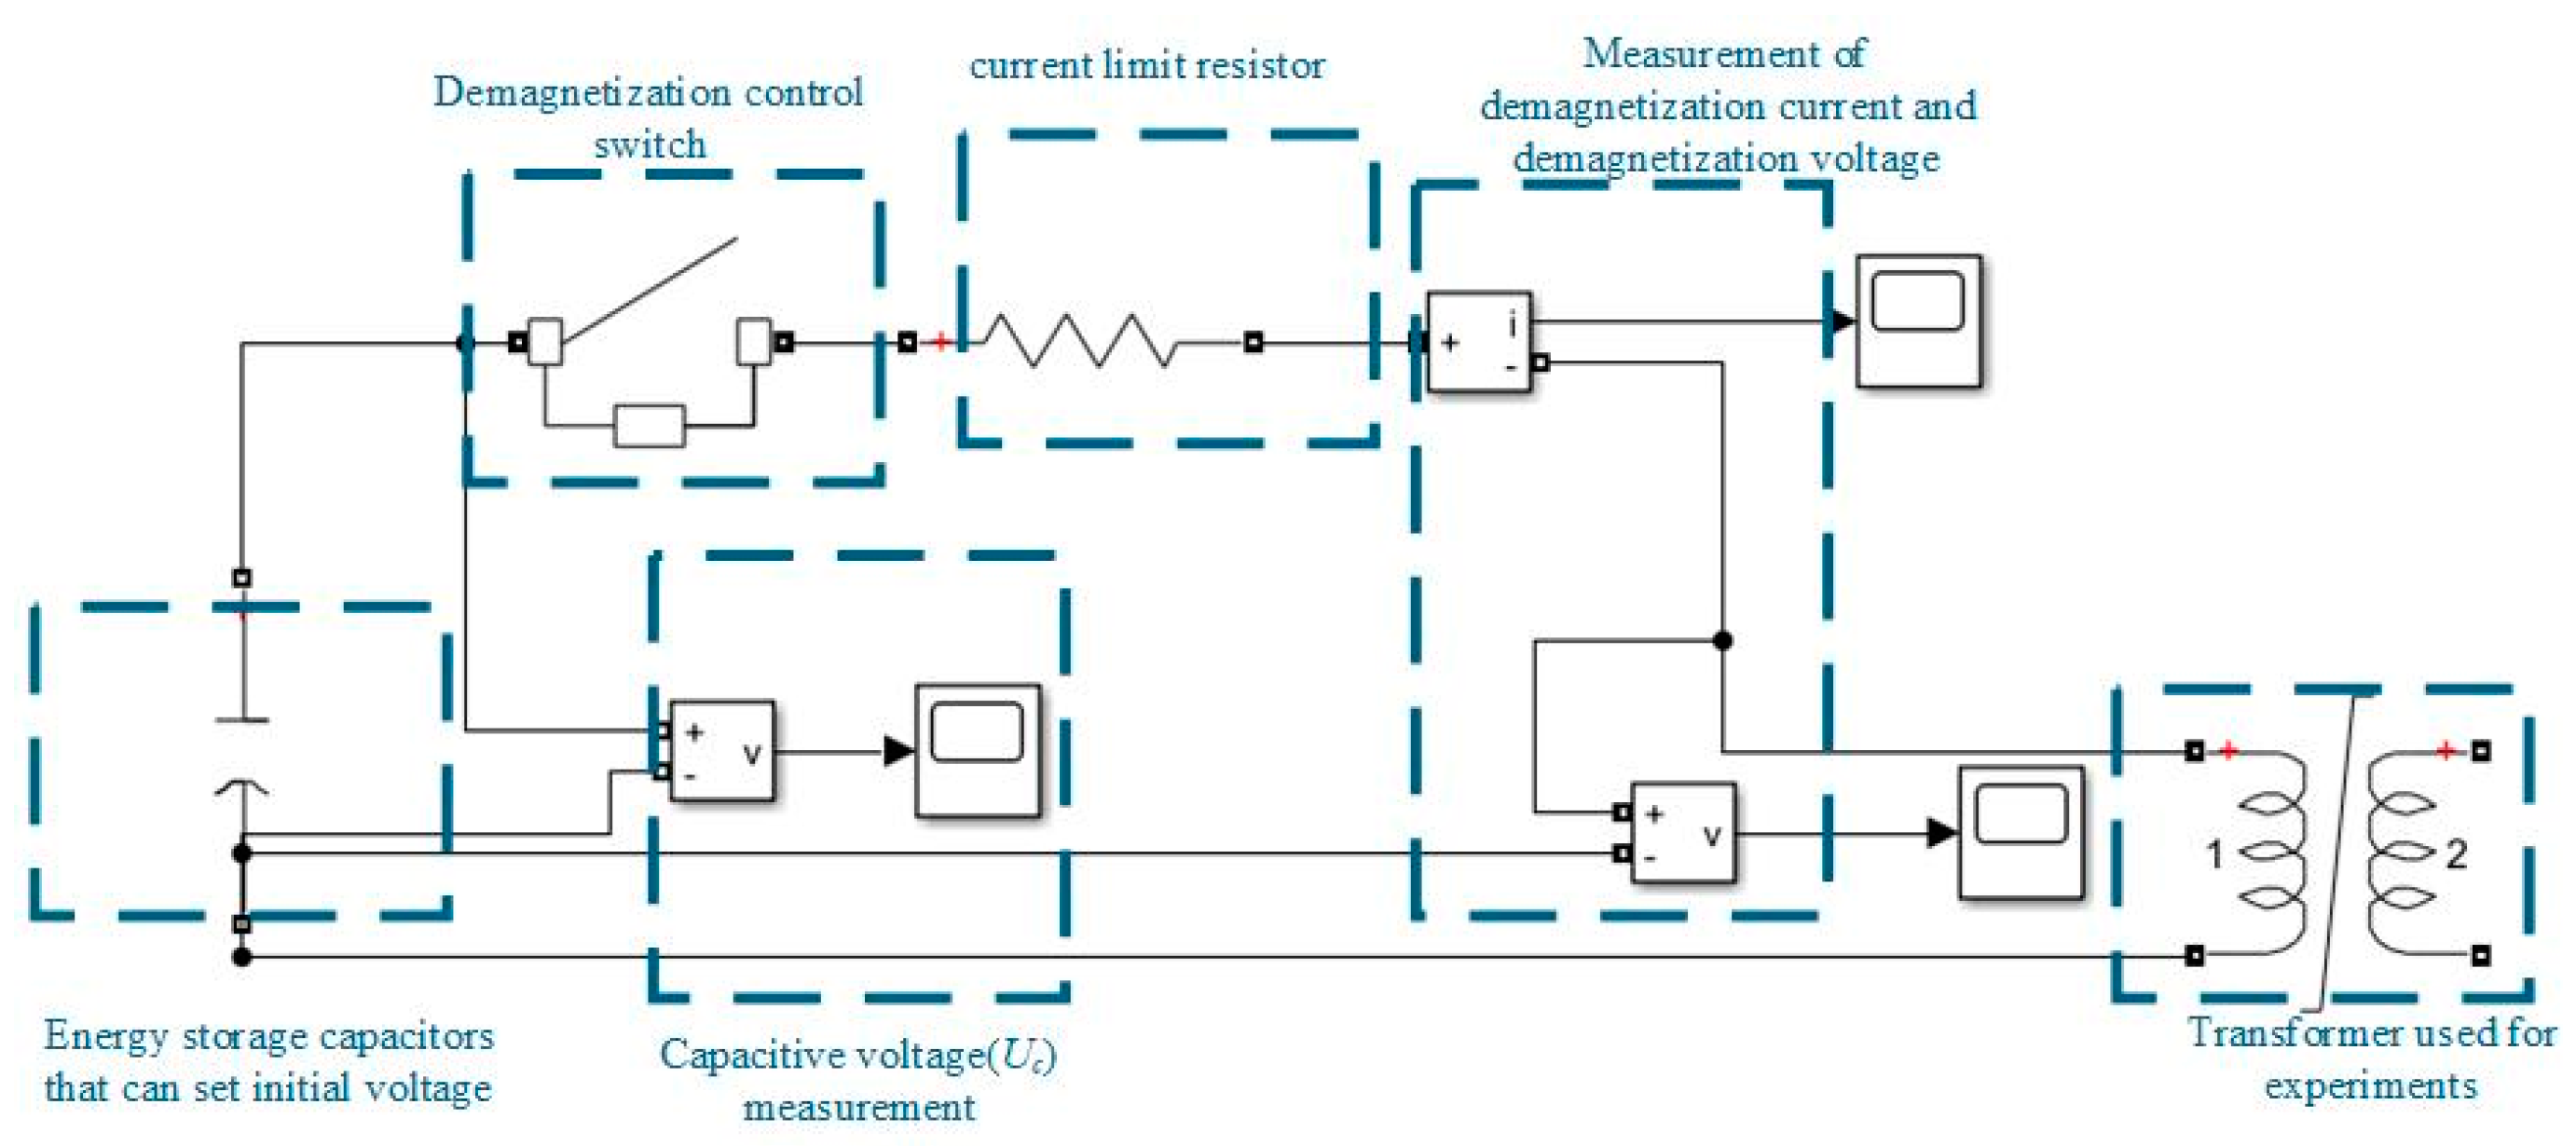
The core and windings of the transformer are accurately modeled in the simulation software. Then, the parameter settings for the transformer are determined based on the structural dimensions of its core.

4.1. Model Building

The method proposed in this paper models a single-phase converter transformer equipped with an external energy storage capacitor circuit. The core parameters, hysteresis characteristics, and material properties of the core are configured. The simulation circuit, derived from the equivalent circuit, is shown in Figure 5. It includes a set of windings: the grid-side winding and the valve-side winding of the converter transformer. One end of the windings is connected to the external energy storage capacitor circuit, while the other end is connected to an output port. Table 1 lists the parameters of the converter transformer.

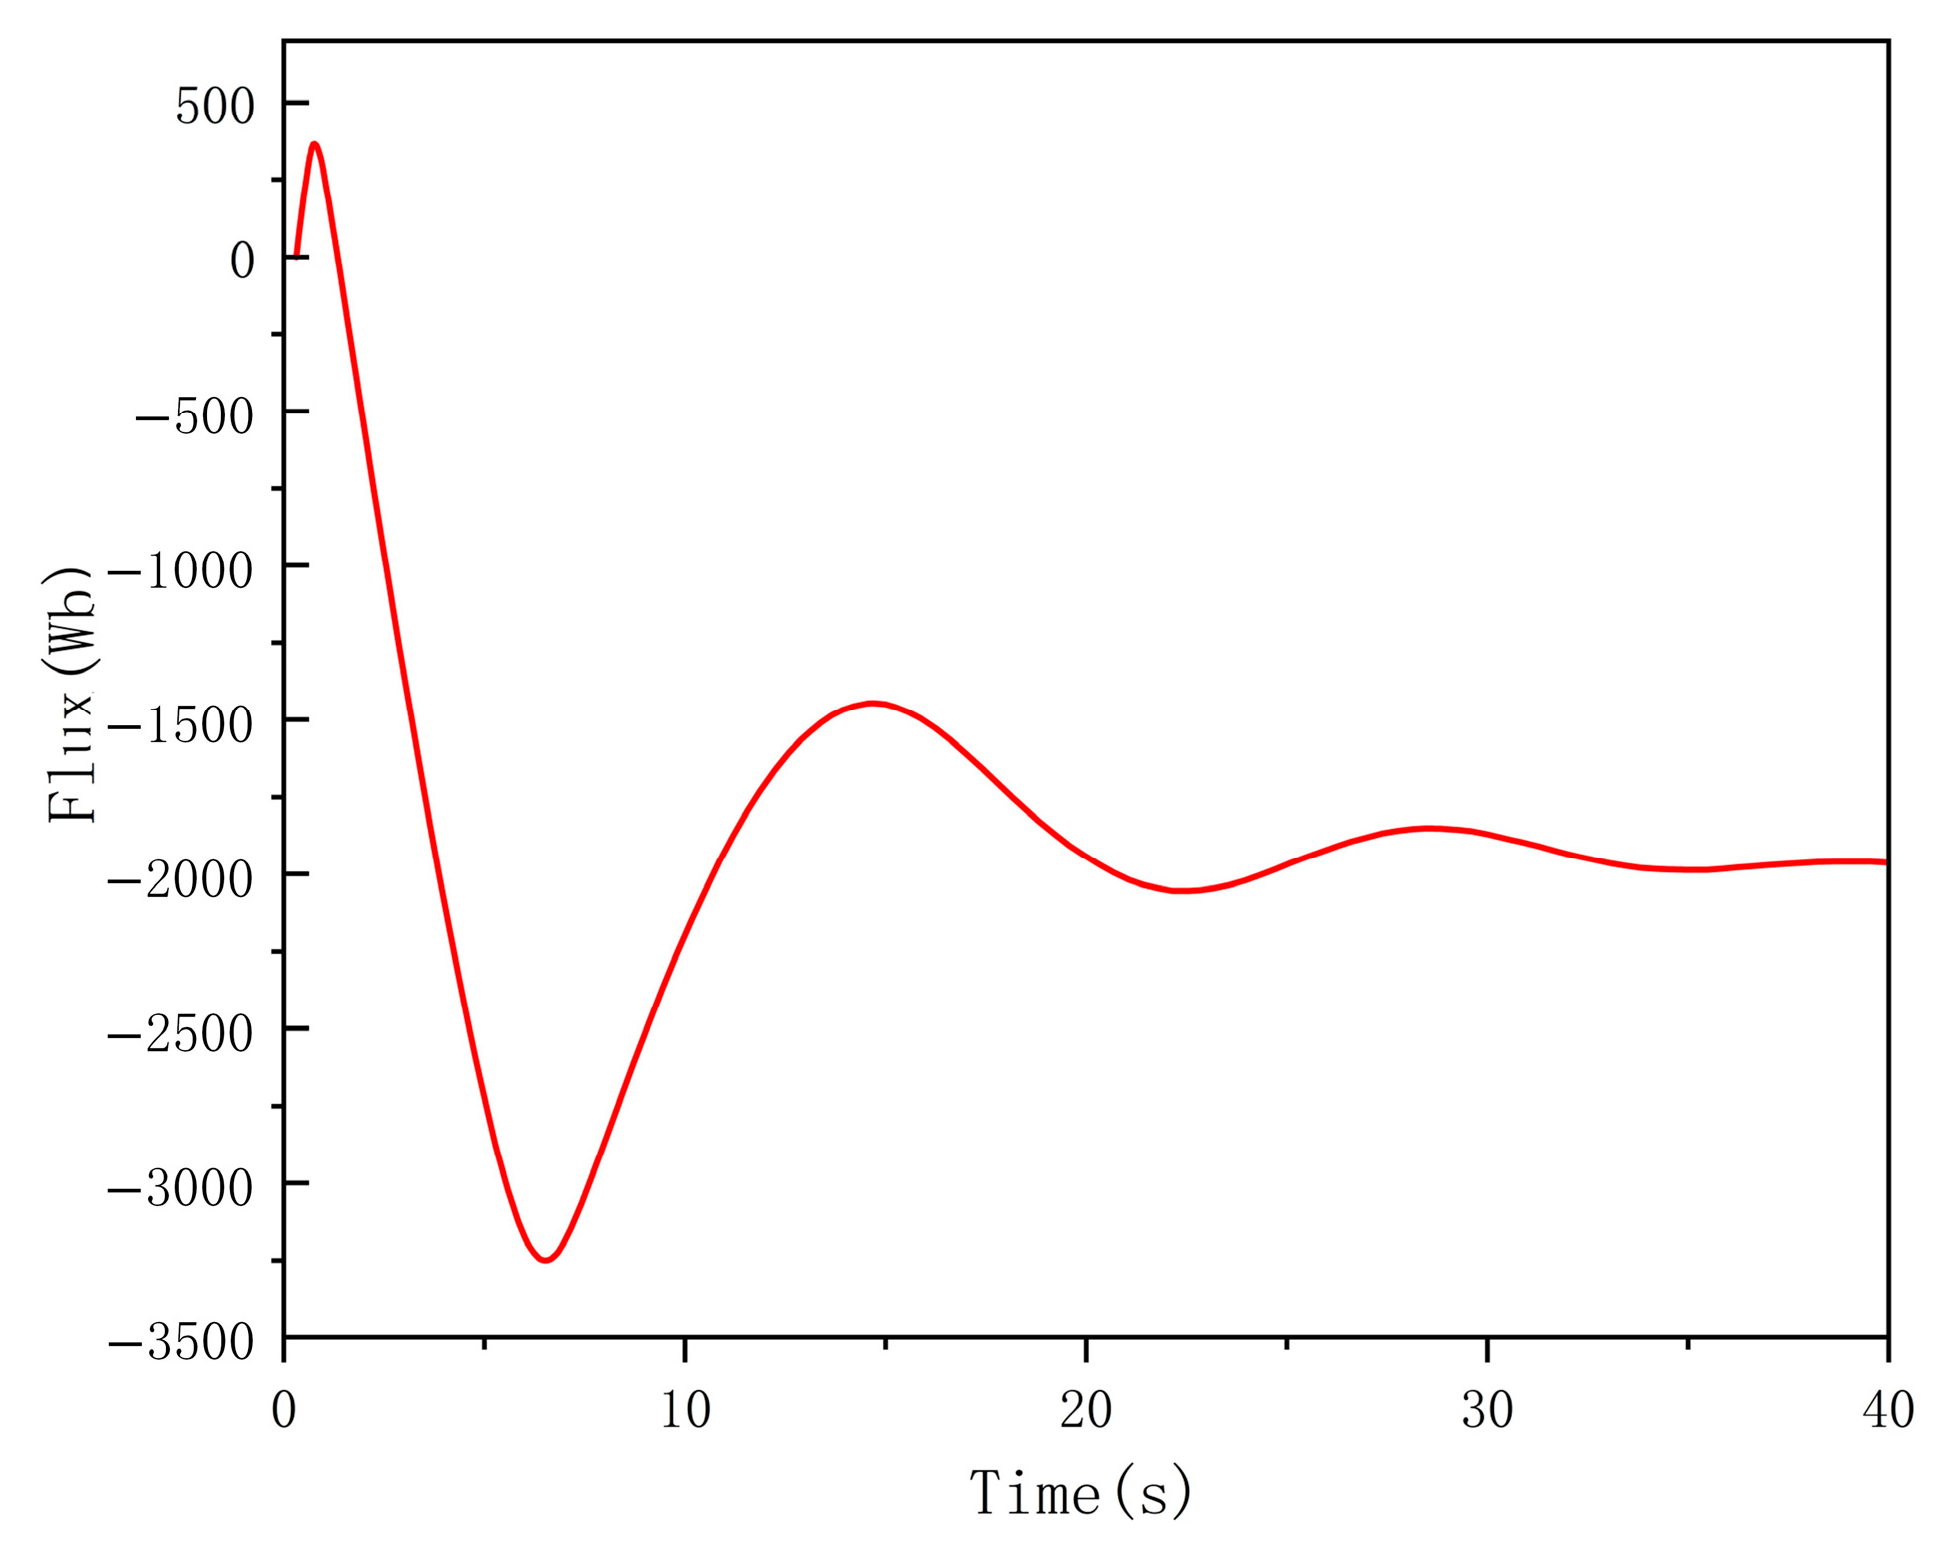
4.2. Simulation Results

The residual magnetism in the simulation software is set and simulation experiments with a residual magnetism of 0.5 p.u., 0.6 p.u., 0.7 p.u., and 0.8 p.u. are conducted. The change in current during the charging and discharging of the energy storage capacitor is shown in Figure 6.
According to the above formula, the voltage data are integrated, and the flux change curve in the process of energy release from the energy storage capacitor is obtained, as shown in Figure 7.

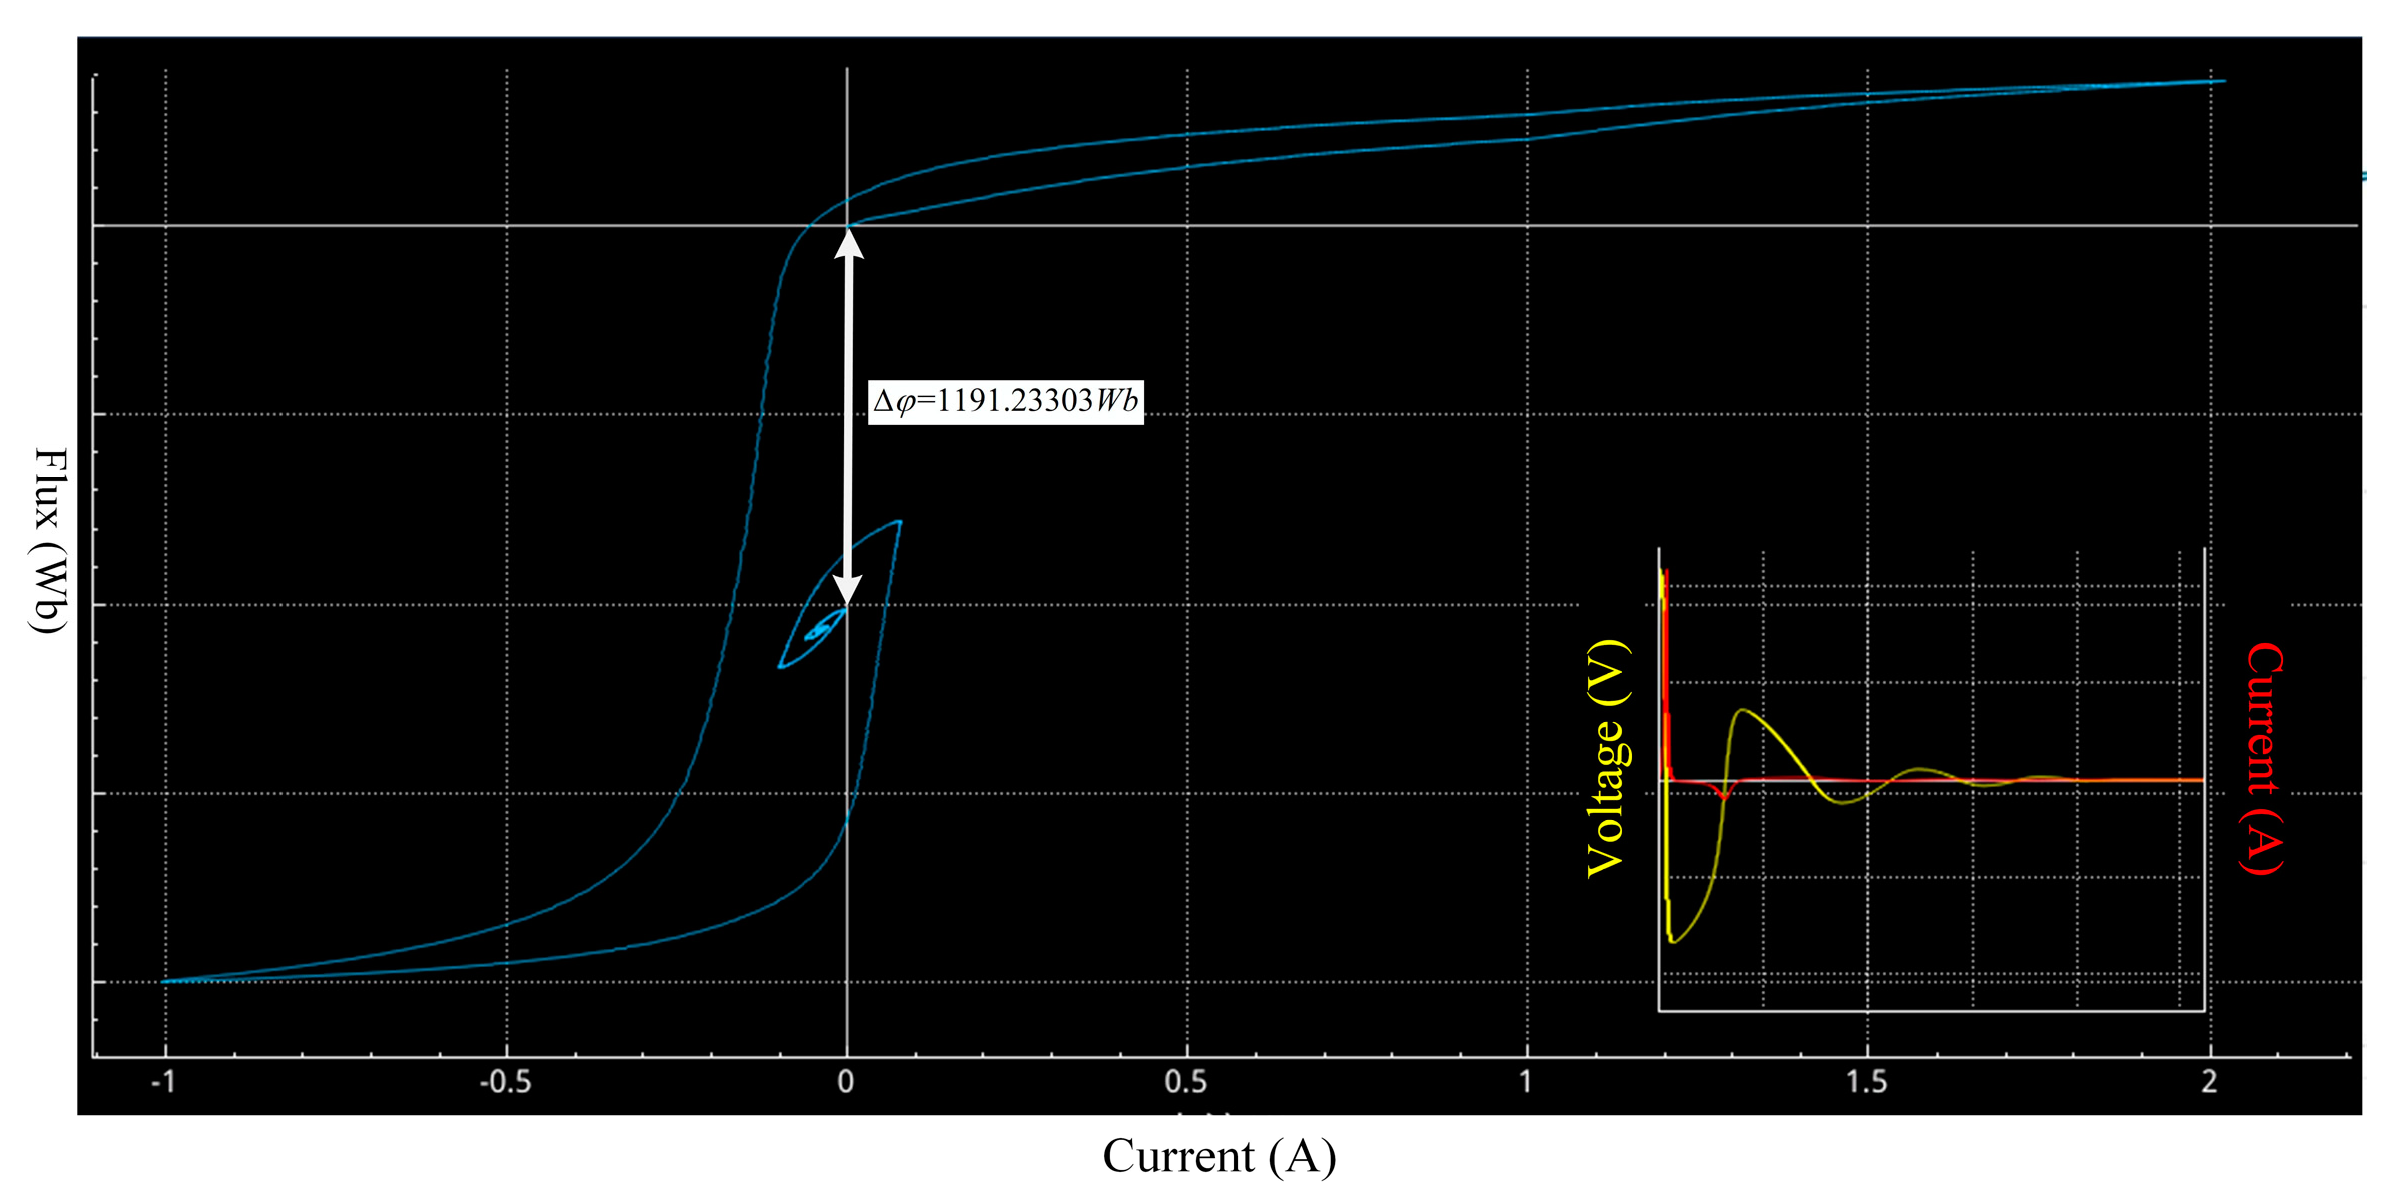
4.3. Calculation of Simulation Results and Error Analysis

In the process of converting voltage to flux, this method can introduce errors, although it is possible to obtain the flux change curve of the converter core when the energy is released by the energy storage capacitor to determine the remanence measurement throughout the process. Specifically, when the flux value reaches 0 Wb, the current is still oscillating, indicating that the demagnetization process has not been fully completed. Therefore, directly calculating the difference between the starting point and the endpoint during the measurement process will lead to inaccurate remanence measurements and may affect the degaussing effect. In view of this, the degaussing hysteresis loop method is used to measure the remanence magnitude, which not only provides more accurate measurement results but also makes the method clearer and easier to understand from an intuitive point of view, which is convenient for actual measurement operations in the field [34,35,36].
In this case, the degaussing hysteresis loop is plotted based on the current and flux change data, and the result is shown in Figure 8.
It can be seen that the change in the degaussing hysteresis loop is similar to the set hysteresis model, and it can be seen that the hysteresis curve is shrinking, which is in line with the principle of degaussing [10,25,37].
The calculation method can be understood as assuming that the original remanence, a Wb, corresponds to the starting point of remanence measurement, and the remanence after energy injection is b Wb, corresponding to the endpoint of remanence measurement. The starting point and the endpoint are on the ordinate axis, and the difference between the two can represent the change in remanence in the measurement process. When b = 0 (the external energy makes the remanence completely eliminated), the difference between the starting point and the endpoint (ab) Wb is the original remanence [38,39].
In the specific calculation process, the process of determining the size of the remanence is as follows:
  • Confirm the intersection of the hysteresis loop with the longitudinal axis (i = 0).
  • To determine the intersection point with the longitudinal axis (i = 0) in the dynamic hysteresis loop, two intersection points should be determined. One is the intersection point with the largest absolute value of the flux, which can be determined as the starting point of the measurement, and the other is the intersection point with the smallest absolute value of the flux, which can be determined as the endpoint of the measurement.
  • Calculate the amount of change in remanence during the drawing of the dynamic hysteresis loops.
  • Subtract the magnitude of the remanent flux represented by the two intersections to obtain the remanence measurement.
The remanence values are calculated according to the above method, the data are shown in Figure 8, and the measurement results are shown in Table 2.
From the error analysis, it can be seen that the error size can be controlled to within 5% by measuring the remanence by the degaussing hysteresis loop method, it has a good measurement accuracy under the condition of high remanence, and the remanence size is only 2.984 Wb after the measurement, which can be regarded as the end of degaussing, which satisfies the engineering needs of the remanence measurement and the demagnetization of the converter transformer in the actual engineering.

5. Experimental Verification Based on a Toroidal Transformer

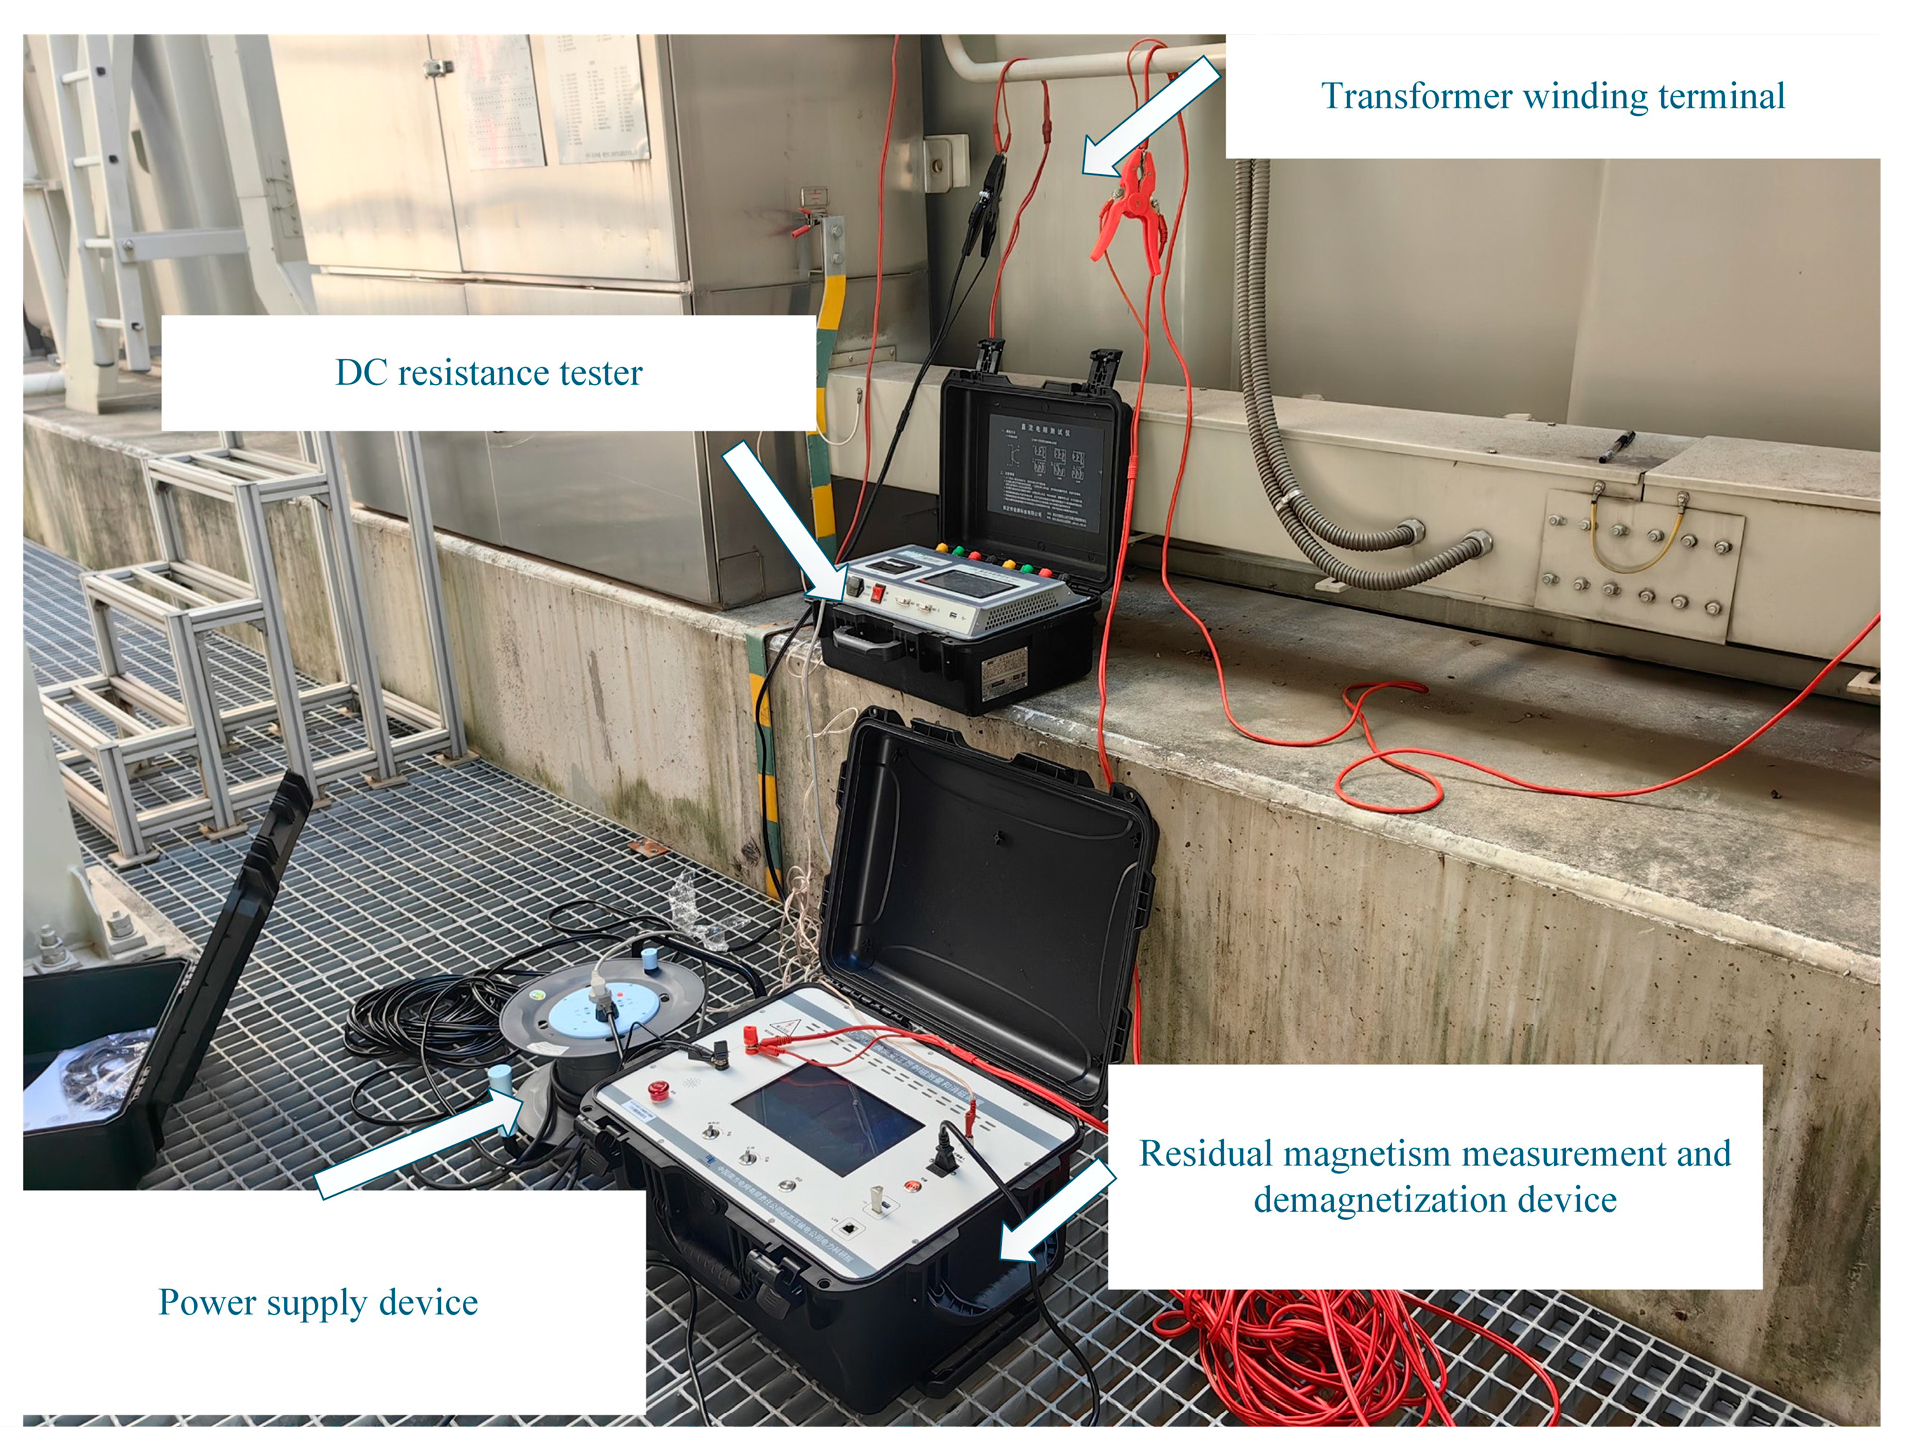
5.1. Experimental Platform Construction

The remanence measurement experiment based on the degaussing hysteresis loop was carried out in the toroidal transformer, and the experimental wiring diagram is shown in Figure 9.
Referring to Figure 3, an experimental circuit for remanence measurement based on the degaussing hysteresis loop is built, which contains (1) the host computer (used to control the signal generator to charge the energy storage capacitor), (2) the function signal generator (used to generate DC voltage), (3) the power amplifier, (4) the current limiting resistor R1, (5) capacitor C (withstanding a voltage of 35 V rms, 470 uF) switch S1 (used to control the energy storage capacitor charge), (6) a toroidal transformer, (7) sampling resistor R2 (used to facilitate the oscilloscope to collect the current signal on the primary side of the transformer), (8) switch S2 (used to control the output oscillation attenuation current of the energy storage capacitor), and (9) an oscilloscope (to collect the primary side current of the transformer). The parameters of the toroidal transformer are shown in Table 3.

5.2. Methods of Degaussing and Magnetization Before Experiments

In order to ensure the accuracy of the experiment, it is necessary to degauss and magnetize the toroidal transformer before each experiment, degauss the transformer by generating a constant frequency variable voltage signal through the signal generator, and measure the excitation inductance value of the transformer with the RCL digital bridge instrument as the basis for judgment to determine the completion of the degaussing of the transformer. According to multiple measurements, when the excitation inductance of the transformer tends to the value of 18.944 mH, it will gradually stop changing, which can be regarded as the end of degaussing. The degaussing waveform is shown in Figure 10.
For the primary winding, a variety of amplitude DC pulses with a width of 9 ms are provided, the magnetic flux of the remanence preset is obtained by integrating the voltage waveform on the secondary side, and then the size of the remanence preset Br is obtained according to Equation (17). The magnetization results are shown in Figure 11.
B r = φ S
where φ is the preset magnetic flux, and S is the magnetic flux cross-sectional area. The inner and outer diameters of the toroidal transformer are 50 mm/100 mm, and the height is 45 mm, so the magnetic flux cross-sectional area S is 0.001125 m2.

5.3. Remanence Measurement Results and Error Analysis

Before the experiment, the transformer was magnetized to make the remanence size about 0.5 T, 0.6 T, 0.7 T, and 0.8 T.
In the process of the experiment, by setting the output rectangular square wave in the host computer control software, the energy storage capacitor C is charged, and according to the principle of voltage division and the energy calculation formula, it can be preliminarily calculated that when the voltage output of the DC source terminal is 20 V, the capacitor energy storage is about 0.09198 J.
At this time, switch S1 is disconnected and switch S2 is closed, so the energy storage capacitor stores the electric energy and releases it to the transformer winding for demagnetization. The voltage and current in the degaussing process are shown in Figure 12 and Figure 13, and 0.5 T is taken as an example.
From the voltage and current data, the dynamic hysteresis is drawn, the dynamic hysteresis loop is smoothed based on the above method to remove the data error caused by the influence of oscilloscope noise, the smoothed degaussing hysteresis loop is obtained as shown in Figure 14, and the time when I = 0 is intercepted in the figure is determined to obtain the measurement data as shown in Table 4.
As can be seen from Table 4, the starting remanence values are close to the set value, but not identical, which may be an error in the measurement process. The endpoint remanence value is close to zero, indicating that the remanence value has been effectively eliminated.
The percentage error ranges from 1.719% to 4.134%, and the average error is 2.1715%, which indicates that the method maintains a high accuracy at different setpoints. The small difference between the starting remanence value and the set value, as well as the near-zero remanence value at the endpoint, further demonstrates the effectiveness of the method.

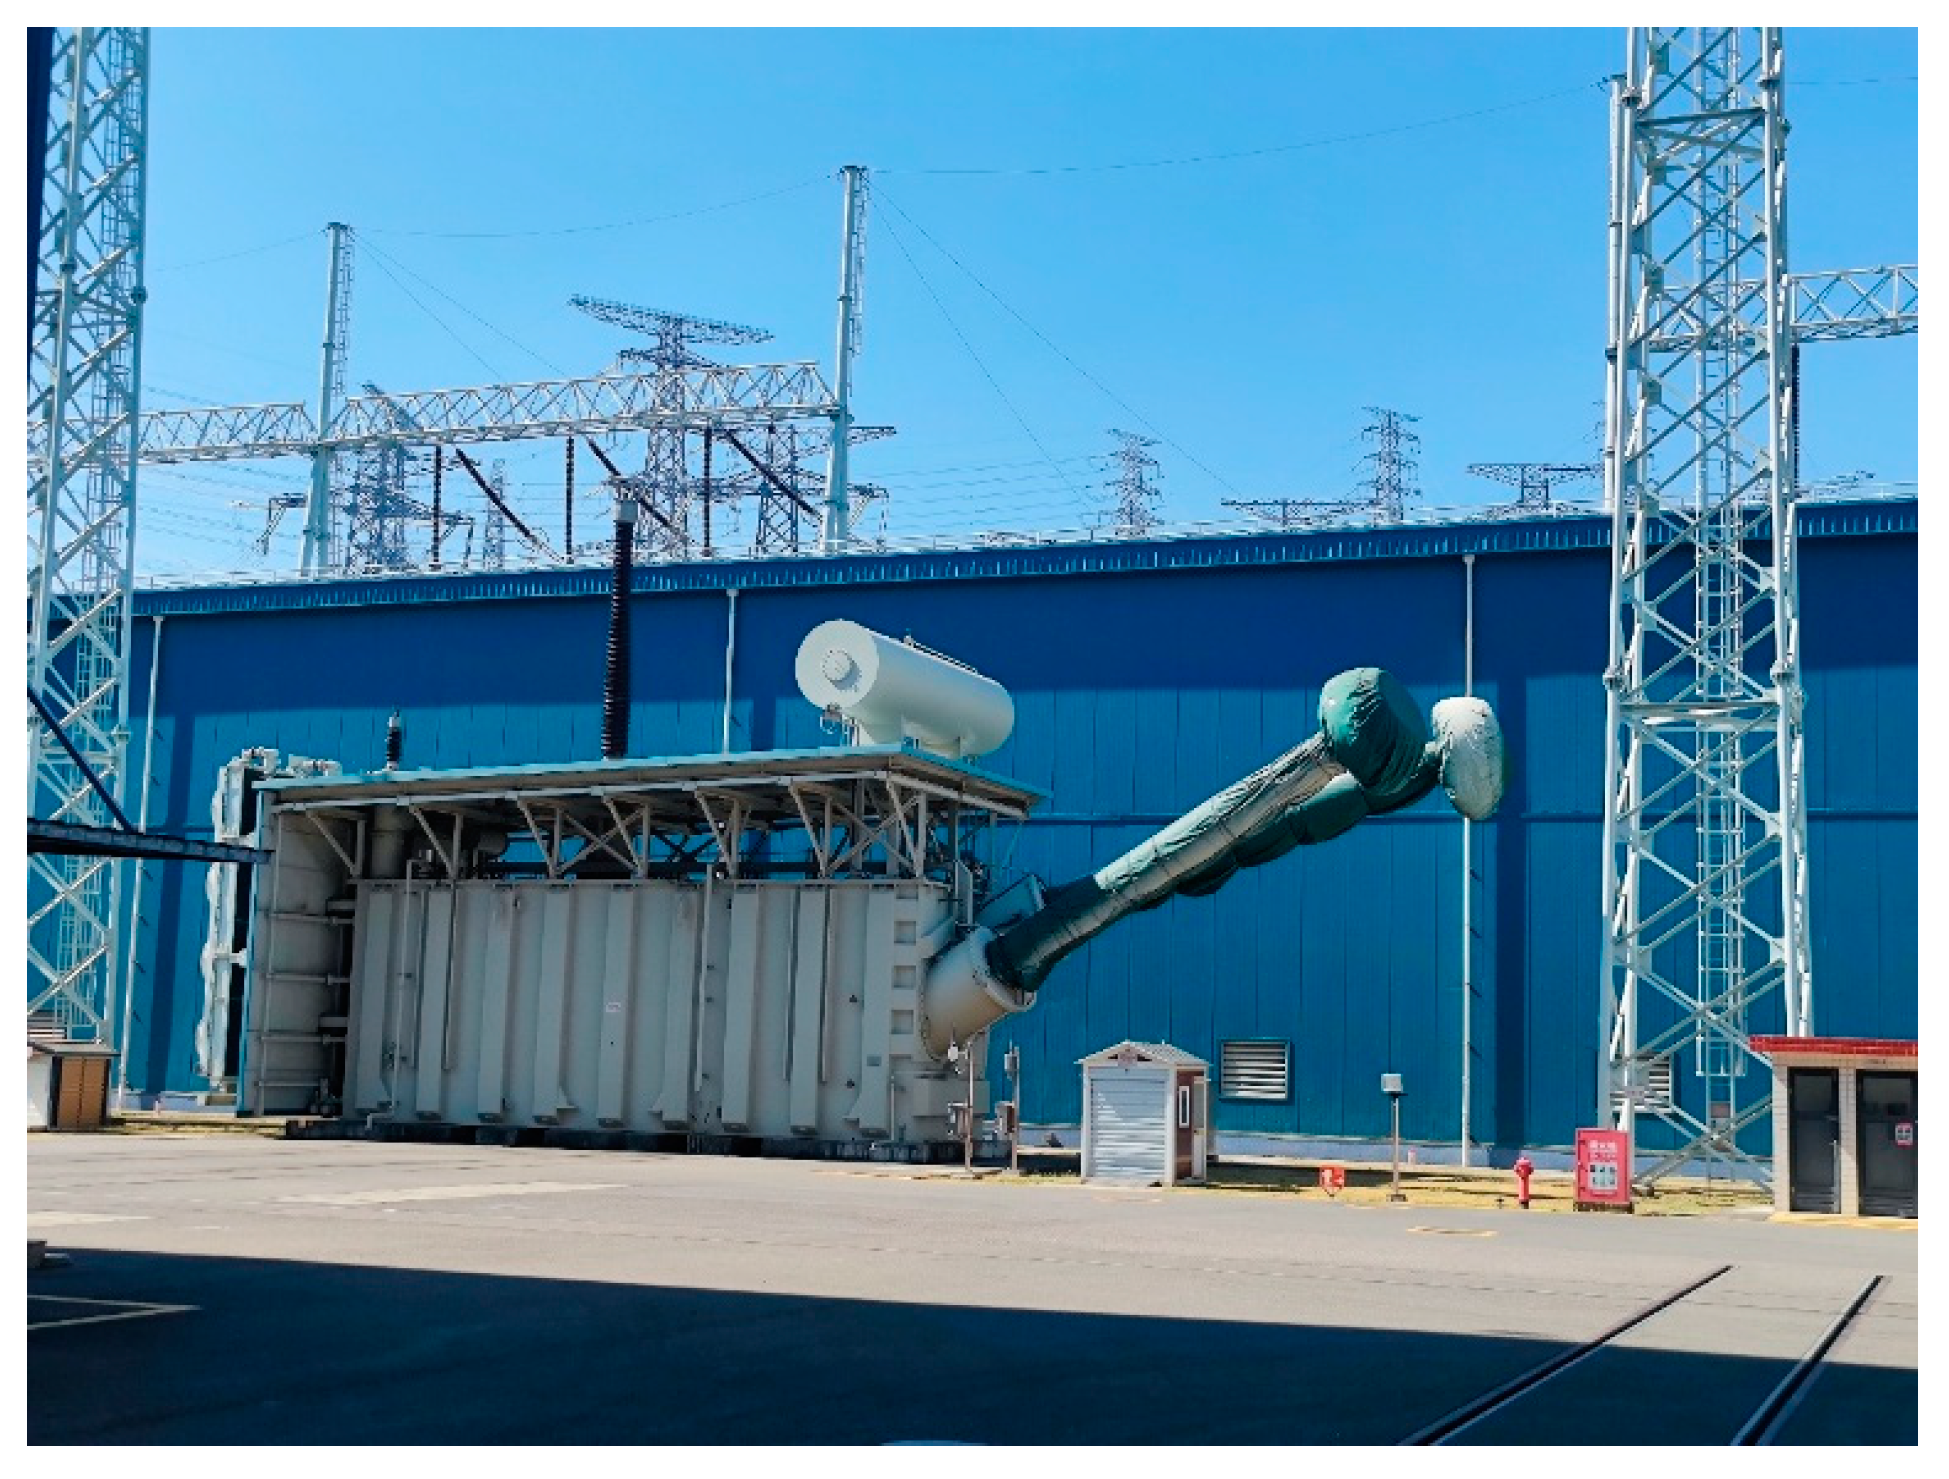
6. On-Site Experimental Measurement and Results Analysis of Converter Transformer

6.1. Introduction to Converter Transformer Parameters

The DC resistance tested converter transformer from the Dongfang converter station in Shenzhen is selected as the experimental object. The actual transformer of the Dongfang converter station is shown in Figure 15.
The converter transformer tested in this article is produced by TBEA (Changji, Xinjiang, China). The transformer model is a ZZDFPZ-237400/500-600 single-phase double winding converter transformer, and the transformer nameplate is shown in Table 5.

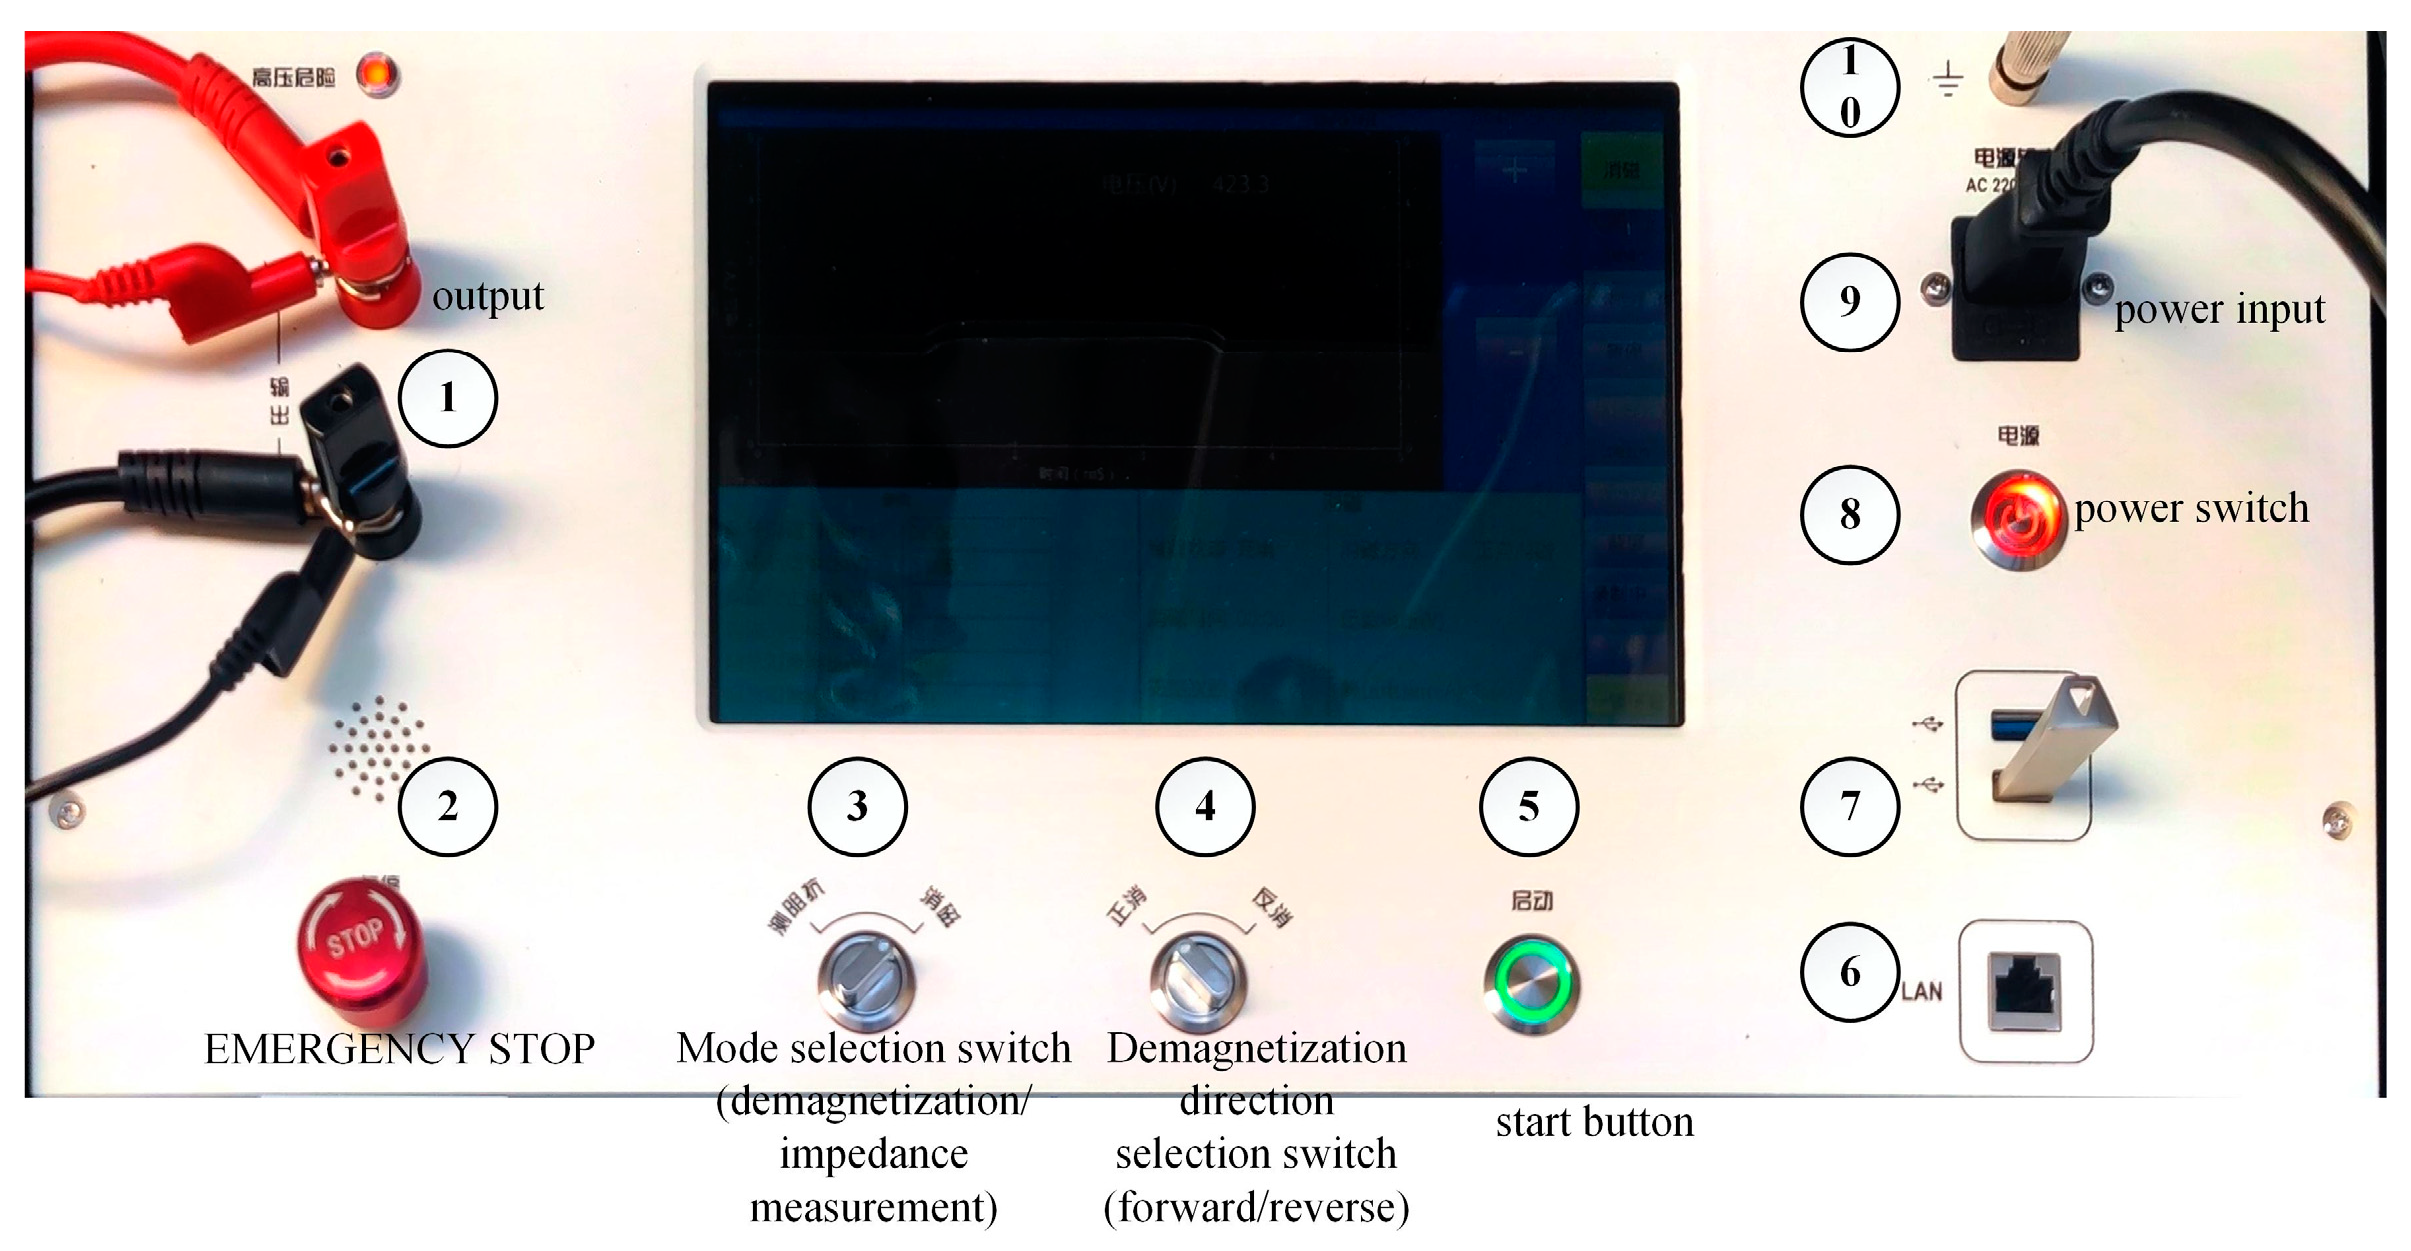
6.2. Introduction and Operation Process of Integrated Device for Residual Magnetism Measurement and Demagnetization

Figure 16 is a schematic diagram of the residual magnetization measurement and demagnetization device for the converter transformer, where ① is the voltage output terminal, ② is the emergency stop button, ③ is the mode switch button (which can be switched to impedance measurement mode or demagnetization mode), ④ is the demagnetization direction switch (which can choose forward demagnetization or reverse demagnetization), ⑤ is the start button (which can start the demagnetization process or impedance measurement process), ⑥ and ⑦ are the RJ45 and USB output ports, ⑧ is the device’s main switch, ⑨ is the power input port, and ⑩ is the device ground interface. The main technical indicators of the device are shown in Table 6:
This residual magnetism elimination device mainly consists of a computer control unit, device power supply, residual magnetism data acquisition unit, energy storage capacitor, current direction controller, demagnetization data acquisition unit, and output control unit. The computer control unit serves as the main control CPU and is connected to the device power supply, intelligent high-voltage voltage regulation unit, residual magnetism data acquisition unit, energy storage capacitor, current direction controller, demagnetization data acquisition unit, and output control unit to achieve the control and data exchange of each unit. The power supply of the device provides power for the computer control unit and intelligent high-voltage regulation unit, and is also the power source for the energy storage capacitor. The voltage regulating unit is connected to the residual magnetism data acquisition unit and the energy storage capacitor, and the residual magnetism data acquisition unit transmits the data to the output control unit. The energy storage capacitor is connected to the current direction controller, which receives instructions from the computer control unit and adjusts the output according to the state of the energy storage capacitor. Its output is connected to the demagnetization data acquisition unit, and the data are ultimately fed back to the output control unit. The output control unit integrates information from the residual magnetization data acquisition unit, demagnetization data acquisition unit, and computer control unit to control the demagnetization transformer winding and achieve residual magnetization elimination function. The hardware logic diagram of the demagnetization device is shown in Figure 17.
The operation process of using demagnetization device is as follows:
(1)
Place the device in a safe environment, correctly connect the output voltage output terminal and ground wire before starting the device, and then connect the device to the power supply and start it.
(2)
Set the voltage value for impedance measurement and measure the impedance of the tested converter transformer at low voltage as a judgment for demagnetization completion.
(3)
Set the voltage of the capacitor and pre-charge it.
(4)
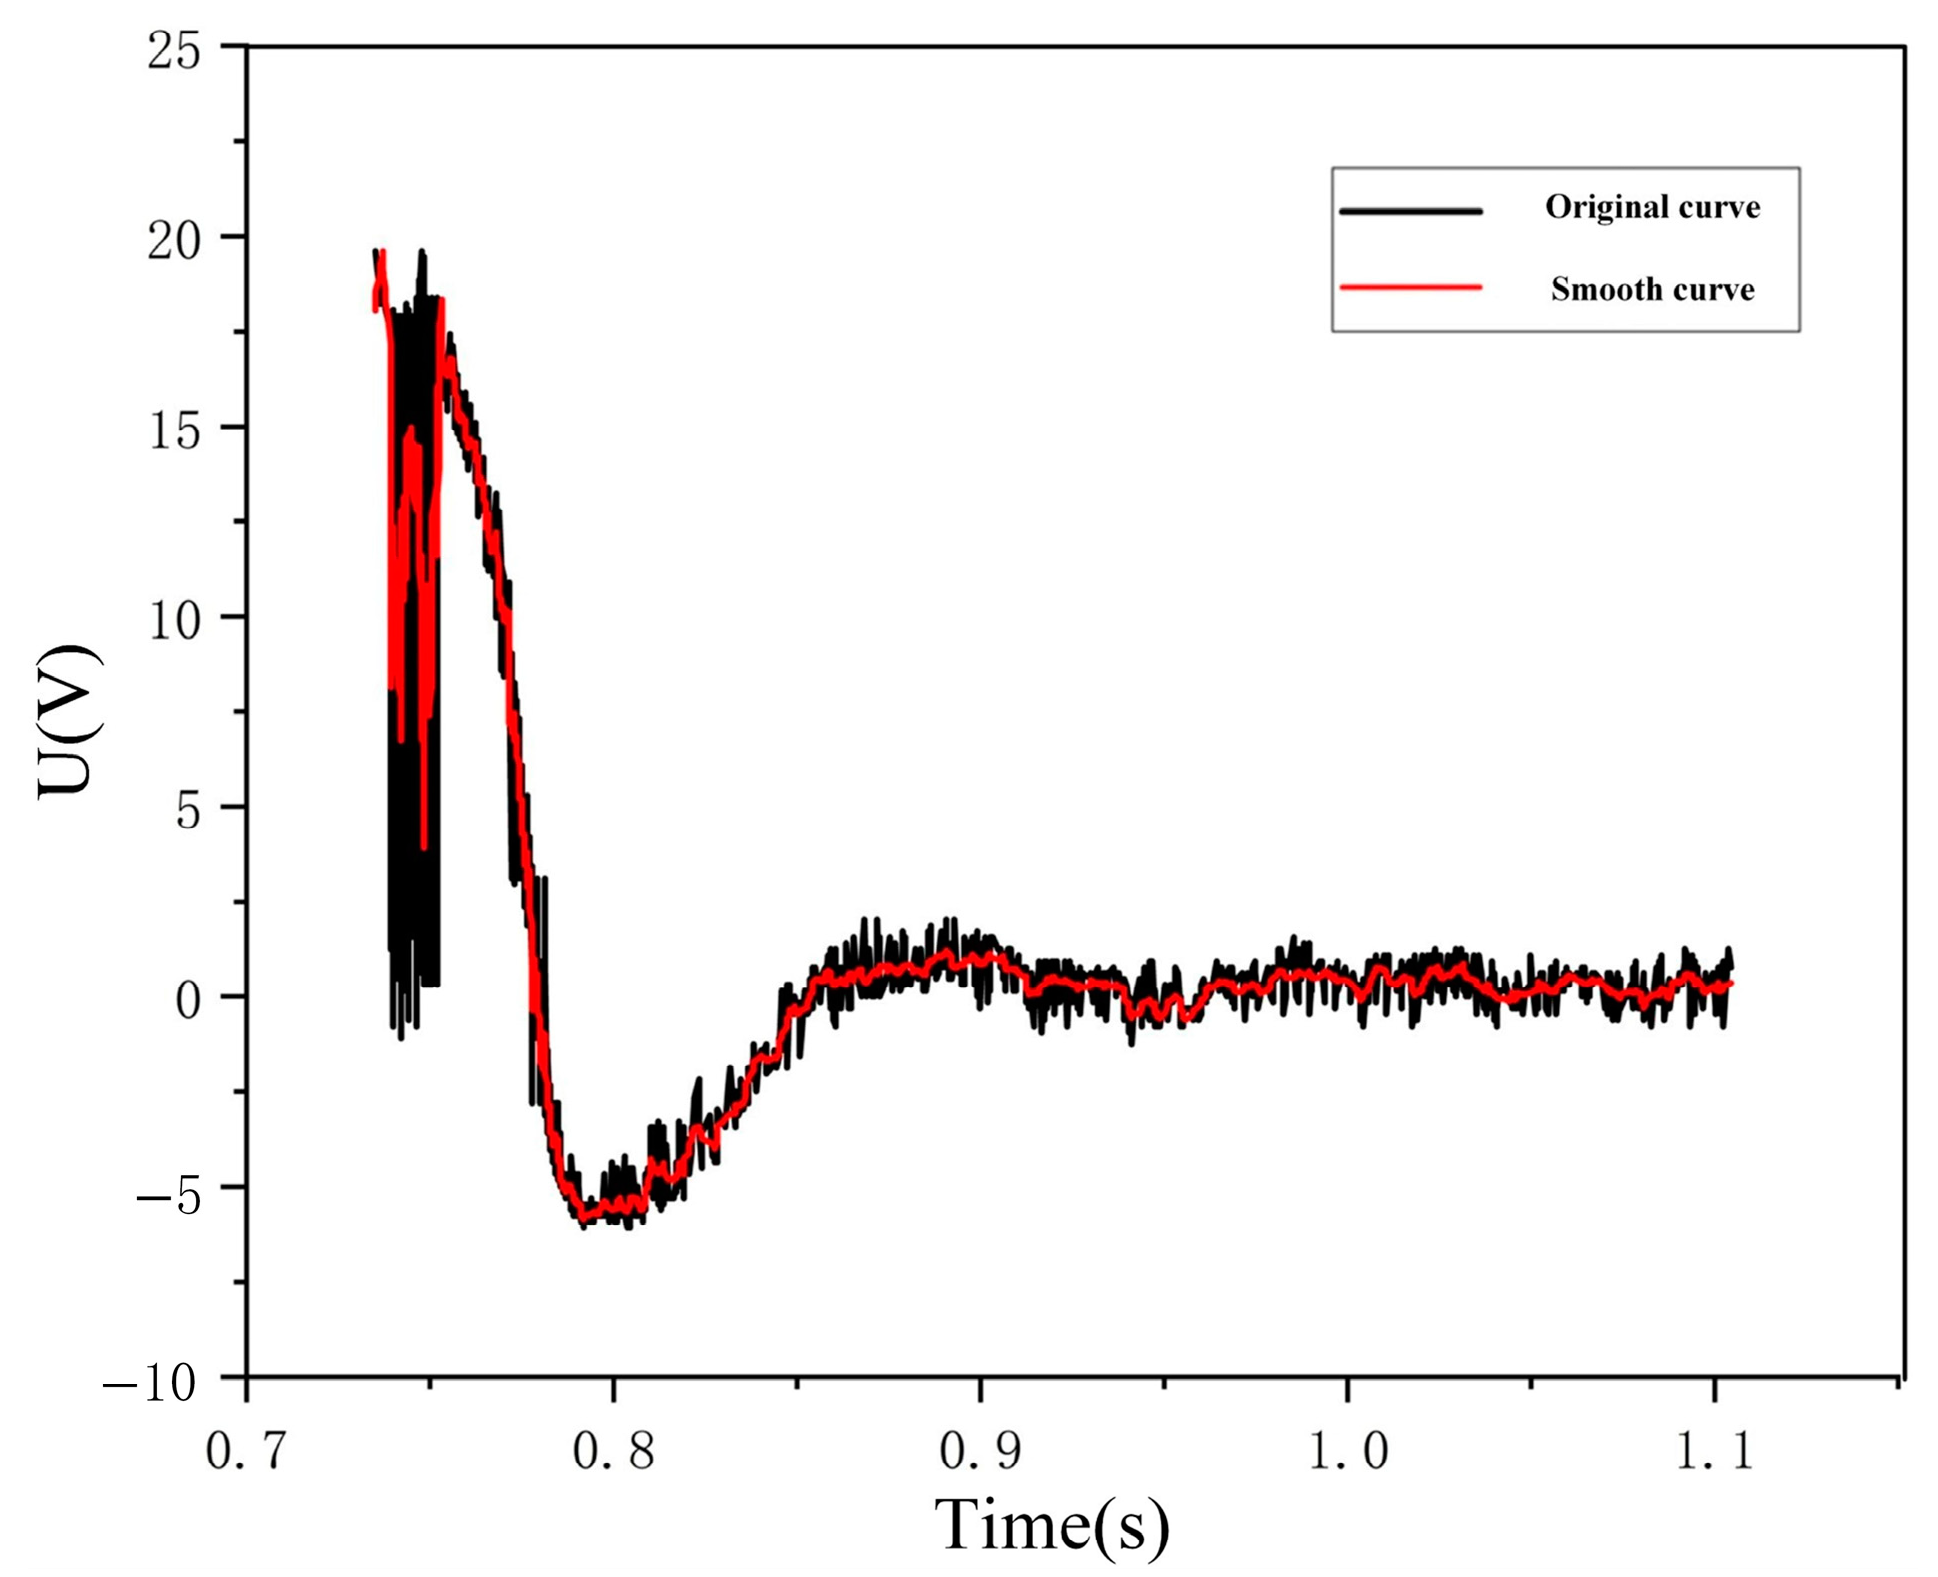
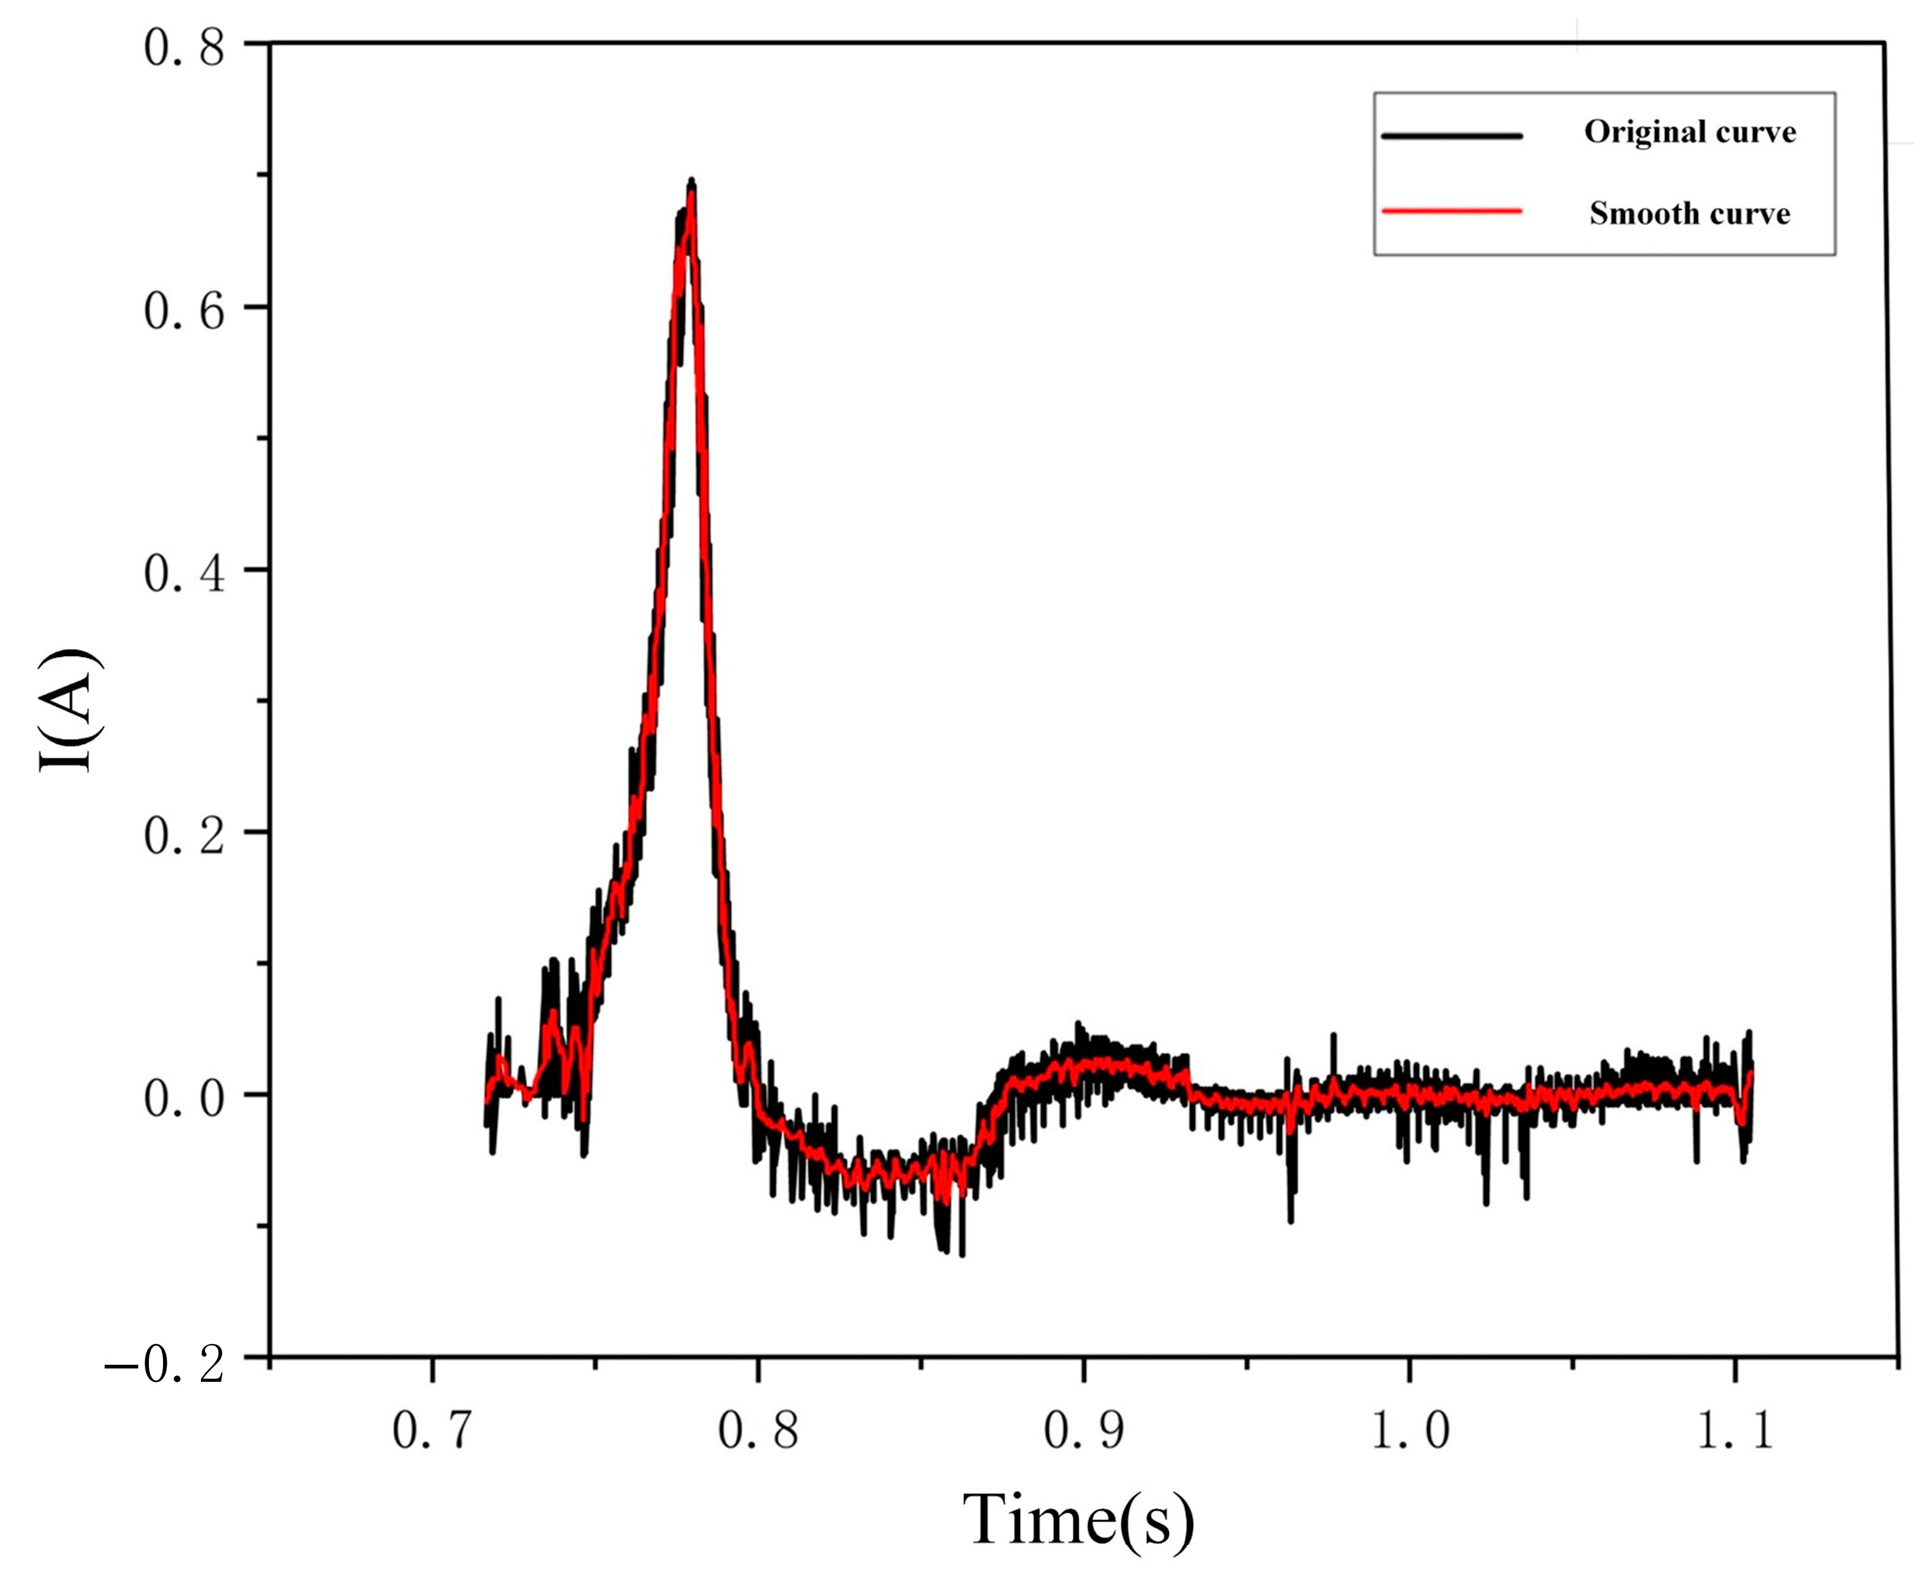
After the pre-charging is completed, release energy from the transformer to generate a demagnetizing current that decays and oscillates. During this period, observe the instrument and numerical changes.
(5)
Generate a demagnetization hysteresis loop based on the experimental data and calculate the residual magnetism.
(6)
Perform impedance measurement under low voltage again to determine the demagnetization evaluation based on the changes in impedance magnitude twice. If it is not ideal, continue with the experimental steps in (2).

6.3. Measurement Results and Error Analysis

In the experimental measurement of the demagnetization effect on the converter transformer, taking the C-phase of the pole 2Y-Y converter transformer tested with 10 A DC resistance as an example, the experimental process and results are described in detail. The experimental data show that the remanence rate significantly decreases after demagnetization, and the demagnetization effect is significant.
The demagnetization device is placed in a safe environment to ensure the correct connection between the device and the transformer, including the connection between the output voltage terminal and the ground wire. After starting the device, impedance measurement is first performed under low voltage to obtain the initial inductance value of the transformer in the demagnetized state. The voltage set for this measurement is 380 V, and the measured inductance value is 329.3 H, which will serve as the benchmark for subsequent demagnetization effect evaluation. The on-site experimental diagram of the device is shown in Figure 18.
According to the characteristics and demagnetization requirements of the transformer, the demagnetization starting voltage is set to 1100 V, the expected demagnetization time is 2000 ms, the demagnetization termination voltage is 2 V, and the termination current is 1 mA. After completing the parameter settings, the energy storage capacitor is pre-charged until it reaches the set voltage value. During the pre-charging process, the changes in capacitor voltage are closely monitored to ensure that it steadily rises to the target voltage.
After the pre-charging is completed, the demagnetization process is initiated, and the energy storage capacitor releases energy through the transformer winding, generating a demagnetization current that decays and oscillates. During this process, real-time monitoring of voltage, current waveforms, and related parameter changes is carried out. The experimental data show that the peak voltage reaches 1131 V, the peak current is 9775.12 mA, and the oscillation frequency is 7 times. The waveform diagrams of voltage and current clearly demonstrate the attenuation process of oscillation, indicating that the demagnetization current gradually decreases and energy is gradually released. Table 7 shows the main parameters during the demagnetization process.
From Figure 19, it can be seen that after 40 s, the voltage and circuit changes approach zero, indicating that the demagnetization process has ended. Therefore, by integrating the voltage data within the time range of 0 s to 40 s, the magnetic flux variation curve over time in Figure 20 can be obtained.
After obtaining the current and magnetic flux change curves during the demagnetization process separately, the dynamic demagnetization loop can be drawn according to the previous method. The dynamic hysteresis curve is shown in Figure 21.
After the demagnetization process is completed, impedance measurement under low voltage is performed again, and the measured inductance value is 717.5 H. Compared with the inductance value before demagnetization, the change in inductance value reflects the decrease in remanence rate. The residual magnetization rate after demagnetization is calculated to be 53.53%, which is significantly reduced compared to before demagnetization, indicating that the demagnetization operation has achieved good results.
The demagnetization hysteresis loop is generated based on experimental data, and the remanence is further determined by analyzing the shape and characteristics of the hysteresis loop. The hysteresis loop shows that during demagnetization, the relationship between magnetic induction intensity and magnetic field intensity gradually approaches the origin, indicating the gradual elimination of remanence. By measuring the intersection point of the hysteresis loop on the vertical axis, the residual magnetization after demagnetization is calculated, which is mutually confirmed with the change in inductance value to ensure the accuracy of the demagnetization effect.
Through the above experimental process, a comprehensive evaluation of the demagnetization effect of the pole 2YYC phase was conducted. The results show that the demagnetization method was effective, and the residual magnetization rate was significantly reduced, meeting the requirements for residual magnetization measurement and demagnetization of converter transformers in engineering practice.

7. Discussion

7.1. Validity of Results

The method proposed in this article constructs an RLC oscillation circuit, which achieves accurate measurement of residual magnetism and synchronous demagnetization by converting the energy between the storage capacitor and the magnetic field of the transformer core. In order to prevent the induced current on the secondary side from affecting the residual magnetism of the iron core and causing any interference to the power grid during demagnetization, the method proposed in this article is mainly aimed at transformers under power outage conditions. The experimental and simulation results show that the measurement error of this method is less than 5%, and the residual magnetism after demagnetization is less than 3 Wb, which is significantly better than traditional methods. Meanwhile, this article validated the feasibility of this method in large transformers. The main sources of error are concentrated in the process of voltage flux conversion, such as possible noise interference, long oscillation of voltage leading to inaccurate integration intervals, and accuracy limitations of the measurement equipment. By optimizing data collection equipment and signal processing algorithms, errors can be further reduced and measurement accuracy can be improved.

7.2. Process Automation

The proposed method essentially supports high automation. After the model of the transformer is determined, the device mentioned earlier can carry out the entire demagnetization process, from charging the energy storage capacitor to releasing the oscillating current and collecting data, which can be controlled by a computer system. This automation not only reduces the technical requirements for operators but also minimizes human error to the greatest extent possible, thereby improving the reliability and repeatability of the measurements. Future implementations can integrate machine learning algorithms to optimize charging voltage and oscillation parameters in real time, further improving the efficiency and accuracy of demagnetization processes.

7.3. Integration into Transformer Design

The demagnetization system described in this article is designed to be modular and compact, making it suitable for integration into modern transformer designs. Energy storage capacitors, control units, and data acquisition systems can be installed within the existing infrastructure of transformers to minimize additional space requirements. This integration will allow for routine demagnetization during maintenance without the need for external devices, simplifying operating procedures and reducing downtime.

7.4. Potential Interference of the Power Grid

As mentioned earlier, this method is designed specifically for transformers that experience power outages, ensuring that the demagnetization process does not interfere with the power grid. The generated current pulse is confined within the transformer winding and will not propagate to the power grid. This isolation is crucial for maintaining grid stability and preventing any unexpected electromagnetic interference. In addition, the rapid execution of this method (usually within one minute) further reduces the risk of any residual impact on the surrounding electrical environment.

7.5. Comparison with Other Demagnetization Methods

In this paper, the commonly used AC demagnetization method is adopted to test the toroidal transformer. Below are the demagnetization data of this paper, and the excitation inductance of the toroidal transformer is used to judge the demagnetization result.
First, a DC current of 5 A is applied to the toroidal transformer for 10 s to ensure that the transformer reaches magnetic saturation. The excitation inductance value at this time is used as the starting point. The signal generator outputs a demagnetization signal with a frequency of 0.1 Hz per cycle and a duration of 1 min. The threshold value for the end of demagnetization is determined through multiple cycles, and the measurement results are shown in the Table 8 below.
According to multiple measurements, when the excitation inductance of the transformer tends to 23.4 mH, it will gradually remain almost unchanged, which can be regarded as the end of demagnetization. It can be seen that the traditional AC demagnetization method often takes minutes, which is much longer than the method used in this paper.

7.6. Future Research Directions

Future research can focus on the following directions:
  • Demagnetization methods for complex transformers: Develop demagnetization methods suitable for transformers with multiple windings and phases to further enhance the versatility of the method.
  • Real-time demagnetization technology: Create technology that can demagnetize transformers during operation to reduce downtime.
  • Intelligent demagnetization systems: Combine artificial intelligence and machine learning techniques to optimize the control strategies of the demagnetization process and improve demagnetization efficiency.
By exploring these improvements and research directions, this method is expected to be applied in a wider range of power system scenarios, providing more efficient and reliable solutions for remanence measurement and the demagnetization of transformers.

8. Conclusions

In this paper, a remanence measurement method based on the degaussing hysteresis loop is proposed, which uses the dynamic conversion of capacitive energy storage and core magnetic field energy to generate an attenuation oscillation current by constructing an RLC oscillation circuit composed of an energy storage capacitor and a transformer winding. It is crucial to emphasize that this method is intended for de-energized transformers to avoid any potential disturbance to the power grid. Not only does this method enable accurate measurement of remanence, but it also facilitates simultaneous degaussing operation. The theoretical analysis shows that the charging range of the energy storage capacitor can be calculated, and the remanence value can be directly calculated by the intersection point difference of the longitudinal axis of the dynamic hysteresis loop, which provides a new theoretical basis for the measurement of remanence. This method effectively solves the problems of large error, complex operation, and lack of versatility in the existing remanence measurement methods, and provides new ideas and theoretical support for the research on remanence detection and the suppression of de-energized power transformers. Through simulation and experimental verification, the method shows significant measurement accuracy and degaussing effects. The results show that the measurement error of the proposed method is less than 5%, and the remanence after degaussing is less than 3 Wb, which is significantly better than the traditional method.
  • Experiments show that the method does not require complex control strategies, and has both high precision and high efficiency. Under different set values, the error percentage can be kept at a low level, the remanence value of the starting point is close to the set value, and the remanence value of the endpoint is close to zero, which further proves the effectiveness and reliability of the method. This advantage makes the method highly feasible in practical engineering applications, which can meet the strict requirements of power systems for transformer remanence measurement and demagnetization and provides strong technical support for ensuring the safe and stable operation of the power grid.
  • This method has important value and significance in practical application. First of all, it is simple to operate, does not require complex control strategies, and reduces the technical requirements for operators and equipment costs. Secondly, the measurement accuracy is high, which can accurately detect the remanence of the transformer core, which provides reliable data support for the maintenance and overhaul of the transformer. Thirdly, the degaussing effect is remarkable, which can effectively eliminate remanence, reduce the harm of excitation inrush current to the transformer and power grid, and improve the stability and reliability of the power system.
  • In addition, this method is suitable for different types of transformers, has good versatility and adaptability, can meet the remanence measurement and demagnetization needs of various transformers in the power system, and provides strong technical support and a guarantee for the safe operation and maintenance of the power system.

Author Contributions

Conceptualization, D.L. and J.Z.; methodology, Z.Z. and Y.Y.; software, Z.D. and W.H.; validation, D.L., J.Z. and Z.Z.; formal analysis, D.L.; investigation, Y.Y. and Z.D.; resources, W.H. and X.P.; data curation, J.G.; writing—original draft preparation, D.L.; writing—review and editing, J.Z. and Z.Z.; visualization, S.C.; supervision, Z.P.; project administration, D.L.; funding acquisition, J.Z.; theoretical formula derivation, D.L. and S.C.; experimental equipment and venue provided by Z.P.; experimental data processing, Z.P. and S.C. All authors have read and agreed to the published version of the manuscript.

Funding

This research was financed by the China Southern Power Grid Program (CGYKJXM20220310).

Institutional Review Board Statement

Not applicable.

Informed Consent Statement

Not applicable.

Data Availability Statement

The original contributions presented in the study are included in the article, further inquiries can be directed to the corresponding author.

Conflicts of Interest

Author Siyang Chen was employed by the company State Grid Chongqing Electric Power Company Qijiang Power Supply Branch. Author Zhicheng Pan was employed by the company China Southern Power Grid Corporation Limited Ultra High Voltage Transmission Company Electric Power Research Institute. The remaining authors declare that the research was conducted in the absence of any commercial or financial relationships that could be construed as a potential conflict of interest.

References

  1. Li, J.L.; He, P.W.; Qiu, Z.S.; Guo, L.Y. Research Overview of Measurement Methods for Residual Magnetism in Power Transformer Cores. High-Volt. Appar. 2018, 54, 98–105. [Google Scholar]
  2. Yang, Y.; Zhang, Z.L.; Pan, Z.C.; Lv, J.Z.; Dong, Z.J.; Zhu, L. Research on the Residual Magnetic Flux Density Measurement of Single-Phase Transformer Based on Magnetomotive Force. IEEE Trans. Instrum. Meas. 2025, 74, 6002516. [Google Scholar] [CrossRef]
  3. Vulin, D.; Milicevic, K.; Biondic, I.; Petrovic, G. Determining the residual magnetic flux value of a single-phase transformer using a minor hysteresis loop. IEEE Trans. Power Deliv. 2021, 36, 2066–2074. [Google Scholar] [CrossRef]
  4. Huo, C.; Yang, Y. A novel residual magnetism detection method of power transformer cores based on magnetization time. IEEE Sens. J. 2024, 24, 2647–2656. [Google Scholar] [CrossRef]
  5. Vulin, D.; Biondic, I.; Milicevic, K.; Vinko, D. Laboratory setup for determining residual magnetic flux value using low voltage DC source. Electr. Eng. 2020, 102, 1707–1714. [Google Scholar] [CrossRef]
  6. Sung, B.C.; Kim, S. Accurate transformer inrush current analysis by controlling closing instant and residual flux. Electr. Power Syst. Res. 2023, 223, 109638. [Google Scholar] [CrossRef]
  7. Pan, Z.; Zheng, T.; Guo, Y.; Pan, L. Cause analysis and anti-vibration performance study of gas relay in the process of no-load closing of converter transformer. In Proceedings of the Annual Meeting of CSEE Study Committee on HVDC Power Electronics (HVDC), Nanjing, China, 22–25 October 2023; pp. 17–22. [Google Scholar]
  8. Zhang, S.; Lv, J.; Li, B.; Ding, L. Improved flux-controlled VFCV strategy for eliminating and measuring the residual flux of three-phase transformers. IEEE Trans. Power Deliv. 2020, 35, 1237–1248. [Google Scholar] [CrossRef]
  9. Nilsson, L.; Eriksson, M.; Johansson, J. Sensitivity analysis of transformer frequency responses. In Proceedings of the 14th International Electrical Insulation Conference (INSUCON), Birmingham, UK, 18–20 April 2023; pp. 54–59. [Google Scholar]
  10. Han, P.; Tong, Q.; Zhang, J. An inrush current suppression strategy for UHV converter transformer based on simulation of magnetic bias. IEEE Trans. Power Deliv. 2022, 37, 5179–5189. [Google Scholar] [CrossRef]
  11. Chen, X.; Wang, Y.; Zhang, Z.; Li, J. Energization transient suppression of 750 kV AC filters using a preinsertion resistor circuit breaker with a controlled switching device. IEEE Trans. Power Deliv. 2022, 37, 3381–3390. [Google Scholar] [CrossRef]
  12. Cao, Y.; Zhang, Z.; Lu, H.; Li, B. Analysis and suppression of operational overvoltage and inrush current for high-speed trains by automatic phase-switching technique. High Volt. 2024, 9, 509–761. [Google Scholar] [CrossRef]
  13. Pachore, P.; Gupta, Y.; Anand, S.; Sarkar, S.; Mathur, P.; Singh, P.K. Flux error function based controlled switching method for minimizing inrush current in 3-phase transformer. IEEE Trans. Power Deliv. 2021, 36, 870–879. [Google Scholar] [CrossRef]
  14. Wang, Y.; Yin, X.; Qiao, J.; Tan, L.; Xu, W. Inrush current suppression technology for floating nuclear power plants based on connecting preT in series. Int. J. Electr. Power Energy Syst. 2022, 135, 107508. [Google Scholar] [CrossRef]
  15. Mitra, J.; Xu, X.; Benidris, M. Reduction of three-phase transformer inrush currents using controlled switching. IEEE Trans. Ind. Appl. 2020, 56, 890–897. [Google Scholar] [CrossRef]
  16. Ni, H.; Fang, S.; Lin, H. A simplified phase-controlled switching strategy for inrush current reduction. IEEE Trans. Power Deliv. 2021, 36, 215–222. [Google Scholar] [CrossRef]
  17. Jiang, C.; Xia, S.; Zhou, F.; Yin, X. Detecting CVT measurement errors using a voltage online monitoring system and maximum approximate coefficient growth rate. IEEE Sens. J. 2024, 24, 35181–35190. [Google Scholar] [CrossRef]
  18. Duan, J.; Zhang, Z.; Lu, H.; Li, B.; Ding, L. A novel method for CVT transient transform characteristics improvement integrated with digital filter suppressing voltage oscillation. IEEE Trans. Instrum. Meas. 2024, 73, 9002412. [Google Scholar] [CrossRef]
  19. Zhang, Z.; Lu, H.; Li, B.; Ding, L. Research on data-driven self-diagnosis for measurement errors in capacitor voltage transformers. IEEE Trans. Instrum. Meas. 2024, 73, 3524712. [Google Scholar] [CrossRef]
  20. Guan, C.; Wang, Y.; Wu, S.; Yang, Y. Study on short-circuit current interruption characteristics of double-break fast vacuum circuit breaker within the minimum arcing time. Int. J. Electr. Power Energy Syst. 2023, 147, 108865. [Google Scholar] [CrossRef]
  21. Zhang, H.; Wang, Y.; Zhao, Z.; Liu, C. A new method to measure the residual flux by magnetic sensors and a finite-element model. IEEE Trans. Instrum. Meas. 2023, 72, 6006010. [Google Scholar] [CrossRef]
  22. Song, J.; Zheng, T.; Guo, Y.; Pan, L. Suppression strategy of the inrush current in the transformer phase selection closing considering the residual flux. In Proceedings of the 6th Asia Conference on Energy and Electrical Engineering (ACEEE), Chengdu, China, 21–23 July 2023; pp. 140–145. [Google Scholar]
  23. Huo, C.; Wang, Y.; Zhao, Z.; Liu, C. Residual flux measurement of the single-phase transformer based on transient current method. IEEE Trans. Appl. Supercond. 2020, 30, 5500505. [Google Scholar] [CrossRef]
  24. Huo, C.; Wang, Y.; Wu, S.; Liu, C. Research on residual flux density measurement for single-phase transformer core based on energy changes. IEEE Trans. Instrum. Meas. 2021, 70, 6011909. [Google Scholar] [CrossRef]
  25. Huo, C.; Wang, Y.; Wu, S.; Yang, Y.; Zhao, Z. Residual flux density measurement method for transformer core considering relative differential permeability. IEEE Trans. Magn. 2021, 57, 8400204. [Google Scholar] [CrossRef]
  26. Huo, C.; Yang, Y. A review of research progress on residual magnetism detection methods for power transformer cores. IEEE Sens. J. 2024, 24, 7636–7645. [Google Scholar] [CrossRef]
  27. Sima, W.; Zou, B.; Yang, M.; de León, F. New method to measure deep-saturated magnetizing inductances for dual reversible models of single-phase two-winding transformers. IEEE Trans. Power Deliv. 2021, 36, 488–491. [Google Scholar] [CrossRef]
  28. Lv, J.; Zhang, Z.; Lu, H.; Li, B.; Ding, L. Measurement method of deeply saturated excitation characteristics of converter transformer under AC-DC hybrid excitation. Electronics 2024, 13, 4691. [Google Scholar] [CrossRef]
  29. Michna, M.; Dworakowski, P.; Mermet-Guyên, M. Modified Preisach Model of Hysteresis in Multi Air Gap Ferrite Core Medium Frequency Transformer. IEEE Trans. Power Deliv. 2022, 37, 116–124. [Google Scholar] [CrossRef]
  30. Beyranvand, M.; Rezecaalam, B.; Rezæel-Zare, A. Impacts of Ferroresonance and Inrush Current Forces on Transformer Windings. IET Electr. Power Appl. 2019, 13, 914–921. [Google Scholar] [CrossRef]
  31. Negara, I.M.Y. Demagnetization Method for Reducing Inrush Current of Single Phase 1 kVA Transformer. J. Adv. Res. Electr. Eng. 2017, 1, 1–5. [Google Scholar] [CrossRef]
  32. Brunke, J.H.; Fröhlich, K.J. Elimination of Transformer Inrush Currents by Controlled Switching—Part I: Theoretical Considerations. IEEE Trans. Power Deliv. 2001, 16, 276–280. [Google Scholar] [CrossRef]
  33. Himata, Y.; Nakajima, T.; Maruyama, S. Residual Magnetic Flux of On-Load Transformer for Controlled Switching. IEEE Trans. Electr. Electron. Eng. 2020, 15, 1134–1138. [Google Scholar] [CrossRef]
  34. Hodgdon, M.L. Applications of a Theory of Ferromagnetic Hysteresis. IEEE Trans. Magn. 1988, 24, 218–221. [Google Scholar] [CrossRef]
  35. de León, F.; Farazmand, A.; Levi, R. Elimination of Residual Flux in Transformers by the Application of an Alternating Polarity DC Voltage Source. IEEE Trans. Power Deliv. 2015, 30, 1727–1734. [Google Scholar] [CrossRef]
  36. Gerdrodbari, Y.; Davarpanah, M.; Farhangi, S. Remanent Flux Negative Effects on Transformer Diagnostic Test Results and a Novel Approach for Its Elimination. IEEE Trans. Power Deliv. 2018, 33, 2938–2945. [Google Scholar] [CrossRef]
  37. Guo, Y.; Zheng, Z.; Zhao, J. Study of Resistive Type SFCL for Limiting Inrush Current of LCC-HVDC Converter Transformer. IEEE Trans. Appl. Supercond. 2021, 31, 5500804. [Google Scholar] [CrossRef]
  38. Huo, C.L.; Wang, Y.H.; Lei, G. Study on the Residual Flux Density Measurement Method for Power Transformer Cores Based on Magnetising Induction. IET Electr. Power Appl. 2022, 16, 224–235. [Google Scholar] [CrossRef]
  39. Islam, M.M.; Muttagi, K.M.; Sutanto, D. A Saturated Amorphous Alloy Core-Based Inrush Current Limiter to Eliminate Inrush Currents and Restrain Harmonics during Transformer Energization. IEEE Trans. Ind. Appl. 2021, 57, 6634–6645. [Google Scholar] [CrossRef]
Figure 1. Schematic diagram of the magnetization process of the core.
Applsci 15 05375 g001
Figure 2. Schematic diagram of the domain deflection process (The arrows in the figure represent the magnetic directions in each magnetic domain).
Applsci 15 05375 g002
Figure 3. The equivalent circuit diagram.
Applsci 15 05375 g003
Figure 4. Flowchart of the proposed method.
Applsci 15 05375 g004
Figure 5. Simulation circuit based on a simplified circuit construction.
Applsci 15 05375 g005
Figure 6. Current waveform diagram.
Applsci 15 05375 g006
Figure 7. Magnetic link waveform diagram.
Applsci 15 05375 g007
Figure 8. Schematic diagram of remanence measurement based on the dynamic hysteresis loop.
Applsci 15 05375 g008
Figure 9. Schematic diagram of the experimental platform.
Applsci 15 05375 g009
Figure 10. Degaussing waveform.
Applsci 15 05375 g010
Figure 11. Magnetization results.
Applsci 15 05375 g011
Figure 12. Voltage variation curve and smoothing curve.
Applsci 15 05375 g012
Figure 13. Current variation curve and smoothing curve.
Applsci 15 05375 g013
Figure 14. Smoothed dynamic hysteresis loop.
Applsci 15 05375 g014
Figure 15. Physical picture of a converter transformer at the Dongfang converter station.
Applsci 15 05375 g015
Figure 16. Integrated device user interface diagram.
Applsci 15 05375 g016
Figure 17. Hardware logic diagram of the demagnetization device.
Applsci 15 05375 g017
Figure 18. On-site experimental setup diagram.
Applsci 15 05375 g018
Figure 19. Voltage and current variation curve during demagnetization process (software interface. The yellow curve represents the voltage curve, and the red curve represents the current curve).
Applsci 15 05375 g019
Figure 20. Magnetic flux variation curve during the demagnetization process.
Applsci 15 05375 g020
Figure 21. Dynamic hysteresis curve plot (software interface. The blue curve represents the demagnetization hysteresis loop, the red curve represents the current curve, and the yellow curve represents the voltage curve).
Applsci 15 05375 g021
Table 1. Converter transformer parameters.
NameParameters
Commutation capacity237.4 (MVA)
Rated voltage525,000 grid side/161,200 valve side (V)
Current rating783.2 grid side/2250.8 Valve side (A)
No-load loss142.8 (kW)
No-load current0.082%
Saturation magnetic induction intensity1.7 (T)
Table 2. Remanence measurements based on the dynamic hysteresis loops.
Set the Remanence ValueFlux Value at the Starting Point (Wb)Measurement of Remanence (Wb)Error (%)
2290.7 Wb2231.165 Wb2228.1812.09
2054.3 Wb2094.832 Wb2091.8482.42
1818 Wb1863.71 Wb1860.7263.24
1781.7 Wb1731.013 Wb1728.0294.54
Table 3. Toroidal transformer parameters.
NameParameter
Rated power200 W
Number of turns on the high-pressure side80 turns
Rated voltage30 V/10 V
Inner and outer diameters50 mm/100 mm
Table 4. Measurement data based on toroidal transformers.
Preset Residual Magnetization Value (T)Starting Remanence (T)Endpoint Remanence Value (T)Error (%)
0.80.78477−0.001481.719
0.70.722310.01384−1.21
0.60.599410.023674.043
0.50.503990.024664.134
Table 5. Measurement data based on large converter transformers.
ParameterValue
Rated capacity237.4 MVA
Transformer typeConverter transformer
Rated frequency50 Hz
Short-circuit time2 s
Tap position+20, N, −6
Voltage (V)656,250, 616,120, 485,625
Current (A)627.6, 673.2, 846.7
Secondary voltage (V)616,120
Secondary current (A)2250.8, 2250.8, 2250.8
Rated current2 × 1300 A
Rated voltageUm 72.5 kV
Load loss485.4 kW
No-load loss142.8 kW
No-load current0.082%
Table 6. Main technical indicators of the device.
ItemTechnical Specifications
Demagnetization voltage0–1500 V DC
Demagnetization current accuracy0.1 mA
Demagnetization voltage accuracy0.1 V
Measurement voltage0–1500 V AC
Measurement voltage accuracy1 V
Measurement current accuracy0.1 mA
Demagnetization time≤60 s
Measurement frequencyAdjustable from 10–100 Hz
Power supply220 V AC, 400 W
Applicable voltage levelTransformers rated from 10 kV to 1000 kV
Table 7. Main parameters of the demagnetization process.
ParameterValue
Estimated demagnetization time (ms)2000
Demagnetization start voltage (V)1100
Demagnetization end voltage (V)2
Demagnetization end current (mA)1
Resistance measurement voltage (V)380
Resistance measurement frequency (Hz)50
Table 8. Excitation inductance data during multiple demagnetization rounds.
Demagnetization CycleMeasured Inductance Value (mH)
07.8
114.5
218.9
320.7
422.8
523.4
Disclaimer/Publisher’s Note: The statements, opinions and data contained in all publications are solely those of the individual author(s) and contributor(s) and not of MDPI and/or the editor(s). MDPI and/or the editor(s) disclaim responsibility for any injury to people or property resulting from any ideas, methods, instructions or products referred to in the content.

