
Reduction of Carbon Footprint in Mechanical Engineering Production Using a Universal Simulation Model


Abstract
1. Introduction
2. Materials and Methods
- Building heating and cooling: These emissions originate directly from fuels burned onsite for heating, cooling, or hot water generation.
- Transportation: Includes emissions from company vehicles and transportation of materials and products, as well as employee commuting when using company resources.
- Energy consumption in manufacturing processes: Occurs when energy sources (such as natural gas or diesel) are utilized directly on-site.
- Direct emissions from manufacturing processes: Emissions that are not part of energy combustion but are produced directly from chemical or other process activities.
- Building heating and cooling: Emissions occur if the energy used for heating and cooling is sourced externally.
- Energy used in manufacturing processes: These emissions result from electricity purchased and consumed that is generated off-site.
- Transportation: Includes emissions associated with electricity or other energy sources used for transportation outside the company’s control (e.g., public transport or external carriers).
2.1. Emission Factors
- Operation refers to the quantitative measure of a specific production activity or process. This can include machine runtime (in hours), number of produced units, fuel consumed (in liters or kWh), or any other operational metric relevant to the production process being analyzed.
- Emission factors are typically sourced from national or international databases that have been compiled and verified through scientific studies or regulatory bodies. Examples include the official Greenhouse Gas Protocol, which provides various emission factors, as well as databases available on platforms such as the European Commission or the European Environment Agency. Additionally, the Intergovernmental Panel on Climate Change (IPCC) publishes comprehensive emission factor databases.
2.2. Proposal for a Reference Simulation Model
- GHG Protocol Tools:These tools offer various calculation spreadsheets to estimate greenhouse gas emissions by sector [14].
- SimaPro:A life cycle assessment (LCA) software that enables a detailed evaluation of a product’s environmental impact. Although highly comprehensive, its complexity and lack of a visual interface may make it impractical for most engineering firms [15].
- OpenLCA:Another LCA tool that is free and flexible but still requires significant technical expertise and does not include an advanced visual interface [16].
2.2.1. Application Model Name: SustainSIM™ 2.1
2.2.2. Software: Unity 3D (2023.3.x)
2.2.3. Methodology for Designing the SustainSIM Model
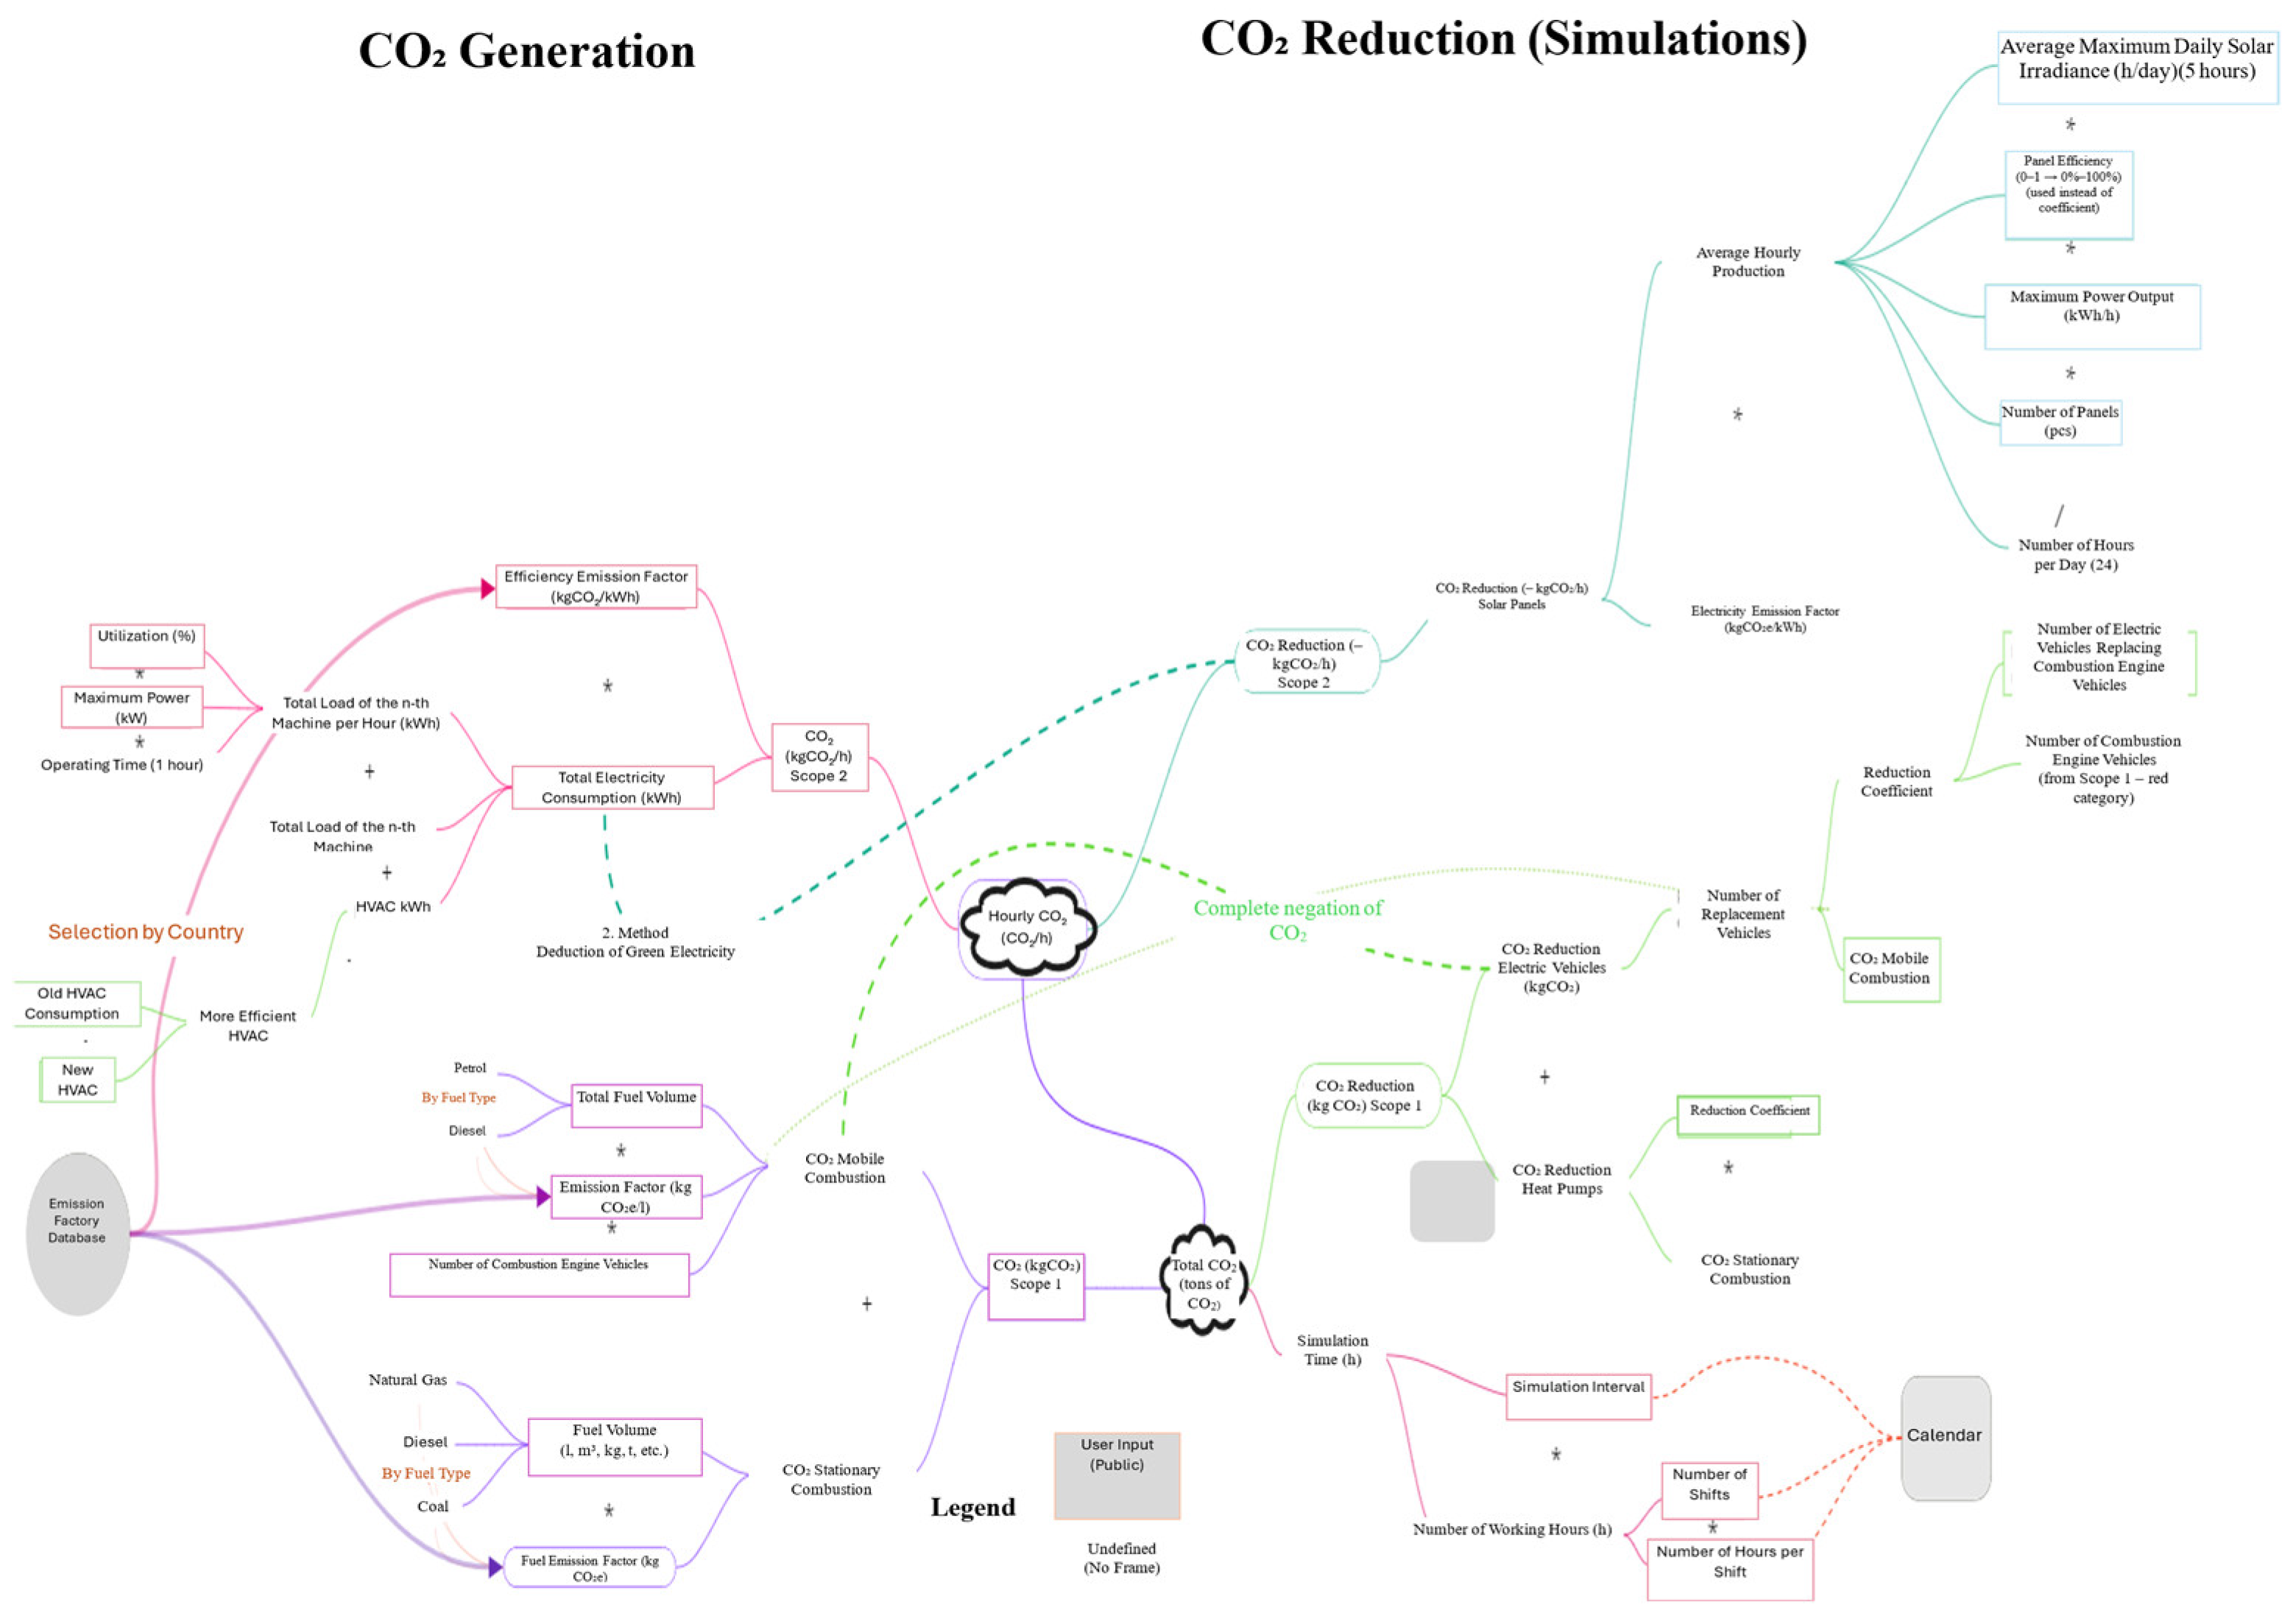
2.3. Simulation of the Carbon Footprint from Electricity Consumption
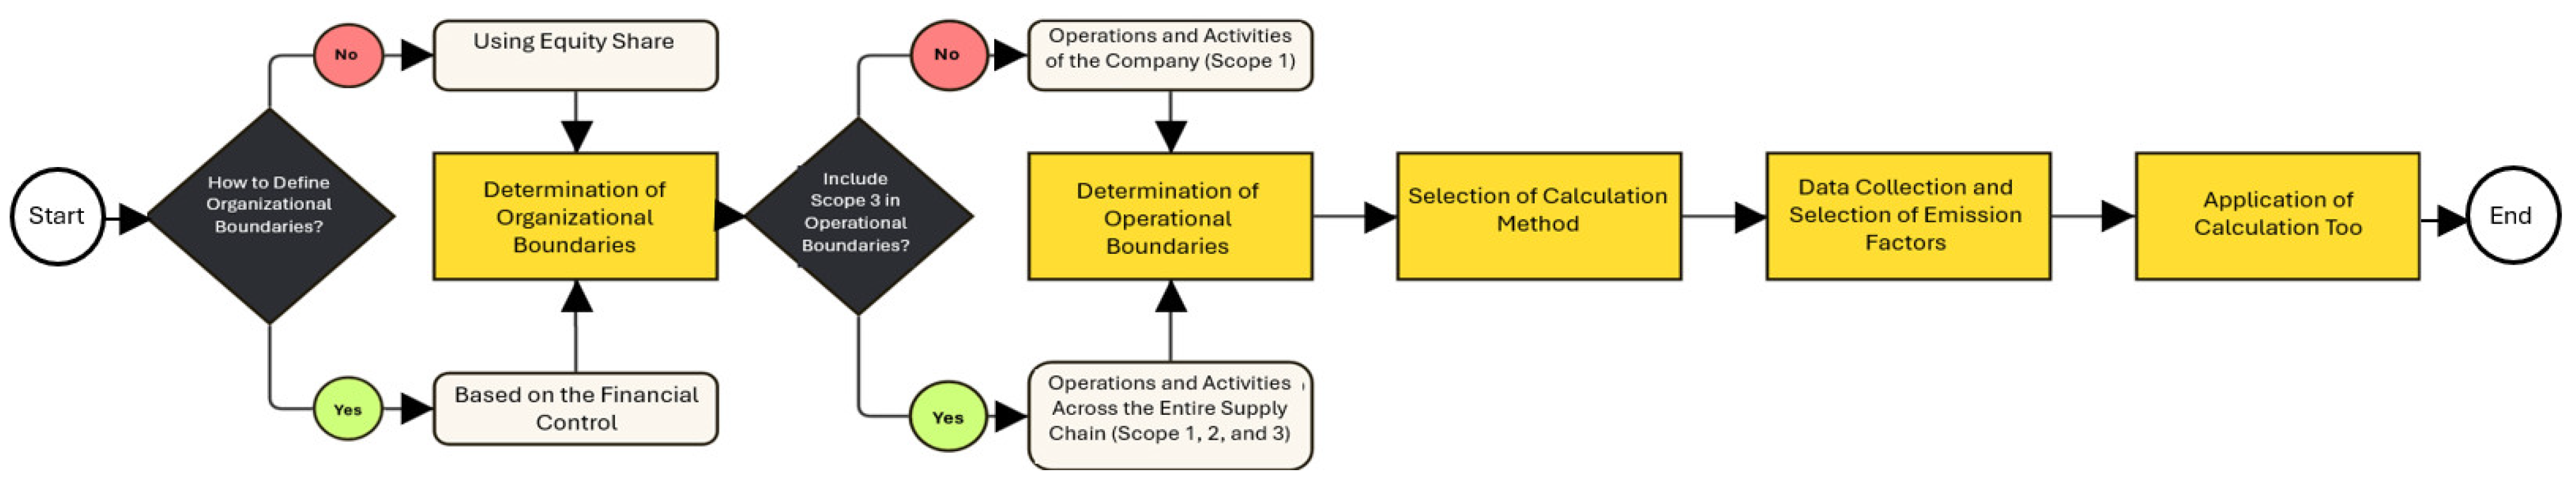
2.4. Organizational and Operational Boundaries
2.5. Emission Factor Database
2.6. Simulation Algorithm Map
2.7. Software Design
- Introduction Screen: This involves creating the graphical user interface for the simulation, including the startup menu, the main menu, and the integration of buttons or cursor interactions with objects.
- Company Name: The name of the company utilizing the simulation and calculation tool.
- Company Location: After entering the company name, the user selects the country. This is essential for the emission simulation properties, as emission factors are determined based on location, specifically using the average factors for the entire electrical grid of Slovakia. These factors are sourced from the emissions factor database created for the simulated model.
- “Continue” Button: Button that triggers an event, switching to the next screen.
- (a)
- Simulation Interval: Units entered in the simulation as time units will be expressed in days.
- (b)
- Number of Shifts: Defined as a whole number, this represents the number of work shifts performed daily in the company.
- (c)
- Shift Duration: Specifies the time interval defining a single work shift.
- (d)
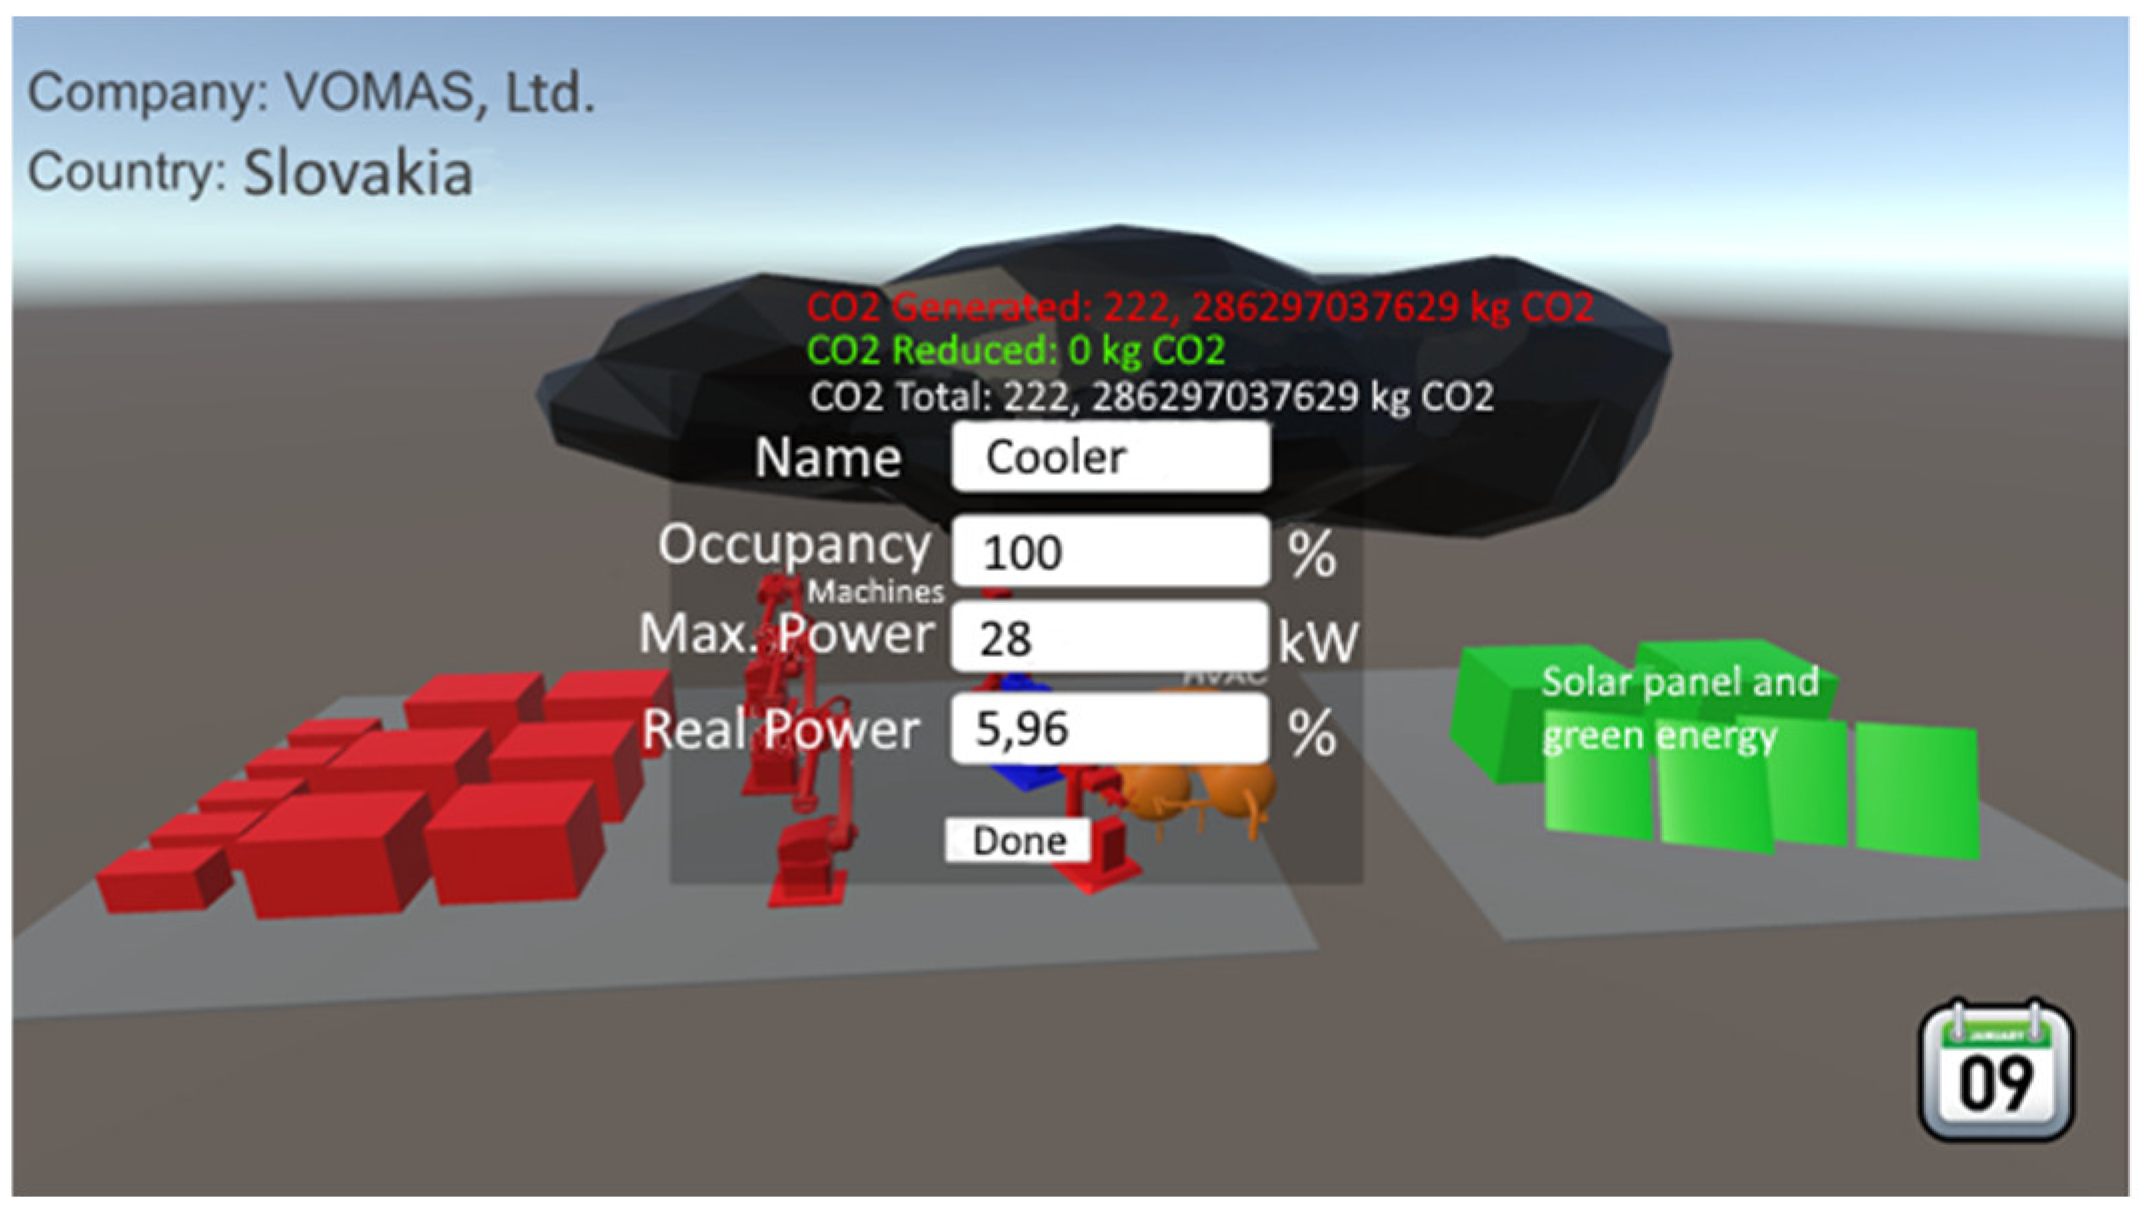
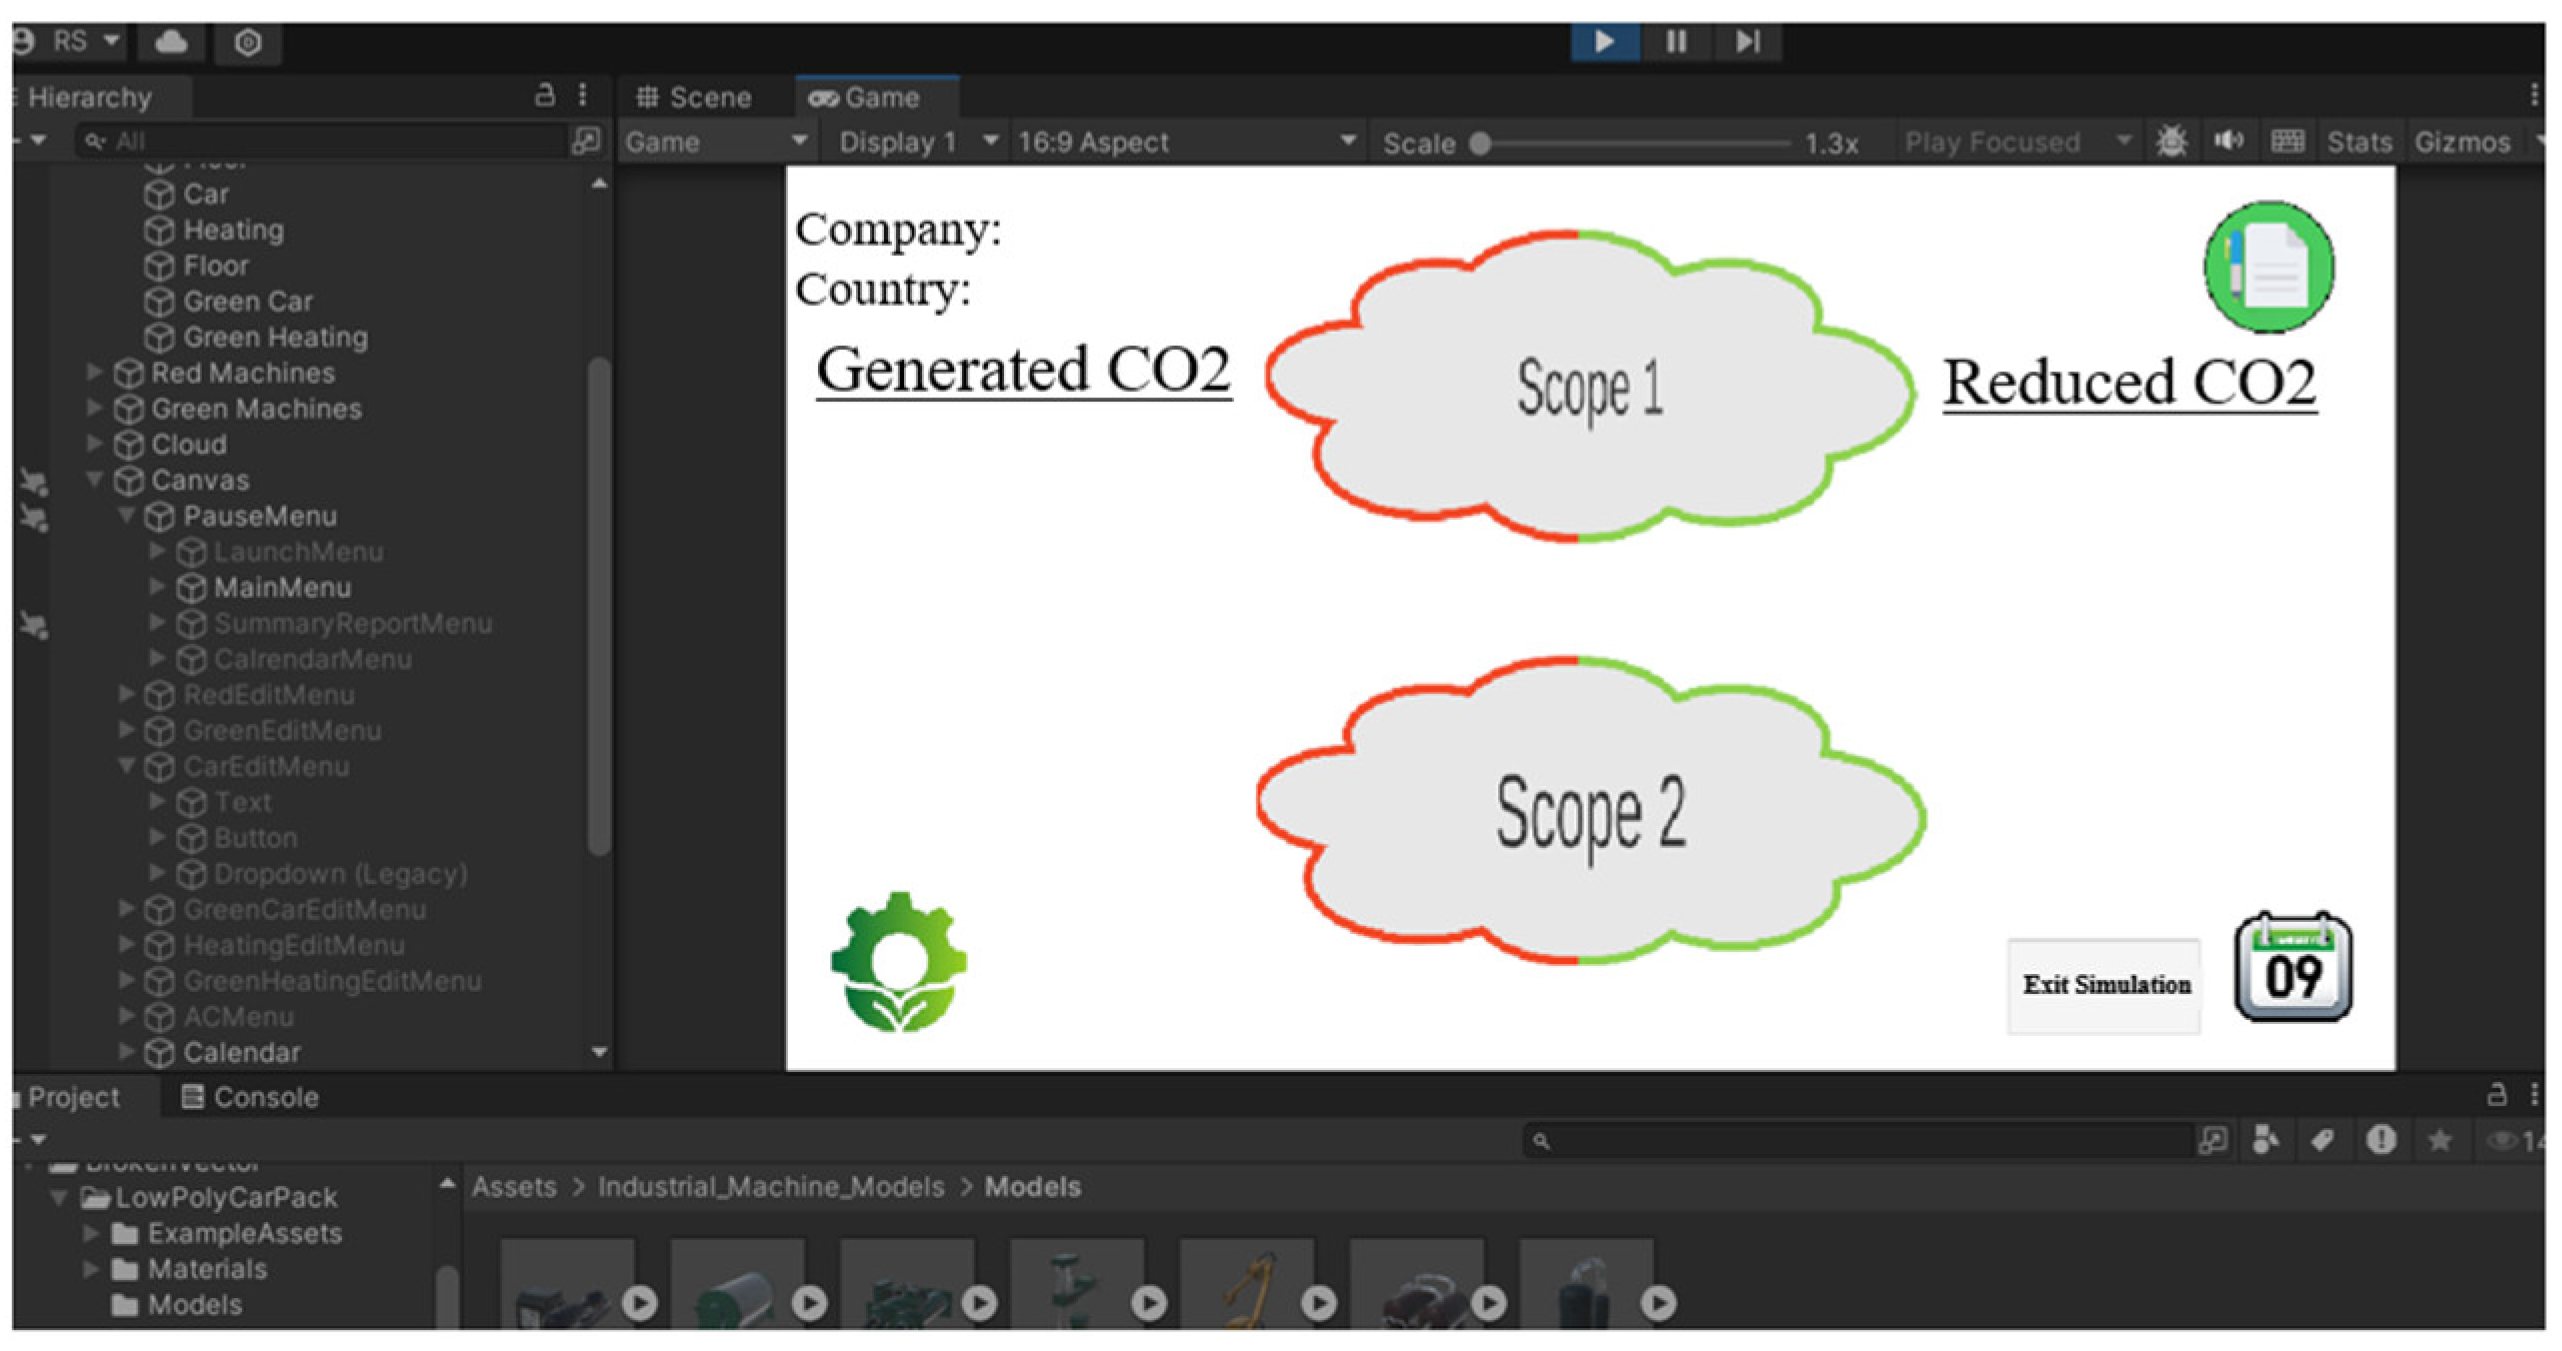
- Summary of Results: The icon on the right navigates to the Results Summary menu.
2.8. SustainSIM—Scope 1
2.8.1. Design and Methodology for Simulating Scope 1 Emission Generation
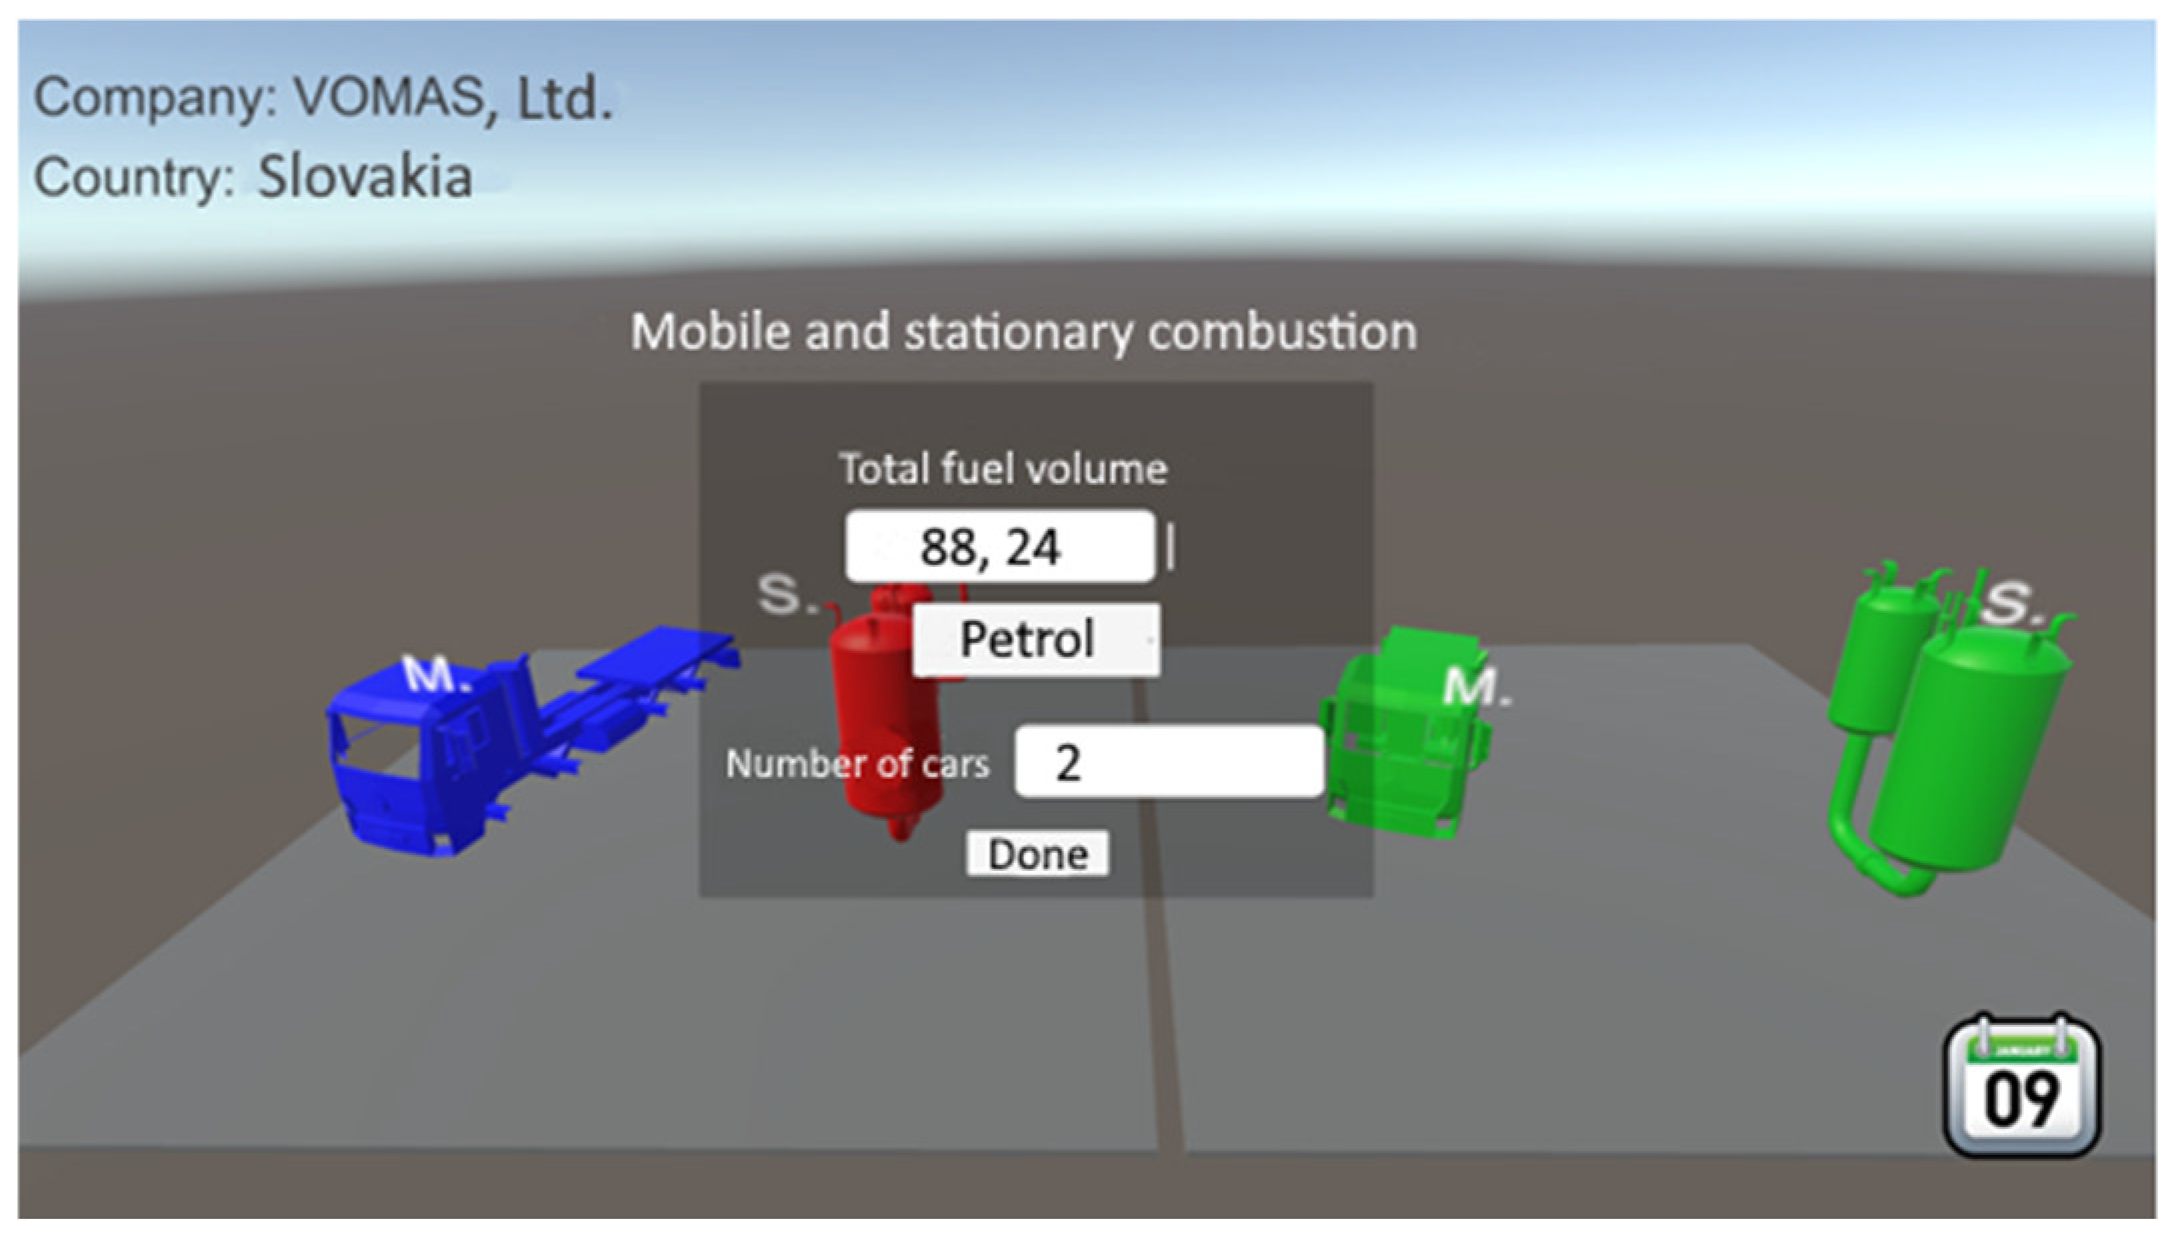
- Mobile Combustion
- -
- Total Fuel Volume: The amount of fuel consumed over a specific time interval.
- -
- Fuel Type: The type of fuel used as the basis for emission calculations.
- -
- Number of Vehicles: The number of vehicles consuming the fuel or actively operating in the company.
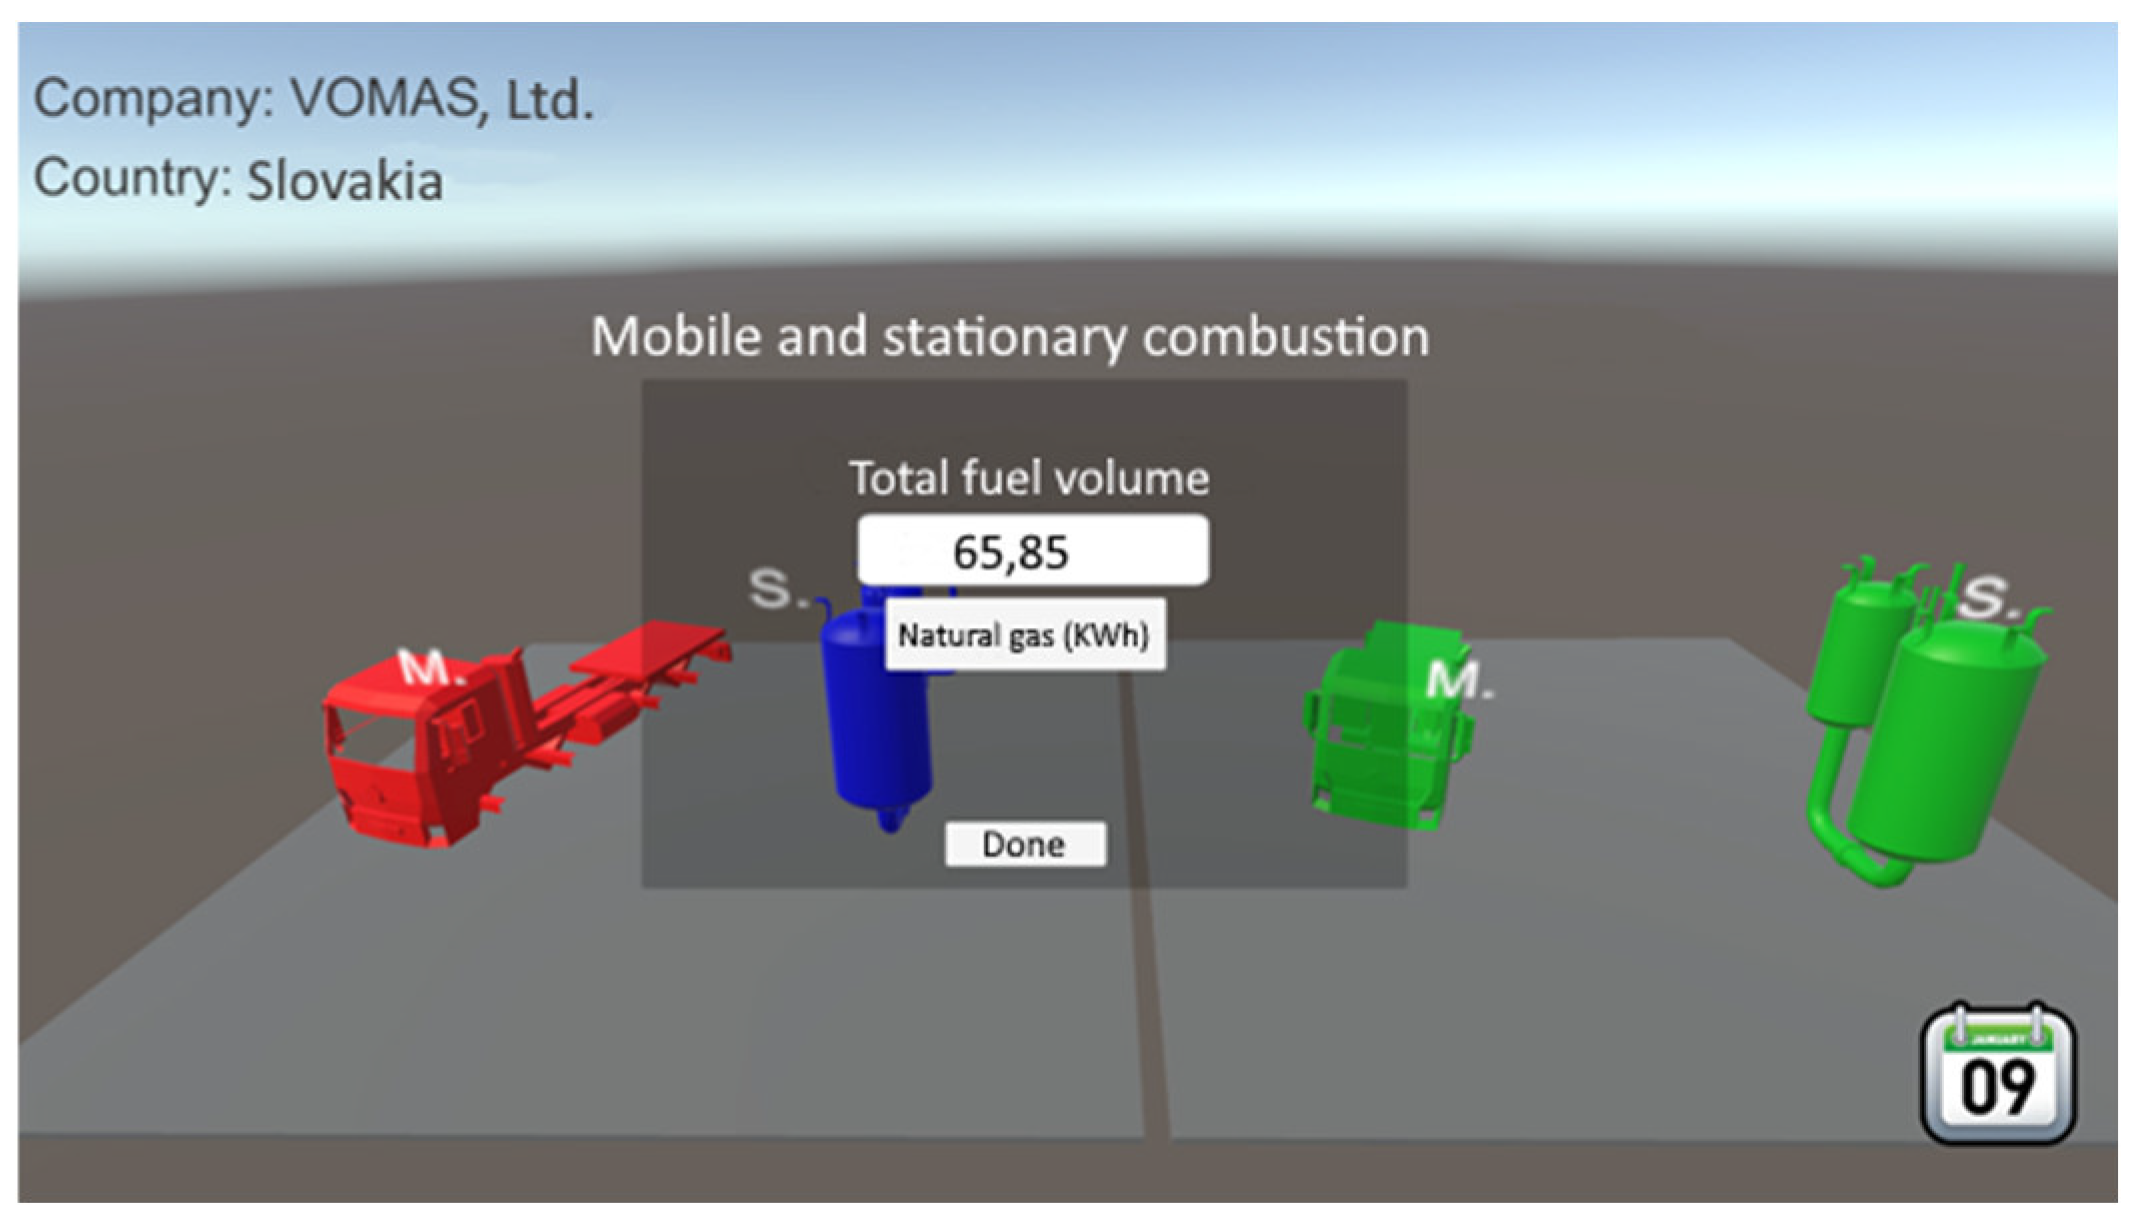
- Stationary Combustion
- -
- Total Fuel Volume: The amount of fuel consumed over a specific time interval.
- -
- Fuel Type: The type of fuel used as the basis for emission calculations.
2.8.2. Design and Methodology for Simulating Scope 1 Emission Reduction
- Number of electric vehicles replacing conventional vehicles,
- Energy consumption reduction coefficient.
2.8.3. Design of Scope 2 Emission Generation Simulation
- Machines in the Process
- -
- Utilization rate: The percentage of time the machine operates at maximum capacity.
- -
- Power rating: The machine’s operational power output.
- -
- Name: A machine description for better clarity.
- HVAC system
- Hourly average HVAC consumption
- -
- Theoretical median energy consumption of the HVAC system during the defined simulation period.
2.8.4. Design of Scope 2 Emission Reduction Simulation
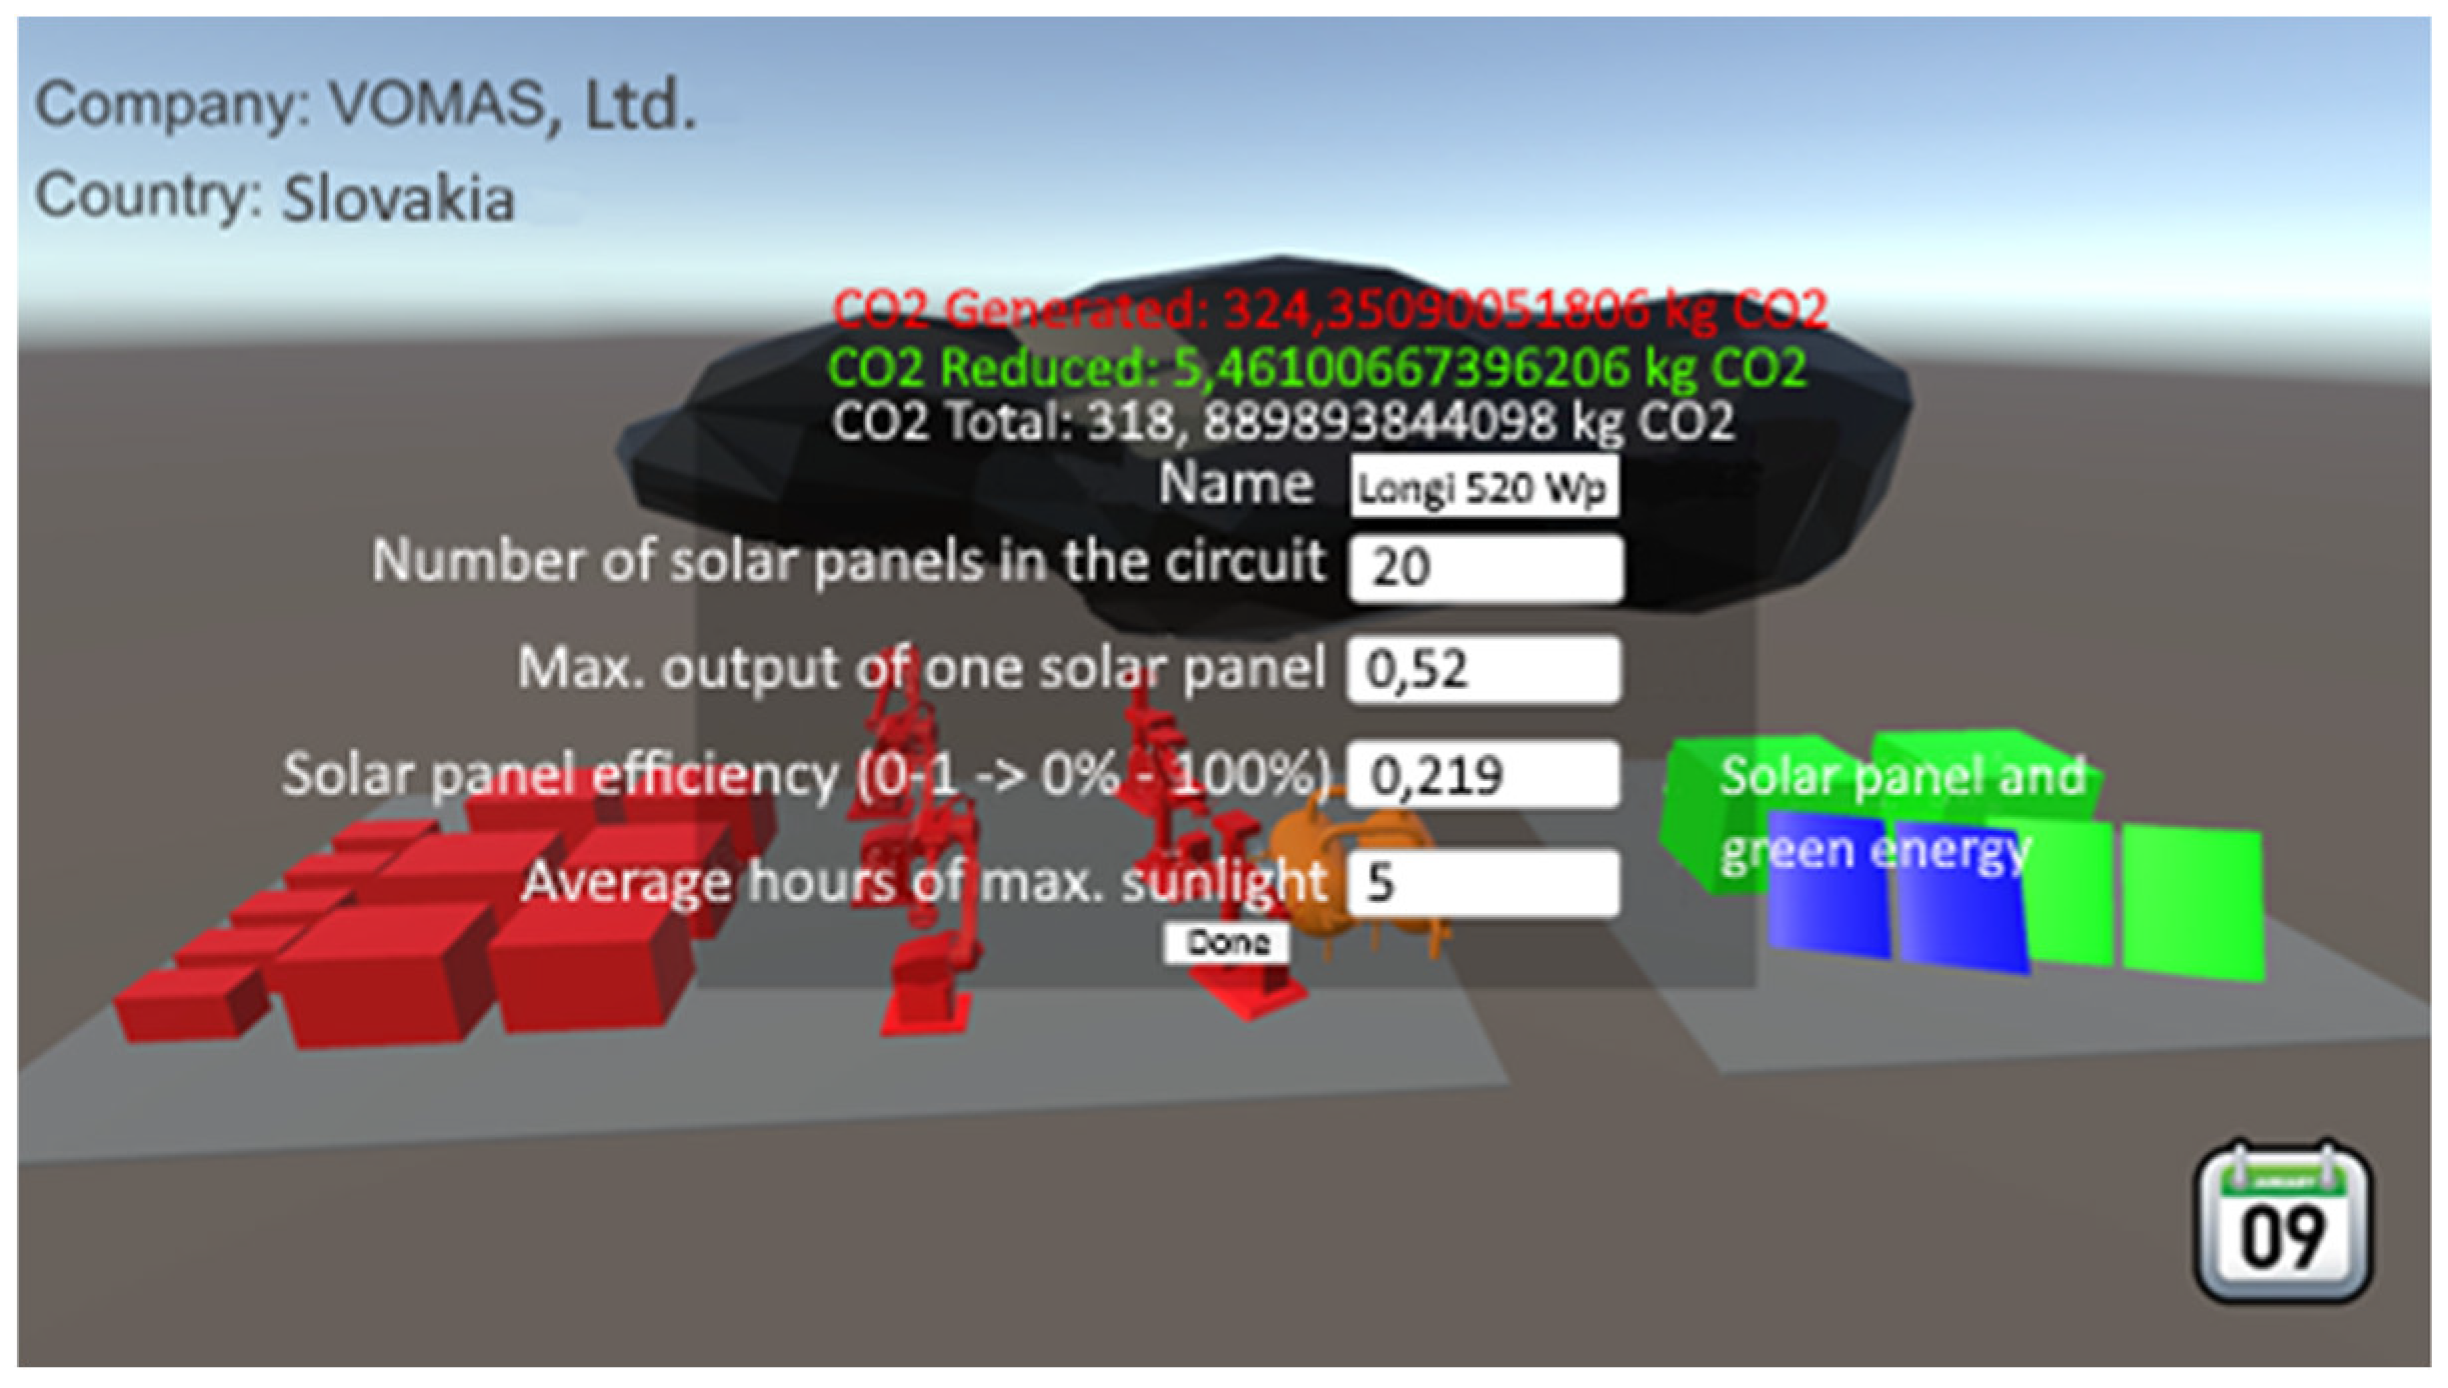
- Solar Panels
- -
- Number of solar panels in the circuit: The number of solar panels in the system.
- -
- Power rating: The operational power output.
- -
- Name: A machine description for better clarity.
- HVAC system
- New hourly average HVAC consumption
- -
- New theoretical median energy consumption during the defined simulation period.
- (a)
- Machine Script: Calculates machine power output based on utilization rate and maximum power.
- (b)
- GreenMachine Script: Ensures accurate energy output calculations for solar devices and their conversion into reduced emissions.
- (a)
- Machine
- -
- Calculation of machine power output and reduction performance.
- -
- The script computes the machine’s final power output based on current utilization and maximum capacity.
- -
- Defines machine attributes.
- (b)
- Quantification of Solar Panel Reduction
- -
- The script calculates the final power output of solar panels and, using the emission factor database, determines the reduction in emissions.
- -
- Defines solar panel attributes.
- -
- Collection and summarization of data from different machines.
- -
- Calculation of total emissions and reductions.
- -
- Displaying results.
- -
- Linking with other scripts.
- -
- Updating data.
- -
- Calculation of emissions and reductions.
- -
- Data retrieval.
- -
- Updating the user interface and data.
- -
- Managing HVAC input fields.
- -
- Collecting and updating data from all scripts and compiling results into the summary.
- -
- Quantifying relationships between attributes based on the algorithmic map.
- -
- Calculating CO2 emissions from vehicles and heating.
- -
- Computing emission reductions for green technologies (electric vehicles, green heating).
- -
- Total CO2 emissions calculation based on working hours, shifts, and simulation days.
- -
- Displaying final results.
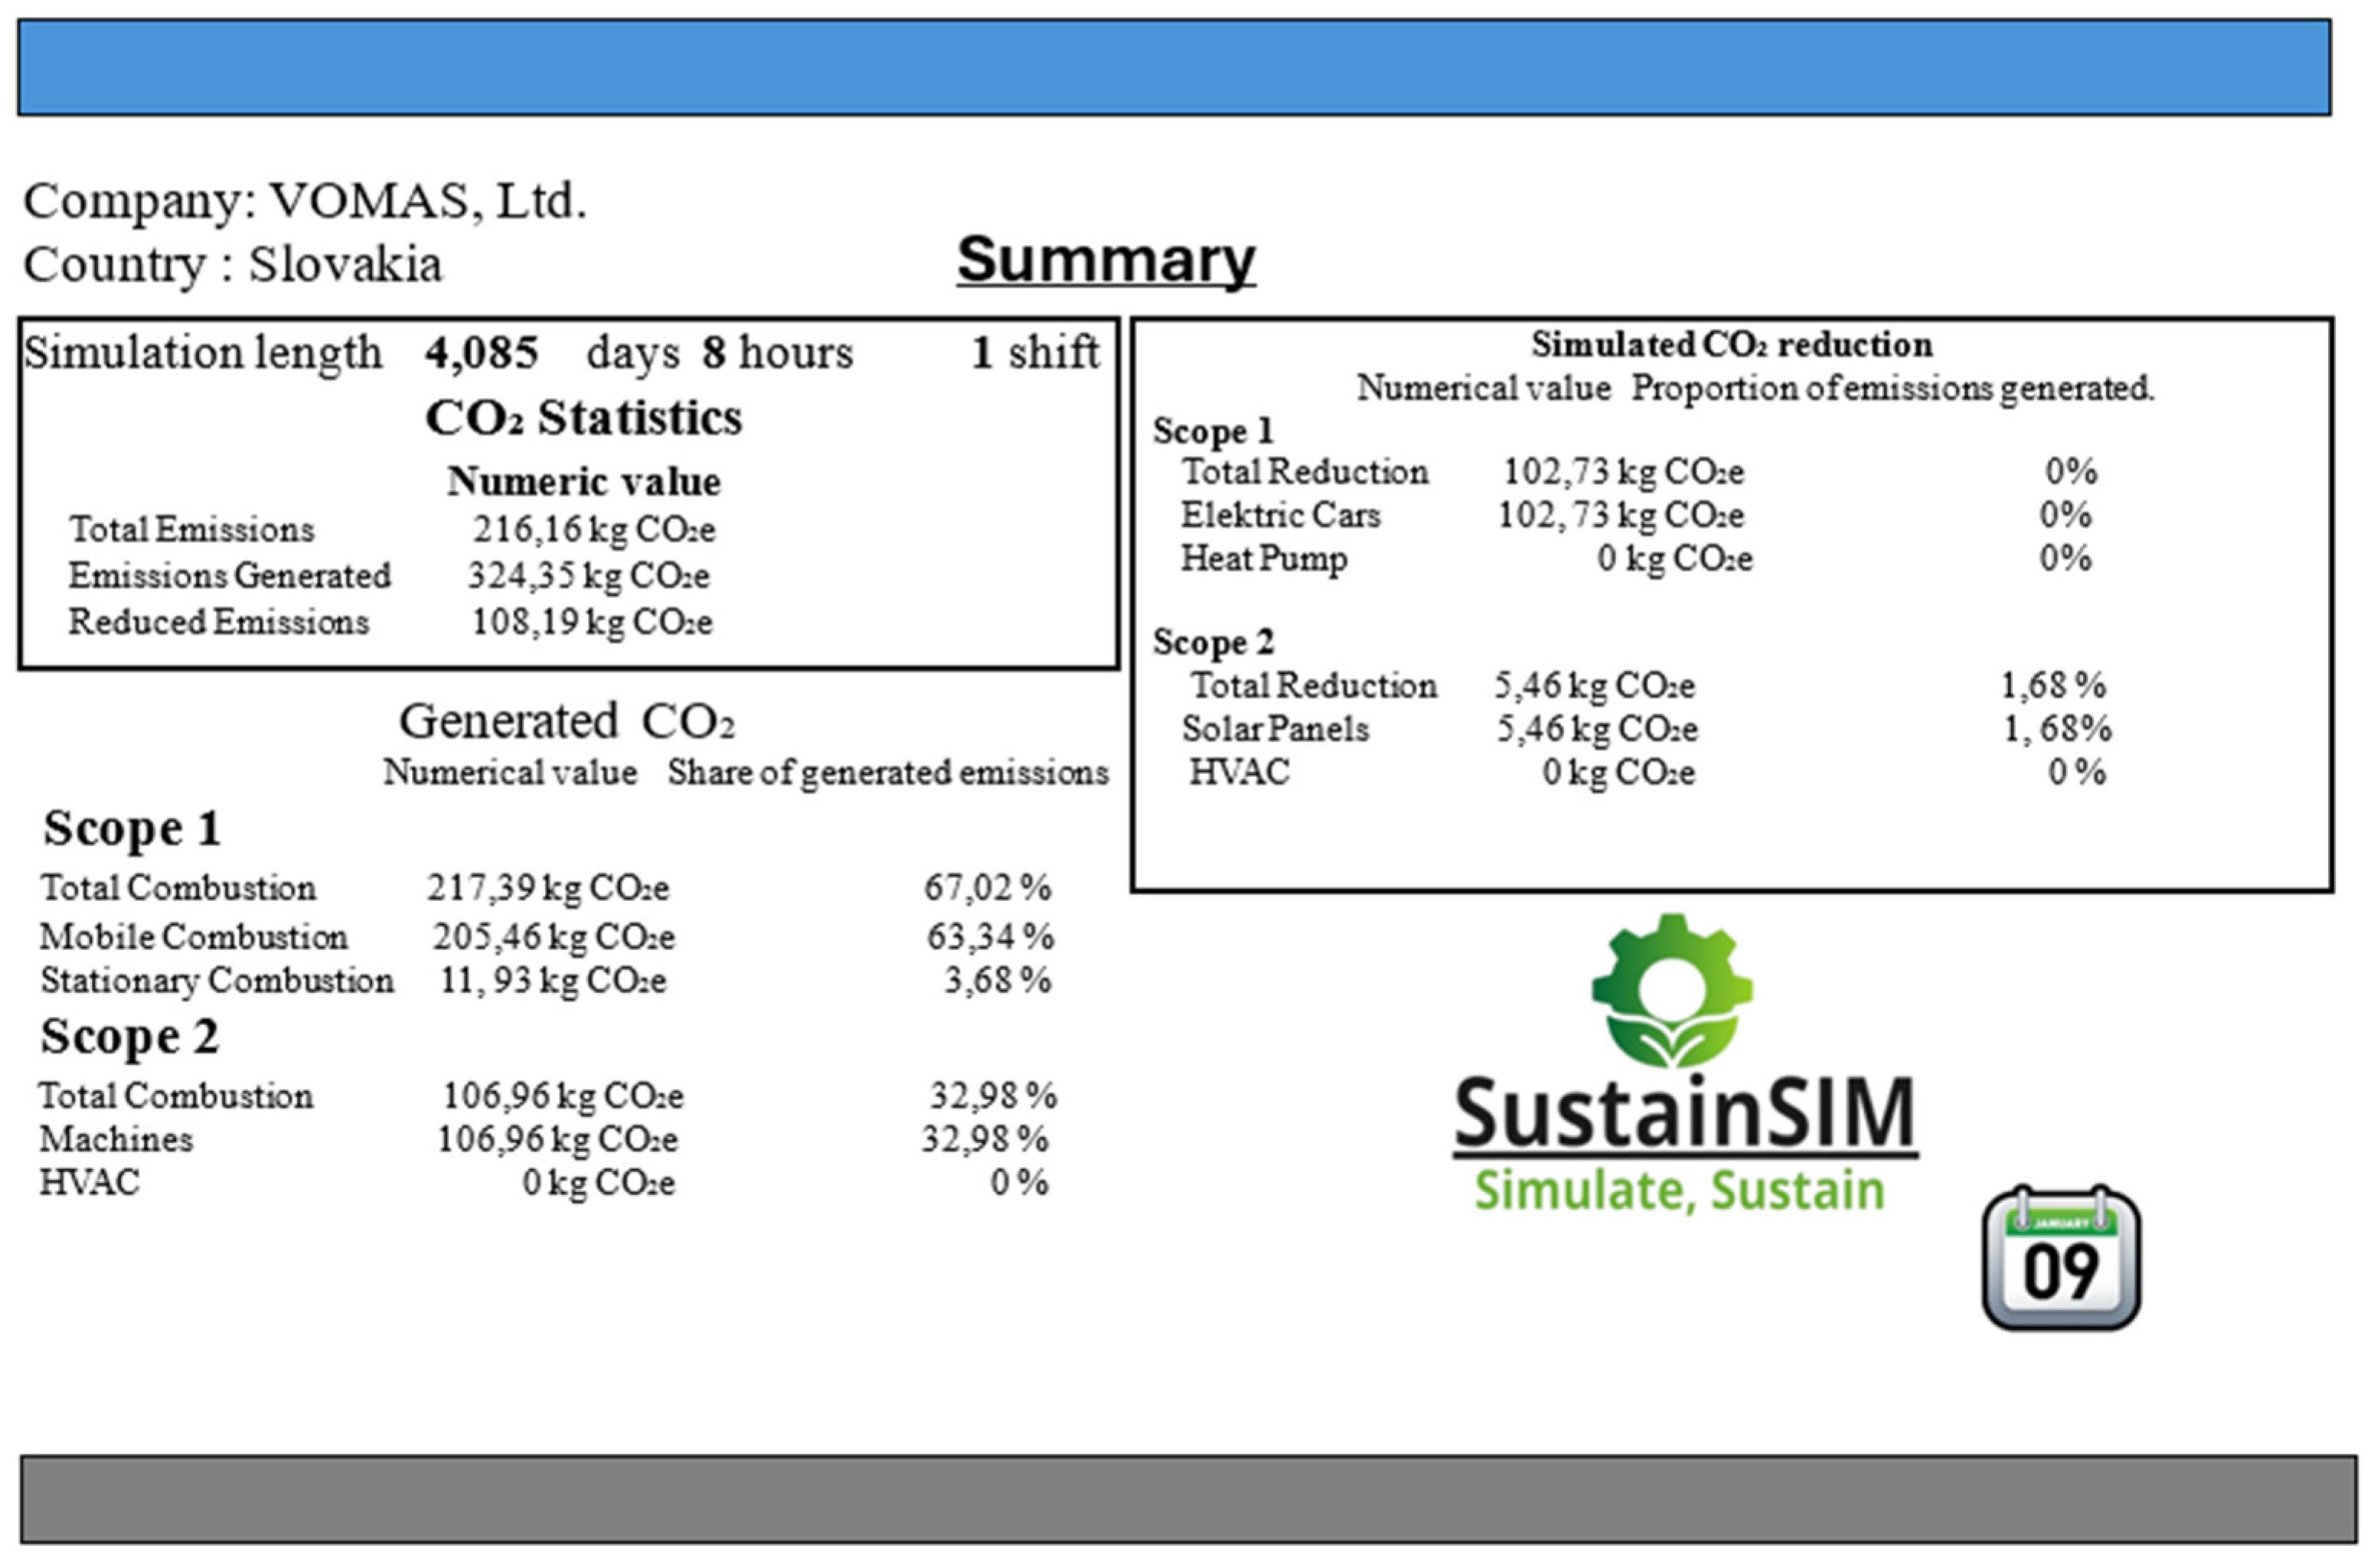
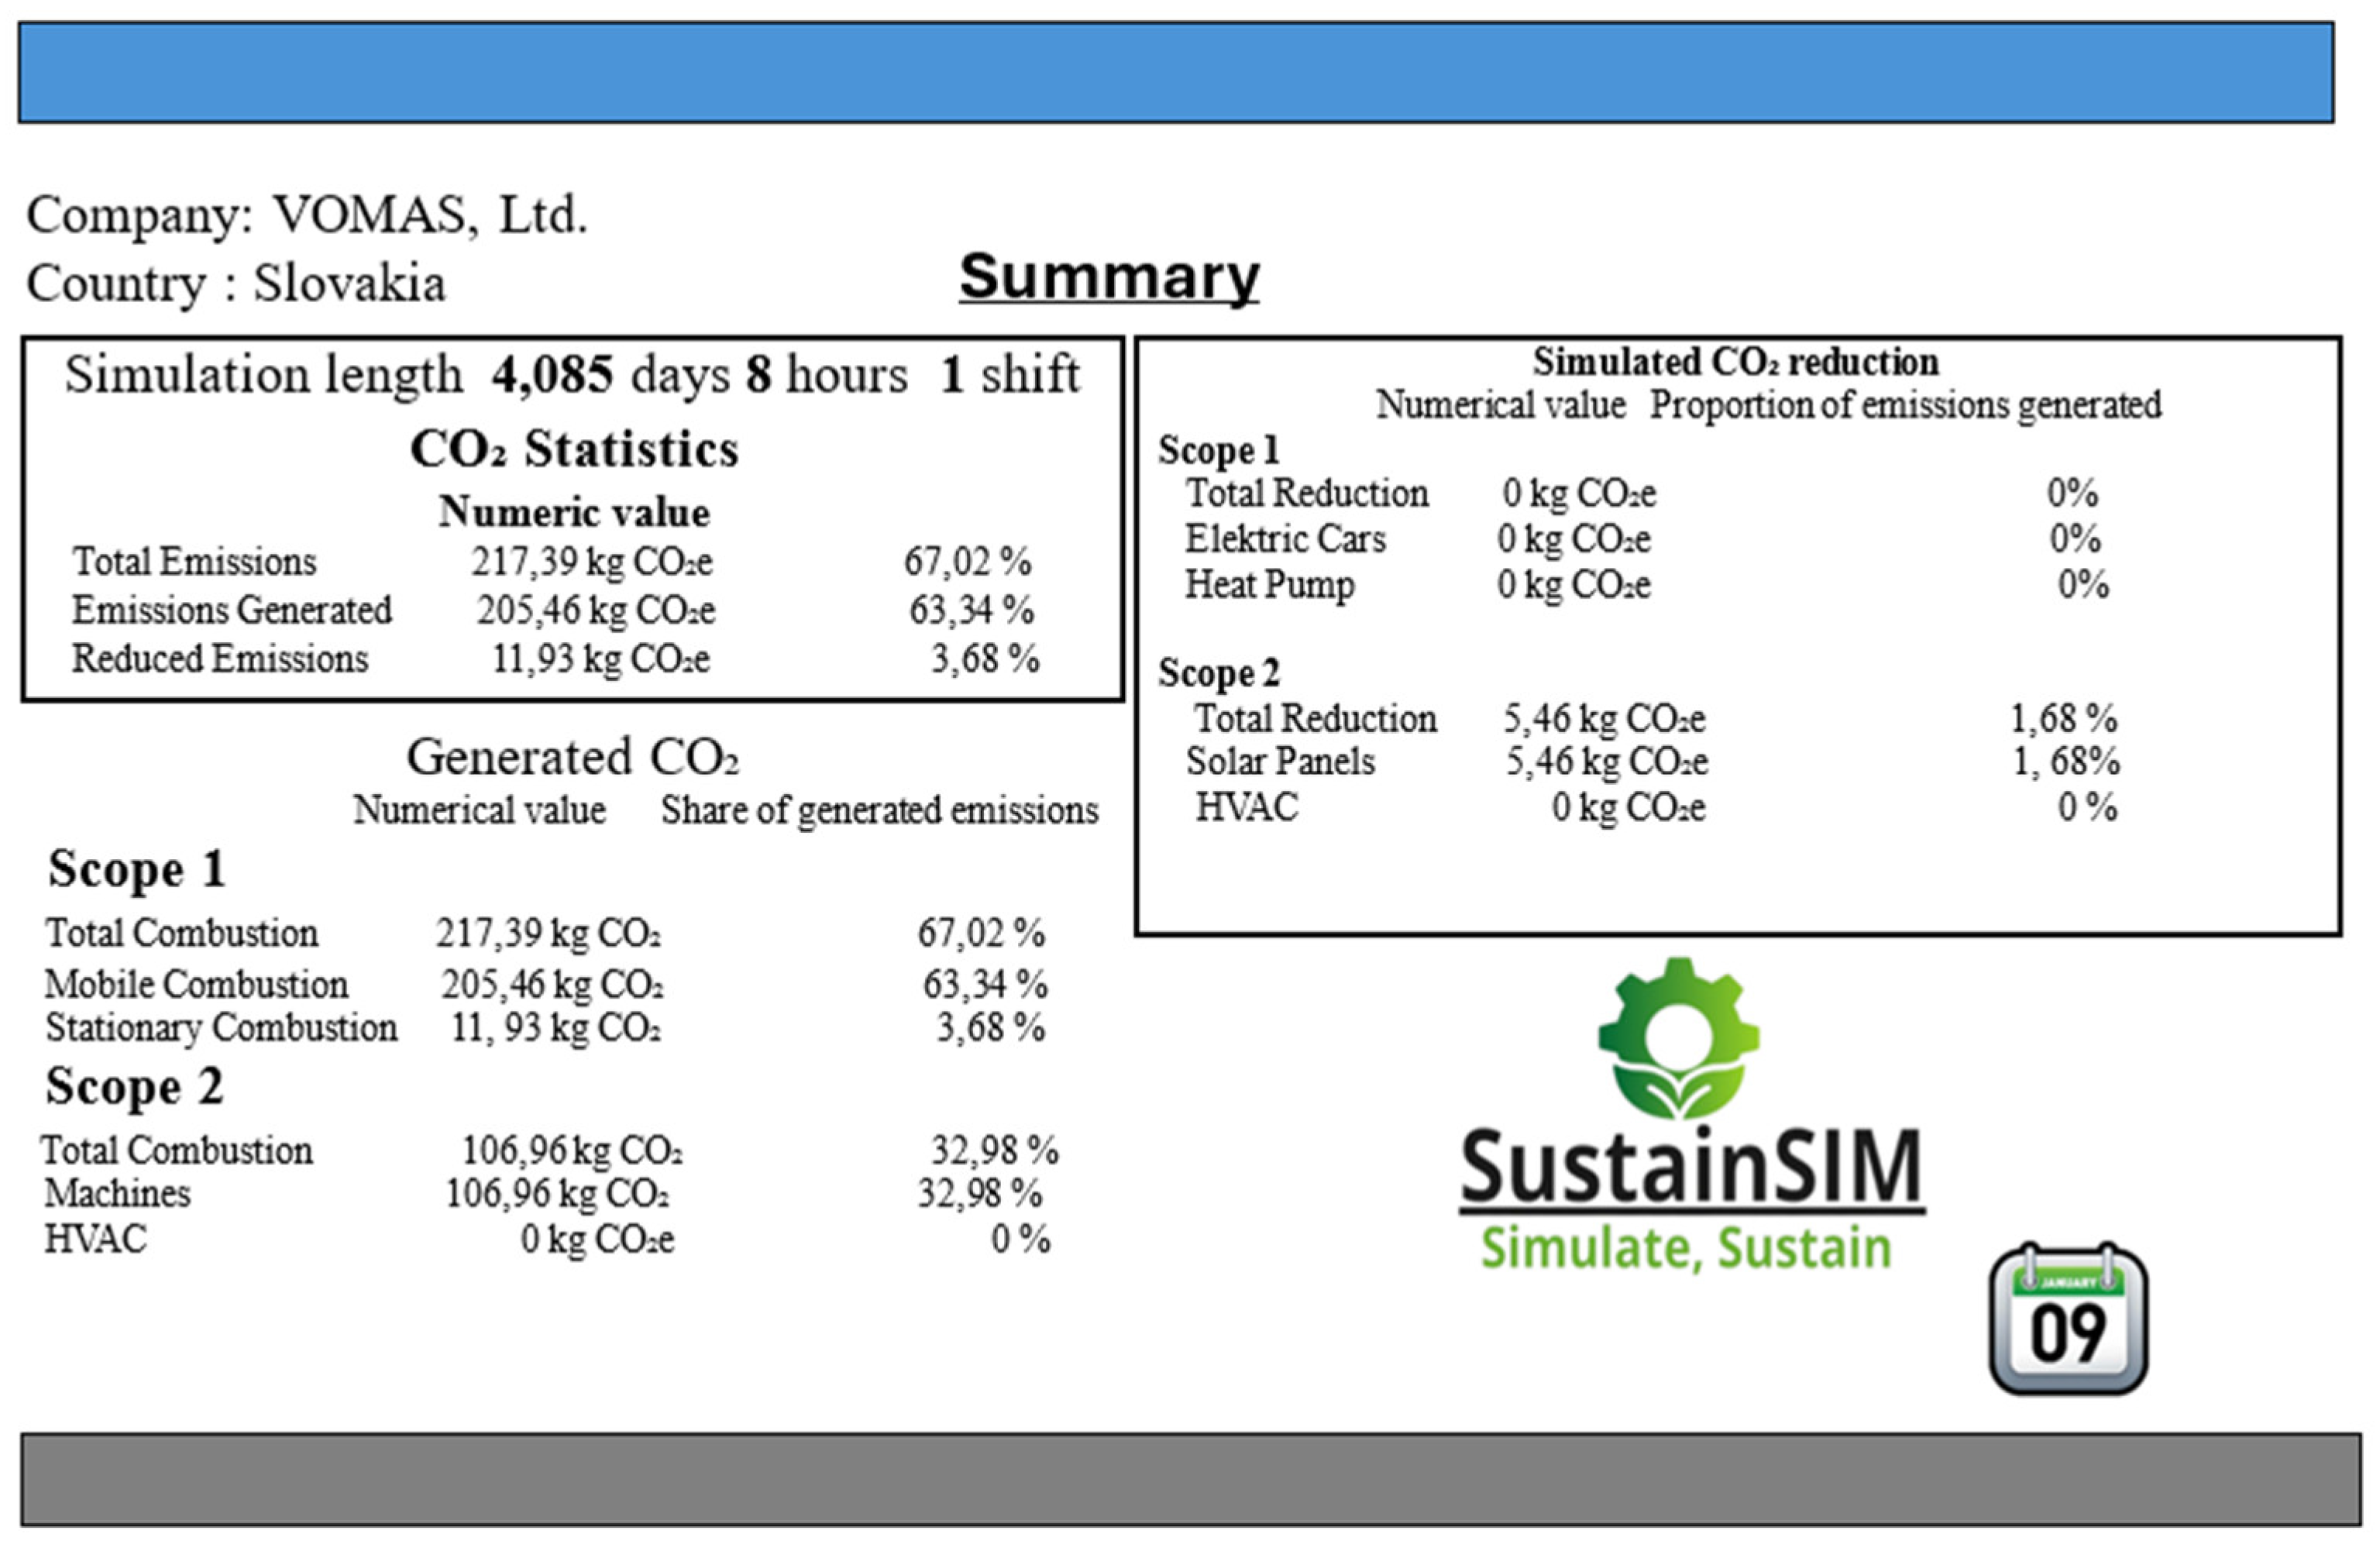
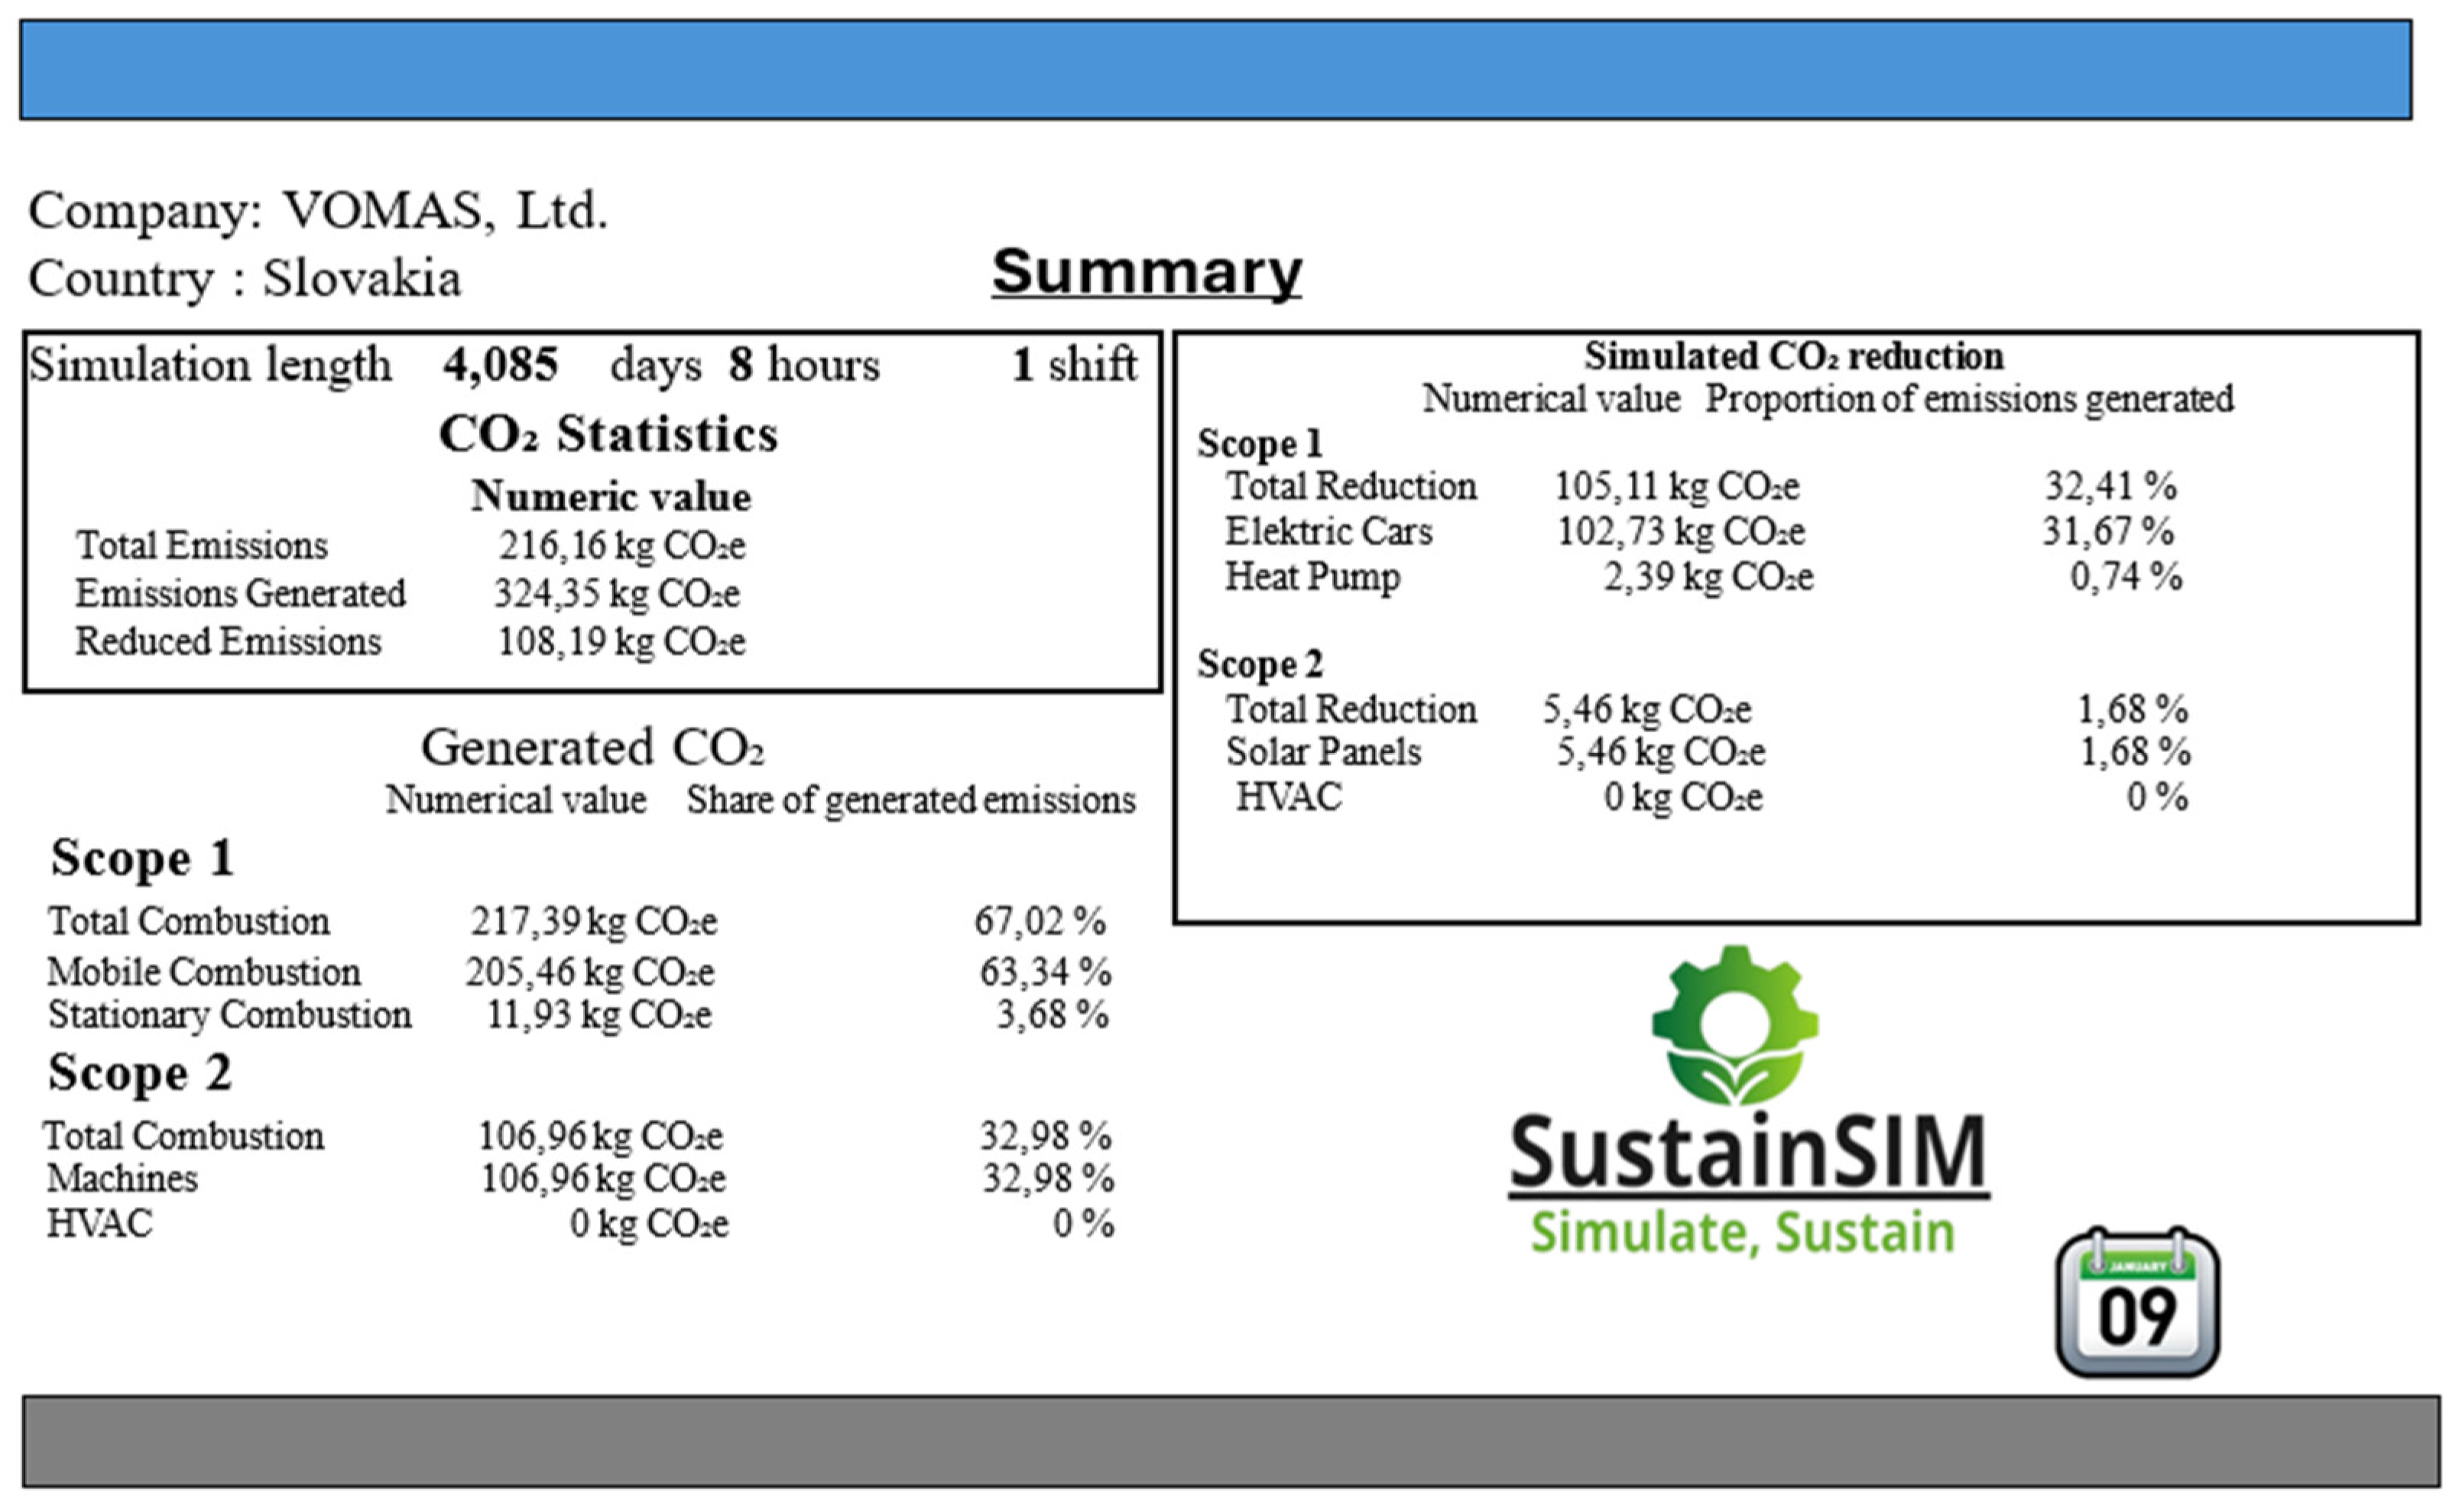
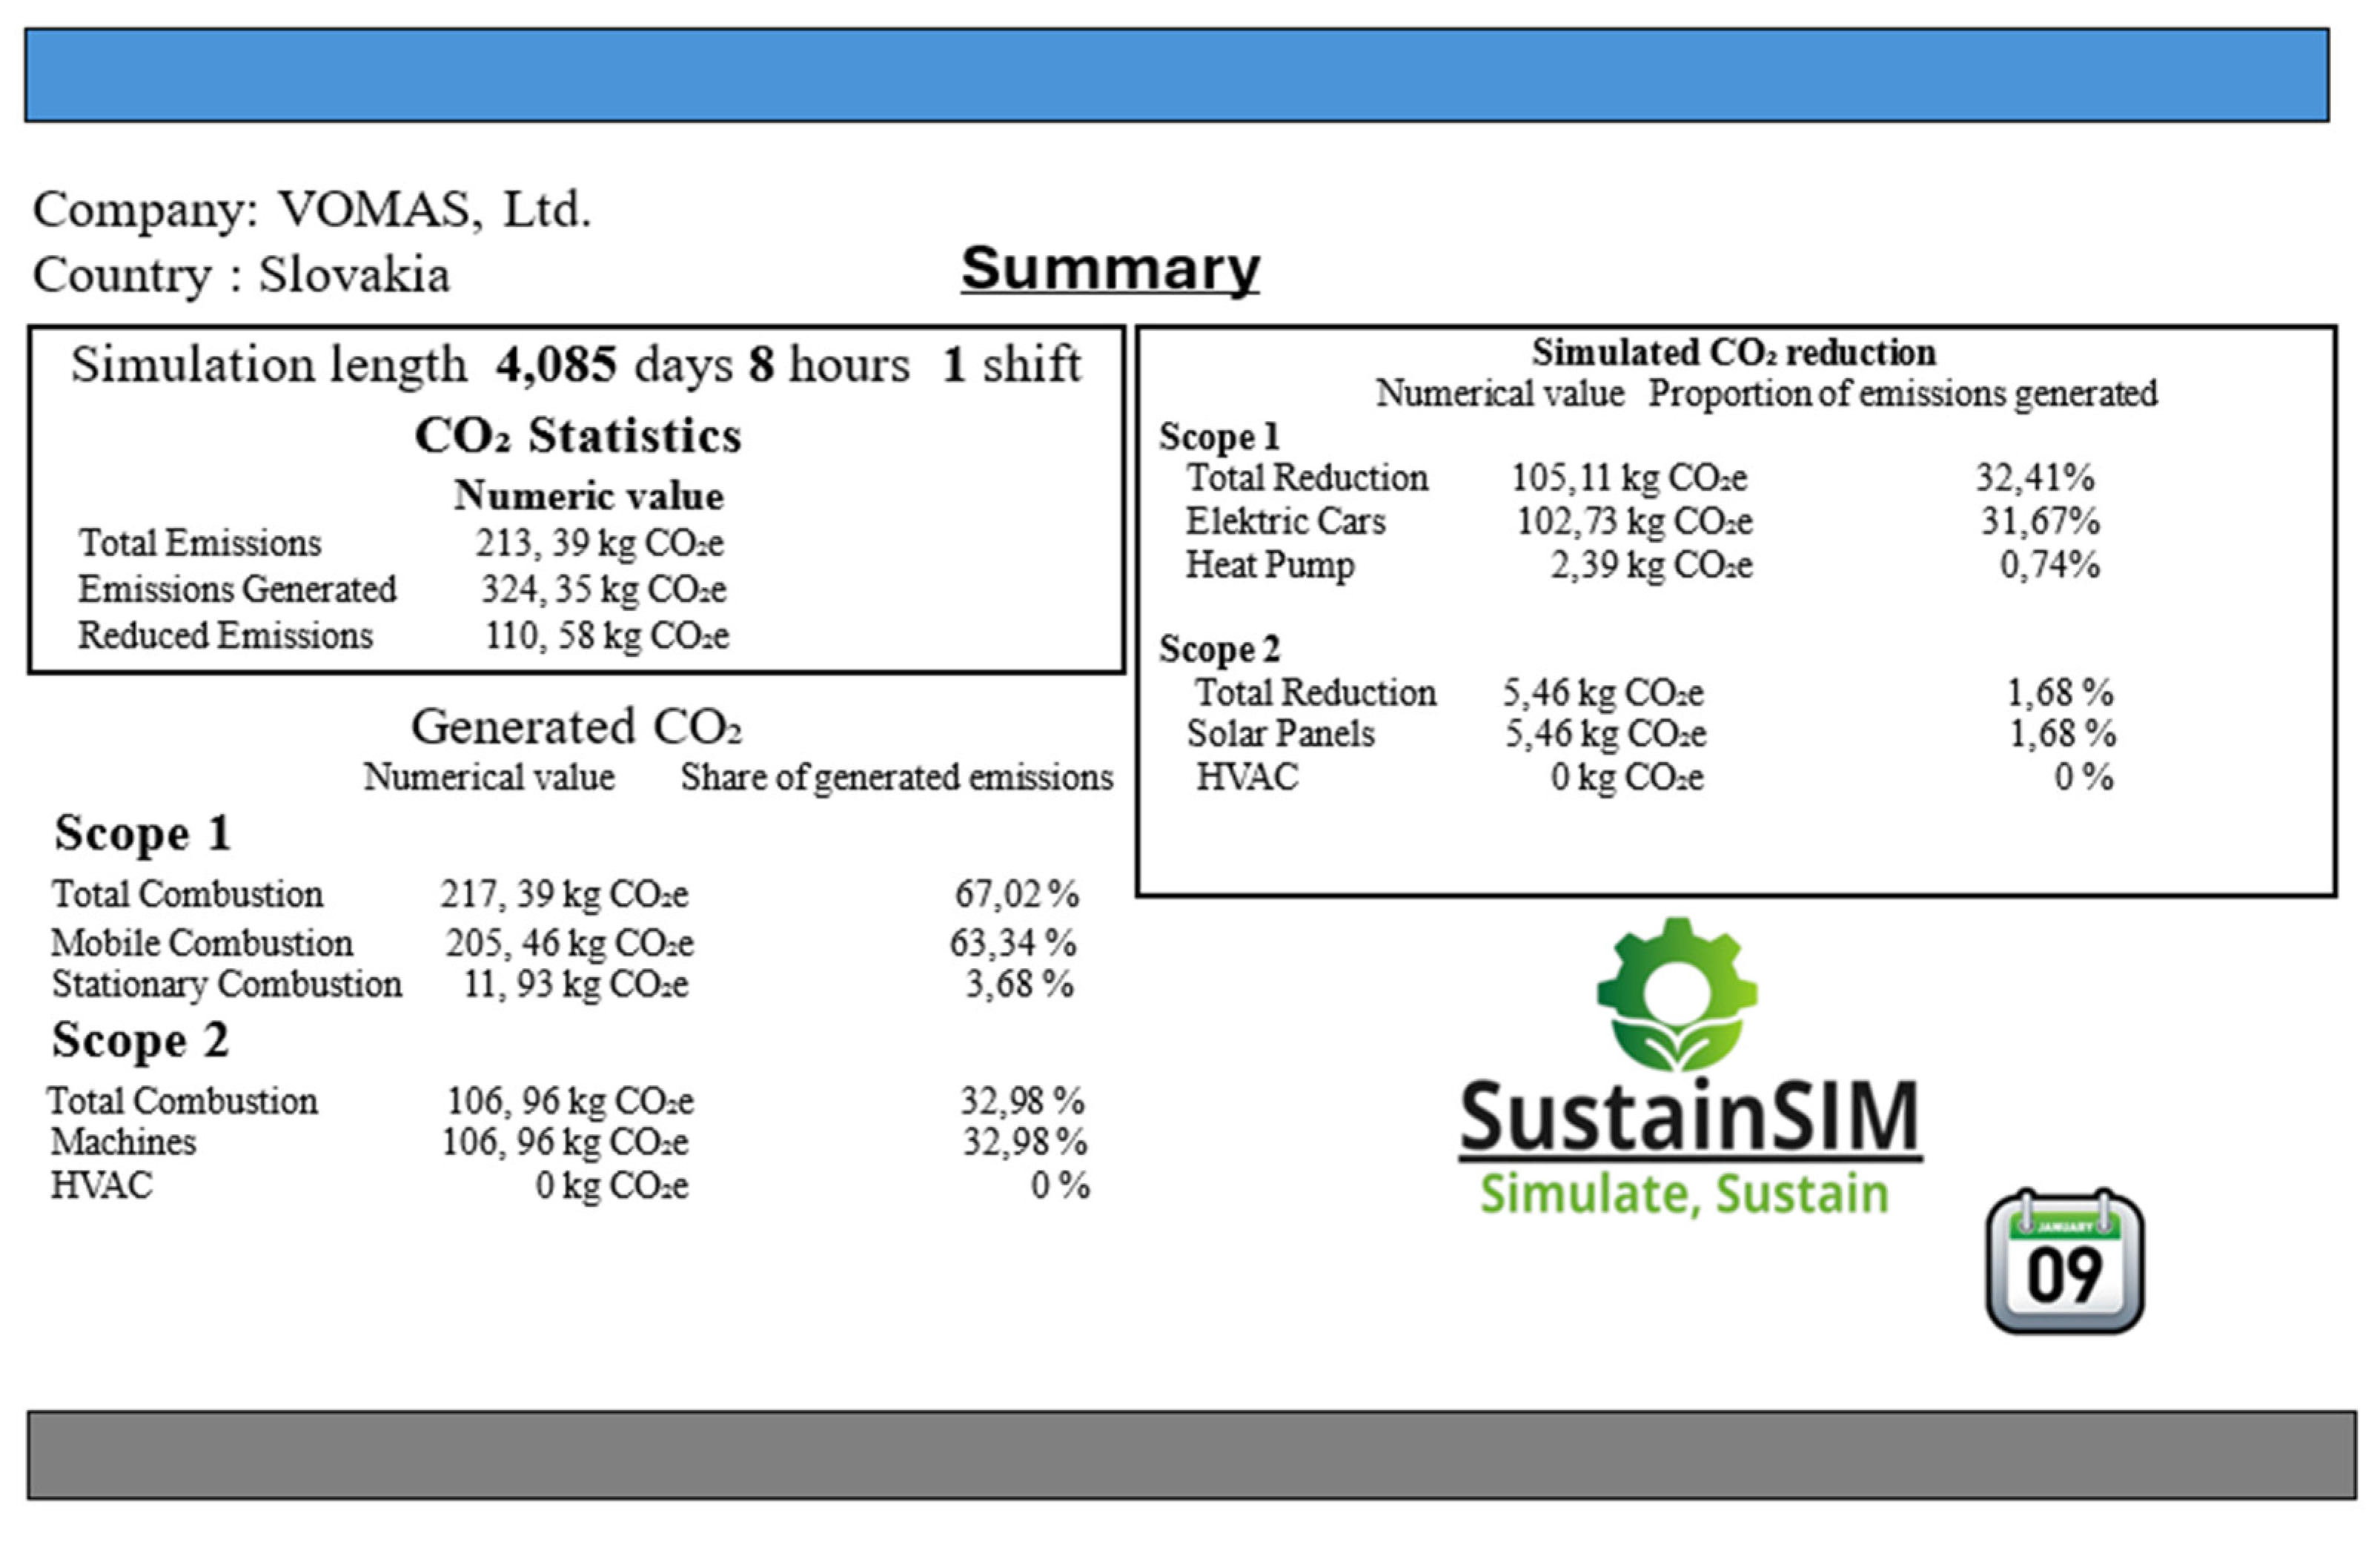
- Simulation duration in days
- Number of shifts per day
- Number of hours per work shift
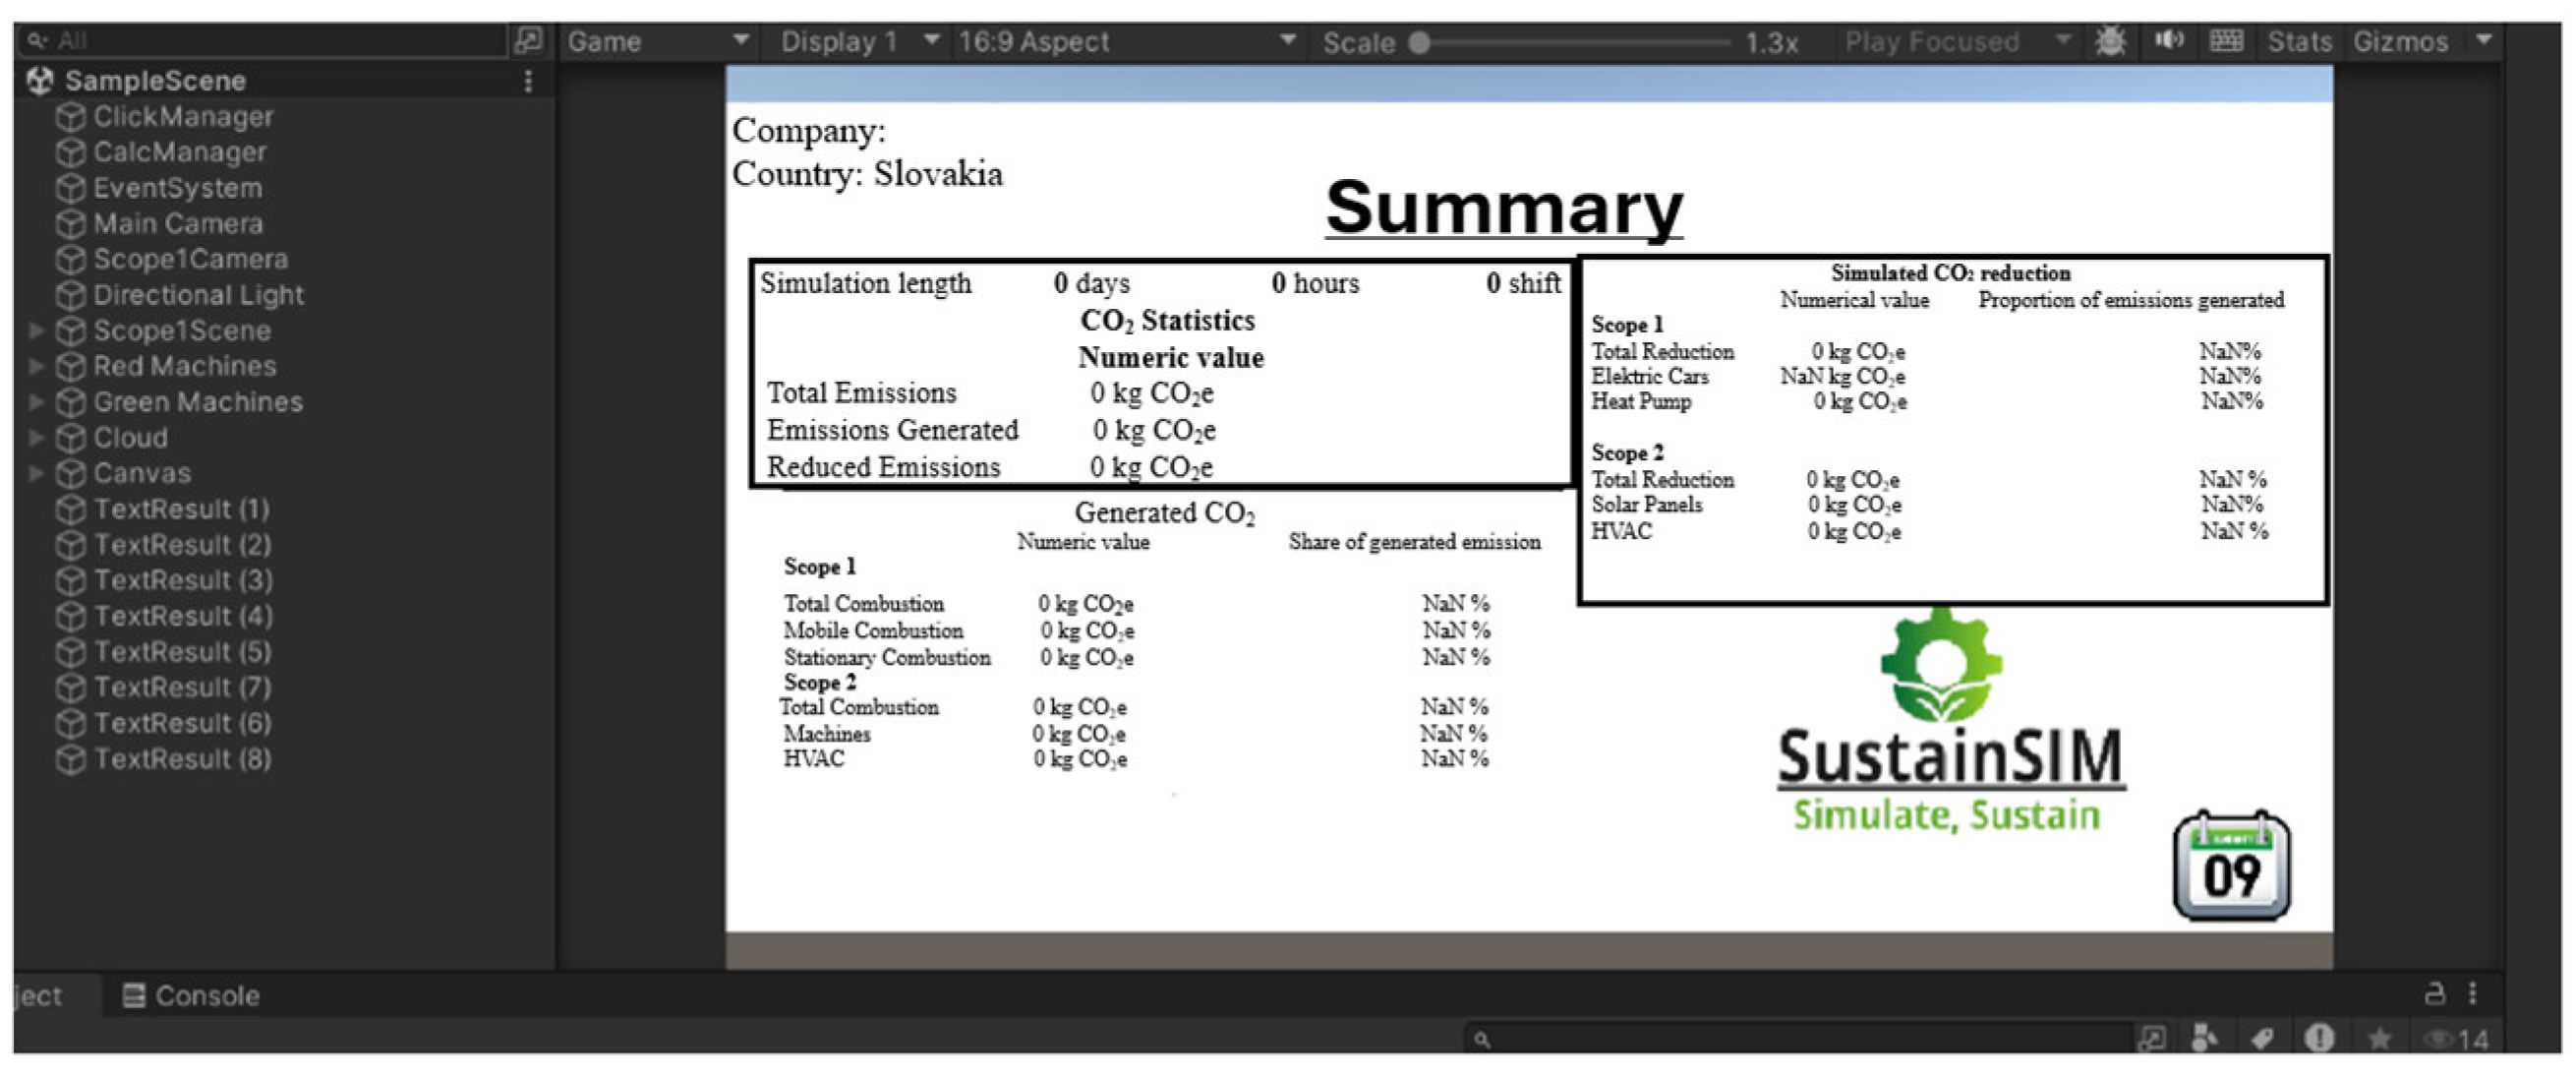
- Time Report: The duration of the simulation is expressed in days, hours, and shifts.
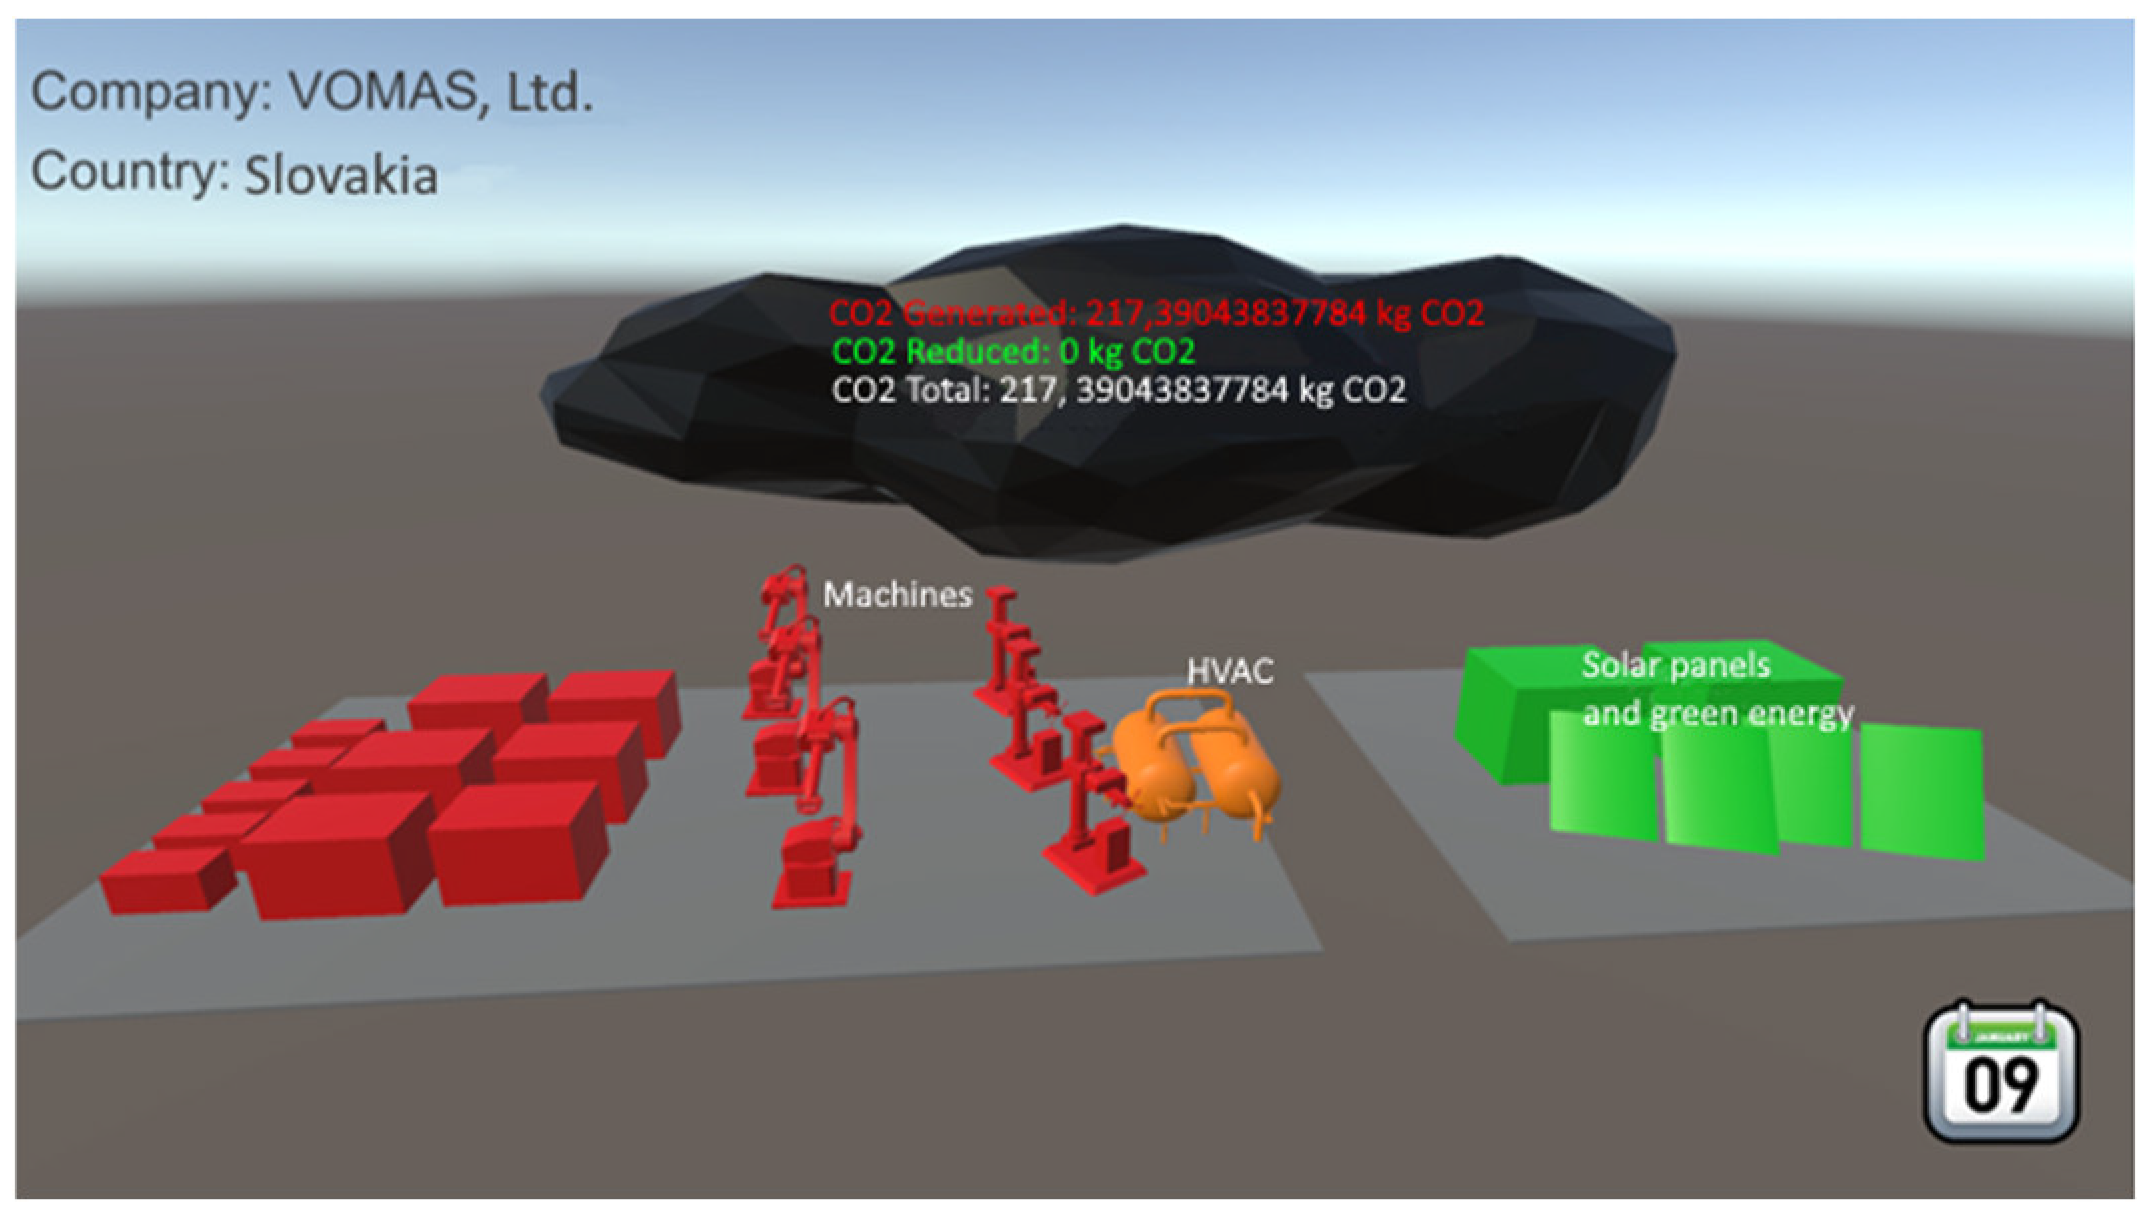
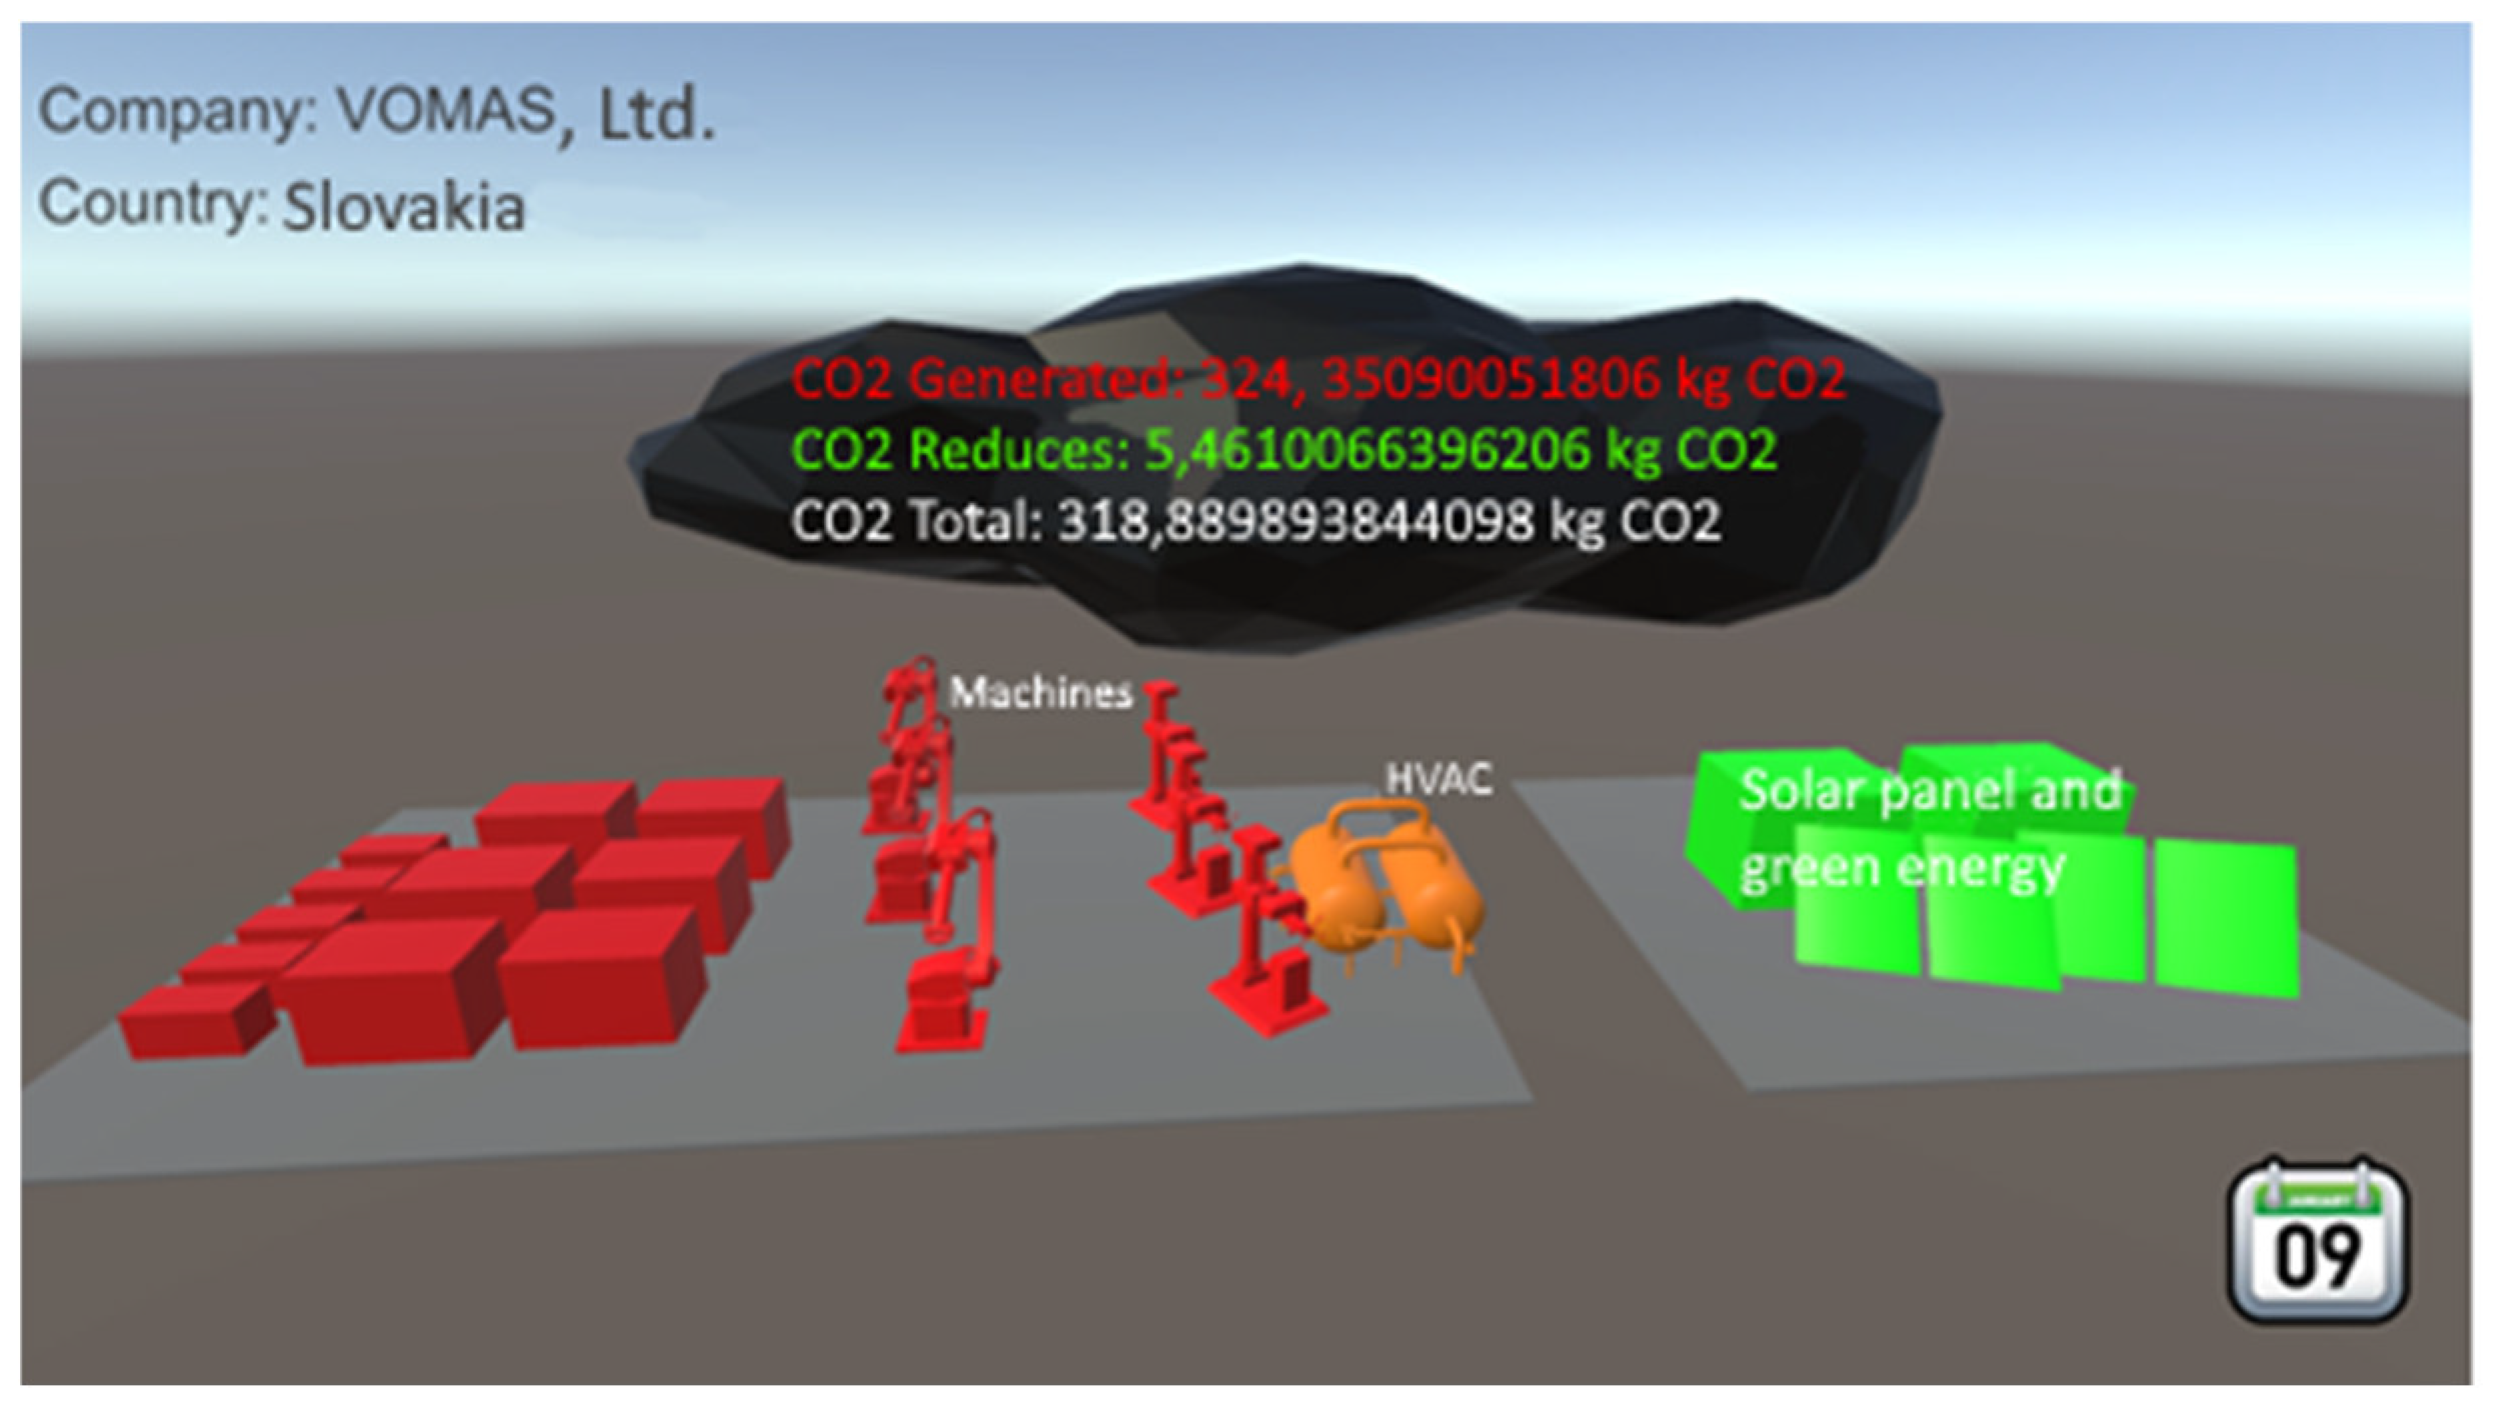
- CO2 Statistics: Key statistics on CO2 emissions, such as total emissions, generated emissions, and reduced emissions.
- Generated CO2: This section categorizes CO2 emissions by scope and source, displaying numerical values and their share of total generated emissions.
- Simulated CO2 Reduction: This section presents CO2 emission reductions achieved through various measures, along with numerical values and their share of total emissions.
- Total Emissions: The total amount of CO2 emissions (in kgCO2e).
- Generated Emissions: The amount of CO2 emissions generated during the simulation.
- Reduced Emissions: The amount of CO2 emissions reduced during the simulation.
- -
- Mobile Combustion: Emissions from mobile combustion sources.
- -
- Stationary Combustion: Emissions from stationary combustion sources.
- -
- Machine 1, Machine 2, …: Emissions generated by individual machines.
- -
- Electric Vehicles: Reduction of CO2 emissions through electric vehicles.
- -
- Heat Pumps: Reduction of CO2 emissions using heat pumps.
- -
- Solar Panels: Reduction of CO2 emissions using solar panels.
- -
- Numerical Value: The exact emission value in kg CO2e.
- -
- Share of Emissions: The percentage share of this value in total generated emissions.
2.9. Implementation of a Universal Reference Digital and Simulation Model for a Specific Process
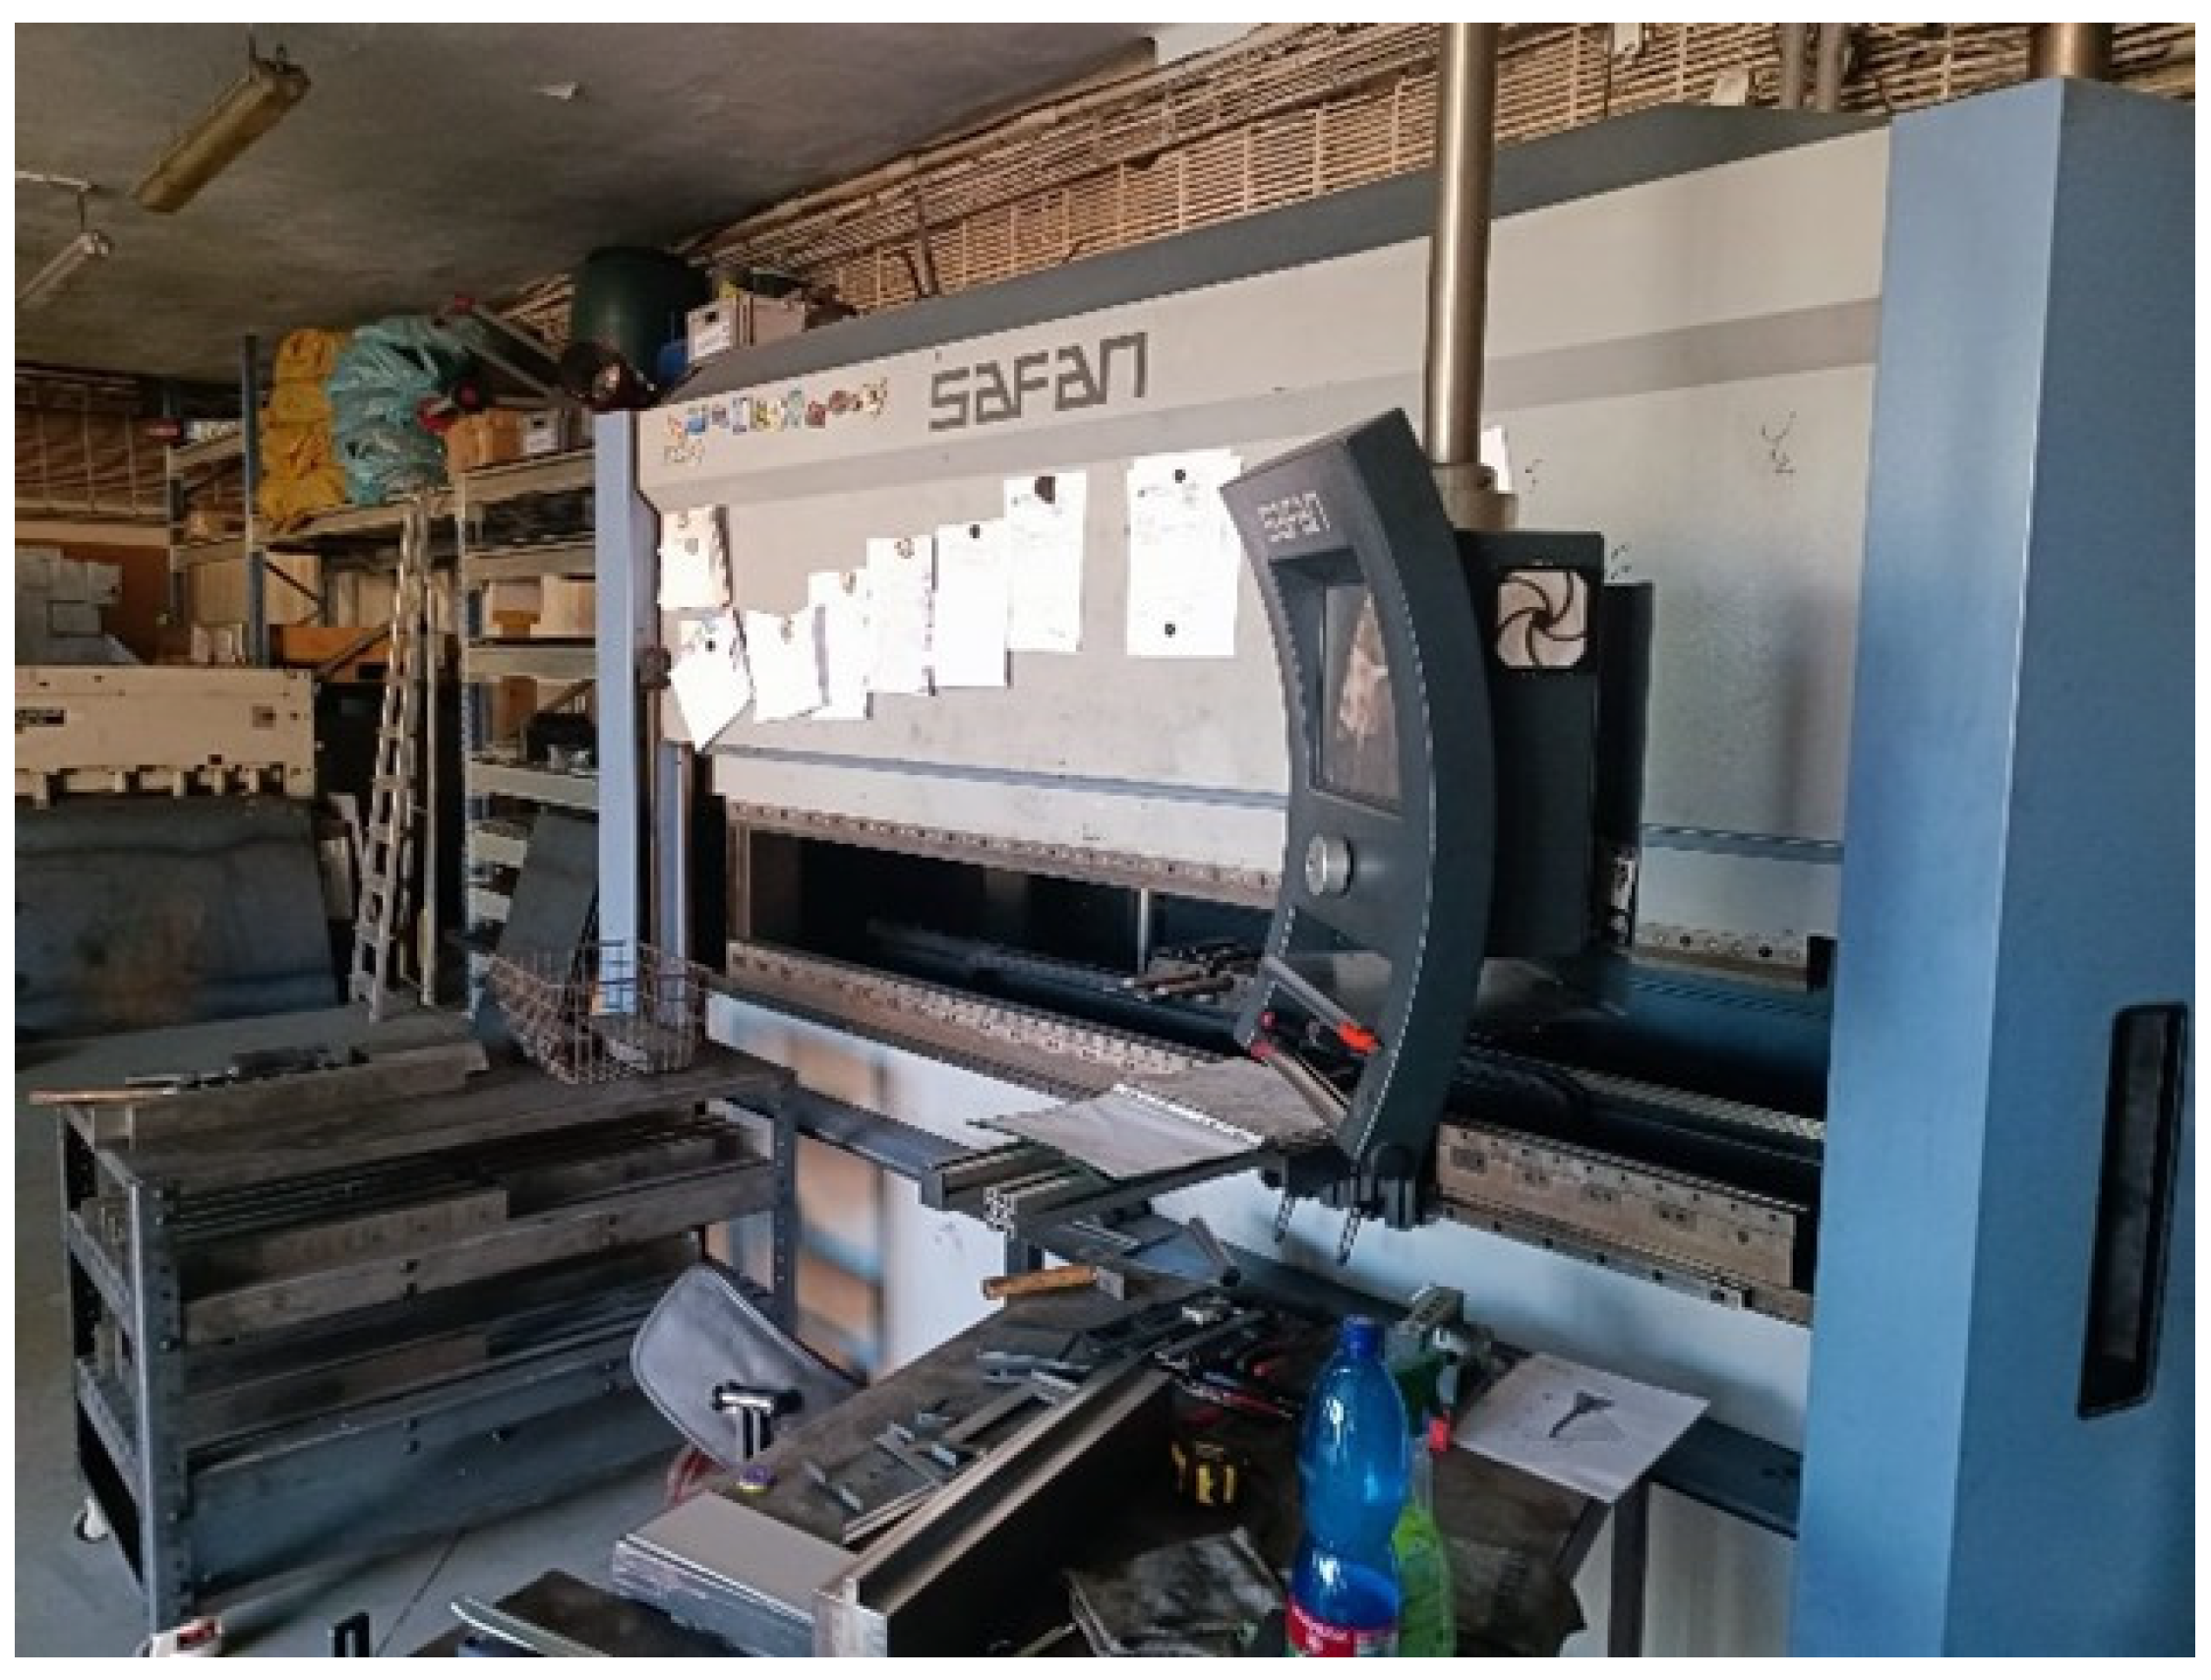
2.10. Machines Within the Operational Boundaries of the Company’s Production Process

| Model | Bodor P3 |
|---|---|
| Working Area | 3048 mm * 1524 mm |
| Laser Power | 24,000 kW |

| Model | TODC-6L |
|---|---|
| Number of Filter Cartridges | 6 |
| Airflow Rate | 4000 m3/h |
| Air Pressure | 3600 Pa |
| Filtration Efficiency | 99.99% |
| Filter Surface Area | 120 m2 |
| Fan Power | 7.5 kW |
| Waste Collection Container Capacity | 50 L |
| Power Supply | 400 V |

| Model | HL-20000-QG2/2 |
|---|---|
| Voltage and Frequency | 3 phases, 380 V, 50 Hz 3 phases, 380 V, 60 HZ |
| Maximum Current | 40.0 A |
| Rated Power | 28.1 kW |
| Horsepower | 13 horsepower/15 hp |
| Maximum Bending Length | 2550 mm |
|---|---|
| Maximum Pressing Force | 80 T |
| Speeds | Approach Speed: 115 mm/min Working Speed: 90 mm/min Return Speed: 100 mm/min |
| Power Consumption | 11 kW |
| Stationary Combustion | 403 | kWh | Natural Gas |
|---|---|---|---|
| Purchased Fuel (Gasoline) | 540 | L | Gasoline |
| Number of Working Days in the Month (June) | 25 | days | |
| Number of Hours per Working Day | 8 | h | |
| Share of Monthly Scope 1 Activities in the Process | 16.34% | ||
| Stationary Combustion Share-Based Contribution | 65.85 | kWh | |
| Purchased Fuel (Gasoline) Share-Based Contribution | 88.24 | L |
| Laser Cutting Machine | Numerical Value | Unit |
|---|---|---|
| Maximum Power | 24 | kW |
| Actual Cutting Power | 1.4297 | kW |
| Utilization Rate | 90% | |
| Production Capacity of the Operation | 153 | pcs/h |
| Actual Power (%) | 5.96% | |
| Smoke and Dust Extractor | ||
| Power | 7.5 | kW |
| Actual Power (%) | 5.96% | |
| Actual Power | 0.447 | kW |
| Utilization Rate (Operating Time) | 100% | |
| Cooler | ||
| Maximum Power | 28 | kW |
| Actual Power | 1.67 | kW |
| Share of Total Power | 5.96% | |
| Utilization Rate (Operating Time) | 100% | |
| Press Brake | ||
| Power | 11 | kW |
| Utilization Rate | 70% | |
| Production Capacity of the Operation | 200 | pcs/h |
| Share of Press Brake Operating Time in Production | 76.50 | |
| Production Process | ||
| Monthly Production | 5000 | pcs/month |
| Number of Operating Hours of the Laser Cutter | 32.68 | h |
| Number of Operating Hours of the Press Brake | 25 | h |
| Share of Laser Cutter in Production | 100% | |
| Share of Press Brake in Production | 76.5% | |
| Number of Working Days (8 h) Required for Production | 4.0849673 |
| Machine | Maximum Power (kW) | Actual Power (kW) | Utilization | Production Capacity (pcs/h) | Actual Power (%) | |
|---|---|---|---|---|---|---|
| Laser Cutting Machine | 24 | 1.4297 | 90% (0.9) | 153 | 5.96 | |
| O1 | Smoke and Dust Extractor | 7.5 | 0.447 | 100% (1) | - | 5.96 |
| Cooler (Including Pump) | 28 | 1.67 | 100% (1) | - | 5.96 | |
| O2 | Press Brake | 11 | m. 76.50% | 70% (0.7) | 200 | - |


| Model | Longi 520Wp Hi-MO 6 |
|---|---|
| Mechanical Properties | |
| Dimensions | 2094 × 1134 × 35 mm |
| Weight | 26 kg |
| Number of Cells | 6 × 22 (technology HPBC) |
| Cell Surface | 3.2 mm tempered glass |
| Durability | IP68 (junction box) |
| Connection Type | MC4 |
| Output Cable | 4 mm2 |
| Frame Colour | black |
| Electrical Properties | |
| Maximum Power | 520 Wp |
| Open-Circuit Voltage | 47.58 V |
| Short-Circuit Current | 14.05 A |
| Maximum Voltage | 39.91 V |
| Maximum Current (Imp) | 13.03 A |
| Efficiency | 21.9% |
| Power Tolerance | 0~3% |
| Operating Conditions | |
| Maximum System Voltage | 1500 VDC |
| Operating Temperature | −40~+85 °C |
| Maximum Snow Load | 5400 Pa |
| Nominal Operating Cell Temperature (NOCT) | 45 °C +/− 2 °C |
3. Results
- Scope 2 Calculations
- Scope 1 Calculations
- Calculation of the Company’s Total Monthly Emissions
- Number of Working Days in the Month (June): 25 days
- Number of Working Hours per Day: 8 h
- Production Duration: 32.68 h (4.0849673 working days)
- Total Number of Working Hours per Month
- Total hours = Number of working days × Number of working hours per day
- Total hours = 200 working hours
4. Discussion
5. Conclusions
Author Contributions
Funding
Institutional Review Board Statement
Informed Consent Statement
Data Availability Statement
Conflicts of Interest
References
- Yang, Y.; Du, Y. Impact of technological innovation on CO2 emissions and emissions trend prediction on ‘New Normal’ economy in China. Atmos. Pollut. Res. 2019, 10, 152–161. [Google Scholar]
- Bukhari, H.; Basingab, M.S.; Rizwan, A.; Sanchez-Chero, M.; Pavlatos, C.; Vallejos More, L.A.; Fotis, G. Sustainable green supply chain and logistics management using adaptive fuzzy-based particle swarm optimization. Sustain. Comput. Inform. Syst. 2025, 46, 101119. [Google Scholar] [CrossRef]
- Fani, V.; Bucci, I.; Bandinelli, R.; Ribeiro da Silva, E. Sustainable reverse logistics network design using simulation: Insights from the fashion industry. Clean. Logist. Supply Chain 2025, 14, 100201. [Google Scholar] [CrossRef]
- Chen, X.; Zhang, C. A dynamic analysis of a green closed-loop supply chain with different on-line platform smart recycling and selling models. Comput. Ind. Eng. 2025, 200, 110748. [Google Scholar] [CrossRef]
- Lobus, N.V.; Knyazeva, M.A.; Popova, A.F.; Kulikovskiy, M.S. Carbon Footprint Reduction and Climate Change Mitigation: A Review of the Approaches, Technologies, and Implementation Challenges. J. Carbon Res. 2023, 9, 120. [Google Scholar] [CrossRef]
- EN 14181:2014; Stationary Source Emissions—Quality Assurance of Automated Measuring Systems. European Committee for Standardization: Brussels, Belgium, 2014.
- World Business Council for Sustainable Development; World Resources Institute. The GHG Protocol Corporate Accounting and Reporting Standard; World Resources Institute, Ed.; WBCSD/WRI: Geneva, Switzerland, 2004; ISBN 10: 1569735689. [Google Scholar]
- Castelluccio, S.; Fiore, S.; Comoglio, C. Evaluating GHG Emissions and Renewable Energy Use in the Italian Energy Sector: Monitoring, Reporting, and Objectives. Environments 2025, 12, 55. [Google Scholar] [CrossRef]
- GHG Protocol and Carbon Trust team. Technical Guidance fo Calculationg Scope 3 Emissions (Version 1.0), Supplement to the Corporate Value Chain (Scope 3), Accounting & Reporting Standard. s.l.: GHG Protocol. 2013. Available online: https://ghgprotocol.org (accessed on 24 February 2025).
- Yan, X.; Wang, L.; Fang, M.; Hu, J. How Can Industrial Parks Achieve Carbon Neutrality? Literature Review and Research Prospect Based on the CiteSpace Knowledge Map. Sustainability 2023, 15, 372. [Google Scholar] [CrossRef]
- Ou, S.; Chien, Y.; Hsu, C.; Ning, F.; Pan, H. The Ideal Strategy of Carbon-Neutral for Park Landscape Design: A Proposal for a Rapid Detection Method. Appl. Sci. 2024, 14, 8128. [Google Scholar] [CrossRef]
- Josimović, B.; Manić, B.; Niković, A. Environmental Protection in the Planning of Large Solar Power Plants. Appl. Sci. 2024, 14, 6043. [Google Scholar] [CrossRef]
- Sarkar, B.; Omair, M.; Choi, S.-B. A Multi-Objective Optimization of Energy, Economic, and Carbon Emission in a Production Model under Sustainable Supply Chain Management. Appl. Sci. 2018, 8, 1744. [Google Scholar] [CrossRef]
- Rus, T.; Moldovan, R.-P.; Beu, D.; Pop, M.; Ceclan, A. Towards a Climate-Neutral Campus: Carbon Footprint Assessment in Higher Education Institutions. Appl. Sci. 2025, 15, 3695. [Google Scholar] [CrossRef]
- Karkhanis, E.; Kaushal, V.; Thakre, G.; Najaf, M. A Comprehensive Analysis of Environmental Emissions from Trenchless CIPP and Excavation Technologies for Sanitary Sewers. Appl. Sci. 2025, 15, 1268. [Google Scholar] [CrossRef]
- Kolendo, G.; Voronova, V.; Bumanis, G.; Korjakins, A.; Bajare, D. Life Cycle Assessment of End-of-Life Tire Disposal Methods and Potential Integration of Recycled Crumb Rubber in Cement Composites. Appl. Sci. 2024, 14, 11667. [Google Scholar] [CrossRef]
- Kishor, K.; Rani, R.; Rai, A.K.; Sharma, V. 3D Application Development Using Unity Real-Time Platform. In Proceedings of the Fourth Doctoral Symposium on Computational Intelligence (DoSCI 2023), Lucknow, India, 17 September 2023; pp. 665–675. [Google Scholar]
- Bastos, J.; Monforti-Ferrario, F.; Melica, G. Emission Factors for Electricity Consumption; Joint Research Centre (JRC): Brussels, Belgium, 2024. [Google Scholar]
- Rivera, A.; Movalia, S.; Rutkowski, E.; Rangel, Y.; Pitt, H.; Larsen, K. Global Greenhouse Gas Emissions: 1990–2021 and Preliminary 2022. Available online: https://rhg.com/research/global-greenhouse-gas-emissions-2022/ (accessed on 31 March 2025).
- Snyder, A. GHG Protocol. Available online: https://ghgprotocol.org/ (accessed on 28 March 2025).


| Upstream Emissions (Supply Chain) | Description |
|---|---|
| Purchase of goods and services | Emissions associated with the production and procurement of goods and services purchased by the organization. |
| Capital goods | Emissions associated with the production and acquisition of capital goods (e.g., buildings, machinery) used by the organization. |
| Fuel- and energy-related activities (not included in Scope 1 or Scope 2) | Emissions resulting from fuel- and energy-related activities not directly controlled by the organization (e.g., extraction, processing, and transportation of fuels). |
| Transportation and distribution within the supply chain | Emissions associated with the transportation and distribution of goods and materials within the supply chain. |
| Operational waste | Emissions resulting from the operational waste generated by the organization. |
| Commuting | Emissions from business-related travel undertaken by employees (e.g., flights, car rentals). |
| Employee commuting | Emissions associated with employee commuting to and from the workplace. |
| Leased assets within the supply chain | Emissions related to the production and use of leased assets within the supply chain. |
| Downstream Emissions (Distribution Chain) | Description |
|---|---|
| Transportation and distribution in the downstream chain | Emissions associated with the transportation and distribution of the organization’s products to customers. |
| Processing of sold products | Emissions associated with processing and usage of the organization’s products by customers. |
| Use of sold products | Emissions released during the usage of the organization’s products by customers. |
| Disposal and recycling of sold products | Emissions associated with disposal and recycling of the organization’s products at the end of their lifecycle. |
| Leased assets in the distribution chain | Emissions associated with leased assets within the distribution chain. |
| Franchises | Emissions related to activities of franchised operations. |
| Investments | Emissions associated with activities of companies in which the organization has invested. |
| SCOPE 1 | |||||
|---|---|---|---|---|---|
| Stationary Combustion | EF | Unit | Heat Content (HHV) | AR4 (kg CO2e) | Units |
| Anthracite coal | 2620.444762 | kg CO2e/t | 25.09 | 104.4418 | mmBtu |
| Bituminous coal | 2344.212774 | kg CO2e/t | 24.93 | 94.0318 | mmBtu |
| Sub-bituminous coal | 1689.15105 | kg CO2e/t | 17.25 | 97.9218 | mmBtu |
| Lignite coal | 1399.284278 | kg CO2e/t | 14.21 | 98.4718 | mmBtu |
| Mixed (commercial sector) | 2032.516302 | kg CO2e/t | 21.39 | 95.0218 | mmBtu |
| Mixed (power generation sector) | 1899.442614 | kg CO2e/t | 19.73 | 96.2718 | mmBtu |
| Mixed (industrial coking) | 2487.449304 | kg CO2e/t | 26.28 | 94.6518 | mmBtu |
| Mixed (industrial sector) | 2132.67723 | kg CO2e/t | 22.35 | 95.4218 | mmBtu |
| Coke coal | 2837.66064 | kg CO2e/t | 24.8 | 114.4218 | mmBtu |
| mmBtu/kWh | |||||
| Natural Gas | 0.181234216 | kg CO2e/kWh | 0.003412 | 53.1145 | mmBtu |
| Petroleum Products | EF | Unit | mmBtu/gallon | AR4 (kg CO2e) | Units |
| Motor gasoline | 2.327152145 | kgCO2e/L | 0.125 | 70.4738 | mmBtu |
| Diesel (<401 °F) | 2.254504796 | kgCO2e/L | 0.125 | 68.2738 | mmBtu |
| Biomass Fuels—Liquid | EF | Unit | mmBtu/gallon | AR4 (kg CO2e) | Units |
| Biodiesel (100%) | 2.498866923 | kg CO2e/L | 0.128 | 73.90028 | mmBtu |
| Ethanol (100%) | 1.520052919 | kg CO2e/L | 0.084 | 68.50028 | mmBtu |
| Animal fat | 2.348499898 | kg CO2e/L | 0.125 | 71.12028 | mmBtu |
| Vegetable oil | 2.587099839 | kg CO2e/L | 0.12 | 81.61028 | mmBtu |
| Mobile Combustion | EF | Unit Conversion | AR4 (kgCO2e) | Unit |
|---|---|---|---|---|
| Motor gasoline–Gasoline passenger cars | 2.328379026 | kg CO2e/L | 8.81386925 | gal |
| Motor gasoline–Gasoline light-duty trucks (vans, pickups, SUVs) | 2.329592742 | kg CO2e/L | 8.81846366 | gal |
| Motor gasoline–Gasoline heavy-duty trucks | 2.330650091 | kg CO2e/L | 8.82246616 | gal |
| Diesel–Diesel passenger cars | 2.699043499 | kg CO2e/L | 10.21698625 | gal |
| Diesel–Diesel light-duty trucks | 2.699217892 | kg CO2e/L | 10.2176464 | gal |
| Diesel–Diesel medium and heavy-duty trucks | 2.700819599 | Kg CO2e/L | 10.22370952 | gal |
| SCOPE 2 | ||
|---|---|---|
| Electricity Emission Factor | EF | Unit |
| Czech Republic (CZ) | 0.543839636 | kg CO2e/kWh |
| Hungary (HU) | 0.220382123 | kg CO2e/kWh |
| Austria (AT) | 0.242648905 | kg CO2e/kWh |
| Poland (PL) | 0.77629521 | kg CO2e/kWh |
| Slovakia (SK) | 0.352171691 | kg CO2e/kWh |
| Ukraine (UA) | 0.430147962 | kg CO2e/kWh |
| Solar Panel | ||
|---|---|---|
| Installed Solar Panel Capacity (kW) | 0.52 | kW |
| Number of Solar Panels | 20 | pcs |
| Efficiency | 21.9% | |
| Average Maximum Solar Irradiance | 5 | h/d |
| Day Length | 24 | h |
| Simulation Duration | 32.68 | h |
| Scope 2 Calculations | |
| Laser Cutting Machine | 13.34 kg CO2 |
| Smoke and Dust Extractor | 5.14 kg CO2 |
| Cooler | 19.20 kg CO2 |
| Press Brake | 67.76 kg CO2 |
| Total | 105.44 kg CO2 |
| Scope 1 Calculations | |
| Stationary Combustion (Natural Gas) | 73.05 kg CO2e |
| Mobile Combustion (Petrol) | 1257.33 kg CO2e |
| Total | 1330.38 kg CO2e |
| Process Share in Monthly Working Time | 16.34% |
| Proportional Scope 1 CO2 Emissions | 217.38 kg CO2e |
| Total Generated Emissions | 322.82 kg CO2e |
| Reduced Emissions | 5.45830 kg CO2 |
| Final Total Emissions | 317.36 kg CO2e |
Disclaimer/Publisher’s Note: The statements, opinions and data contained in all publications are solely those of the individual author(s) and contributor(s) and not of MDPI and/or the editor(s). MDPI and/or the editor(s) disclaim responsibility for any injury to people or property resulting from any ideas, methods, instructions or products referred to in the content. |
© 2025 by the authors. Licensee MDPI, Basel, Switzerland. This article is an open access article distributed under the terms and conditions of the Creative Commons Attribution (CC BY) license (https://creativecommons.org/licenses/by/4.0/).
Share and Cite
Kováč, J.; Malega, P.; Varjú, E.; Svetlík, J.; Stetulič, R. Reduction of Carbon Footprint in Mechanical Engineering Production Using a Universal Simulation Model. Appl. Sci. 2025, 15, 5358. https://doi.org/10.3390/app15105358
Kováč J, Malega P, Varjú E, Svetlík J, Stetulič R. Reduction of Carbon Footprint in Mechanical Engineering Production Using a Universal Simulation Model. Applied Sciences. 2025; 15(10):5358. https://doi.org/10.3390/app15105358
Chicago/Turabian StyleKováč, Juraj, Peter Malega, Erik Varjú, Jozef Svetlík, and Rudolf Stetulič. 2025. "Reduction of Carbon Footprint in Mechanical Engineering Production Using a Universal Simulation Model" Applied Sciences 15, no. 10: 5358. https://doi.org/10.3390/app15105358
APA StyleKováč, J., Malega, P., Varjú, E., Svetlík, J., & Stetulič, R. (2025). Reduction of Carbon Footprint in Mechanical Engineering Production Using a Universal Simulation Model. Applied Sciences, 15(10), 5358. https://doi.org/10.3390/app15105358