1. Introduction
The relationship between students’ expectations and their perceptions of the services, products, and systems provided by Higher Education Institutions (HEIs) is a significant indicator of perceived quality [
1]. Perceived quality is a key metric for accrediting bodies that evaluate the services offered by higher education institutions. Consequently, developing solutions focusing on enhancing the Student eXperience (SX) can yield substantial benefits for students and the respective HEIs. By improving overall student satisfaction, institutions can potentially enhance their competitive performance, particularly by implementing diagnostic tools to evaluate the SX.
While several widely adopted tools exist to assess the quality of higher education services [
2], these tools are often generic, tend to be limited to specific interactions (such as interactions with technological products), and require customization to effectively address the specific needs of different user groups. Furthermore, tools that are narrowly focused on specific aspects of the student experience may prove less effective than those that address the entire spectrum of student–HEI interactions, from pre-consumption to post-consumption.
To manage students’ perceptions and expectations more effectively, we propose a comprehensive methodology for evaluating the SX, mainly focusing on undergraduate students. This methodology incorporates cultural factors into the analysis, enabling a more nuanced understanding of the SX. In addition to facilitating a broad evaluation of the student experience, this methodology is a valuable instrument for integrating students from diverse cultural backgrounds, such as exchange students or those of immigrant descent, thereby assisting HEIs in their decision-making processes.
Accordingly, SteXMeC is presented as a direct response to the current scarcity of culturally informed SX assessment tools. By embedding Hofstede’s national–culture dimensions into each stage of its five-step evaluation flow, the methodology supplies HEIs with an actionable diagnostic instrument that pinpoints inequities with a precision unattainable through generic service sciences frameworks, thereby tangibly advancing equity, diversity, and inclusion objectives.
This paper outlines the structure of the proposed evaluation methodology and provides a detailed account of its development and validation. The paper is organized as follows:
Section 2 presents the theoretical framework and key concepts necessary to understand our research focus;
Section 3 reviews related work that informed both the practical and theoretical foundations of the evaluation methodology;
Section 4 details the development process of the proposed methodology;
Section 5 elaborates on our SX evaluation methodology, mainly how it integrates cultural factors;
Section 6 describes the validation process of the methodology, which involved expert evaluation;
Section 7 addresses the limitations of our study;
Section 8 highlights the study’s innovative contributions, synthesizes key findings, and evaluates the experimental data critically; and finally,
Section 9 concludes with our findings and outlines directions for future research.
2. Theoretical Background
2.1. User eXperience (UX)
User eXperience (UX) directly connects users to a product, system, or service they interact with. According to ISO standard 9241-210 [
3], UX is defined as the “person’s perceptions and responses resulting from the use and/or anticipated use of a product, system, or service” [
3]. This concept is highly relevant to our proposal because students, as clients, engage with the services, products, and systems offered by HEIs.
UX encompasses various universal elements to higher education students, including emotions, personal beliefs, preferences, thoughts, perceptions, physiological and psychological responses, behaviors, and activities undertaken before, during, and after using a product or service. Since students interact with multiple educational products or services over their academic careers, it is essential to analyze their behaviors and perceptions holistically from a Customer eXperience (CX) perspective. This approach explores customer interactions with all the products, systems, and services provided throughout their customer journey, that is, the touchpoints [
4].
2.2. Customer eXperience (CX)
The term CX is intricately linked to our proposal, as it pertains to a specific customer scenario involving HEI products and services. CX is regarded as a theoretical extension of the UX concept [
5]. While a universally accepted definition is lacking, a general consensus exists regarding its interpretation. Hill et al. (2007) define CX as “the physical and emotional experiences that occur through interactions with the products and/or services offered by a brand/company from the point of first direct and conscious contact, considering the total journey, until the post-consumption stage” [
6]. Understanding and managing CX should be a priority for every institution, as it confers a strategic advantage over competitors and enhances customer satisfaction [
7].
CX is considered to comprise six dimensions [
8]: (i) emotional, (ii) sensory, (iii) cognitive, (iv) pragmatic, (v) lifestyle, and (vi) relational. Among these dimensions, the emotional component is particularly significant to our proposal, as it aids in conceptually constructing the “customer journey” [
9], which is crucial for mapping the interactions of each student profile under analysis.
2.3. Student eXperience (SX)
SX has been defined in various ways and lacks a universally accepted definition. It is crucial to highlight that numerous scholars have emphasized the ubiquity of the student experience, which frequently extends beyond purely academic environments [
10,
11]. Nevertheless, the concept can be analyzed as a specific instance of CX, wherein the customers are the students who utilize the products and services provided by HEIs. It is important to note that we do not rely on a specific customer model.
From this standpoint, SX has been defined as “all the physical and emotional perceptions and reactions that a student or prospective student experiences in response to interaction with the products, systems, or services provided by an HEI, and interactions with people related to the academic field, both inside and outside of the academic space” [
12].
The significance of HEIs investing in SX is underscored by the alignment with the UNESCO Sustainable Development Goals (SDGs) addressed by our methodology [
13,
14]. SDGs such as Quality Education, Gender Equality, and Reduced Inequalities are directly targeted to enhance student satisfaction and the perceived quality of HEIs. Furthermore, our approach strongly emphasizes the cultural aspects of the students being evaluated. In this way, we ensure a more inclusive, precise, and context-sensitive assessment.
2.4. Culture
Culture is a fundamental element of societies that allows for detecting differences in behavior, ethics, and values. Hofstede (2010) defined culture as “the collective programming of the mind that distinguishes the members of one group or category of people from another” [
15]. In the specific context of SX, analyzing students’ cultural backgrounds can help us assess the degree of satisfaction or dissatisfaction they experience throughout their university life based on their nationality. This analysis is particularly significant for refugee students, children of migrants, and exchange students.
We have adopted the national culture dimensions proposed by Hofstede to develop our evaluation methodology. This decision is partly due to the dimensional analysis it offers, which allows for a structured approach with clearly identifiable and measurable factors that are readily observable in a population of undergraduate students. This model encompasses six dimensions: (i) Power Distance (PD), (ii) Uncertainty Avoidance (UA), (iii) Individualism/Collectivism (IDV), (iv) Masculinity/Femininity (MAS), (v) Long/Short-Term Orientation (LTO), and (vi) Indulgence/Restraint (IVR). The rationale for selecting Hofstede’s cultural model [
15,
16] over other frameworks lies in its extensive application and validation by numerous researchers, in addition to its practical implementation in various tools. Furthermore, many cultural models developed after Hofstede’s model share common elements [
17].
It is worth noting that the Masculinity vs. Femininity dimension has recently been renamed to Motivation towards Achievement and Success [
18]. This change was prompted by concerns raised by some researchers who argued that associating specific values and behaviors inherent to a culture with socially constructed gender roles reflected a biased perspective, one that perpetuates gender stereotypes [
19]. The revision aims to provide a more neutral framework that better captures the cultural differences related to achievement and success without reinforcing outdated notions of gender. By reframing this dimension, scholars hope to promote a more inclusive understanding of cultural values that avoids conflating gender-specific traits with national cultural characteristics. This shift acknowledges the evolving discourse on gender and culture in social sciences, encouraging a more nuanced approach to intercultural studies. This clearly demonstrates how Hofstede’s cultural model has been adapted and refined to meet current social needs and scenarios, maintaining its relevance over time.
2.5. Evaluating Student eXperience
Prior to the development of our evaluation methodology, a Systematic Literature Review (SLR) was conducted to thoroughly explore the concept of the SX, its key dimensions, and the evaluation methods associated with it [
12]. That review aimed to achieve a comprehensive understanding of the existing literature on SX and identify gaps that our research could address. Through this analysis, the definition of SX was further refined, highlighting its conceptual alignment with CX and UX and, by extension, its connection to the field of Human–Computer Interaction (HCI), with all of them inextricably linked to the field of computer science [
20].
Given the increasingly globalized nature of higher education, where students from diverse cultural backgrounds interact with academic systems in foreign contexts, we recognized the necessity of incorporating a cultural perspective into the SX evaluation process. This recognition was based on the understanding that cultural factors play a pivotal role in shaping students’ perceptions and experiences within higher education institutions. As such, we proposed integrating cultural dimensions into the SX evaluation methodology. By integrating cultural factors, evaluations can better capture diverse expectations, learning styles, and communication preferences, reducing biases inherent in standardized assessments. This approach promotes equity and relevance, ensuring that the insights derived reflect the true challenges and needs of all student groups. Additionally, applying an intersectional perspective enhances the effectiveness of institutional policies and interventions, fostering a more supportive and culturally responsive educational environment.
Building on this idea, we developed a theoretical SX–Cultural model that aligns the SX dimensions with Hofstede’s cultural dimensions, a well-established framework for understanding how culture influences behavior and perception in various settings, including educational environments [
21]. Our model allows a more nuanced evaluation of the SX by factoring in cultural diversity. It enables a better understanding of how different student groups experience educational systems based on their cultural backgrounds.
The development of the SX–Cultural model facilitates the creation of tailored educational solutions aimed at enhancing the SX for various student groups, particularly international students. For instance, this model could create heuristic sets specifically designed for university students, addressing their unique educational system challenges [
22]. Additionally, the model could help develop cross-cultural design models, which focus on creating educational systems and interfaces that are responsive to the diverse cultural needs of students [
23].
Our overarching and more ambitious proposal was the development of a holistic SX evaluation model that integrates cultural dimensions into every aspect of the SX evaluation. This approach ensures a more comprehensive assessment of student satisfaction and engagement as it takes into account both the intrinsic dimensions of SX and the extrinsic influence of cultural factors.
The proposed evaluation methodology includes an evaluation scale as a diagnostic tool for assessing student perceptions [
24]. The items on that evaluation scale align with the three core dimensions of SX and the six dimensions of national culture identified in Hofstede’s model. This alignment ensures that the tool measures the fundamental aspects of SX and captures the cultural influences that may impact student perceptions and experiences. It is important to note that all of the methods included in the evaluation methodology, including the scale, are widely used in the field of UX and, by extension, in CX.
Recent empirical work refines (but also challenges) the current understanding of multicultural SX. Valls-Figuera et al. (2023) show that mobility programs boost students’ multicultural competence and career self-efficacy [
25], although their focus on a single city and reliance on post-departure self-reports leave institutional service quality unexplored. Ren (2024) demonstrates that instructors’ deliberate “cultural presence” in online course design improves learner engagement [
26], but the study privileges teacher perceptions over student-level outcomes and omits physical campus touchpoints central to a holistic SX. At the policy level, Delgado-Valdivieso and Vivas-Paspuel (2024) propose a care-oriented model that raises the effectiveness of inclusion in a Latin-American HEI [
27], although their set of metrics overlooks cross-cultural emotional factors revealed by UX/CX research. Together, these studies confirm rising scholarly attention to culture-mediated experience while exposing methodological silos—mobility narratives, instructor practice, and policy indices—that our integrative, culture-embedded evaluation methodology is designed to bridge.
3. Related Work
The initial phase of our proposal was an exploratory research stage, culminating in developing an SLR that focused on the SX concept, including its dimensions, relevant factors, and the most commonly employed evaluation methods [
12]. Through the review, we were able to identify gaps in the research on SX solutions from an HCI or CX perspective, as well as a lack of solutions that integrate cultural aspects.
This comprehensive review allowed us to identify and define SX’s core dimensions and factors, which led to the development of a theoretical SX model. To expand this model, we cross-referenced it with Hofstede’s cultural dimensions, thereby creating a framework that accounts for the unique cultural characteristics of students from diverse backgrounds [
21].
Building upon this SX–Cultural model, we initiated the development of our proposed SX evaluation methodology, explicitly incorporating cultural aspects into its structure. A preliminary version of this methodology had been previously presented, and through further research and validation, it has been significantly refined and enhanced to improve its robustness and applicability [
24].
Prior research highlighted technology’s pivotal role in facilitating student communication [
28]. Specifically, technology often serves as a critical enabler of interactions between students and between students and professors. This is particularly relevant within the social dimension of SX, where students—especially international students—interact with their peers and begin adapting or integrating into the academic community.
A significant challenge faced by students from different cultural backgrounds is navigating the process of adaptation and re-adaptation after experiencing cultural shock, which arises from engaging with individuals from a markedly different cultural environment. The impact of studies focused on cultural adaptation was considerable when analyzing the overall student experience [
29,
30]. This adaptation process is closely linked to the student’s internal mental processes, including their emotional state, levels of anxiety, and general well-being—elements that form part of the personal dimension of SX.
4. Student eXperience Evaluation Methodology Development Process
The development of our evaluation methodology adheres to a structured and formal linear research process [
31], systematically advancing through three distinct phases, (i) the exploratory phase, (ii) the descriptive phase, and (iii) the relational phase, before initiating the formal development stage. Each phase was designed to progressively build a comprehensive understanding of the subject matter and establish a strong foundation for creating the methodology. As illustrated in
Figure 1, the overall development process consists of six key activities, each contributing to the refinement and validation of the proposed evaluation methodology:
In the initial stage of our research, we conducted an SLR to gain a comprehensive understanding of the various definitions and conceptualizations of SX. This review aimed to explore the key areas of interest related to SX and identify the dimensions, factors, and attributes that constitute the SX. Additionally, the SLR examined the different methodologies and evaluation tools commonly employed to assess SX within academic contexts [
12,
32]. This foundational work was crucial for informing the subsequent stages of our study.
In the second stage of our research, we conducted a comprehensive analysis of the factors and dimensions related to national culture, as presented in the existing literature. These cultural elements were systematically compared and contrasted with the findings from the previous stage of our study, which focused on identifying the core dimensions of the SX. This comparative analysis allowed us to refine and align our understanding of how national cultural factors intersect with the SX dimension, providing a more holistic framework for our ongoing work.
In the third stage of our research, a comprehensive analysis was conducted on the key concepts identified in the literature related to the dimensions and factors that shape the SX. Additionally, we examined the primary cultural dimensions widely utilized in sociological research [
17,
33,
34] to ensure a thorough understanding of how these factors influence student perceptions and interactions within higher education environments. This analysis provided a foundational framework for integrating cultural considerations into the SX model, further enhancing the methodology’s applicability across diverse student populations.
In the fourth stage of our research, we formulated an SX–Cultural model by integrating the factors and attributes identified in the analysis from stage 3. This model is a foundational framework for developing computational, diagnostic, and methodological solutions tailored to students. It systematically incorporates students’ cultural backgrounds to enhance the relevance and effectiveness of these solutions. The SX–Cultural model thus provides a comprehensive basis for addressing the diverse needs of students within higher education environments [
21].
In the fifth stage, we developed our SX evaluation methodology, which was designed to undergo a thorough validation and refinement process. This process is divided into three key subprocesses:
Selection of Methods: Drawing from the SX–Cultural model and the insights gained during the exploratory phase, we carefully select the most appropriate and relevant methods to be implemented within the evaluation methodology. This ensures the methodology is grounded in theoretical and empirical evidence tailored to the identified cultural and SX dimensions.
Structuring the Methodology Workflow: The methodology’s workflow is divided into five stages, from pre-planning to the final analysis phases and a graphical representation of the results. Each stage is designed to guide the evaluators through a structured process, ensuring the evaluation is conducted rigorously and consistently across all phases.
Multilingual Documentation and Technical Support: To facilitate the application of the methodology across diverse contexts, we document the formalization of the evaluation process in multiple languages. Detailed technical documents are also prepared to support the multidisciplinary teams responsible for the evaluation. These documents ensure that all team members, regardless of their disciplinary background, can effectively understand and apply the methodology, thus promoting consistency and accuracy in its implementation.
This approach ensures the evaluation process’s robustness, adaptability, and scalability in diverse academic and cultural settings.
- 6.
Stage six encompasses, as a key component of the iterative development process, both statistical validation and expert judgment evaluation of the methods integrated into the methodology and the methodology itself. This stage is designed to ensure the robustness and accuracy of the methods employed. Furthermore, we intend to conduct a comprehensive review of the relevant scenarios, organizational factors, and environmental variables that may impact the application of our methodology in diverse academic and cultural settings. This review will help tailor the methodology to various contexts, enhancing its applicability and effectiveness.
Figure 1.
SX Evaluation methodology development process: This overview highlights the six sequential activities—exploratory, descriptive, relational, development, validation, and iteration—that collectively ensure a culturally informed, scalable evaluation methodology.
Figure 1.
SX Evaluation methodology development process: This overview highlights the six sequential activities—exploratory, descriptive, relational, development, validation, and iteration—that collectively ensure a culturally informed, scalable evaluation methodology.
It is important to note that stages 5 and 6 may be subject to iterative review and refinement in the future, particularly when integrating new, more specialized, and refined methods into the methodology. This iterative approach ensures the methodology remains adaptable and scalable, accommodating advancements and enhancements as they arise. Consequently, our methodology has built-in flexibility to incorporate evolving techniques and improvements.
5. A Student eXperience Evaluation Methodology with Cultural Aspects
Our methodology aims to gather and deliver valuable insights into the student experience, particularly emphasizing the cultural aspects inherent to the student body. This approach aims to facilitate developing and improving satisfactory systems, products, or services for students, regardless of their cultural background. The proposed methodology consists of five sequential stages (
Figure 2):
Pre-Planning: As the initial phase of the evaluation methodology, we propose a pre-planning stage where relevant information from the HEI is collected (e.g., faculty evaluations, results from previous surveys, market studies) to develop a Student Journey Map (SJM). Based on the outcomes of this pre-planning stage, particular focus may be given to specific methods during the execution stage.
Planning: This stage focuses on the selection of participants for the execution stage and the coordination of the methods to be used later. A significant number of participants should be selected at this point. It is essential to choose a guide with an educational background to assist the UX/CX expert during the execution stage, as the UX/CX expert may not necessarily be an expert in the education sector. This also provides diverse perspectives and helps reduce the subjective bias in the evaluation.
Execution: During this stage, the evaluation methods outlined in the methodology are applied. It consists of three substages: (i) preliminary evaluation, (ii) inspections, and (iii) testing with students. The preliminary evaluation and inspections focus on gathering input from HEI staff (educators, administrative personnel, psychologists), while the final substage concentrates on gathering student feedback. This ensures input from students and educational service providers, facilitating the development of solutions that enhance the SX while considering the technical feasibility from the HEI’s perspective.
Results Analysis: This stage involves analyzing the quantitative and qualitative data collected during the execution stage. The qualitative data consists of participants’ subjective opinions, while the quantitative data is derived from the evaluation survey results and their subsequent statistical analysis. The results should be integrated, subjected to statistical analysis, and reviewed by experts. The analysis process should also incorporate graphic analysis tools, such as the SJM and an Emotional Map for each identified student profile.
Result Interpretation: This stage pertains to the development of two graphical tools and their incorporation into the SX Evaluation Report. Developing an SJM enables the visualization of “touchpoints,” representing students’ interactions with products, systems, and services throughout their academic journey. Additionally, including an Emotional Map allows for the visualization of students’ emotional fluctuations throughout their experiences. Ideally, these graphical elements should be compared with the SJM developed during the Pre-Planning Stage.
Figure 2.
Detailed SX Evaluation methodology methods and processes: This chart emphasizes the five core stages—Pre-Planning through Result Interpretation—and their interdependencies, guiding practitioners step-by-step from data collection to actionable reporting.
Figure 2.
Detailed SX Evaluation methodology methods and processes: This chart emphasizes the five core stages—Pre-Planning through Result Interpretation—and their interdependencies, guiding practitioners step-by-step from data collection to actionable reporting.
For each stage, specific processes and/or evaluations have been planned. The selection of evaluation methods to be implemented will depend on the judgment of the researchers based on the available resources and time. To provide a more detailed understanding of the evaluation process, we have included a BPMN diagram [
35] that outlines the processes and the input and output data for each stage (
Figure 3).
As seen in the BPMN (
Figure 3), Stage S0 (Pre-Planning) yields the preliminary student journey map and provisional method list that seed Stage S1. Stage S1 (Planning) transforms those artifacts into a finalized experiment design dossier—including the evaluator and participant—which, in turn, gates the commencement of Stage S2. Stage S2 (Execution) generates multi-source data streams that feed directly into the mixed-methods analytics pipeline of Stage S3 (Results Analysis). Finally, Stage S4 (Result Interpretation) integrates the validated findings into an actionable SX Evaluation Report, whose recommendations loop back to inform subsequent Pre-Planning cycles, thereby closing the continuous improvement circuit.
5.1. Pre-Planning Stage (S0)
The Pre-Planning stage serves as a foundational step in the evaluation process, with the primary objective of systematically collecting and analyzing historical data relevant to the HEIs and their students. The data encompass various sources of information, including but not limited to teacher evaluations, results from prior evaluation surveys, market research, and Customer Journey Maps (CJMs) [
5,
9,
36,
37]. These elements are instrumental in constructing a comprehensive Student Journey Map (SJM), which provides a detailed visual representation of the students’ experiences throughout their educational journey. This map will be further enhanced by developing an Emotional Map [
38] designed to capture and analyze students’ emotional states at different journey stages. The outcome of this stage will also include the formulation of a preliminary list of evaluation methods tailored to the specific needs and context of the evaluation process. The Pre-Planning stage consists of three substages: (i) S0.1—Data Collection, (ii) S0.2—Preliminary Mapping of the Student Journey, and (iii) S0.3—Preliminary Method Selection.
The primary aim of the Pre-Planning stage is twofold. First, it is essential to clearly define the overarching objective and scope of the evaluation to ensure alignment with the strategic goals of the HEI and the specific needs of its stakeholders. This involves identifying the key focus areas, whether they pertain to academic performance, student satisfaction, institutional effectiveness, or other relevant dimensions. Secondly, this stage thoroughly reviews all available historical data on the students and the institution. By cataloging and assessing this information, the evaluators can gain valuable insights into trends, challenges, and opportunities that may influence the evaluation outcomes. This comprehensive survey allows for the visualization of progress and gaps in the areas of interest defined in the evaluation agreement, ensuring that the evaluation process is grounded in a solid understanding of the institution’s historical context.
Table A1 in
Appendix A provides a detailed overview of the necessary resources, the specific actions required, and the expected outputs associated with the implementation of this stage. This table serves as a practical guide, outlining the key components and outcomes that ensure a successful execution of the process.
In cases where an HEI does not possess sufficient prior information about its students, it is imperative to move directly to stage S1—Planification. This step would involve the creation of a robust framework for data collection and analysis to compensate for the lack of pre-existing records.
5.1.1. Data Collection Substage (S0.1)
The Data Collection substage is a critical component of the Pre-Planning stage, designed to ensure a comprehensive and systematic gathering of all relevant historical data about students. The HEI is expected to provide all available historical information about its students. The data may include but are not limited to (i) student profiles and demographics, (ii) teacher evaluations, (iii) results from previous student surveys and feedback mechanisms, (iv) market studies relevant to student behavior or institutional performance, and (v) other institutional reports and studies that contribute to an understanding of student experiences and outcomes.
Once collected, the data must undergo a rigorous analysis and be integrated into the evaluation data. This process should adhere to the terms outlined in the agreements established with the HEI, ensuring that the data are aligned with the defined objectives and the scope and focus areas stipulated in the evaluation agreement.
The data collection will vary depending on each HEI’s administrative systems and infrastructure. Institutions may have different methods for managing and storing historical data, and the evaluators must be prepared to adapt their approach to the available systems and resources.
In cases where the volume of historical data is substantial, it is strongly recommended that automated data collection and classification tools be employed. These mechanisms will enhance efficiency and accuracy in managing large datasets, ensuring that relevant information is systematically organized and readily available.
Table A2 in
Appendix A provides a detailed overview of the necessary resources, the specific actions required, and the expected outputs associated with implementing this substage.
5.1.2. Preliminary Mapping of the Student Journey (S0.2)
The Preliminary Mapping of the Student Journey Substage is a critical phase focused on constructing a detailed student journey map for each identifiable student profile derived from the historical data provided by the HEI. This substage aims to establish an initial representation of the student experience, considering the academic, social, and emotional aspects students navigate throughout their educational journey.
Each student journey map will be tailored to specific profiles identified from the HEI’s historical data, such as student demographics, academic performance, teacher evaluations, and previous survey results. This mapping process allows for visualizing how various student groups interact with institutional processes and how their experiences unfold over time. The construction of these maps will be guided by the predetermined objectives and scope of the evaluation, ensuring that the mapping aligns with the strategic goals of the evaluation process. The maps must remain within the boundaries set forth by the agreements between the HEI and the evaluators, focusing on addressing key areas of interest identified in the evaluation methodology.
Table A3 (
Appendix A) provides a detailed overview of the necessary resources, the specific actions required, and the expected outputs associated with implementing this substage.
5.1.3. Preliminary Method Selection (S0.3)
The Preliminary Method Selection Substage is designed to systematically identify and refine a list of potential methods to be employed during the execution stage of the evaluation. This process involves carefully analyzing each method’s relevance and efficacy about the specific goals and scope of the evaluation, as defined in prior agreements. The selection process is guided by the historical data from the HEI and any previous studies it has conducted. Methods that do not promise to yield additional insights or that may overlap with already available data are systematically excluded. The remaining methods are those deemed most likely to provide new, actionable insights that align with the strategic objectives of the evaluation. By discarding redundant or ineffective methodologies, this substage ensures a focused and efficient application of resources during the execution stage, enhancing the overall quality and relevance of the evaluation outcomes.
Table A4 (
Appendix A) provides a detailed overview of the necessary resources, the specific actions required, and the expected outputs associated with implementing this substage.
5.2. Planning Stage (S1)
The Planning Stage is a critical phase aimed at ensuring the systematic organization and implementation of the methods to be employed during the execution stage of the evaluation. It involves carefully structuring the methodologies selected in earlier stages, ensuring that they align with the objectives and scope of the evaluation. Additionally, this stage includes the coordination of evaluators, assigning roles and responsibilities, and carefully selecting participants who will contribute to the evaluation process. This comprehensive planning ensures that the subsequent stages are executed efficiently and effectively.
The Planning stage consists of four substages: (i) S1.1—Method Execution Planning, (ii) S1.2—Evaluator Selection, (iii) S1.3—Participant Selection, and (iv) S1.4—Experiment Design.
Table A5 (
Appendix A) provides a detailed overview of the necessary resources, the specific actions required, and the expected outputs associated with the implementation of this stage. This table serves as a practical guide, outlining the key components and outcomes that ensure a successful execution of the process.
5.2.1. Method Execution Planning (S1.1)
The Method Execution Planning Substage seeks to establish a detailed and prioritized schedule for implementing the selected methods, ensuring alignment with available resources, the evaluation’s scope, and objectives. This substage encompasses several essential processes, including the following:
Collecting relevant data from the system, product, or service or leveraging information obtained during the Pre-Planning stage.
Clearly defining the evaluation’s goals and scope.
Evaluating resource availability, time constraints, and potential limitations.
Prioritizing methods based on resource availability and evaluation goals.
Selecting or adapting suitable instruments for each method.
Finalizing the list of execution methods.
Table A6 (
Appendix A) provides a detailed overview of the necessary resources, the specific actions required, and the expected outputs associated with implementing this substage.
5.2.2. Evaluator Selection (S1.2)
The Evaluator Selection Substage aims to establish a coordinated list of expert evaluators tailored to the methods employed during the evaluation stage. This substage includes the following key processes:
Analyzing system and product information.
Reviewing the selected methods.
Choosing evaluators with proven experience in university systems and environments, considering the following:
Prioritizing those with expertise in the selected methods.
Giving preference to evaluators with psycho-educational and administrative backgrounds (psychologists, faculty, administrative staff).
Appointing a lead expert to oversee method execution.
Finalizing the list of evaluators.
Table A7 (
Appendix A) provides a detailed overview of the necessary resources, the specific actions required, and the expected outputs associated with implementing this substage.
5.2.3. Participant Selection (S1.3)
The Participant Selection Substage aims to identify and accurately define the group or profile of students who will be the subject of the evaluation in line with the objectives previously agreed upon with the HEI. During this process, the following key actions will be undertaken:
Gather relevant information about the profile of the students to be evaluated, including academic, demographic, and any other pertinent criteria.
Determine the final profile of the selected students, ensuring that they meet the established requirements for the study.
Manage the submission of documentation to the ethics committee, if necessary, ensuring compliance with ethical regulations.
Thoroughly document the profile of the selected students, recording the criteria used and the outcomes of the selection process.
The methodology should prescribe a stratified random sampling protocol: institutional enrollment data should, where feasible, be segmented first by nationality, gender, program level, and disability status, where applicable; proportional quotas are then calculated, and students are randomly invited within each stratum until the target numbers are reached.
Table A8 (
Appendix A) provides a detailed overview of the necessary resources, the specific actions required, and the expected outputs associated with implementing this substage.
5.2.4. Experiment Design (S1.4)
The Experiment Design Substage seeks to systematically integrate the directives about evaluators, participants, and methodologies to be employed in alignment with the established evaluation objectives. This stage is focused on developing a comprehensive document that clearly and accurately delineates the technical specifications essential for successfully implementing the methods. To accomplish this, the following key actions will be undertaken:
Conduct an in-depth analysis of the relevant information concerning the system, product, or service under evaluation.
Define the expected outcomes for each method employed in the evaluation process.
Establish the appropriate scenarios and timelines for the execution of the experiments.
Determine the specific sets of tasks and activities that will constitute the evaluation process.
Develop a detailed experiment design document, which will serve as a guiding framework for implementing the experimental procedures.
The primary inputs for this substage include a preliminary list of methodologies, comprehensive information about the system, product, or service in question, and the final selection of methods to be utilized. The ultimate output of this substage will be the creation of the experiment design document.
Table A9 (
Appendix A) provides a detailed overview of the necessary resources, the specific actions required, and the expected outputs associated with implementing this substage.
5.3. Execution Stage (S2)
The primary objective of the Execution Stage is to implement the methods outlined in the Experiment Design Document and to document the results obtained throughout their application meticulously. This process is informed by several critical inputs, including the list of methods to use, the designated evaluators and participants, and the detailed experiment design document. In this stage, the key actions involve a comprehensive analysis of the information about the methods, evaluators, and participants established during the Planning Stage. Additionally, an induction process is conducted to ensure that evaluators clearly understand the methods and are prepared to apply them correctly. Following this, preliminary evaluation, inspections, and student testing will be carried out to gather initial data. Throughout this stage, meticulous documentation of all results is maintained to ensure accuracy and completeness.
Upon completion of the Execution Stage, the outcomes will include preliminary evaluation results, findings from the conducted inspections, and results from the tests performed on students. Finally, all data will be consolidated, providing a comprehensive overview of the results from the methods applied. The Execution stage consists of three methods: (i) S2.1—Preliminary Evaluation, (ii) S2.2—Inspections, and (iii) S2.3—Student Tests.
Table A10 (
Appendix A) provides a detailed overview of the necessary resources, the specific actions required, and the expected outputs associated with the implementation of this stage.
5.3.1. Preliminary Evaluation (S2.1)
The Preliminary Evaluation Substage (S2.1) constitutes the initial phase of the Execution Stage (S2) and involves the application of the Property Checklist evaluation method [
39]. Its primary objective is to facilitate the early identification of potential weaknesses in the systems, products, and services provided by the HEI to its students. Completing this preliminary evaluation allows the evaluation team to identify the most suitable strategies and approaches for applying additional evaluation or inspection methods.
Scholars have suggested that, when designing and developing a Property Checklist, it is advantageous to integrate criteria and factors related to usability or UX as reference points [
40,
41,
42]. Furthermore, it is recommended to extend this approach to CX. In executing the Property Checklist, the following considerations are advised:
The involvement of expert evaluators with specialized knowledge in UX or CX, particularly in usability.
Including evaluators with expertise in academic, administrative, psychological, or information systems development fields ensures a comprehensive assessment that addresses the students’ overall experience.
Evaluators should possess familiarity with the systems, products, or services under evaluation, taking into account the specific scope of the assessment.
Engaging at least three UX/CX and usability experts and three domain-specific experts is advisable.
When evaluating the administrative or IT systems of the HEI, it is strongly recommended that experts be included directly in developing, implementing, using, or evaluating these services.
Upon completion of the Property Checklist, a data set or Preliminary Evaluation Result will be generated, serving as a critical input for the Results Analysis Stage (S3).
Table A11 (
Appendix A) provides a detailed overview of the necessary resources, the specific actions required, and the expected outputs associated with implementing this method.
5.3.2. Inspections (S2.2)
In instances where the evaluation involves analyzing students’ interactions and perceptions with the HEI’s services and information systems, the following methods are recommended to complement the holistic evaluation of students:
Heuristic Evaluation [
22]:
The primary aim of the Heuristic Evaluation method is to identify potential usability issues within the services and information systems used by students, which will later be analyzed and interpreted in stages S3 and S4. It is strongly recommended to use usability heuristics that are directly related to the evaluation of educational services [
43] or heuristics that take cultural aspects into account [
44]. The Heuristic Evaluation report, to be included in the inspection results, should contain, but is not limited to, the following elements:
Table of Contents;
Introduction;
Product under evaluation;
Product objectives;
Evaluation methodology (including evaluator profiles and experience);
Evaluation results, including:
Identified issues;
Violated heuristics;
Scores assigned by evaluators;
Ranking of issues by criticality;
Ranking of issues by severity;
Comments on the result tables;
Proposed solutions;
Positive aspects identified.
Conclusions;
Annexes: Screenshots and URLs (highlighting the identified issues).
The outcome of the Heuristic Evaluation is the dataset or Inspection Results.
Table A12 in
Appendix A details the inputs and procedures for conducting the Heuristic Evaluation method.
- 2.
Group-Based Expert Walkthrough [
45]:
The Group-Based Expert Walkthrough method aims to identify potential usability issues within the services and information systems students use through a three-stage group inspection conducted by selected evaluators. This method results in the following outcomes:
A comprehensive list of identified potential issues.
A detailed record of tasks performed during the evaluation.
A perception survey regarding the evaluated service or system.
This approach ensures a thorough assessment by incorporating multiple expert perspectives and systematically addressing usability concerns across the various stages of interaction.
Table A13 in
Appendix A explains the inputs and procedures established to execute the Group-Based Expert Walkthrough method.
- 3.
Perspective-Based Inspection [
46]:
The Perspective-Based Inspection method aims to identify specific usability issues within students’ services and information systems by inspecting from three distinct perspectives. These perspectives are based on three types of users:
Novice: The novice perspective focuses on identifying general and obvious usability issues, considering that a novice user needs to become more familiar with the system, product, or service being evaluated.
Expert: The expert perspective focuses on identifying specific usability issues, aesthetic problems, and efficiency failures, considering that an expert user is highly familiar with the system, product, or service being used, as well as related services.
Error-Handling: The perspective centers on detecting potential user errors when interacting with the system, product, or service. This perspective aims to minimize the occurrence and impact of potential errors that users might make.
We recommend incorporating UX/CX experts into this method and considering the profiles of the students being evaluated, including the following:
Cultural background;
Language;
Degree program;
Age range.
Table A14 in
Appendix A explains the inputs and procedures established to execute the Perspective-Based Inspection method.
5.3.3. Students Tests (S2.3)
Stage S2.3 is dedicated to gathering insights about students’ perceptions and expectations. This phase aims to capture the most comprehensive and detailed information directly from students to ensure an accurate assessment of their experiences and needs. To achieve this, the following methods are recommended for implementation:
The Interview Method is designed to gather qualitative student data regarding their experiences, which will be analyzed and interpreted in stages S3 and S4. The outcome of the interview process is the generation of a comprehensive data set, referred to as Student Test Results. The key processes involved in this method include the following:
Interview Design:
Evaluators, in collaboration with interview facilitators, will determine the interview type based on resource availability:
Structured interviews for scenarios with limited resources.
Semi-structured interviews for scenarios with moderate resources.
Unstructured interviews for scenarios with ample resources.
Experts will develop the interview questions and define the sample size of students, ensuring alignment with the evaluation’s objectives and available resources.
Experts will select the interview format (remote, in-person, or hybrid) based on the scope of the evaluation and resource considerations. In-person interviews are strongly recommended where feasible.
Interview Execution:
The interview will be conducted using the appointed evaluators’ modality and settings.
Demographic information should be collected at the beginning of the interview.
Audiovisual materials, including interview recordings, are highly recommended for in-depth analysis.
Interviewers must ensure that students are informed about the confidentiality of their data and obtain formal consent when required.
The results of the interviews should be thoroughly documented and included in the formal evaluation report.
Table A15 in
Appendix A explains the inputs and procedures established to execute the Interview method.
- 2.
The Survey Method aims to collect qualitative and quantitative data regarding students’ experiences and perceptions, which will be analyzed and interpreted later during stages S3 and S4. The survey was designed by adapting questions from two established surveys, each focusing on student experience and cultural aspects. The resulting survey was validated through statistical methods and expert review, ensuring its reliability and relevance.
A comprehensive data set, the Student Test Results, is generated upon completing the survey. This data set serves as a key input for subsequent analysis stages, providing critical insights into the students’ interactions and perceptions.
Table A16 in
Appendix A explains the inputs and procedures established to execute the survey method.
- 3.
The Focus Group Method aims to gather qualitative data regarding students’ experiences and perceptions for subsequent analysis and interpretation in stages S3 and S4. By conducting a focus group, evaluators can collect a comprehensive data set or Student Test Results, which provides valuable insights into the student experience. To ensure the process is thorough, the following procedures are recommended:
Focus Group Design:
A qualified evaluator will be appointed as the focus group(s) moderator. Selecting a moderator with a background in academia or psychology is advisable to facilitate discussions effectively.
The appointed experts have the flexibility to formulate the necessary questions to either verify previously collected data or address any existing information gaps.
Organizing focus groups consisting of 5 to 7 participants is recommended, ensuring a manageable size for in-depth discussion.
The experts will determine the execution scenarios (remote, in-person, or hybrid) based on available resources and the scope of the evaluation. In-person sessions are highly recommended for a richer interaction.
Focus Group Execution:
The interview process will follow the modality and setting outlined by the designated evaluators.
At the beginning of the session, students will be asked to provide demographic data to contextualize the insights gained.
The moderator will actively encourage the participation of all students to ensure a diverse range of opinions and experiences are captured.
It is strongly recommended that audiovisual materials (such as video or audio recordings of the session) be collected for detailed post-interview analysis.
The moderator should remind participants of the confidentiality of their data and, if required, secure formal consent before proceeding with the session.
Documentation: The results of the focus group discussions must be documented comprehensively in the formal evaluation report. This report should include detailed observations, participant responses, and any relevant audiovisual material collected during the session.
In
Table A17 in
Appendix A, we provide a detailed explanation of the inputs and procedures established to execute the focus group method
5.4. Results Analysis Stage (S3)
The Results Analysis Stage (S3) involves the comprehensive processing of qualitative and quantitative data collected during the Execution Stage (S2). In this phase, the data undergo thorough examination and validation, ensuring accuracy and relevance. The outcomes of this stage comprise a detailed analysis, systematically prepared for subsequent interpretation, graphical representation, and formal documentation, which will take place in the Results Interpretation Stage (S4). This process ensures the data are adequately refined and organized for informed decision-making and further reporting. The Results Analysis Stage consists of two substages: (i) S3.1—Qualitative Analysis and (ii) S3.2—Quantitative Analysis.
5.4.1. Qualitative Analysis (S3.1)
Qualitative analysis entails systematically examining results expressed through verbal (audio) or textual formats. The qualitative data can be derived from various sources, including the outcomes of the Property Checklist method, audiovisual records of the executed methods, evaluators’ logs, responses obtained from evaluation surveys, demographic data of the students assessed, or the processing of the information mentioned above. In conducting qualitative analysis, the following elements should be duly considered:
Results from the Property Checklist: It is strongly recommended that evaluators be required to meticulously document comments and observations for each item listed in the property checklist during the preliminary evaluation.
Evaluators’ Logs: Evaluators should be mandated to maintain comprehensive logs throughout the evaluation process. These logs should detail their observations regarding the process, results obtained from each method, and any actions required to complete the evaluation.
Audiovisual Records: It is advisable to preserve audiovisual materials from the inspection methods, interviews, and focus groups to facilitate subsequent analysis.
Evaluation Survey: The demographic data collected from students in the initial section of the SX survey should be utilized to conduct an in-depth analysis of the students’ cultural backgrounds, with the potential to identify correlations within the collected data.
5.4.2. Quantitative Analysis (S3.2)
Quantitative analysis entails the systematic examination of results expressed in numerical terms. This facilitates statistical analysis, enabling the identification of causal relationships, correlations, data dispersion, and the measurement of magnitudes based on the data provided by students. Quantitative data may be derived from various sources, including the outcomes of the Property Checklist method, lists of potential problems, usability tests, responses obtained from the SX evaluation survey, and the demographic information of the students assessed. When conducting quantitative analysis, the following key elements should be considered:
Results from the Property Checklist: The execution involves rating systems, products, or services the HEI provides on a Likert scale ranging from 1 to 5, where 1 signifies “Totally dissatisfied” and 5 signifies “Totally satisfied.” This numerical rating enables statistical processing and quantifies compliance percentages by category.
List of Potential Problems: Usability inspections of HEI services and systems generate a list of potential problems, which are numerically rated by evaluators based on frequency, severity, and criticality. These ratings enable the calculation of data dispersion, thereby determining the degree of consistency in the evaluators’ observations.
Evaluation Survey: The SX evaluation survey contains questions to assess various dimensions of the SX and cultural models. Students’ perceptions are rated on a Likert scale from 1 to 5, where 1 represents “Strongly Disagree” and 5 represents “Strongly Agree” [
51]. The results of this survey allow for the quantification of data and the identification of potential correlations.
Demographic Data: Demographic information collected through the evaluation survey and usability inspections provides valuable insights that enable the categorization and aggregation of data. This information can be statistically analyzed to explore potential correlations and trends.
5.5. Result Interpretation Stage (S4)
The final stage (S4) pertains to the comprehensive consolidation of qualitative and quantitative results within the SX Evaluation Report. This stage incorporates graphical elements, including, but not limited to, the Student Journey Map (SJM) and Emotional Map. Upon completion of the results analysis, the following key activities are to be undertaken:
To ensure that evaluation results translate into tangible organizational change, the SX Evaluation Report shall activate a formal feedback loop protocol: (i) the report is presented to the institution’s senior decision-making body (e.g., the Vice Rectorate for Academic Affairs); (ii) each recommended corrective action is assigned to a responsible operational unit with explicit accountability; (iii) a timeline with measurable milestones is agreed for every action; and (iv) a follow-up application of the methodology is scheduled to verify implementation and effectiveness.
6. Student eXperience Evaluation Methodology Validation
We have selected the Expert Judgement or Expert Evaluation method for the qualitative validation of our methodology. This approach is widely used in studies within UX and software engineering [
52], aligning closely with our proposal’s theoretical and practical framework, in particular, on the usability testing conducted during the execution stage. Following the selection of experts, each was provided with a comprehensive package of documents consisting of the following:
A formal letter requesting their participation.
A copy of the formalized methodology, translated into the expert’s native language.
An evaluation form structured into four distinct phases:
The structure of the evaluation process ensures that expert feedback is collected comprehensively and systematically, providing valuable insights for refining and enhancing the methodology.
To mitigate potential biases stemming from the evaluators’ backgrounds and other external factors, we have deliberately selected expert evaluators from diverse national, cultural, and professional contexts and different areas of expertise and work environments. Additionally, we have actively encouraged the participation of women in the validation process, following the recommendations of the European Commission for the integration of women in research environments [
53].
6.1. Expert’s Backgrounds
Understanding the background of expert evaluators is essential to ensuring the rigor of the methodology validation process. The evaluators’ years of specialization, areas of expertise, and experience working with relevant populations provide vital context for interpreting their feedback and assessments. Their diverse professional backgrounds contribute to a more comprehensive evaluation of the methodology.
For this study, we engaged 14 expert evaluators, evenly split between men and women.
The evaluators come from seven different nationalities: Chile, Spain, Colombia, France, Romania, Brazil, and Argentina.
Their areas of expertise cover several fields, such as HCI, UX, CX, and Psychology.
On average, the experts have 12.43 years of experience in their respective fields, which brings significant depth to the evaluation.
In response to the question, “Before participating in our research, were you familiar with the concepts of CX or SX?”, 78.57% of the experts confirmed their familiarity with these areas.
Additionally, when asked, “Before becoming a collaborator in our research, have you had experience working with university students?”, 85.71% of the experts affirmed prior or ongoing experience working with students, averaging 14.45 years in this capacity.
Finally, in response to “Have you previously participated in any expert judgment evaluations?”, 71.42% of the evaluators indicated prior experience in such evaluation processes.
This expertise and experience ensure that the feedback and assessments provided by the evaluators are well-informed and reliable, offering a strong foundation for validating our methodology.
6.2. Quantitative Analysis
Quantitative data analysis is essential in this expert evaluation process, as it offers “objective” insights into our methodology’s perceived strengths and weaknesses. In this regard,
Table 1 presents the expert rankings for each stage and substage of the methodology, assessed based on four key attributes: utility, clarity, ease of use, and level of detail (Lack of detail). A systematic analysis of these rankings allows for identifying patterns, prioritizing areas for improvement, and assuring that the methodology aligns with the practical needs of its intended users. The diverse backgrounds and expertise of the evaluators further enrich this process. The quantitative analysis complements qualitative feedback, ensuring a balanced and comprehensive methodology evaluation.
Utility: The average expert rating for the utility attribute was 4.78, indicating a strong positive perception of the methodology’s usefulness. The stage with the highest utility rating was S3—Result Analysis, which scored an impressive 4.93. This suggests that experts highly value analyzing quantitative and qualitative data, including how the data are integrated. On the other hand, S4—Result Interpretation—received the lowest score for utility, with a rating of 4.57. This slight dip can be attributed to a significant deviation in one evaluator’s score, reflected in a standard deviation of 1.05. This deviation correlates with the results from the clarity and ease of use attributes, which will be discussed in the following sections, along with additional feedback from the evaluators.
Clarity: The average clarity rating was 4.03, which is still notably high. The stages with the best clarity scores were S1, S2, and S3, each receiving a rating of 4.07. However, the clarity of S4—Result Interpretation—received the lowest score, averaging 3.86 (slightly positive), with a relatively large standard deviation of 1.30, indicating varying clarity levels, as perceived by the evaluators.
Ease of Use: The Ease of Use attribute received an average score of 3.46, reflecting a moderately positive perception. The stage with the highest ease of use rating was S2 (Execution), scoring 3.57. In contrast, S4—Result Interpretation—was rated lowest in this category, with an average score of 3.07, indicating some challenges in ease of implementation, albeit still a slightly positive rating.
Lack of Detail: This attribute was evaluated negatively, meaning lower scores are more favorable. The average rating for lack of detail was 2.24, considered highly positive. The stage with the best rating for this attribute was S1—Planning, with a score of 2.14, indicating that the planning stage was perceived as sufficiently detailed. The lowest score in this category was for S4—Result Interpretation, which maintained a positive score of 2.43 but indicated room for improvement in providing additional details.
Considering the Ease of Use scores and the relatively lower ratings for S4—Result Interpretation—combined with the feedback provided by the evaluators (
Section 6.3), we have decided to introduce templates and guidance documents to facilitate the efficient application of the methodology. Furthermore, we will expand the explanation of Stage S4 to ensure better clarity and ease of understanding for future users.
6.3. Qualitative Analysis
To complement the quantitative data from our methodology evaluation, we included a section for expert opinions, where evaluators provided relevant textual feedback to help identify weaknesses, strengths, and potential improvements for our proposal. The opinion section consists of three general and parametrized questions and five more specific, open-ended questions. The three general questions are as follows:
“If you had to evaluate the student experience when using systems, products, or services offered by Higher Education Institutions (HEIs), would you use our proposed methodology?”
The predominant response was “Definitely Yes,” with 42.86%, followed by “Probably Yes” at 35.71%.
- 2.
“Do you think the methodology covers all aspects of university students’ experiences to be evaluated?”
The predominant response was “Probably Yes,” with 50% of the responses, followed by “Neutral” at 28.58%.
- 3.
“Do you think the methodology could be useful for evaluating students’ experiences from diverse cultural backgrounds?”
The predominant response was “Probably Yes,” with 42.86% of the responses, followed by “Definitely Yes” and “Yes,” each with 21.43% of the responses.
The five specific, open-ended questions are as follows:
Question 1 (Q1): “Would you remove or add any evaluation method in the methodology? Which one(s)? Why?”
Question 2 (Q2): “Would you change, add, or remove aspects of any stage or sub-stage of the methodology? Which one(s)? Why?”
Question 3 (Q3): “Would you change, add, or eliminate any aspect of the evaluation methods considered in the proposed methodology? Which one(s)? Why?”
Question 4 (Q4): “What aspects do you consider were not covered by the methodology and should be included?”
Question 5 (Q5): “Do you have any additional comments or suggestions for the authors?”
The experts’ comments on questions Q1–5 are presented in
Table 2,
Table 3,
Table 4,
Table 5 and
Table 6 below. It should be noted that comments referring to the better wording of specific points or considering general aspects of the methodology have been omitted, as these are irrelevant to the questions raised. Nevertheless, all comments of this nature were taken into consideration.
Based on the comments from expert evaluators, the stages of the methodology detailed in the section of
Appendix A incorporate all the changes mentioned in this section.
7. Study Limitations
The development of the methodology, along with the creation and implementation of the methods utilized, has been based on the work of students mainly from Chile and Spain. It is also important to note that the methodology has been specifically designed to evaluate the experiences of undergraduate university students. This focus excludes students from other educational levels, such as primary and secondary education and postgraduate studies. Students’ expectations and perceptions at these varying educational levels may differ significantly, irrespective of the cultures being analyzed.
Finally, we acknowledge that the methodology’s step-wise structure may introduce scalability constraints when deployed across large or multi-campus systems; thus, we recommend phased roll-outs, supported by region-specific benchmarks, to calibrate procedures and resources before institution-wide adoption. To mitigate residual scale-related frictions, institutions should (i) embed a modular digital toolkit into each phase, (ii) establish an agile governance committee that convenes cross-campus stakeholders for fortnightly progress reviews and rapid issue resolution, and (iii) implement a continuous-improvement loop in which KPIs are monitored against pre-defined escalation thresholds.
8. Discussion
Our methodology enriches SX research by embedding Hofstede-based cultural dimensions into a five-stage evaluation flow that captures academic, social, and emotional facets often overlooked by generic tools. Linking SX, CX, and HCI concepts with UNESCO SDGs positions the work at a strategic intersection where user-centered design meets global equity policy. By emphasizing minority, migrant, and disability perspectives, the approach offers institutions an evidence-driven path to more inclusive decision-making.
Experimental feedback substantiates these aspirations. Fourteen experts with an average of 12.4 years of practice were assigned high marks for utility (4.78) and clarity (4.03), confirming conceptual relevance and comprehensibility. The strongest endorsement centered on Results Analysis (4.93), underscoring confidence in the integrated qualitative–quantitative analytics. Ease-of-use (3.46) and clarity dispersion in Result Interpretation revealed operational friction; templates, graphical standards, and KPI guidelines were therefore added. Additional critiques prompted explicit ethical checkpoints, gender-responsive sampling, and illustrative journey-mapping resources, further bolstering rigor.
While we recognize that the full deployment of the five-stage methodology may appear demanding in terms of time, funding, and staff training, it is intentionally modular and scalable. HEIs can adopt the stages incrementally—beginning, for instance, with the reuse of existing survey data in Stage 0 or with a single, low-cost inspection method in Stage 2—thereby generating meaningful insights without incurring prohibitive expenditure. The accompanying templates, KPI guidelines, and multilingual documentation were specifically designed to minimize onboarding time and support knowledge transfer, enabling HEIs of varied sizes and resource levels to progress from nominal compliance toward evidence-based, continuous improvement.
These outcomes validate the instrument’s capacity to surface culturally mediated experience gaps while signaling refinement priorities. Planned multicountry pilots and automated analytics will stress-test scalability, and longitudinal deployment will measure the impact on retention, satisfaction, and equity metrics. By translating nuanced cultural insights into actionable policy levers, our methodology stands as both a scientific contribution and a practical catalyst for elevating educational quality across diverse higher-education settings.
Ultimately, the transformative power of SteXMeC will depend on each institution’s readiness to act on the evidence it generates. Therefore, we stress that the methodology should be embedded within a broader change-management cycle—one that secures senior leadership commitment, allocates adequate resources and aligns policies with the equity targets revealed by our diagnostics—so that the systemic barriers affecting marginalized student groups are not merely documented but decisively reduced.
9. Conclusions and Future Work
According to UNESCO data, there are over 254 million students globally, with more than 6.4 million pursuing education abroad. Initiatives like the one presented in this study play a vital role in facilitating the seamless integration of students into higher education systems, offering significant benefits for both the students and institutions involved [
54,
55]. A comprehensive SX evaluation methodology provides HEIs with actionable insights to improve the quality of education and elevate overall student satisfaction. When cultural factors are integrated into the evaluation process, as demonstrated in our methodology, HEIs are better equipped to implement policies that promote access, enhance quality, and foster equity across the educational landscape. This approach aligns with international standards, emphasizing these elements as “fundamental policy pillars for every higher education system to aspire to” [
56].
The empirical evidence gathered during the development (
Section 5) and expert validation (
Section 6) phases directly underpin each recommendation advanced in this paper. The panel’s outstanding utility score for the Results Analysis stage (μ = 4.93) demonstrates the added value of fusing qualitative and quantitative data; hence, our first recommendation is to embed automated, AI-driven analytics pipelines that extend this integration while alleviating the operational burdens reflected in the lower ease-of-use ratings. Likewise, evaluators’ repeated requests for clearer reporting resources (Q1–Q4) justify our commitment to release ready-to-deploy journey mapping and emotional mapping templates in the next iteration of our methodology. Finally, the wider dispersion observed in the clarity ratings for the Result Interpretation stage (σ = 1.30) motivates the development of KPI-linked dashboards that translate culturally nuanced findings into real-time decision metrics for institutional leaders.
This work describes the theoretical framework, development, and validation of a student experience evaluation methodology designed with a cultural perspective. Through the practical application of specialized evaluation techniques, such as surveys tailored to diverse cultural settings, and the involvement of multidisciplinary experts in the validation process, our methodology emerges as a robust tool for identifying gaps and informing strategic decisions in higher education. This makes it adaptable and beneficial across various national contexts, ensuring a higher standard of educational quality and student engagement globally.
We firmly believe that the evaluation process of SX is inextricably linked to its design process. Concerning the theoretical implications of our proposal, we emphasize the establishment of standards that would underpin policies concerning student mobility, inter-university agreements, and mechanisms aimed at facilitating the integration of international students. The practical implications are addressed under the indicators defined in our methodology—namely, the qualitative and quantitative outcomes yielded during the execution stage—and the relevant statistical relationships pertinent to each case. It is worth noting that, given the multicultural focus of our tool, the resulting statistical distributions will very likely necessitate the use of nonparametric analysis methods.
As part of our future research agenda, we intend to leverage the SX–Cultural model to develop more nuanced and specialized methods for our evaluation methodology. This approach is designed to enhance the precision and effectiveness of our proposal, ensuring that it remains robust and relevant in subsequent iterations and revisions. Furthermore, we are committed to ensuring that the methodology undergoes continuous versioning and adaptation to new trends, requirements, and standards in the global higher education market. For these purposes, we primarily consider the application of methods developed with students from broader socio-cultural contexts, the continuous collection of feedback from HEIs, the development and incorporation of specialized methods tailored to students with diverse socio-cultural backgrounds, the pursuit of collaboration with international entities, and ongoing reviews of the latest policies and standards in education. We also strive to preserve the methodology’s applicability and relevance across diverse educational contexts worldwide by ensuring its continuous refinement and alignment with industry advancements.
Author Contributions
Conceptualization, N.M., F.B., and C.R.; methodology, N.M., F.B., and C.R.; validation, N.M., F.B., and C.R.; formal analysis, N.M., F.B., and C.R.; investigation, N.M., F.B., and C.R.; writing—original draft preparation, N.M.; writing—review and editing, N.M., F.B., and C.R.; visualization, N.M.; supervision, F.B. and C.R.; project administration, N.M., F.B., and C.R.; funding C.R. All authors have read and agreed to the published version of the manuscript.
Funding
Nicolás Matus was a beneficiary of ANID-PFCHA/Doctorado Nacional/2023-21230171 and was a beneficiary of the Pontificia Universidad Católica de Valparaíso (PUCV) PhD Scholarship in Chile.
Institutional Review Board Statement
Not applicable.
Informed Consent Statement
Not applicable.
Data Availability Statement
All data generated or analyzed during this study are included in this article.
Acknowledgments
The authors thank the Universidad Miguel-Hernández de Elche (UMH) and the School of Informatics Engineering of the Pontificia Universidad Católica de Valparaíso (PUCV).
Conflicts of Interest
The authors declare no conflicts of interest.
Appendix A
The following tables present the inputs and outputs of the methodology’s processes for each stage, using a special numbered format (e.g., ❶, ❷), as illustrated in the BPMN diagram in
Figure 3.
Table A1.
Pre-Planning stage (S0) detail.
Table A1.
Pre-Planning stage (S0) detail.
| Category | Details |
|---|
| What do I need to get started? | System, product, or service to be evaluated and associated data. |
| What to do? | Collect historical information on the systems, products, or services to be evaluated for the HEI. Model/gather the student journey map per student profile (preliminary). Select preliminary evaluation methods.
|
| What is obtained? | ❶ Background on the system, product, or service.
❷ Preliminary student journey map.
❸ Preliminary list of methods to be used. |
Table A2.
Data Collection substage (S0.1) detail.
Table A2.
Data Collection substage (S0.1) detail.
| Category | Details |
|---|
| What do I need to get started? | System, product, or service to be evaluated, along with associated data. |
| What to do? | Collect evaluations of student satisfaction, quality, or perceptions regarding the products, systems, or services offered by the HEI. Integrate data based on the pre-agreed evaluation framework, objectives, and scope.
|
| What is obtained? | ❶ Background on the system, product, or service. |
Table A3.
Preliminary mapping of the Student Journey substage (S0.2) detail.
Table A3.
Preliminary mapping of the Student Journey substage (S0.2) detail.
| Category | Details |
|---|
| What do I need to get started? | ❶ Background on the system, product, or service. |
| What to do? | Identify student profiles. Identify systems, products, and services relevant to the evaluation. Map the student journey based on the identified profiles.
|
| What is obtained? | ❷ Preliminary student journey map. |
Table A4.
Preliminary Method Selection substage (S0.3) detail.
Table A4.
Preliminary Method Selection substage (S0.3) detail.
| Category | Details |
|---|
| What do I need to get started? | ❶ Background on the system, product, or service.
❷ Preliminary student journey map. |
| What to do? | Analyze the preliminary student journey map. Review the scope and objectives of the evaluation. Generate a preliminary list of methods to implement.
|
| What is obtained? | ❸ Preliminary list of methods to be used. |
Table A5.
Planning stage (S1) detail.
Table A5.
Planning stage (S1) detail.
| Category | Details |
|---|
| What do I need to get started? | System, product, or service to be evaluated, along with associated data.
❶ Background information on the system, product, or service.
❸ Preliminary list of methods to be used. |
| What to do? | Gather information on the systems, products, or services to be evaluated. Based on the objectives, limitations, and scope of the evaluation: Select evaluation methods to be performed. Identify and describe scenarios, activities, tasks, and expected outcomes. Select university staff to assist in the evaluation process. Select the target group of students.
Generate an execution report for the evaluation methods.
|
| What is obtained? | ❹ Comprehensive information on the system, product, or service.
❺ Final list of methods to use.
❻ List of evaluators.
❼ List of participants.
❽ Experiment design document. |
Table A6.
Method Execution Planning substage (S1.1) detail.
Table A6.
Method Execution Planning substage (S1.1) detail.
| Category | Details |
|---|
| What do I need to get started? | System, product, or service to be evaluated, along with associated data.
❶ Background information on the system, product, or service.
❸ Preliminary list of methods to be used. |
| What to do? | Gather information on the system, product, or service, or utilize the background data collected during the Pre-Planning phase. Define the objective and scope of the evaluation. Assess available resources, timelines, and any limitations for the evaluation. Prioritize the evaluation methods based on time and resource availability, aligning with the evaluation objectives. Select or adapt instruments for the methods previously chosen. Finalize the list of methods to be executed.
|
| What is obtained? | ❹ Comprehensive information on the system, product, or service.
❺ Final list of methods to use. |
Table A7.
Evaluator Selection substage (S1.2) detail.
Table A7.
Evaluator Selection substage (S1.2) detail.
| Category | Details |
|---|
| What do I need to get started? | ❹ Comprehensive information on the system, product, or service.
❺ Final list of methods to use. |
| What to do? | Analyze the information regarding the system or product. Review the selected methods to be used. Select evaluators with experience in university environments or systems. Prioritize evaluators with expertise in executing the selected methods. Prioritize evaluators with psycho-educational and administrative expertise (psychologists, professors, administrators).
Select a lead expert to coordinate the execution of the methods. Generate a list of evaluators.
|
| What is obtained? | ❻ List of evaluators. |
Table A8.
Participant Selection substage (S1.3) detail.
Table A8.
Participant Selection substage (S1.3) detail.
| Category | Details |
|---|
| What do I need to get started? | ❹ Information on the system, product, or service. |
| What to do? | Gather information about the student profile to be evaluated. Determine the profile of the students to be assessed. Process documentation from the ethics committee if required. Document the student profiles for evaluation.
|
| What is obtained? | ❼ List of participants. |
Table A9.
Experiments Design substage (S1.4) detail.
Table A9.
Experiments Design substage (S1.4) detail.
| Category | Details |
|---|
| What do I need to get started? | ❸ Preliminary list of methods to use.
❹ Information on the system, product, or service.
❺ Final list of methods to use. |
| What to do? | Analyze the information on the system or product. Define the expected outcomes for each method. Define scenarios and execution timelines. Define sets of tasks. Define sets of activities. Generate an experiment design document.
|
| What is obtained? | ❽ Experiment design document. |
Table A10.
Execution stage (S2) detail.
Table A10.
Execution stage (S2) detail.
| Category | Details |
|---|
| What do I need to get started? | ❺ Final list of methods to use.
❻ List of evaluators.
❼ List of participants.
❽ Experiment design document. |
| What to do? | Analyze information regarding methods, evaluators, and participants from the Planning Stage. Conduct an induction for evaluators. Execute a preliminary evaluation. Conduct inspections. Run tests with students. Document the results of the applied methods.
|
| What is obtained? | ❾ Preliminary evaluation results.
❿ Inspection results.
⓫ Results of student tests.
⓬ Consolidated results of applied methods. |
Table A11.
Preliminary Evaluation—Property Checklist (S2.1) detail.
Table A11.
Preliminary Evaluation—Property Checklist (S2.1) detail.
| Category | Details |
|---|
| Input | ❺ Final list of methods to use.
❻ List of evaluators.
❽ Experiment design document. |
| Steps | A checklist will be designed, outlining the primary systems, products, and services to be evaluated. The checklist, along with key background information regarding the elements to be evaluated, will be presented to a group of evaluators. Expert evaluators will assess the elements under analysis, applying their professional judgment based on their areas of expertise (e.g., psychology, academia, administration, IT, etc.). Evaluators will be reminded to maintain a log of their activities and will be requested to complete a perception questionnaire to gather their comments and recommendations regarding the elements under analysis. The information obtained from the checklist application will be compiled. The results will be analyzed to determine the satisfaction percentage of the elements under evaluation.
|
| Output | ❾ Preliminary evaluation results:Preliminary satisfaction percentage of the systems, products, and services for students: - ◦
Satisfaction percentage by category = (average score by category / maximum score obtainable) x 100. - ◦
Overall satisfaction percentage = average of satisfaction percentages by category.
Comments and/or recommendations from the evaluators.
|
Table A12.
Inspections—Heuristic Evaluation (S2.2.1) detail.
Table A12.
Inspections—Heuristic Evaluation (S2.2.1) detail.
| Category | Details |
|---|
| Input | ❻ List of Evaluators.
❽ Experiment Design Document.
Set of Heuristics to Be Utilized |
| Steps | Preparation: Provide a group of evaluators (between 3 and 5) with the fundamental background information on the systems subject to evaluation, accompanied by the specific objectives established for the assessment. Preliminary Questionnaire: Evaluators are required to complete a preliminary questionnaire to document their prior experiences evaluating systems, products, or services similar to the current proposal. System Evaluation: Evaluators will conduct a usability evaluation of the system individually and collectively in two phases: First Individual Phase: Each evaluator analyzes the selected system independently, generating a list of potential problems detected while considering the set of heuristics utilized. First Group Phase: The evaluators collaborate to create a unified list of potential problems based on individual findings, eliminating duplicates. Each potential problem is then associated with one or more heuristics from the set used.
Second Evaluation Phase: Second Individual Phase: Each evaluator assesses each potential problem in terms of frequency (f) and severity (s). The criticality (c) of each problem is calculated by summing the frequency and severity (c = f + s). Second Group Phase: The evaluators compile the data from the previous stage and calculate the average frequency, severity, and criticality for each detected problem, generating a prioritized list of issues aligned with the evaluation objectives.
Perception Questionnaire: Evaluators complete a perception questionnaire, including comments and observations about the system. Heuristic Evaluation Report: Evaluators are requested to develop a heuristic evaluation report that includes a list of tasks performed, identified problems, and proposed solutions.
|
| Output | ❿ Inspection Results:
Heuristic evaluation report. List of potential problems organized by severity (s), frequency (f), or criticality (c). List of tasks performed. Perception questionnaire of the service or system.
|
Table A13.
Inspections—Group-Based Expert Walkthrough (S2.2.2) detail.
Table A13.
Inspections—Group-Based Expert Walkthrough (S2.2.2) detail.
| Category | Details |
|---|
| Input | ❻ List of evaluators.
❽ Experiment design document. |
| Steps | Preparation: A group of evaluators (between 3 and 5) will be provided with the fundamental background information of the systems under evaluation, along with the specific objectives established for the assessment. Preliminary Questionnaire: Evaluators are required to complete a preliminary questionnaire to document their prior experiences evaluating systems, products, or services similar to the current proposal. First Stage: The evaluators interact with the service or information system to be assessed, following a predefined list of tasks. The lead evaluator presents the scenarios and tasks to the evaluation team twice. Evaluators independently identify problems and potential improvements to the system’s design, taking confidential notes.
Second Stage: The lead evaluator once again presents the scenarios and tasks to the team, repeating them twice. Evaluators engage in a discussion about the identified problems and possible enhancements to the system’s design. Evaluators collaboratively assign severity (s) and frequency (f) ratings to the detected problems and propose potential improvements to the system.
Third Stage:
|
| Output | ❿ Inspection Results:
|
Table A14.
Inspections—Perspective Based Inspection (S2.2.3) detail.
Table A14.
Inspections—Perspective Based Inspection (S2.2.3) detail.
| Category | Details |
|---|
| Input | ❻ List of evaluators.
❽ Experiment design document. |
| Steps | Preparation: Provide the evaluators (between 3 and 5) with fundamental background information on the systems to be evaluated, along with the specific objectives established for the evaluation. Preliminary Questionnaire: Evaluators are required to complete a preliminary questionnaire to document their backgrounds and previous experiences in evaluating systems, products, or services similar to the current proposal. Assignment of Forms: Each evaluator is given a tailored form specific to their assigned perspective. Individual Evaluation: Each evaluator assesses the service or system within the scenario agreed upon at the outset of the testing phase. Documentation of Findings: Problems identified by each evaluator are documented. Consolidation of Issues: Duplicate problems are eliminated, and similar issues are grouped together. Issue Assessment: Assign a frequency (f) and severity (s) to each problem. Criticality Calculation: Each evaluator thoroughly analyzes each potential problem, considering both its frequency (f) and severity (s). The criticality (c) of each problem is calculated by summing the assigned frequency and severity (c = f + s). Prioritization: Generate a prioritized list of problems based on the evaluation objectives. Perception Questionnaire: Evaluators complete a perception questionnaire, including comments and observations about the system.
|
| Output | ❿ Inspection Results: |
Table A15.
Student tests—Interview (S2.3.1) detail.
Table A15.
Student tests—Interview (S2.3.1) detail.
| Category | Details |
|---|
| Input | ❻ List of evaluators.
❼ List of participants.
❽ Experiment design document. |
| Steps | Interview Design:The evaluators and the coordinators responsible for conducting the interviews will decide on the type of interviews to implement based on available resources: Structured interviews for scenarios with minimal resources. Semi-structured interviews for scenarios with limited resources. Unstructured interviews for scenarios with sufficient resources.
Experts will formulate the interview questions and determine the number of students to be interviewed, aligning with the evaluation objectives and the resources available. Experts will define the execution scenarios for the interviews based on resources and the scope of the evaluation. Interviews can be conducted remotely, in person, or in a hybrid format; however, in-person interviews are strongly recommended.
Interview Execution:- 4.
The interviews will be conducted in the modality and settings established by the designated evaluators. - 5.
Students should be requested to provide demographic data at the beginning of the interview. - 6.
We highly recommend collecting audiovisual materials (e.g., interview recordings) for subsequent analysis and ensuring the consideration of representative samples (e.g., gender, culture, disabilities). - 7.
Interviewers must remind students of the confidentiality of their data and obtain formal consent if necessary. - 8.
Document all results obtained in the formal evaluation report.
|
| Output | ⓫ Student Test Results: |
Table A16.
Students test—Survey (S2.3.2) detail.
Table A16.
Students test—Survey (S2.3.2) detail.
| Category | Details |
|---|
| Input | ❽ Experiment Design Document |
| Steps | Survey Adaptation: Adjust the proposed SX evaluation survey to fit the scenarios outlined by the Higher Education Institution (HEI). This includes: Language Adaptation: Translate the survey into the appropriate language(s). Customization: Incorporate distinctive elements and branding specific to the HEI. Legal Compliance: Include necessary administrative and legal information to ensure anonymity and compliance with data protection regulations.
Coordination: Organize the mass distribution of the survey to students who match the target profile. Survey Distribution: Send out the SX evaluation survey to the selected students. Reminders: Dispatch reminder notifications to students, considering the time frame allocated for survey completion. Data Processing: Tabulate and normalize the data obtained from the survey responses. Documentation: Record all results and findings in a formal report.
|
| Output | ⓫ Student Test Results: Qualitative Data: Insights from open-ended questions in the SX evaluation survey. Quantitative Data: Students’ perceptions measured on a Likert scale from 1 to 5, where 1 corresponds to “Strongly Disagree” and 5 corresponds to “Strongly Agree.” Demographic Information: - ◦
Age - ◦
Degree program - ◦
Nationality - ◦
Gender - ◦
Academic progress - ◦
Physical or intellectual disabilities
|
Table A17.
Students tests—Focus Group (S2.3.3) detail.
Table A17.
Students tests—Focus Group (S2.3.3) detail.
| Category | Details |
|---|
| Input | ❻ List of Evaluators.
❼ List of Participants.
❽ Experiment Design Document |
| Steps | Focus Group Design: Moderator Appointment: An evaluator (or two) will be designated as the moderator for the focus group(s). It is recommended that an academic professional and/or a psychologist be selected to fulfill this role. Question Formulation: Experts are granted the flexibility to pose any necessary questions to verify previously obtained data or to gather information on existing gaps. Group Composition: Focus groups are recommended to consist of 5 to 7 participating students to ensure effective interaction and data collection. Execution Scenarios: Experts will determine the execution scenarios for the interviews based on available resources and the scope of the evaluation. The focus groups may be conducted remotely, in person, or through a hybrid format; however, in-person sessions are strongly recommended to facilitate better communication and engagement.
Focus Group Execution: Conducting the Interview: The interview will be carried out in the modality and settings established by the designated evaluators. Demographic Data Collection: Students should be asked to provide demographic information at the beginning of the interview to contextualize their feedback. Encouraging Participation: The moderator should actively encourage the participation of all students to ensure a diverse range of insights and perspectives. Audiovisual Recording: It is highly recommended that audiovisual materials, such as recordings of the interview, be collected for subsequent in-depth analysis. Confidentiality Assurance: The moderator must remind students about the confidentiality of their data and obtain formal consent if required by institutional policies or ethical guidelines. Documentation: All results and findings from the focus group should be thoroughly documented in the formal evaluation report for future reference and analysis.
|
| Output | ⓫ Student Test Results:Qualitative Data: Detailed qualitative insights into the student experience gathered during the focus group discussions. Audiovisual Material: Recordings and other audiovisual materials collected, which can be used for further analysis and to support the findings reported.
|
References
- Parasuraman, A.; Zeithaml, V.A.; Berry, L.L. A conceptual model of service quality and its implications for future research. J. Mark. 1985, 49, 41–50. [Google Scholar] [CrossRef]
- Parasuraman, A.; Zeithaml, V.A.; Berry, L.L. Servqual: A multiple-item scale measuring consumer perceptions of service quality. J. Retail. 1988, 64, 12–40. [Google Scholar]
- ISO 9241-210; Ergonomics of Human-System Interaction—Part 11: Usability: Definitions and Concepts. International Organization for Standardization: Geneva, Switzerland, 2018.
- Nielsen Norman Group. How Channels, Devices, and Touchpoints Impact the Customer Journey. Available online: https://www.nngroup.com/articles/channels-devices-touchpoints/ (accessed on 14 September 2024).
- Lewis, J. Usability: Lessons Learned... and Yet to Be Learned. Int. J. Hum.-Comput. Interact. 2014, 30, 663–684. [Google Scholar] [CrossRef]
- Hill, N.; Roche, G.; Allen, L. Customer Satisfaction. The Customer Experience Through the Customer’s Eye, 1st ed.; Cogent Publishing: Abingdon, UK, 2007. [Google Scholar]
- Sujata, J. Customer Experience Management: An Exploratory Study on the Parameters Affecting Customer Experience for Cellular Mobile Services of a Telecom Company. Procedia Soc. Behav. Sci. 2014, 133, 392–399. [Google Scholar]
- Gentile, C.; Spiller, N.; Noci, G. How to Sustain the Customer Experience: An Overview of Experience Components that Co-create Value with the Customer. Eur. Manag. J. 2007, 25, 395–410. [Google Scholar] [CrossRef]
- Lemon, K.N.; Verhoef, P.C. Understanding customer experience throughout the customer journey. J. Mark. 2016, 80, 69–96. [Google Scholar] [CrossRef]
- Harvey, L.; Knight, P.T. Transforming Higher Education; Society for Research into Higher Education, Open University Press: London, UK, 1996. [Google Scholar]
- Arambewela, R.; Maringe, F. Mind the gap: Staff and postgraduate perceptions of student experience in higher education. High. Educ. Rev. 2012, 44, 63–83. [Google Scholar]
- Matus, N.; Rusu, C.; Cano, S. Student eXperience: A Systematic Literature Review. Appl. Sci. 2021, 11, 9543. [Google Scholar] [CrossRef]
- UNESCO. Higher Education and the SDGs. Available online: https://www.iesalc.unesco.org/en/sustainable-development/contribution-higher-education-sdgs/ (accessed on 4 May 2025).
- UNESCO. The 17 Goals: Sustainable Development. Available online: https://sdgs.un.org/goals (accessed on 14 September 2024).
- Hofstede, G.; Hofstede, G.J.; Minkov, M. Cultures and Organizations. Software of the Mind; McGraw Hill: New York, NY, USA, 2010. [Google Scholar]
- Hofstede, G. Culture’s Consequences: Comparing Values, Behaviours, Institutions, and Organizations Across Nations, 2nd ed.; Sage: London, UK, 1980. [Google Scholar]
- Taras, V.; Rowney, J.; Steel, P. Half a century of measuring culture: Review of approaches, challenges, and limitations based on the analysis of 121 instruments for quantifying culture. J. Int. Manag. 2009, 15, 357–373. [Google Scholar] [CrossRef]
- The Culture Factor: Frequently Asked Questions. Available online: https://www.theculturefactor.com/frequently-asked-questions (accessed on 10 September 2024).
- Hofstede, G. Masculinity and Femininity: The Taboo Dimension of National Cultures; Sage: London, UK, 1998. [Google Scholar]
- Association for Computing Machinery (ACM); IEEE-Computer Society (IEEE-CS); Association for Advancement of Artificial Intelligence (AAAI). Computer Science Curricula 2023. Available online: https://csed.acm.org/wp-content/uploads/2023/03/Version-Beta-v2.pdf (accessed on 25 January 2025).
- Matus, N.; Cristian, R.; Federico, B. Proposing a SX Model with Cultural Factors. Appl. Sci. 2023, 13, 3713. [Google Scholar] [CrossRef]
- Nielsen, J.; Molich, R. Heuristic evaluation of user interfaces. In Proceedings of the SIGCHI Conference on Human Factors in Computing Systems, Seattle, WA, USA, 1–5 April 1990; Association for Computing Machinery: Seattle, USA, 1990; pp. 249–256. [Google Scholar]
- Quesenbery, W.; Szuc, D. Culture and UX. In Global UX; Quesenbery, W., Szuc, D., Eds.; Morgan Kaufmann Publishers: Burlington, MA, USA, 2012; pp. 33–53. [Google Scholar] [CrossRef]
- Matus, N.; Rusu, C.; Botella, F. Towards Well-Being and Inclusion in the Educational System: A Preliminary Methodology for Evaluating Student eXperience Considering Cultural Factors. In Social Computing and Social Media. HCII 2023; Coman, A., Vasilache, S., Eds.; Springer: Cham, Switzerland, 2023; Volume 14026. [Google Scholar] [CrossRef]
- Valls-Figuera, R.G.; Torrado-Fonseca, M.; Borràs, J. The Impact of International Student Mobility on Multicultural Competence and Career Development: The Case of Students from Latin America and the Caribbean in Barcelona. Educ. Sci. 2023, 13, 869. [Google Scholar] [CrossRef]
- Ren, X. Exploring instructors’ cultural presence in online course design and delivery. Distance Educ. 2024, 45, 552–578. [Google Scholar] [CrossRef]
- Delgado-Valdivieso, K.; Vivas-Paspuel, D.A. Inclusive Education in Latin American Universities: Proposal for A Care Model. Evol. Stud. Imaginative Cult. 2024, 8, 534–552. [Google Scholar] [CrossRef]
- Matus, N.; Ito, A.; Rusu, C. Analyzing the Impact of Culture on Students: Towards a Student eXperience Holistic Model. In Social Computing and Social Media. HCII 2022; Meiselwitz, G., Ed.; Springer: Cham, Switzerland, 2022; Volume 13316. [Google Scholar]
- Lysgaard, S. Adjustment in a Foreign Society: Norwegian Fulbright Grantees Visiting the United States. Int. Soc. Sci. Bull. 1955, 7, 45–51. [Google Scholar]
- Gullahorn, J.T.; Gullahorn, J.E. An Extension of the U-Curve Hypothesis. J. Soc. Sci. 1963, 19, 33–47. [Google Scholar]
- Hernández Sampieri, R.; Fernández Collado, C.; Baptista Lucio, M.P. Metodología de la investigación, 6th ed.; McGraw Hill Interamericana Editores S.A. de C.V.: Atlatlaco, Mexico, 2014. [Google Scholar]
- Cano, S.; Rusu, C.; Matus, N.; Quiñones, D.; Mercado, I. Analyzing the Student eXperience Concept: A Literature Review. In Social Computing and Social Media: Applications in Marketing, Learning, and Health. HCII 2021; Meiselwitz, G., Ed.; Lecture Notes in Computer Science; Springer: Cham, Switzerland, 2021; Volume 12775. [Google Scholar]
- Inglehart, R. Modernization and Postmodernization: Cultural, Economic and Political Change in 43 Societies; Princeton University Press: Princeton, NJ, USA, 1997. [Google Scholar]
- Schwartz, S.H. Beyond Individualism-Collectivism: New Cultural Dimensions of Values. In Individualism and Collectivism: Theory, Method, and Application; Kim, U., Triandis, H.C., Kagitcibasi, C., Choi, S.-C., Yoon, G., Eds.; Sage: London, UK, 1994; pp. 85–119. [Google Scholar]
- Object Management Group. Business Process Model and Notation (BPMN). Available online: https://www.bpmn.org/ (accessed on 13 July 2024).
- Nielsen Norman Group: When and How to Create Customer Journey Maps. Available online: https://www.nngroup.com/articles/customer-journey-mapping/ (accessed on 15 September 2024).
- Nielsen Norman Group: Journey Mapping 101. Available online: https://www.nngroup.com/articles/journey-mapping-101/ (accessed on 15 September 2024).
- Pernice, K.; Nielsen Norman Group. Emotional Design Fail: I’m Divorcing My Nest Thermostat. Available online: https://www.nngroup.com/articles/emotional-design-fail/ (accessed on 15 September 2024).
- Jordan, P.W. Designing Pleasurable Products: An Introduction to the New Human Factors; Taylor & Francis: London, UK, 2000. [Google Scholar]
- Almeida, R.; Andrade, R.; Darin, T.; Paiva, J. CHASE: Checklist to assess user experience in IoT environments. In Proceedings of the International Conference on Software Engineering, Seoul, Republic of Korea, 27 June–19 July 2020. [Google Scholar]
- Kalawsky, R. VRUSE—A computerized diagnostic tool: For usability evaluation of virtual/synthetic environment systems. Appl. Ergon. 1999, 30, 11–25. [Google Scholar] [CrossRef] [PubMed]
- Johnson, G.; Clegg, C.; Ravden, S. Towards a practical method of user interface evaluation. Appl. Ergon. 1989, 20, 255–260. [Google Scholar] [CrossRef] [PubMed]
- Rajanen, D.; Tornberg, A.; Rajanen, M. Heuristics for Course Workspace Design and Evaluation. Electron. Work. Comput. 2021. [Google Scholar] [CrossRef]
- Diaz, J.; Rusu, C.; Pow-Sang, J.; Roncagliolo, S. A cultural-oriented usability heuristics proposal. In Proceedings of the 2013 Chilean Conference on Human-Computer Interaction (ChileCHI ‘13), Temuco, Chile, 12–13 November 2013; Association for Computing Machinery: New York, USA, 2013; pp. 82–87. [Google Scholar]
- Følstad, A. Group-based Expert Walkthrough. In R3 UEMs: Review, Report and Refine Usability Evaluation Methods; In Proceedings of the COST294-MAUSE 3rd International Workshop: Athens, Greece, 5 March 2007. [Google Scholar]
- Zhang, Z.; Basili, V.; Shneiderman, B. Perspective-based usability inspection: An empirical validation of efficacy. Empir. Softw. Eng. 1999, 4, 43–69. [Google Scholar] [CrossRef]
- Seidman, I. Technique isn’t everything, but it is a lot. In Interviewing as Qualitative Research: A Guide for Researchers in Education and the Social Sciences; Teachers College Press: New York, NY, USA, 1998. [Google Scholar]
- Groves, R.; Fowler, F.; Couper, M.; Lepkowski, J.; Singer, E.; Tourangeau, R. An Introduction to Survey Methodology. In Survey Methodology, 2nd ed.; Wiley Series in Survey Methodology; John Wiley & Sons: Hoboken, NJ, USA, 2009; Volume 561. [Google Scholar]
- Sierra, R. Técnicas de investigación social; Paraninfo S.A: Madrid, Spain, 1994. [Google Scholar]
- Callejo, J. El Grupo de Discusión: Introducción a una Práctica de Investigación; Ariel: Barcelona, Spain, 2001. [Google Scholar]
- Likert, R. A Technique for the Measurement of Attitudes. Arch. Psychol. 1932, 22, 55. [Google Scholar]
- Karat, J. User-centered software evaluation methodologies. In Handbook of Human-Computer Interaction, 2nd ed.; Helander, M.G., Landauer, T.K., Prabhu, P.V., Eds.; North-Holland: Amsterdam, The Netherlands, 1997; pp. 689–704. [Google Scholar] [CrossRef]
- European Commission. A Plan for Achieving Gender Equality in the Research and Innovation System. Available online: https://projects.research-and-innovation.ec.europa.eu/en/projects/success-stories/all/plan-achieving-gender-equality-research-and-innovation-system (accessed on 13 September 2024).
- UNESCO. Global Convention on Higher Education. Available online: https://www.unesco.org/en/higher-education/global-convention (accessed on 16 September 2024).
- UNESCO. Higher Education. Available online: https://www.unesco.org/en/higher-education (accessed on 16 September 2024).
- Wang, L. Equity, Inclusion and the Transformation of Higher Education. Available online: https://www.unesco.org/en/articles/equity-inclusion-and-transformation-higher-education (accessed on 16 September 2024).
| Disclaimer/Publisher’s Note: The statements, opinions and data contained in all publications are solely those of the individual author(s) and contributor(s) and not of MDPI and/or the editor(s). MDPI and/or the editor(s) disclaim responsibility for any injury to people or property resulting from any ideas, methods, instructions or products referred to in the content. |
© 2025 by the authors. Licensee MDPI, Basel, Switzerland. This article is an open access article distributed under the terms and conditions of the Creative Commons Attribution (CC BY) license (https://creativecommons.org/licenses/by/4.0/).


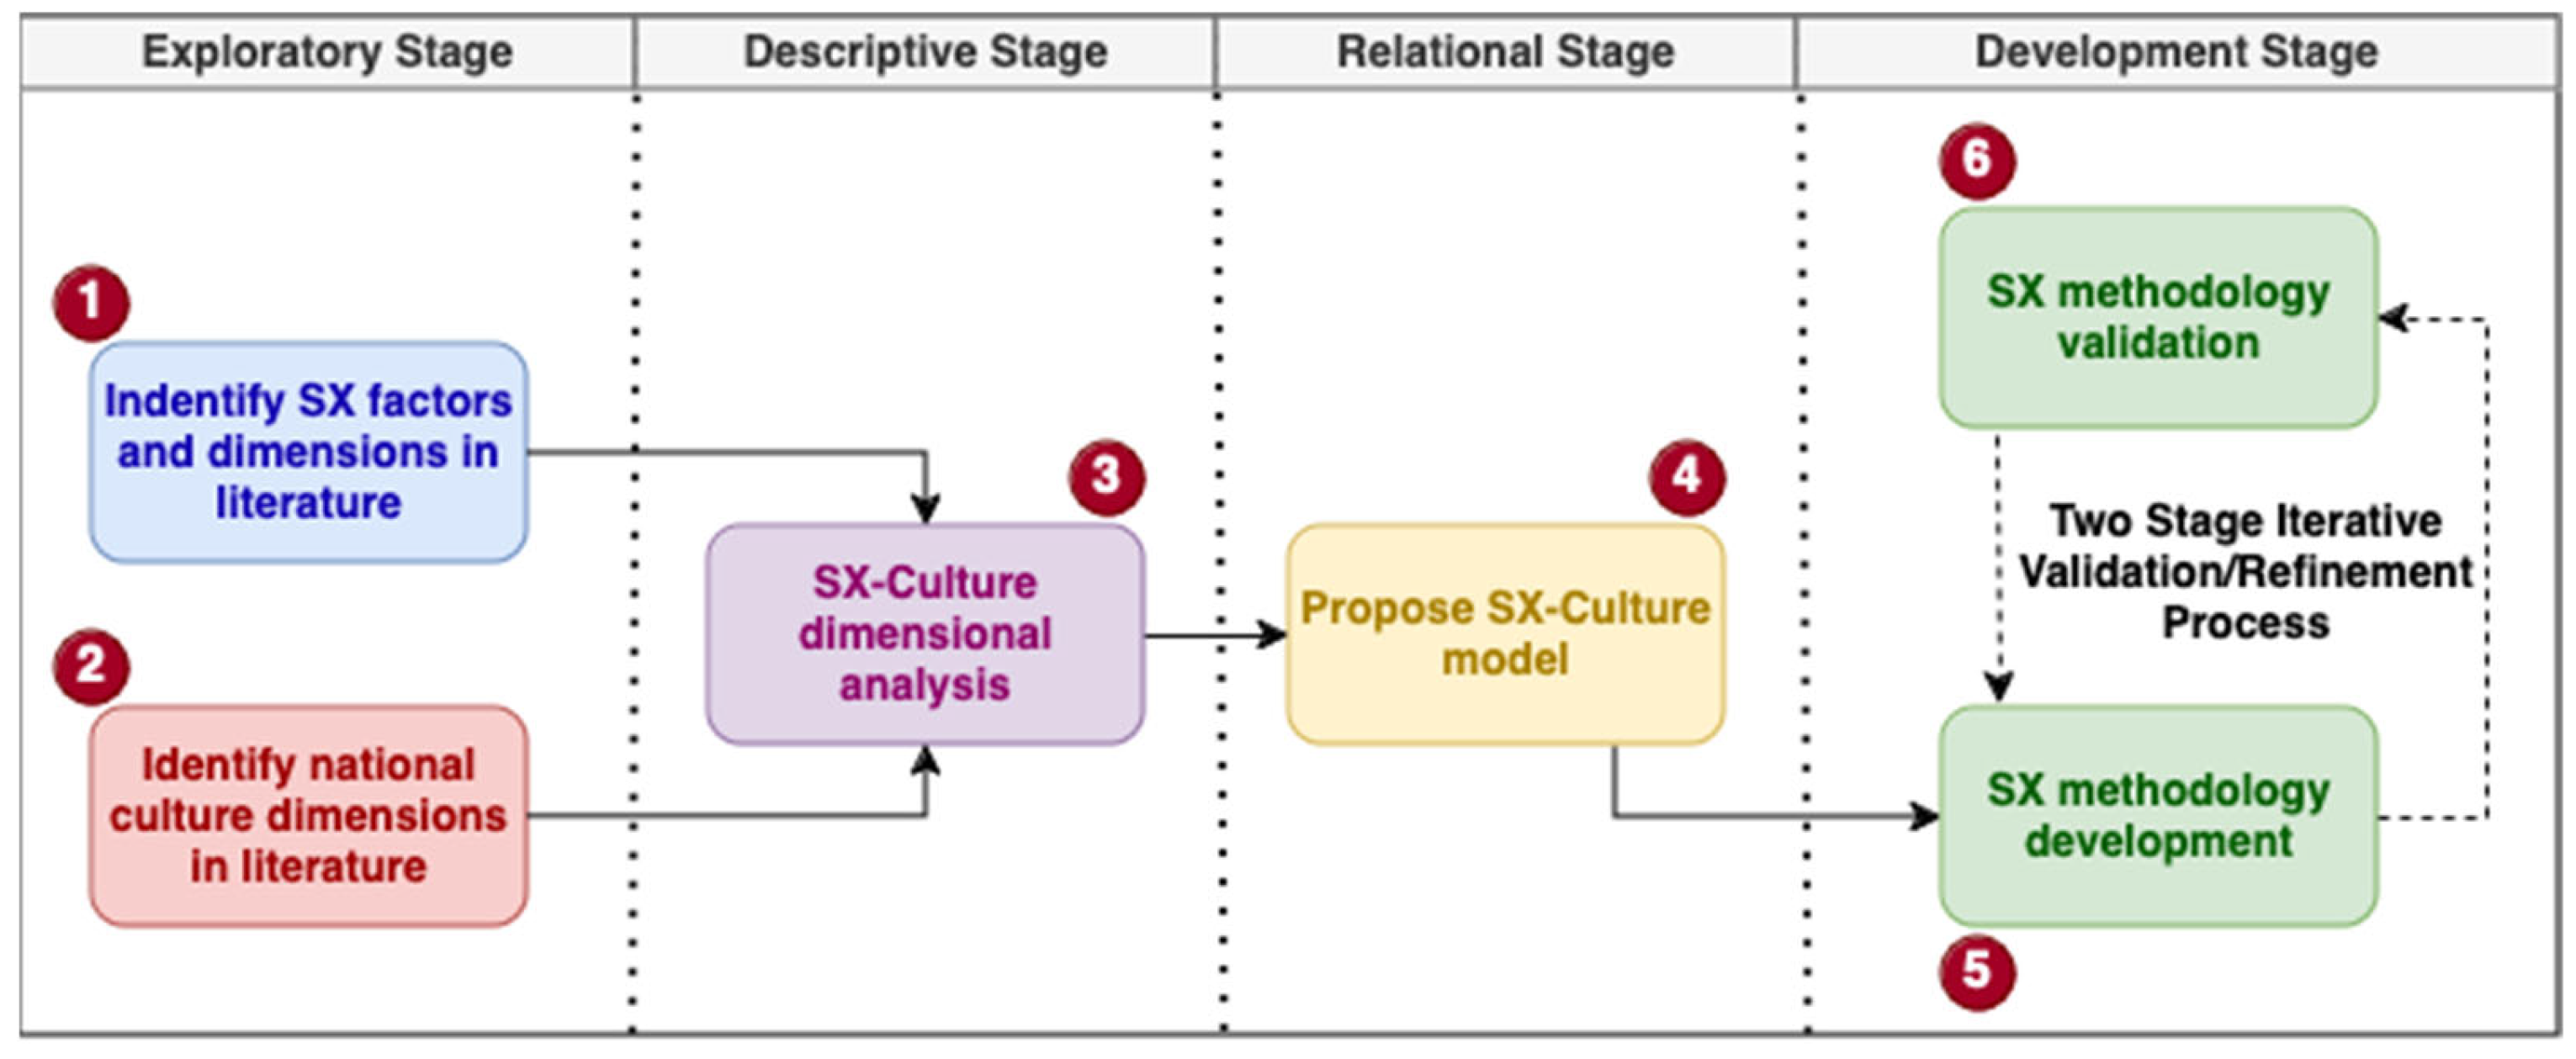
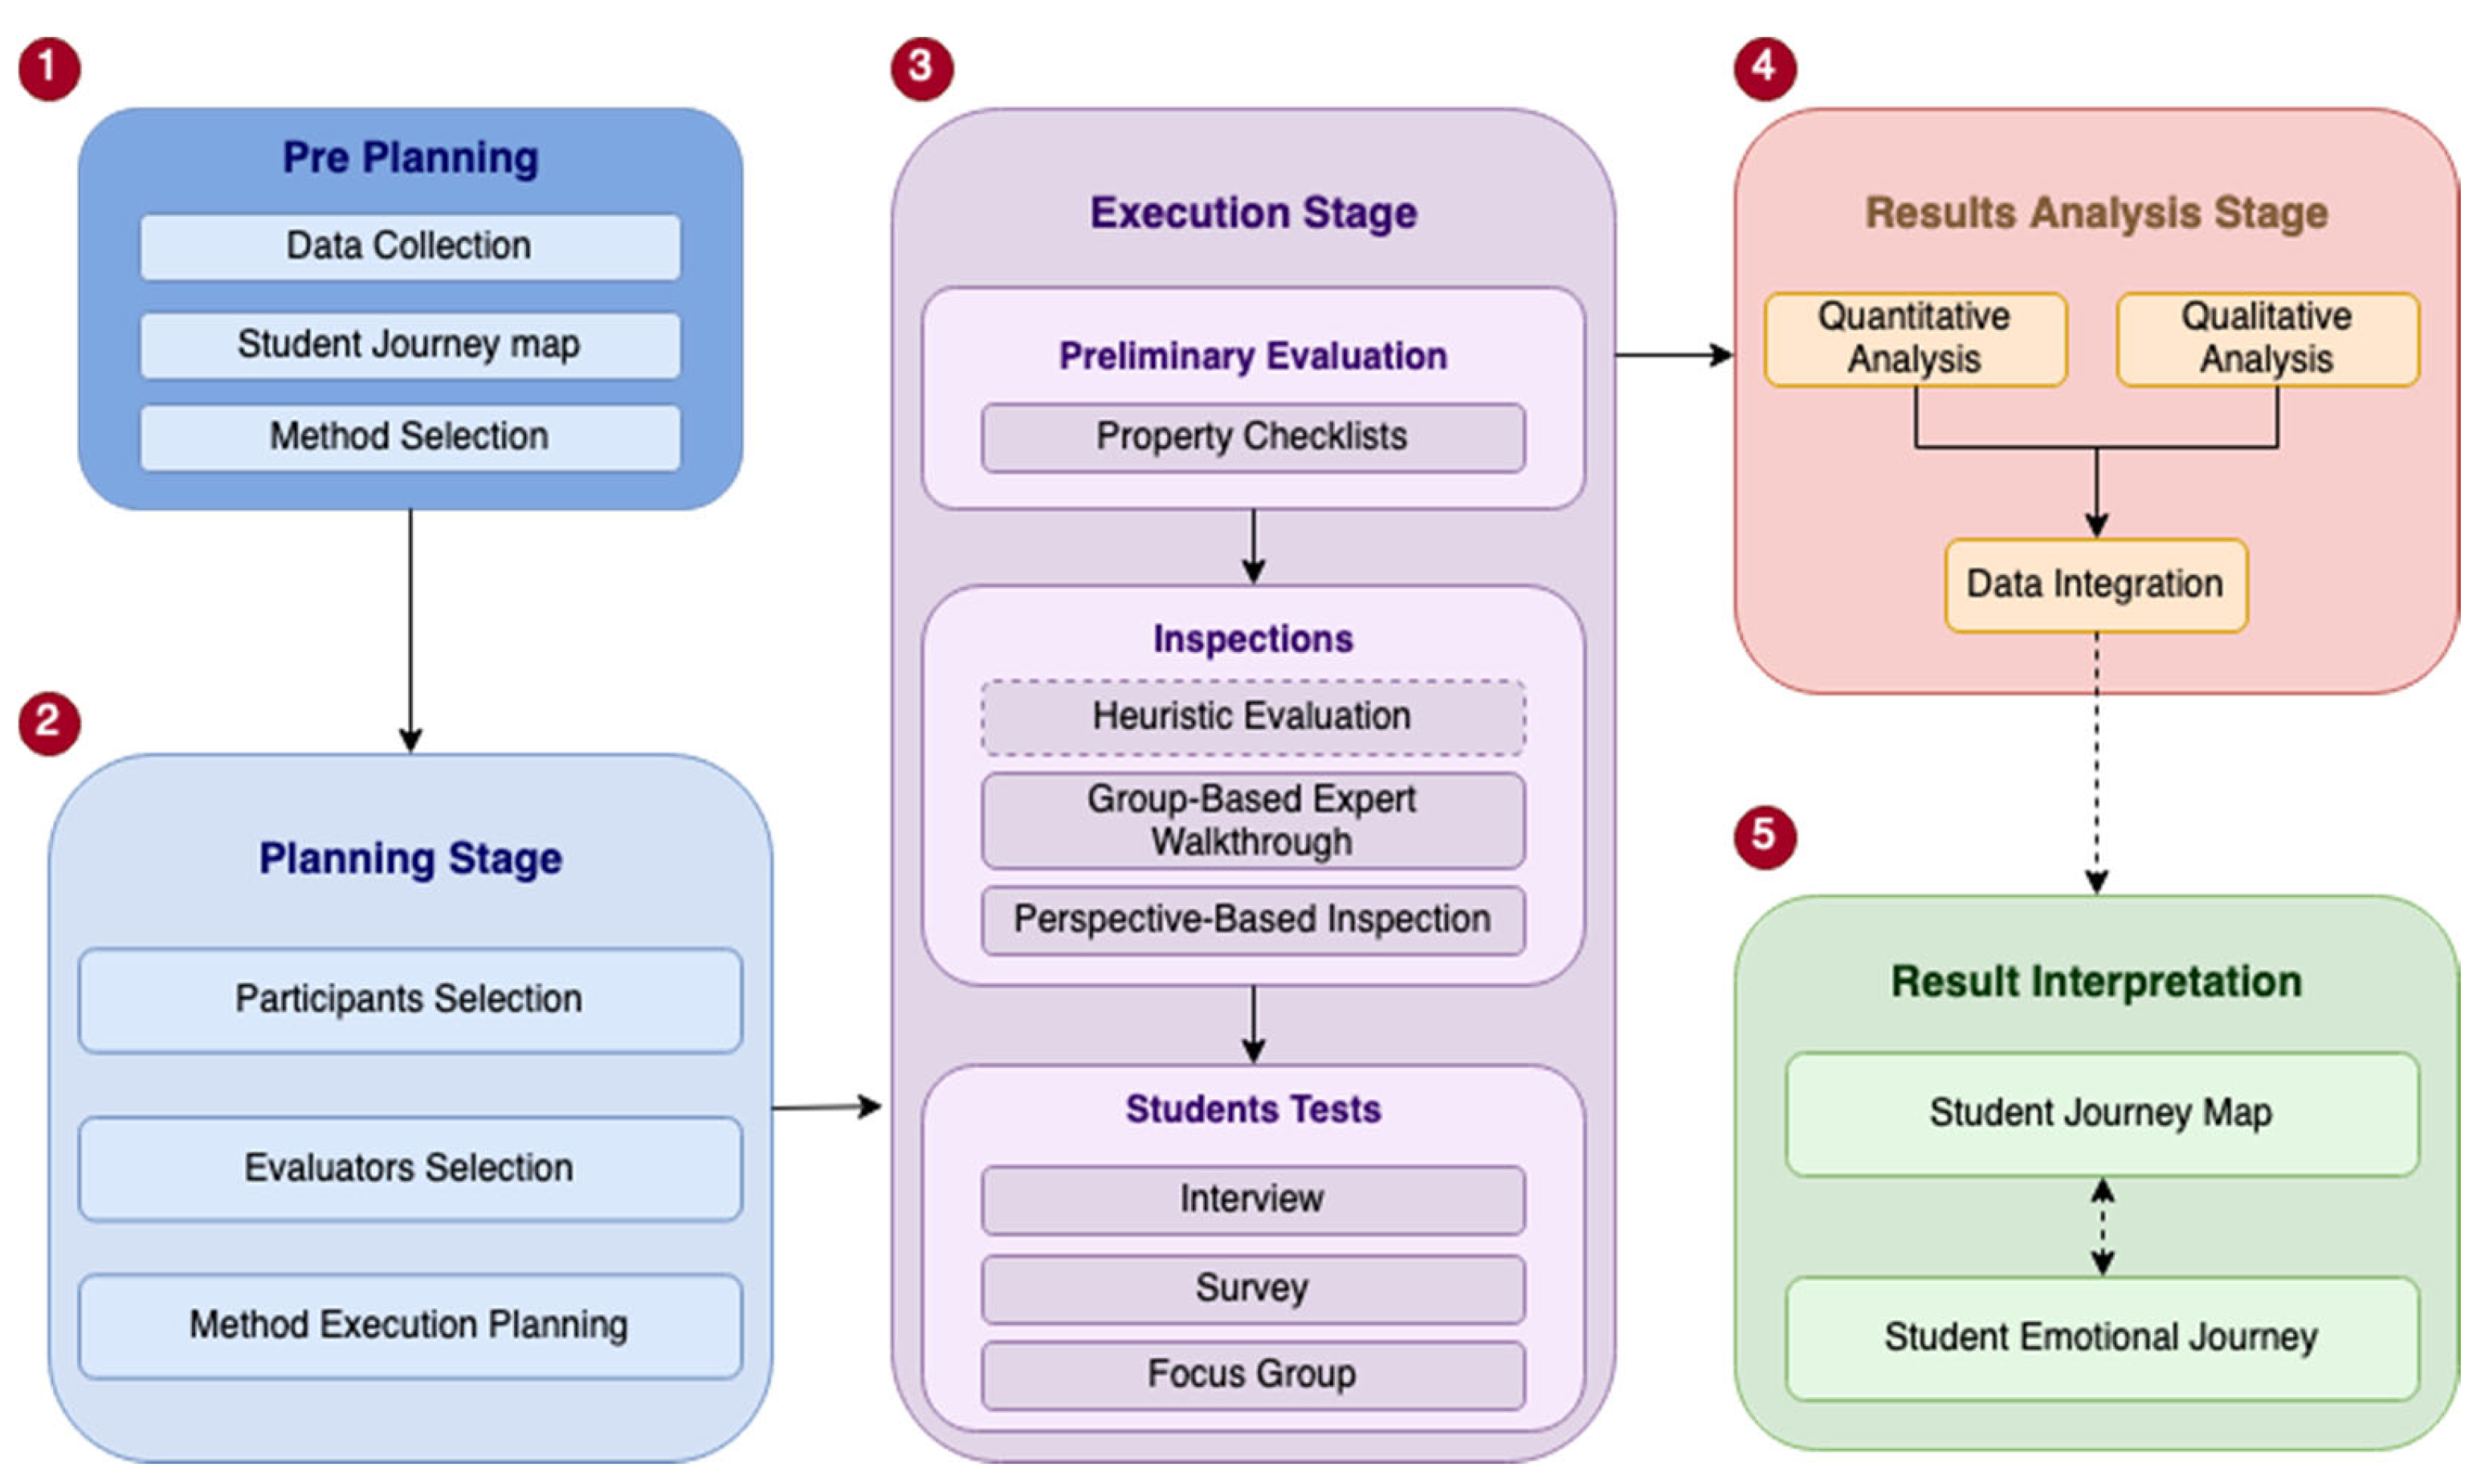

