Article

Deep Learning-Enhanced Spectrogram Analysis for Anatomical Region Classification in Biomedical Signals

by
Abdul Karim
1,2,†,
Semin Ryu
2,† and
In cheol Jeong
1,2,3,*
1
Cerebrovascular Disease Research Center, Hallym University, Chuncheon 24252, Gangwon, Republic of Korea
2
Department of Artificial Intelligence Convergence, Hallym University, Chuncheon 24252, Gangwon, Republic of Korea
3
Department of Population Health Science and Policy, Icahn School of Medicine at Mount Sinai, New York, NY 10029, USA
*
Author to whom correspondence should be addressed.
These authors contributed equally to this work.
Appl. Sci. 2025, 15(10), 5313; https://doi.org/10.3390/app15105313
Submission received: 26 March 2025 / Revised: 25 April 2025 / Accepted: 3 May 2025 / Published: 9 May 2025

Abstract

:
Accurate classification of biomedical signals is essential for advancing non-invasive diagnostic techniques and improving clinical decision-making. This study introduces a deep learning-augmented spectrogram analysis framework for classifying biomedical signals into eight anatomically distinct regions, thereby addressing a significant deficiency in automated signal interpretation. The proposed approach leverages a fine-tuned ResNet50 model, pre-trained on ImageNet, and adapted for a single-channel spectrogram input to ensure robust feature extraction and high classification accuracy. Spectrograms derived from palpation and percussion signals were preprocessed into grayscale images and optimized through data augmentation and hyperparameter tuning to enhance the model’s generalization. The experimental results demonstrate a classification accuracy of 93.37%, surpassing that of conventional methods and highlighting the effectiveness of deep learning in biomedical signal processing. This study bridges the gap between machine learning and clinical applications, enabling an interpretable and region-specific classification system that enhances diagnostic precision. Future work will explore cross-domain generalization, multi-modal medical data integration, and real-time deployment for clinical applications. The findings establish a significant advancement in non-invasive diagnostics, demonstrating the potential of deep learning to refine and automate biomedical signal analysis in clinical practice.

1. Introduction

Biomedical signal processing is critical in modern healthcare, particularly in non-invasive diagnostics. Traditional physical examination methods, such as palpation and percussion, provide essential clinical insights; however, their interpretation remains subjective and heavily dependent on practitioner expertise. The integration of machine learning (ML) and deep learning (DL) techniques has revolutionized biomedical signal classification, enabling automated, consistent, and reproducible diagnostic outcomes, particularly in respiratory sound analysis and smart stethoscope applications [1,2,3].
Historically, the classification of biomedical signals has predominantly focused on detecting illness-related anomalies, including chronic obstructive pulmonary disease (COPD) and cardiovascular disorders [4,5]. Although these approaches have demonstrated clinical utility, limited research has been conducted on anatomical region-based classification, which is critical for improving clinical relevance and interpretability [6]. Most prior studies emphasized participant-based classification, overlooking the need for anatomical localization, which is essential for precise medical applications [7].
This study introduces a deep learning-driven approach for classifying biomedical spectrograms into anatomical regions by leveraging a fine-tuned ResNet50 model. Unlike conventional classification models, the proposed method ensures that signal mapping aligns with distinct anatomical regions, thereby improving clinical interpretability and application [8,9]. Furthermore, this framework enhances diagnostic capabilities by incorporating transfer learning and optimizing feature extraction for biomedical signal classification [10,11].
Figure 1 depicts the comprehensive workflow of the proposed deep learning-based biomedical signal classification pipeline. The procedure commences with the collection of biological data using touch and percussion, followed by the creation of spectrograms utilizing Short-Time Fourier Transform (STFT). The spectrograms underwent preprocessing, including grayscale conversion, resizing, and data augmentation, to ensure optimal feature extraction. These processed spectrograms served as inputs to the fine-tuned ResNet50 model, which classifies signals into anatomical regions. The classification results provide interpretable outputs for non-invasive diagnostics, contributing to improved clinical decision-making. Unlike prior studies that relied solely on conventional auscultation or disease classification, this work presents a diagnostic approach focused on anatomical region-based classification of palpation and percussion signals using spectrogram analysis. To the best of current knowledge, this study is the first to integrate region-specific labeling of palpation- and percussion-derived signals with a fine-tuned ResNet50 model, emphasizing both spatial context and deep feature learning in non-invasive diagnostics.

Key Contributions

This research presents the following major contributions:
  • The first deep learning framework for anatomical region classification of biomedical spectrograms ensured interpretability and clinical relevance.
  • The fine-tuned ResNet50 model was adapted for grayscale spectrogram input, effectively capturing spectral and spatial features of palpation and percussion signals.
  • The achieved high classification accuracy (93.37%) surpassed that of conventional models and demonstrated robustness in anatomical region-based biomedical signal classification.
  • A comprehensive preprocessing pipeline incorporating spectrogram normalization, augmentation, and optimized feature extraction ensures an improved model generalization and robustness.
Although the ResNet50 architecture itself is not newly developed, its application in this context represents a distinct use case within biomedical signal classification. Region-based classification of biomedical signals offers a critical advancement in clinical workflows, particularly in non-invasive gastrointestinal and abdominal assessments. By identifying the anatomical origin of sound-based signals, the proposed method can support spatially guided diagnosis, such as the detection of abnormal resonance, bowel sound shifts, or localized abnormalities, which are often missed in binary disease classification models. This allows for more precise, region-aware clinical interpretation in both remote and in-person diagnostic settings.
By bridging the gap between raw biomedical signal acquisition and interpretable clinical outputs, this study contributes to the advancement of non-invasive diagnostic techniques, paving the way for real-world clinical applications [12].

2. Related Work

Deep learning has significantly transformed biomedical signal processing, particularly in respiratory sound classification, auscultation analysis, and disease detection [13,14,15]. Initially, respiratory anomalies were predicted using Recurrent Neural Networks (RNNs) [16] which demonstrated the potential of sequential modeling in biomedical signal analysis. Other approaches incorporated transformation techniques like the 3D-second order difference plot applied to respiratory sounds [17] though these still required hand-crafted features. The emergence of deep-learning-based frameworks, particularly Convolutional Neural Networks (CNNs), enabled end-to-end learning directly from spectrogram inputs, significantly improving performance in respiratory sound classification tasks [18].

2.1. Advancements in Deep Learning for Biomedical Signal Classification

Several studies have explored deep learning for automated respiratory sound classification. Palaniappan et al. [19] employed a three-dimensional second-order difference plot utilizing convolutional neural networks to categorize respiratory data, thereby improving accuracy. Similarly, Jácome and Marques [20] employed Recurrent Neural Networks (RNNs) to classify respiratory anomalies, demonstrating the effectiveness of sequential models in biomedical applications. More recently, Rao et al. [21] introduced co-tuning and stochastic normalization to refine CNN-based models for lung-sound analysis. In addition, Ansari and Hasan [22] proposed SpectNet, an end-to-end CNN architecture with learnable spectrogram front-end layers that significantly improved the classification performance in heart-sound analysis. Despite these advancements, most existing studies have focused on disease classification rather than anatomical region-based classification, which limits their clinical interpretability and real-world applicability [23,24].

2.2. Challenges in Existing Biomedical Signal Classification Methods

A major limitation of previous research is the lack of anatomical localization for biomedical signal classification. Traditional auscultation studies primarily focus on distinguishing between normal and abnormal lung sounds without mapping these signals to specific anatomical regions [25]. Table 1 presents a comparison of recent studies and highlights their methodologies, datasets, and limitations.
While these studies have significantly advanced biomedical sound classification, none have explicitly incorporated anatomical region-based classification. This study addresses this gap by introducing a fine-tuned ResNet50 model that classifies biomedical spectrograms into distinct anatomical regions, thereby improving both the diagnostic accuracy and interpretability [29,30].
Existing research on biomedical signal classification has primarily focused on disease detection and general respiratory anomaly classification, often overlooking anatomical localization. The proposed approach aims to bridge this gap by incorporating anatomical region classification, thereby ensuring enhanced clinical relevance and real-world applicability. This study builds on deep learning advancements while addressing the critical need for precise signal-to-anatomical mapping, thereby laying the foundation for more interpretable and accurate biomedical diagnostics.

3. Methodology

The proposed framework aims to classify biomedical spectrograms into eight anatomical regions using a fine-tuned ResNet50 deep-learning model. This section details the dataset, preprocessing steps, spectrogram transformation, model architecture, training methodology, and evaluation metrics.

3.1. Problem Statement

Accurate classification of biomedical signals obtained from palpation and percussion remains a challenge because of the overlapping frequency components and signal variability among individuals. Traditional diagnostic techniques rely on subjective assessments, leading to inconsistencies in clinical evaluation. This study addresses these limitations by developing a deep-learning-based classification framework that utilizes spectrogram transformations and a fine-tuned ResNet50 model to improve the accuracy and robustness of distinguishing signals from eight anatomical regions. The proposed approach aims to enhance the diagnostic reliability by leveraging advanced feature extraction and machine learning techniques.

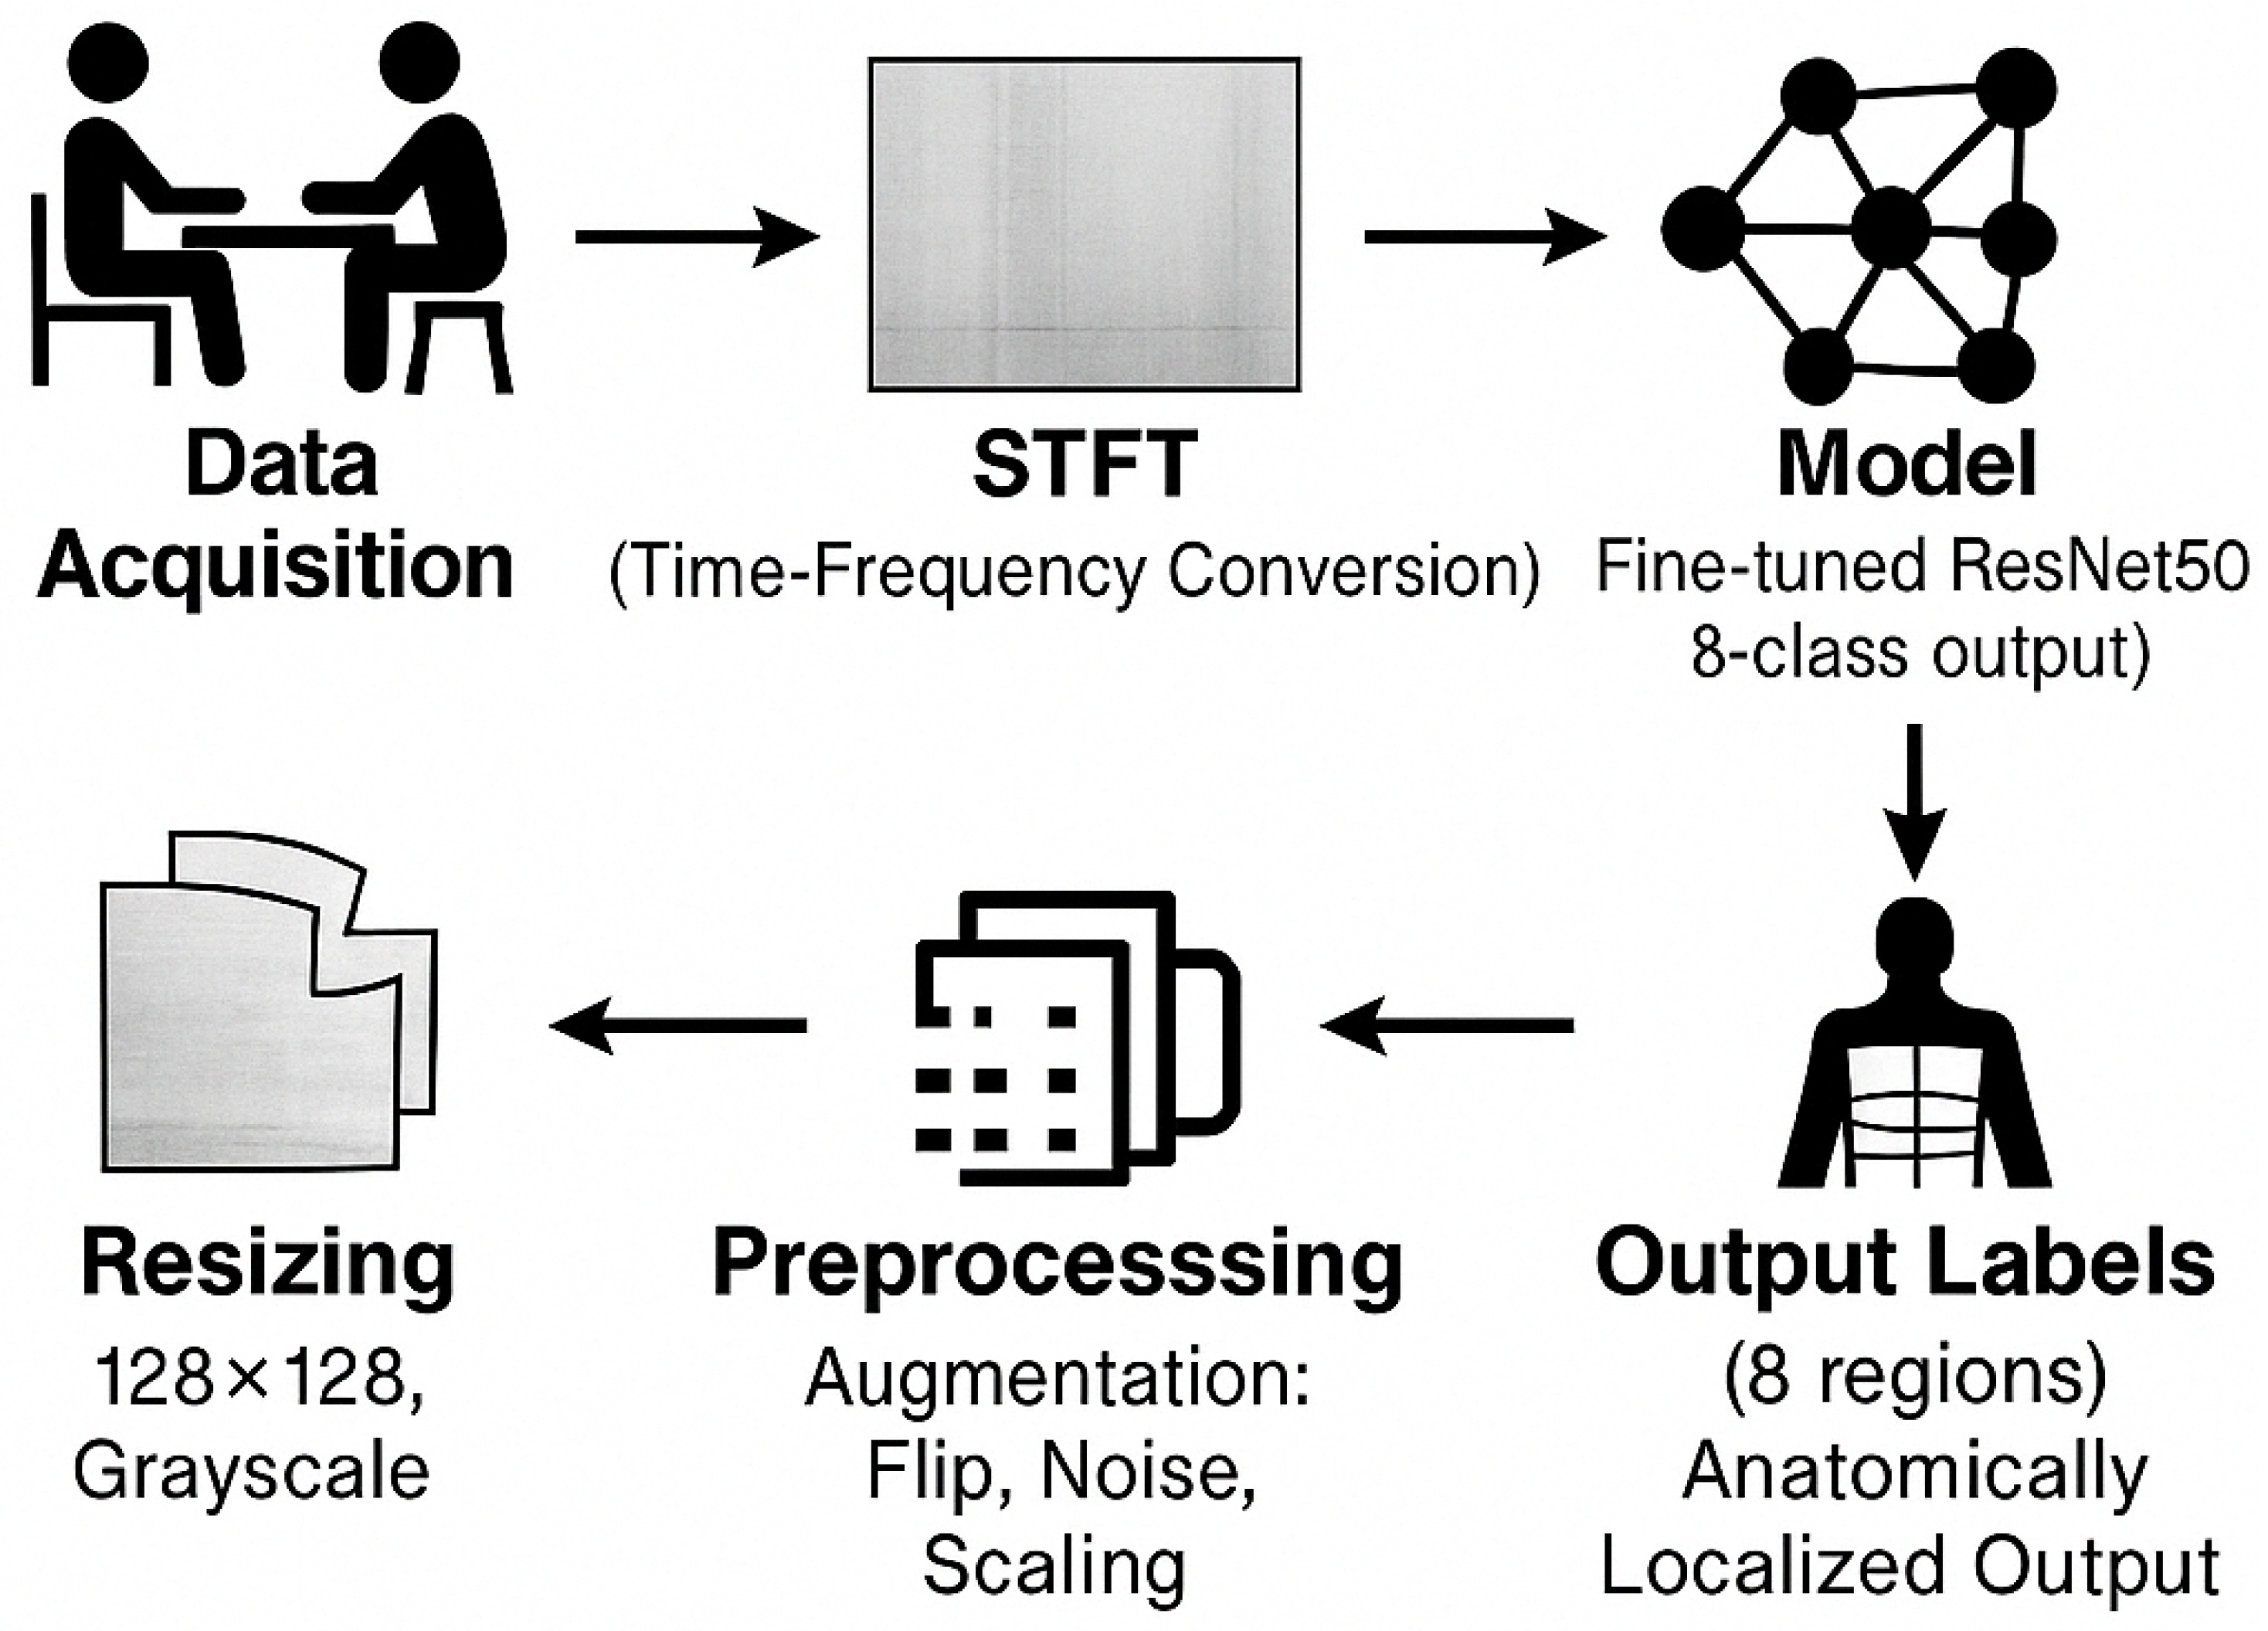
3.2. Dataset and Preprocessing

Biomedical signals acquired through palpation and percussion were transformed into spectrograms using the Short-Time Fourier Transform (STFT), a widely employed technique for the time-frequency representation of non-stationary signals [17,18]. The dataset consisted of 18,240 spectrograms obtained from patients, encompassing eight anatomical regions [19]. These regions represent standardized anatomical zones frequently examined through percussion and palpation, including the upper and lower abdominal quadrants, left and right flanks, and the epigastric area. Zone mapping followed the clinical protocol defined by the iApp platform [31], ensuring reproducibility and relevance for diagnostic analysis.
The signals were collected using a physiological sound transducer (TSD108, BIOPAC Systems) connected to the BIOPAC MP150 data acquisition system as part of the iApp platform [31], ensuring reproducibility and relevance for diagnostic analysis. This segmentation is consistent with standard clinical examination techniques used to assess gastrointestinal and abdominal health, where physicians routinely perform palpation and percussion across these zones to detect abnormalities, such as tenderness, swelling, or acoustic changes. Only the sound signals from palpation and percussion were used for training and classification, and no force or acceleration signals were included. Each signal was recorded at a sampling rate of 312 Hz with a duration of approximately 11.5 s. The resulting time-domain sound signals were processed into spectrograms using STFT to enable time-frequency analysis.
Each spectrogram was normalized and converted into grayscale to reduce the computational complexity and improve model generalization [20]. To standardize the dataset, each spectrogram was resized to 128 × 128 pixels, normalized to a range of [0, 1], and augmented to prevent overfitting [25]. Several domain-specific augmentation techniques have been applied to improve model generalization and prevent overfitting. These included horizontal flipping, Gaussian noise injection, intensity scaling, and time-frequency masking. Each method was carefully chosen to maintain the spectral integrity of biomedical signals, avoiding transformations that could introduce unrealistic or misleading frequency patterns [32]. Each transformation was tested to ensure that it did not distort diagnostic characteristics within the spectrograms. Table 2 summarizes the dataset distribution.
The STFT was applied to convert the raw time-series signals into spectrograms, ensuring a rich time-frequency representation.
S ( t , f ) = x ( τ ) w ( τ t ) e j 2 π f τ d τ
where x ( τ ) is the input signal, w ( τ t ) is the window function, and e j 2 π f τ is the Fourier transform [21]. Recent comparative studies, such as Bao et al. [33], have shown that alternative time-frequency distribution methods, such as Continuous Wavelet Transform (CWT) and Chirplet Transform (CT) can also enhance spectrogram-based CNN performance. However, STFT remains widely used owing to its balance between computational efficiency and interpretability in biomedical signal-classification tasks.
To standardize the dataset, each spectrogram was resized to 128 × 128 pixels, normalized to a range of [0, 1], and augmented to prevent overfitting [25]. A 128 × 128 resolution was selected after conducting preliminary trials with alternative sizes, including 64 × 64 and 224 × 224. Larger resolutions increased the training time without significant accuracy improvements, while smaller resolutions led to information loss and reduced classification performance. The 128 × 128 size offered a practical balance between computational efficiency and sufficient resolution for learning spatial and frequency-dependent patterns in the spectrograms. Recent studies, such as Zhou et al. [32], have demonstrated that the choice of data augmentation techniques significantly affects spectrogram-based CNN classification performance. Methods such as horizontal flipping and PCA-based transformations have been shown to improve generalization, whereas others, such as noise injection, may introduce misleading spectral patterns. Figure 2 presents a summary of the proposed classification pipeline.

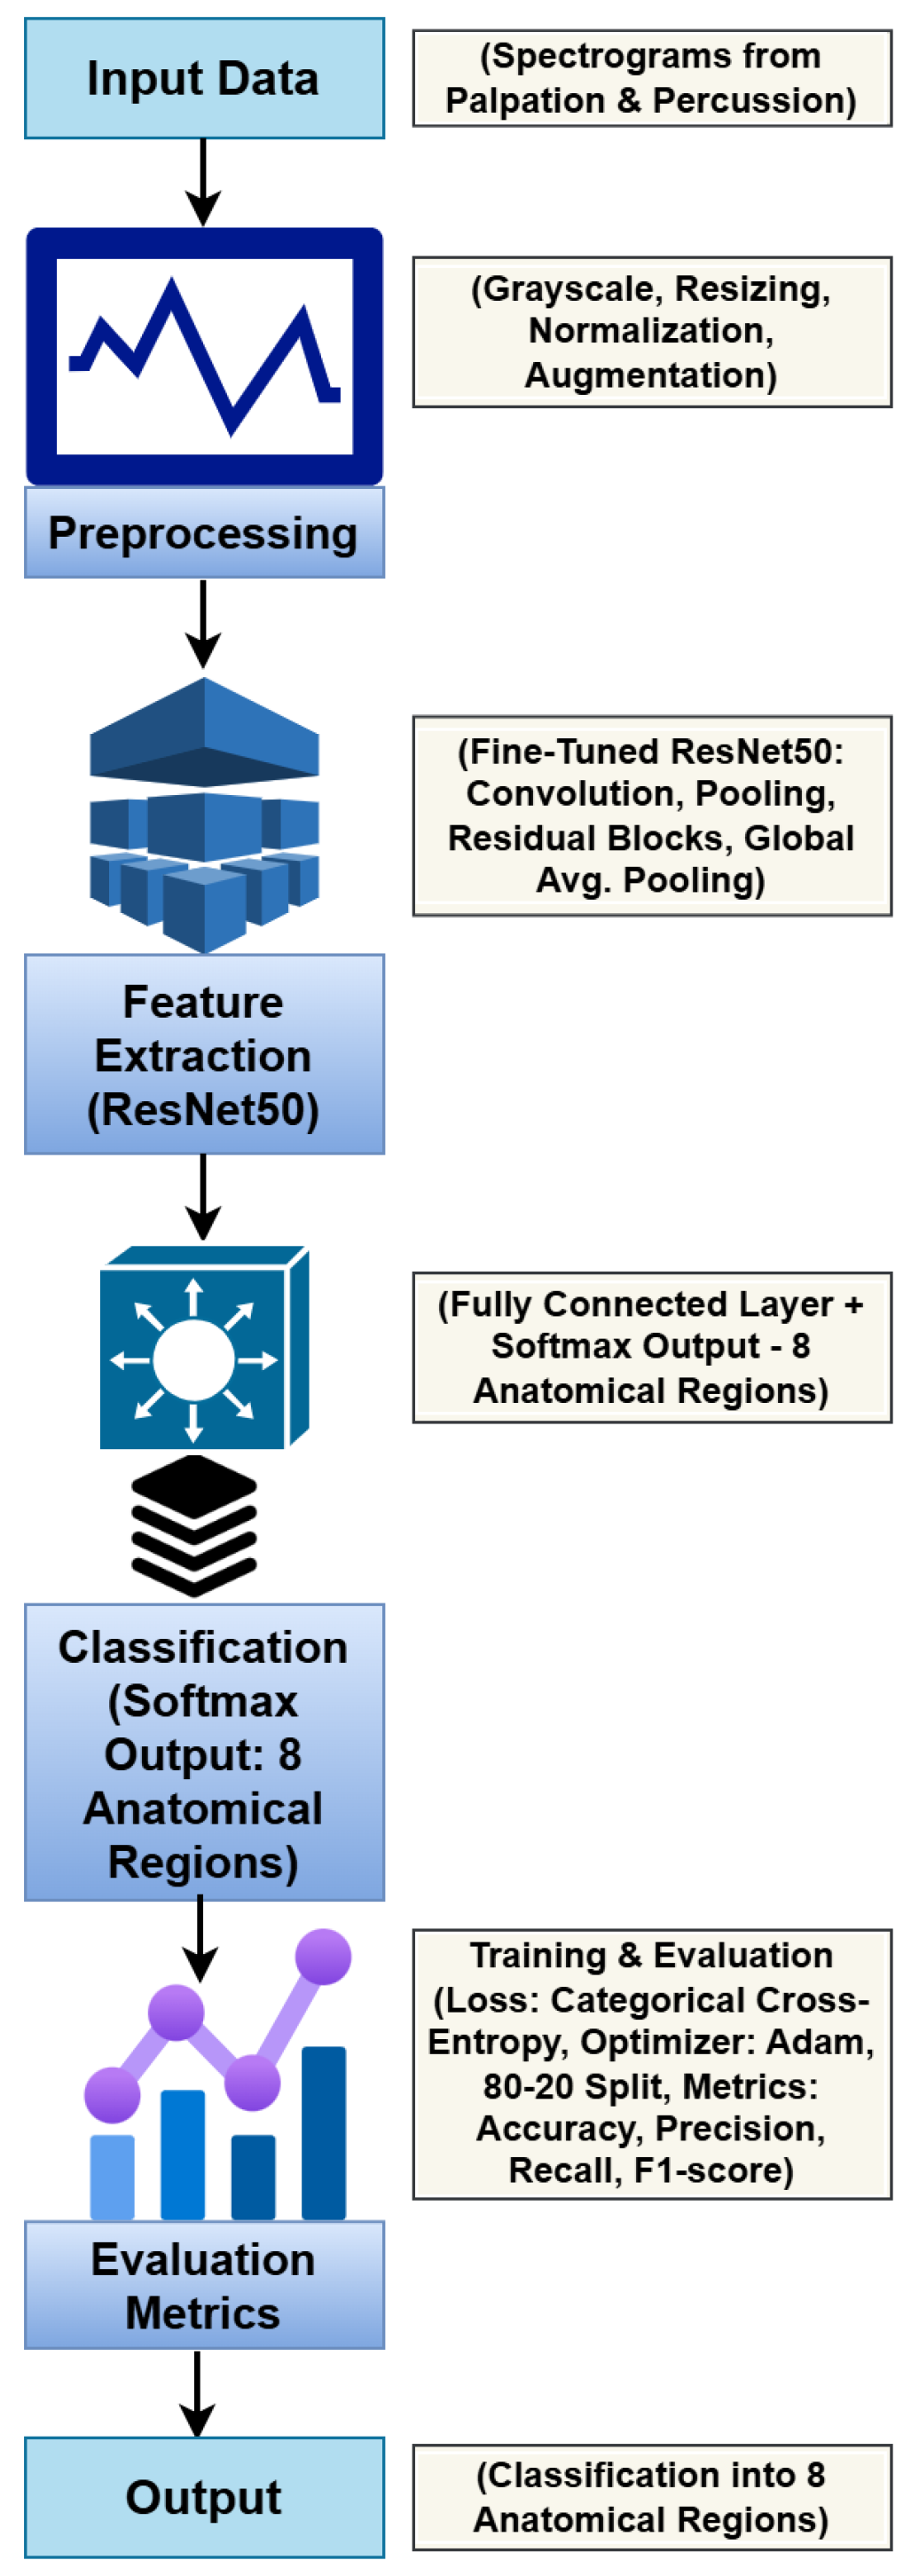
3.3. ResNet50-Based Deep Learning Model

ResNet50, a deep convolutional neural network pre-trained on ImageNet, was fine-tuned for biomedical spectrogram classification. Unlike traditional feature-engineering-based classifiers, ResNet50 automatically extracts high-level spectral and spatial patterns from spectrograms [27]. To adapt the model to spectrogram classification, the first convolutional layers were frozen, whereas the later residual blocks were fine-tuned using the dataset. This allowed the model to retain general image-level features while learning domain-specific representations from the biomedical spectrograms.
This transfer learning strategy enabled the model to retain low-level image features while learning domain-specific patterns in the spectrograms. The final classification layer was replaced with a fully connected dense layer comprising eight neurons with softmax activation corresponding to the eight anatomical regions. Fine-tuning was performed using the Adam optimizer with a learning rate of 0.0001 and a categorical cross-entropy loss.
ResNet50 was selected owing to its strong feature extraction capabilities, optimized computational efficiency, and proven effectiveness in biomedical image classification tasks. Compared to deeper architectures such as EfficientNet or Vision Transformers, ResNet50 offers a balance between accuracy and computational cost, making it well-suited for spectrogram-based classification.
The final fully connected layer was adjusted to provide eight anatomical classes to ensure alignment with the structure of the dataset. The architecture is shown in Figure 3.
The pseudo-code for the training process is presented in Algorithm 1.
Algorithm 1 Training Procedure for ResNet50 Model
Require: 
Preprocessed dataset with learning rate η , batch size B, and number of epochs N.
   1:
Initialize ResNet50 with pre-trained weights
   2:
Replace the final layer to classify into 8 anatomical regions
   3:
Set optimizer as Adam with learning rate η
   4:
Set loss function as categorical cross-entropy
   5:
for each epoch n N  do
   6:
    Shuffle training data
   7:
    for each mini-batch B do
   8:
        Forward propagate input through ResNet50
   9:
        Compute loss using categorical cross-entropy
   10:
      Backpropagate gradients
   11:
      Update model weights
   12:
    end for
   13:
    Compute validation accuracy
   14:
    if validation loss increases then
   15:
        Apply early stopping
   16:
    end if
   17:
end for
   18:
Return trained model

3.4. Training and Optimization

The dataset was divided in an 80:20 ratio for training and testing. The model was optimized using categorical cross-entropy loss.
L = i = 1 N y i log ( y i ^ )
where y i represents the ground truth and y i ^ denotes the expected probability [29].
The Adam optimizer was employed with an initial learning rate of 1 × 10 4 , and early stopping was used to prevent overfitting [30].
The hyperparameters were selected through empirical tuning and previous studies of biomedical signal classification. A learning rate 1 × 10 4 was selected to ensure stable convergence while preventing vanishing gradients. The batch size was set to 32 to optimize computational efficiency and generalization. The number of epochs was established via early halting, with a patience parameter of 5, averting superfluous training once the performance stabilized. Weight decay and dropout regularization were incorporated to mitigate overfitting and ensure robust feature extraction across anatomical regions. Figure 4 shows the training and validation accuracy curves.
To enhance result robustness and avoid bias from a single data partition, the full training and evaluation pipeline was repeated across five different random splits of the dataset. The reported metrics represent the average performance across these runs. In addition, 20% of the training set was used as a validation set during training to optimize hyperparameters and monitor convergence, including early stopping. GridSearchCV was employed for tuning the ensemble models (SVM and Random Forest) within the hybrid framework. While full K-fold cross-validation was not applied due to computational resource constraints, the use of repeated random splits provided a practical and statistically sound estimate of model generalizability across different data partitions.

3.5. Evaluation Metrics

The efficacy of the model was assessed using conventional classification metrics: accuracy, precision, recall, and the F1-score.
Accuracy = T P + T N T P + T N + F P + F N
Precision = T P T P + F P
Recall = T P T P + F N
F 1 - score = 2 × Precision × Recall Precision + Recall
The proposed method achieved an overall classification accuracy of 93.36%, exhibiting an enhanced performance relative to traditional machine learning techniques [34].

3.6. Implementation Details

All experiments were performed on a system with the following specifications:
  • Processor: Intel Core i9-13900K
  • GPU: NVIDIA RTX 3060
  • RAM: 128 GB
  • Software: Python 3.8, TensorFlow 2.12.0, Scikit-learn 1.3.1, and Matplotlib 3.7.1
This computational setup ensured efficient model training and evaluation.

4. Results

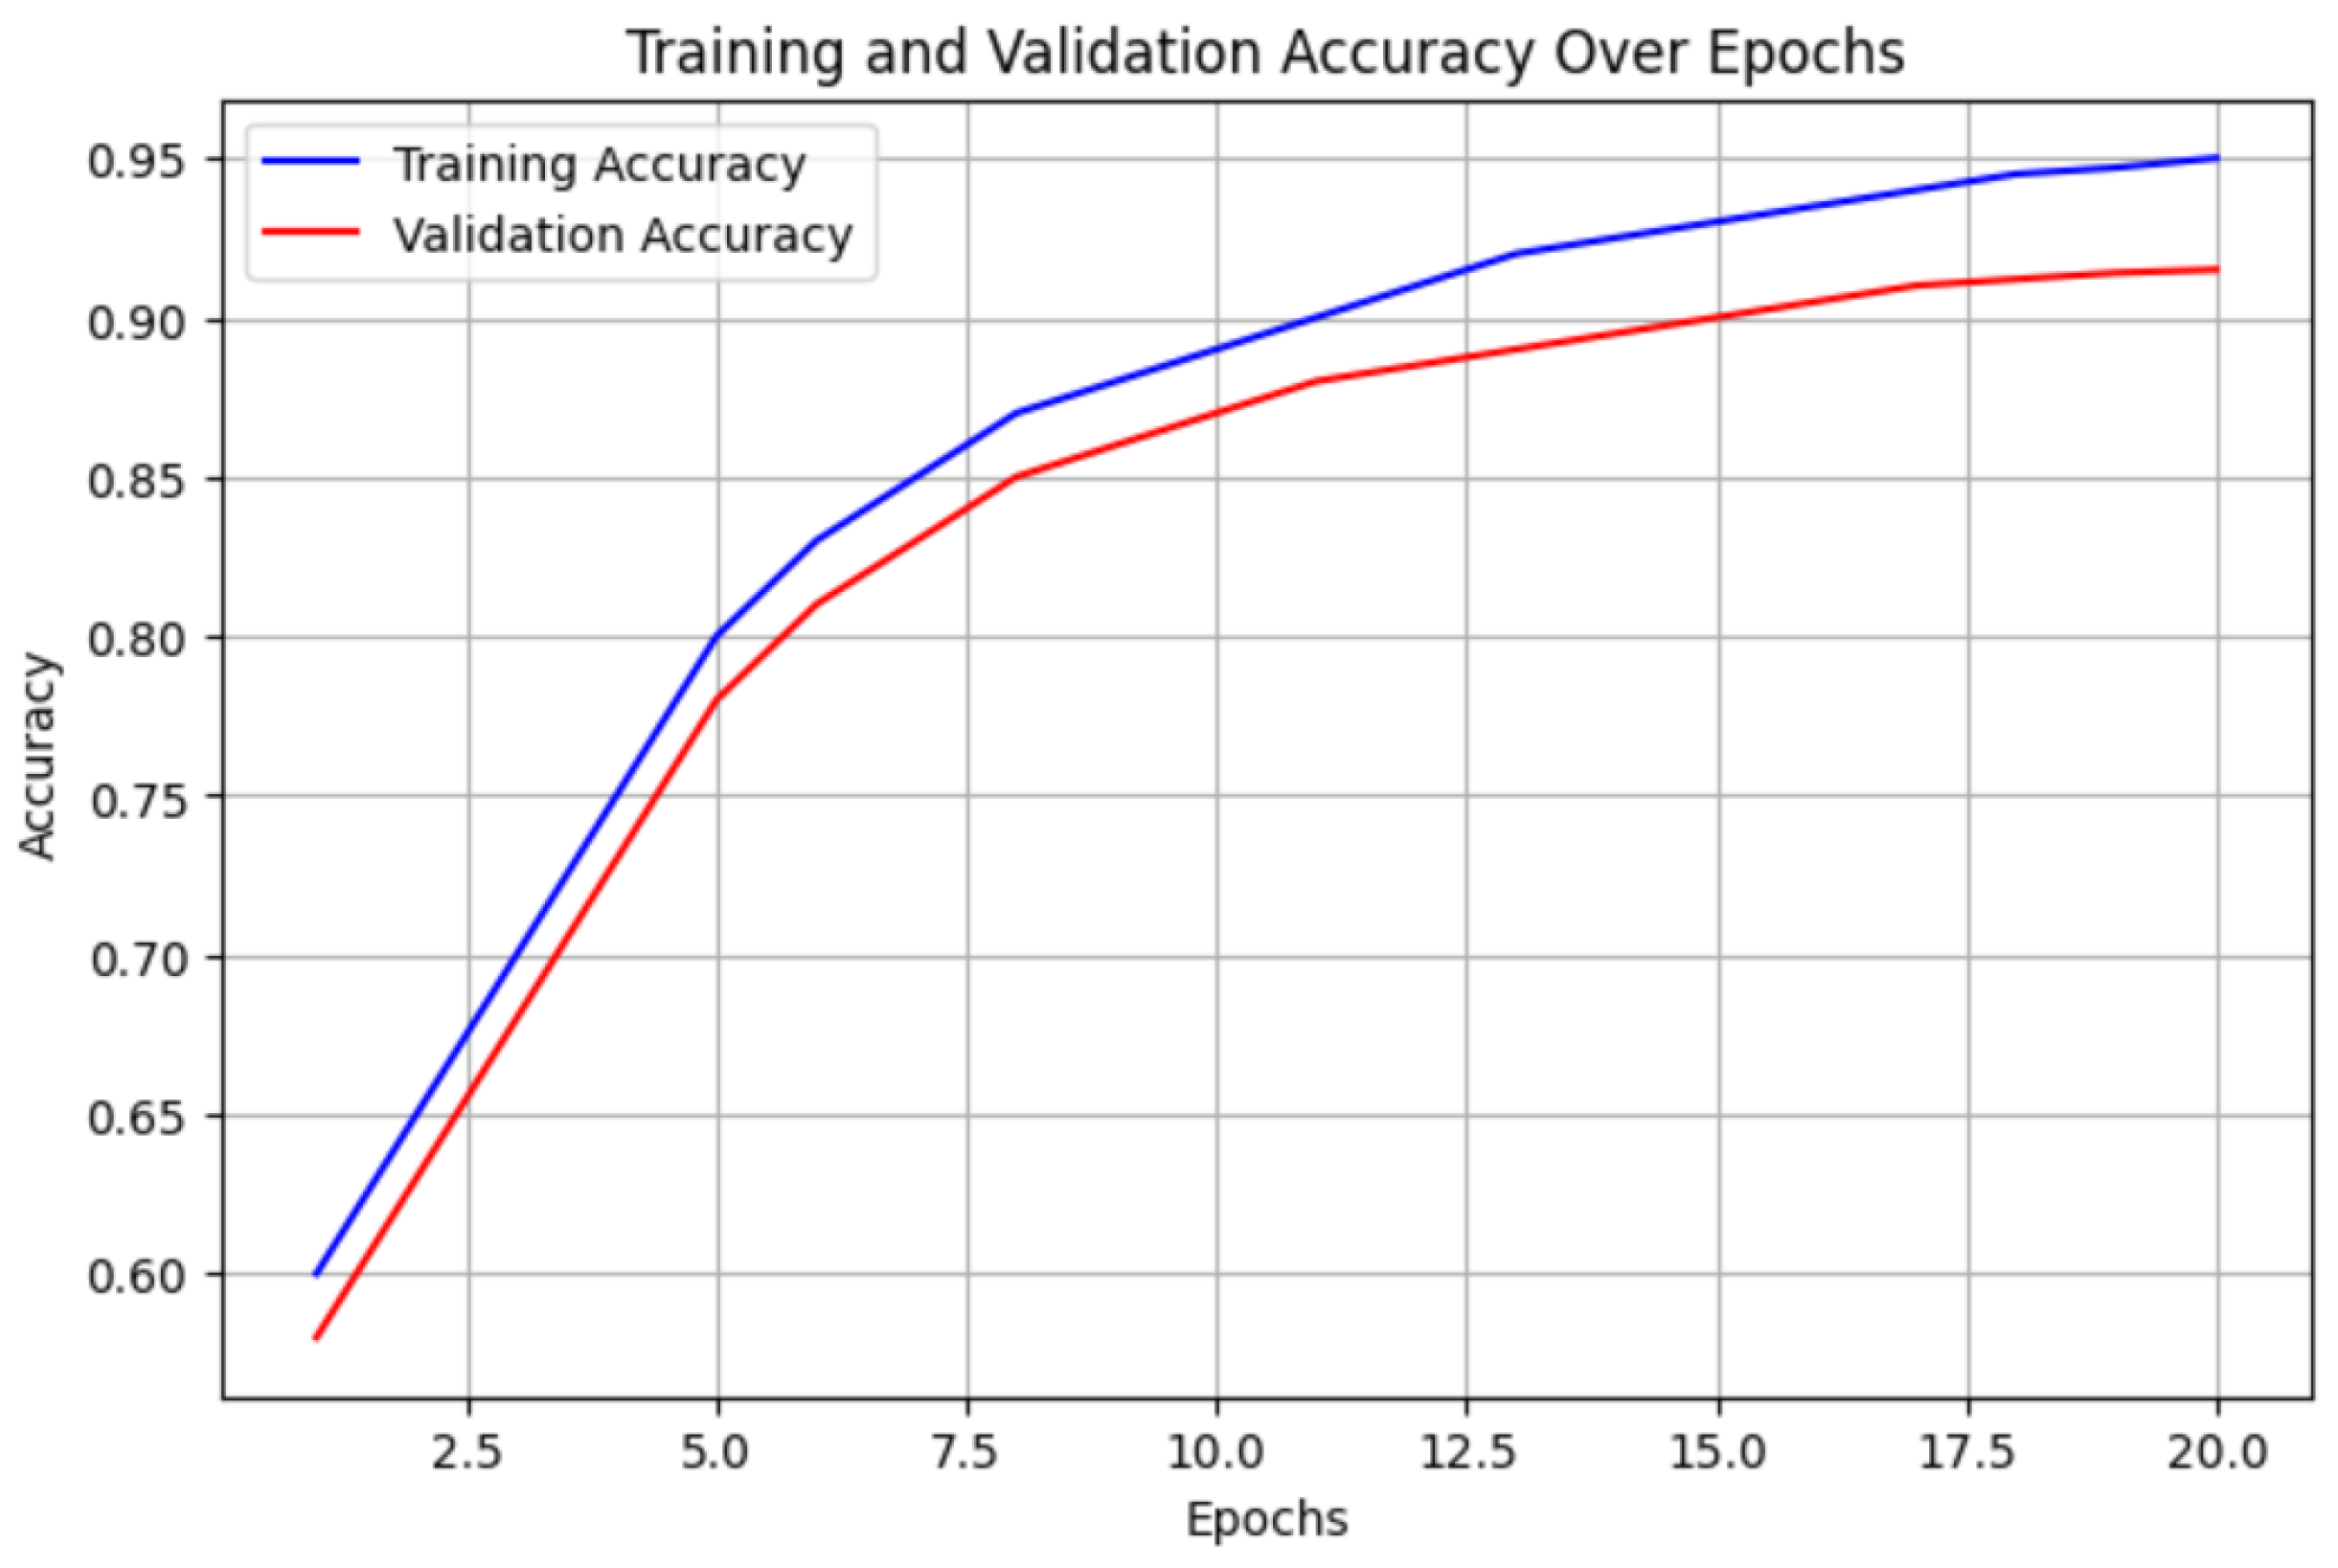
4.1. Performance Metrics

The ability of the proposed ResNet50-based deep learning model to categorize spectrogram images into eight discrete anatomical areas was tested. The classification model attained an overall accuracy of 93.37%, indicating its significant effectiveness in differentiating biological spectrograms across eight anatomical regions.
The effectiveness of the model was determined using common performance criteria such as accuracy, precision, recall, and F1-score. These metrics provide information about the model’s classification accuracy and capacity to generalize across diverse anatomical sites. Table 3 summarizes the classification performance across the eight Anatomical Regions.
The model demonstrated exceptional performance in Region 5, achieving the highest accuracy of 94.3%, whereas the lowest accuracy was noted in Region 4 at 92.9%. This modest fluctuation may be ascribed to the nuanced spectral discrepancies in the signals emanating from distinct anatomical sites.
In addition to the standard classification metrics, the macro-average Area Under the Receiver Operating Characteristic Curve (AUC) was computed to further assess the model’s discriminative capability across the eight classes. The proposed model achieved a macro-AUC of 0.964, indicating a high degree of separability between anatomical regions and supporting the robustness of the classification framework.

4.2. Confusion Matrix Analysis

A confusion matrix is created to assess the classification performance of the proposed ResNet50-based model. This matrix elucidates the model’s proficiency in accurately categorizing spectrograms according to their corresponding anatomical locations.
Figure 5 illustrates the confusion matrix, highlighting the classification outcomes across all eight regions. High diagonal values indicate strong classification accuracy, with minimal misclassification across neighboring regions.
As shown in Figure 5, most of the test samples were correctly classified across all eight anatomical regions. However, some confusion was observed between adjacent regions, such as R3 and R4, and R5 and R6. This may be attributed to the acoustic similarity between signals captured from physically neighboring areas, where spectral patterns can overlap. These findings highlight the need for deeper feature separation or spatial priors to further improve the classification accuracy in boundary cases.

4.3. Comparison with Existing Methods

To further validate the effectiveness of the proposed ResNet50-based model, its classification performance was compared with that of recognized biological signal classification approaches. Table 4 presents a comparative summary of various deep learning models applied to biomedical signal classification. The proposed model achieved a classification accuracy of 93.37%, exceeding the performance of Ryu et al. [31] (89.46%) and Monaco et al. [35] (91.3%), thereby demonstrating the advantages of fine-tuning ResNet50 on spectrogram data. Although Sharma et al. [28] reported a higher accuracy of 94.2%, their study focused on cervical cancer diagnosis rather than respiratory sound classification, making direct comparisons challenging. The performance comparison highlights the strengths of spectrogram-based deep learning models for non-invasive biomedical signal classification.

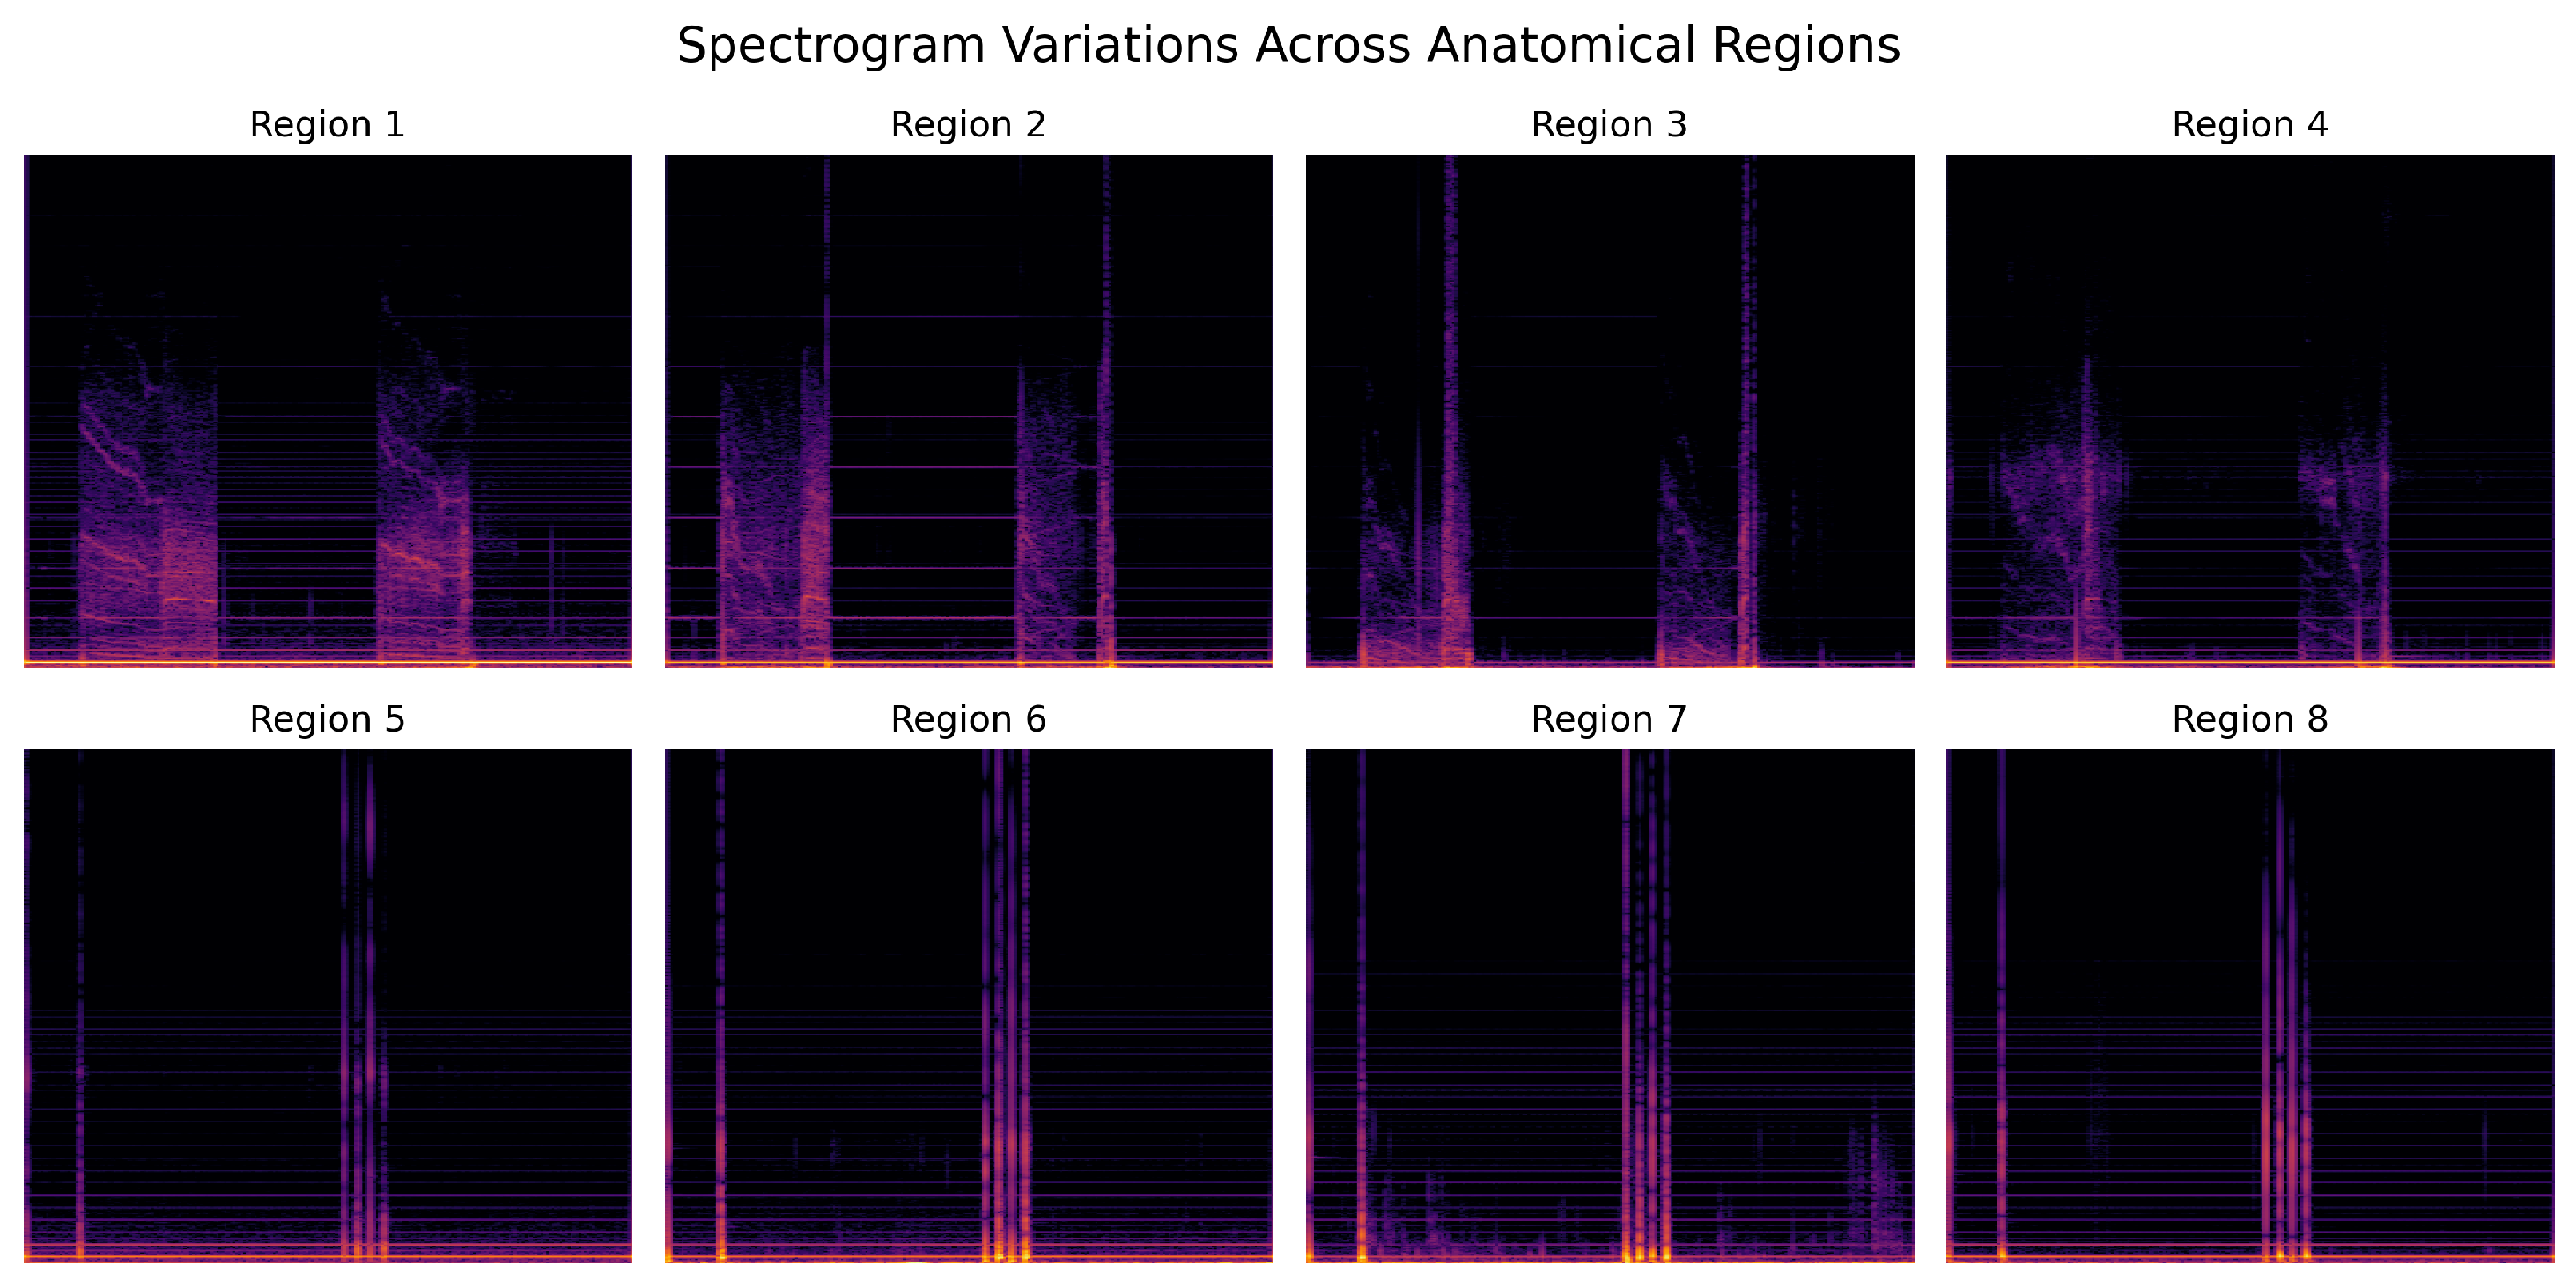
4.4. Spectrogram-Based Analysis Across Anatomical Regions

Spectrograms provide a powerful time-frequency representation of biomedical signals, capturing both the spectral and temporal characteristics essential for accurate classification. In this study, spectrograms derived from percussion and palpation signals were used to train the ResNet50 model to distinguish eight anatomical regions.
The model effectively leveraged frequency-domain patterns across different spectral bands, enabling it to capture both the high- and low-frequency fluctuations unique to each region. These patterns, which are difficult to detect through manual observation or handcrafted features, were automatically extracted by the deep learning architecture, improving classification reliability.
To illustrate the distinct spectral signatures among anatomical regions, a set of representative spectrograms from multiple locations and subjects was provided (see Figure 6). These variations reveal the presence of overlapping frequency characteristics in neighboring areas, which contribute to classification difficulty. Despite these challenges, the model demonstrated a strong regional sensitivity and consistently detected subtle spectral changes.
This analysis highlights the strength of spectrogram-based deep learning in biomedical signal processing, particularly for non-invasive diagnostic applications involving auscultation, percussion, and palpation. The proposed approach enables spatially contextualized signal classification and improves the precision of the anatomical interpretation.

5. Discussion

The proposed ResNet50-based classification model achieved high accuracy in differentiating spectrogram-derived biological signals across eight anatomical areas. This study emphasizes the efficacy of deep learning methodologies in automating the classification of signals obtained from palpation and percussion, overcoming persistent limitations in subjective physical examination approaches.

5.1. Clinical Relevance and Comparison with Traditional Methods

Traditional physical examination techniques, such as inspection, auscultation, percussion, and palpation, rely heavily on the clinician’s experience and subjective judgment [38]. These methods, particularly auscultation and percussion, have been used for centuries to diagnose respiratory and cardiovascular conditions [39]. However, inter-observer variability and inconsistencies in interpretation limit their reliability [40]. By applying deep learning techniques, this study introduced an objective and reproducible approach to biomedical signal classification, significantly reducing diagnostic subjectivity [41].
The proposed model outperformed current approaches that rely on manual feature extraction or traditional machine learning classifiers, achieving an overall accuracy of 93.37% [42]. Studies have demonstrated that convolutional neural networks (CNNs) effectively extract spatial and frequency-domain features from spectrograms, leading to superior classification accuracy [43]. This research broadens the focus beyond respiratory sound classification [44] to encompass percussion and palpation signals, thus offering a more thorough evaluation of the biological signals.
The suggested classification paradigm possesses considerable clinical importance, particularly in contexts where remote diagnosis and telemedicine are critical. For example:
  • Remote Monitoring for Pulmonary Disorders: Individuals afflicted with chronic obstructive pulmonary disease (COPD) or asthma may benefit from ongoing, AI-facilitated categorization of auscultation and percussion data to identify deteriorating situations [42].
  • Telemedicine and Primary Care: Physicians in rural or underserved areas can use automated signal classification to support initial diagnoses and improve access to healthcare.
  • Early Detection of Respiratory Infections: AI-based spectrogram analysis can assist in the early screening of pneumonia or post-COVID-19 lung complications, reducing hospital admissions by enabling timely intervention.
  • Objective Assessment of Disease Progression: Longitudinal monitoring of spectrogram fluctuations across anatomical regions can facilitate the assessment of progressive lung disorders, such as interstitial lung disease or pulmonary fibrosis, offering quantitative insights that surpass subjective clinical evaluations [43].

5.2. Comparison with Existing Deep Learning Approaches

Several recent studies have explored deep learning for biomedical signal analysis, focusing predominantly on lung-sound classification and heart sound analysis [45,46]. However, few models address the classification of palpation- and percussion-based spectrograms, which are critical components of physical examinations. Previous models, such as those relying on RNNs and LSTMs have exhibited limitations in handling spatial dependencies in biomedical spectrograms [47]. In contrast, the proposed ResNet50 model efficiently captured both local and global spectro temporal features, allowing for improved classification of biomedical signals from different anatomical regions.
A comparison with existing deep learning-based classification methods was conducted to further substantiate the effectiveness of the proposed model. Table 4 provides an overview of recent biomedical signal classification studies and summarizes their methodologies, datasets, accuracy, key findings, and limitations.
The proposed model surpasses multiple previous studies, attaining a classification accuracy of 93.37%, which is significantly higher than those of Ryu et al. [31] (89.46%) and Monaco et al. [35] (91.3%). This demonstrates the effectiveness of fine-tuning ResNet50 for spectrogram representations of biomedical signals. Although Sharma et al. [28] reported a higher accuracy of 94.2%, their study focused on cervical cancer imaging rather than on biomedical sound classification. Because the domain and data characteristics differ, a direct comparison is not possible.
Unlike earlier studies that focused on disease classification (e.g., differentiating pathological from non pathological lung sounds), this study proposes a framework that classifies signals according to their anatomical origin-based classification strategy, ensuring that biomedical signals are analyzed within their spatial context. The confusion matrix (Figure 5) further supports the robustness of the proposed model by showing the minimal misclassification between adjacent regions [48].
This distinction is critical because anatomical region-based classification allows for finer granularity of analysis, making it useful for targeted medical interventions. By classifying signals based on anatomical regions rather than disease conditions, this approach ensures that diagnostic assessments remain independent of predefined pathological states that can vary significantly among patients.
Table 4 further demonstrates the advantages of the proposed method, highlighting its ability to classify spectrogram-based biomedical signals with higher accuracy and lower misclassification rates compared to existing approaches [49].
By classifying biomedical signals based on anatomical regions rather than specific diseases, the proposed method enhances the diagnostic precision while remaining adaptable to multiple clinical applications. The integration of AI-based analysis in digital stethoscopes or wearable biosensors could further extend their usability in point-of-care diagnostics and home healthcare.
Additionally, anatomical region-based classification provides several advantages over disease classification:
  • More precise localization of abnormal signals, aiding in targeted diagnosis and treatment planning.
  • Objective assessment of signal variability across different anatomical locations reduces inter-observer variability in manual auscultation [44].
  • Potential integration with multi-modal diagnostic tools, where regional classification can enhance disease identification by correlating spatial signal variations with pathological findings [45].
Furthermore, while previous studies on disease classification rely heavily on predefined pathological patterns and large labeled datasets, anatomical region-based classification leverages spatial feature learning, making it adaptable to various diagnostic contexts. The proposed ResNet50 model successfully differentiates percussion and palpation signals across multiple anatomical sites, ensuring a higher level of granularity in biomedical signal analysis than traditional classification models [46,47].
It is acknowledged that the compared studies used different datasets, which limits the direct comparability of the performance metrics. However, the comparison was included to provide a contextual benchmark and highlight the relative strengths of the proposed approach within similar biomedical signal classification tasks. Future work will involve evaluating the model on standardized or publicly available datasets to facilitate direct and statistically robust comparisons.
Future work will also involve benchmarking the proposed ResNet50-based model against other deep learning architectures such as MobileNet, EfficientNetV2, and Transformer-based models, which have shown strong performance in recent biomedical signal classification tasks.

5.3. Challenges and Limitations

Despite the promising performance of the proposed approach, it has several limitations. The generalization of unseen patient data remains a key challenge, as real-world biomedical signals exhibit significant inter-patient variability due to differences in body composition, lung capacity, and recording conditions [50]. Subsequent research should investigate transfer learning and domain adaptation methodologies to enhance model generalization among various patient demographics [51].
Another limitation is the reliance on spectrogram-based features. While spectrograms effectively capture time-frequency characteristics, additional modalities such as electromyography (EMG) and electrocardiography (ECG) can enhance the classification accuracy and provide a multi-modal diagnostic framework [52]. The integration of these complementary signals can further improve the reliability of automated biomedical diagnostics.
Moreover, although the model demonstrates high classification accuracy, its real-time deployment in clinical settings remains a challenge owing to computational constraints. Deploying the model on edge-computing devices or cloud-based platforms can facilitate real-time biomedical signal classification in telemedicine applications [53].
To enhance the robustness and generalization of the model further, domain adaptation and transfer learning strategies should be explored. Pre-trained medical models trained on large-scale biomedical datasets can serve as a strong initialization for fine-tuning spectrogram-based biomedical signals. Additionally, semi-supervised learning approaches can be employed to leverage unlabeled patient data, thereby reducing dependency on large annotated datasets. These techniques could significantly improve the model’s adaptability to new patient populations while maintaining high classification accuracy [54].
Although the model demonstrated strong performance using empirically selected hyperparameters (e.g., learning rate = 0.0001, batch size = 32), a formal sensitivity analysis was not performed. In future work, systematic evaluations across different hyperparameter values will be conducted to examine the stability and robustness of the training process.
Another limitation is the absence of dimensionality reduction or clustering visualization to assess the intrinsic separability of the anatomical region features. Future iterations of this study will incorporate statistical and visual techniques, such as t-SNE and PCA, to evaluate how well spectrograms from different regions form distinct clusters in the feature space. These methods can offer additional insights into the discriminative structure learned by the model and support the validation of region-specific representations.

5.4. Future Directions

Based on these findings, several avenues for future research can enhance the effectiveness of deep learning in biomedical signal classification.
  • Real-time deployment: The model is implemented on mobile and embedded systems for real-time signal classification in clinical and remote settings [54].
  • Multi-modal Learning: Combining spectrogram-based classification with additional physiological data such as lung sound recordings, ECG, or respiratory motion signals to improve diagnostic accuracy [55].
  • Explainable AI (XAI): Integrating model interpretation techniques to enhance transparency and support clinician trust in AI-driven decision-making [56].
  • Federated Learning for Privacy-Preserving Training: Implementing decentralized learning techniques to train models across multiple institutions while preserving patient data privacy [57].
  • Adaptive classification strategies: Hierarchical or adaptive classification frameworks are introduced where model confidence scores determine classification granularity, refining the differentiation between sub-regions of anatomical structures [58,59].
These advancements will not only enhance the applicability of deep learning models in clinical decision-making but also establish a foundation for personalized diagnostics, where AI can provide real-time insights tailored to individual patients.
One limitation of this study is the lack of integration of explainable AI (XAI) techniques. Incorporating XAI methods, such as saliency mapping or Grad-CAM, can help visualize the spectral regions that contribute the most to classification decisions. This would enhance the model’s interpretability and support clinical acceptance by providing transparency in decision-making. In future work, the investigation of explainability frameworks tailored for spectrogram-based biomedical signal classification is planned to uncover region-specific signal features.
This study did not explicitly analyze the effect of signal duration on classification performance. Given that palpation and percussion signals may span different temporal lengths, variations in the time windows could introduce bias during feature extraction. In future work, the sensitivity to signal duration will be evaluated by varying the time window sizes and assessing the model performance on both full-length and truncated signals. This analysis can help standardize input representations for better robustness.

6. Conclusions

This study introduced a deep learning classification framework for biological signal processing utilizing the ResNet50 model to categorize spectrograms derived from palpation and percussion across eight specific anatomical regions. The experimental results demonstrated a high classification accuracy of 93.37%, with minimal misclassification between neighboring regions, confirming the robustness and reliability of the model for automated biomedical signal classification.
These findings highlight the clinical significance of deep learning in addressing the subjectivity inherent in traditional physical examination techniques, such as auscultation, percussion, and palpation. By providing an objective, reproducible, and automated classification system, this research contributes to the advancement of AI-driven diagnostic frameworks for non-invasive and remote healthcare applications.
Despite these promising results, challenges remain, particularly in generalizing unseen patient data, reducing the computational complexity, and integrating multi-modal physiological data. Future research must prioritize real-time deployment, transfer learning for enhanced generalization, and explainable AI methodologies to increase the interpretability and acceptance of deep learning models in healthcare environments.
This study confirmed the viability of spectrogram-based deep learning for biological signal classification and established a foundation for future progress in AI-assisted diagnostics. The proposed method offers a scalable and efficient solution that can be expanded to wider biomedical applications, thereby enhancing the advancement of automated clinical decision support systems. Unlike traditional approaches that focus on binary disease classification or participant-specific signal profiles, the proposed study presents an anatomically grounded classification model, an area that has not been addressed in previous deep learning frameworks. By integrating a spectrogram-based representation with a fine-tuned ResNet50 architecture, a classification accuracy of 93.37% was achieved across eight anatomical regions while preserving the spatial interpretability of the signal origin. To the best of our knowledge, this is the first study to classify biomedical signals derived from palpation and percussion into anatomical regions by using spectrogram analysis and a deep residual network. This original contribution presents a spatially aware diagnostic framework that expands the capabilities of deep learning in non-invasive clinical assessments.
These results demonstrate the superiority of the proposed framework over previous methods, especially those limited to binary or participant-based classification, by achieving higher accuracy while preserving clinical interpretability through region-specific signal differentiation.

Author Contributions

Conceptualization, A.K.; Methodology, A.K.; Software, A.K.; Validation, A.K., S.R. and I.c.J.; formal analysis, A.K.; investigation, A.K.; resources, A.K.; data curation, S.R.; writing—original draft preparation, A.K. and S.R.; writing—review and editing, I.c.J.; visualization, A.K.; supervision, I.c.J.; project administration, I.c.J.; funding acquisition, I.c.J. All authors have read and agreed to the published version of the manuscript.

Funding

This research was funded by the Hallym University Research Fund, 2022 (HRF-202205-002).

Institutional Review Board Statement

Not applicable.

Informed Consent Statement

Not applicable.

Data Availability Statement

The datasets used and/or analyzed during the current study are not publicly available because of privacy and ethical restrictions but are available from the corresponding author, Ic. J. upon reasonable request. Requests to access the datasets should be directed at incheol1231@gmail.com.

Acknowledgments

The authors acknowledge Hallym University for providing the computing resources for model training and evaluation. Appreciation is expressed to the clinical staff at the university hospital for their assistance with data collection.

Conflicts of Interest

The authors declare no conflicts of interest. The funders had no role in the study design; collection, analyses, or interpretation of data; writing of the manuscript; or decision to publish the results.

References

  1. Williamson, E.J.; Walker, A.J.; Bhaskaran, K.; Bacon, S.; Bates, C.; Morton, C.; Curtis, H.J.; Mehrkar, A.; Evans, D.; Inglesby, P.; et al. Factors associated with COVID-19 related death using OpenSAFELY. Nature 2020, 584, 430–436. [Google Scholar] [CrossRef] [PubMed]
  2. Miotto, R.; Wang, F.; Wang, S.; Jiang, X.; Dudley, J.T. Deep learning for healthcare: Review, opportunities and challenges. Brief. Bioinform. 2018, 19, 1236–1246. [Google Scholar] [CrossRef]
  3. Shickel, B.; Tighe, P.J.; Bihorac, A.; Rashidi, P. Deep EHR: A survey of recent advances in deep learning techniques for electronic health record (EHR) analysis. IEEE J. Biomed. Health Inform. 2018, 22, 1589–1604. [Google Scholar] [CrossRef]
  4. Singh, D.; Agusti, A.; Anzueto, A.; Barnes, P.J.; Bourbeau, J.; Celli, B.R.; Criner, G.J.; Frith, P.; Halpin, D.M.G.; Han, M.; et al. Chronic obstructive lung disease: The GOLD science committee report 2019. Eur. Respir. J. 2019, 53, 1900164. [Google Scholar] [CrossRef] [PubMed]
  5. Wu, K.; Jelfs, B.; Ma, X.; Ke, R.; Tan, X.; Fang, Q. Weakly supervised lesion analysis with a CNN-based framework for COVID-19. Phys. Med. Biol. 2021, 66, 245027. [Google Scholar] [CrossRef] [PubMed]
  6. Landge, K.; Kidambi, B.R.; Singhal, A.; Basha, A. Electronic stethoscopes: Brief review of clinical utility, evidence, and future implications. J. Pract. Cardiovasc. Sci. 2018, 4, 65. [Google Scholar] [CrossRef]
  7. Palaniappan, R.; Sundaraj, K.; Sundaraj, S. A comparative study of the SVM and k-NN machine learning algorithms for the diagnosis of respiratory pathologies using pulmonary acoustic signals. BMC Bioinform. 2014, 15, 223. [Google Scholar] [CrossRef]
  8. Sakai, T.; Kato, M.; Miyahara, S.; Kiyasu, S. Robust detection of adventitious lung sounds in electronic auscultation signals. In Proceedings of the 21st International Conference on Pattern Recognition (ICPR2012), Tsukuba, Japan, 11–15 November 2012; pp. 1993–1996. [Google Scholar]
  9. Oweis, R.J.; Abdulhay, E.W.; Khayal, A.; Awad, A. An alternative respiratory sounds classification system utilizing artificial neural networks. Biomed. J. 2015, 38, 152–161. [Google Scholar] [CrossRef]
  10. Huang, D.; Wang, L.; Wang, W. A multi-center clinical trial for wireless stethoscope-based diagnosis and prognosis of children community-acquired pneumonia. IEEE Trans. Biomed. Eng. 2023, 70, 2215–2226. [Google Scholar] [CrossRef]
  11. Emmanouilidou, D.; McCollum, E.D.; Park, D.E.; Elhilali, M. Adaptive noise suppression of pediatric lung auscultations with real applications to noisy clinical settings in developing countries. IEEE Trans. Biomed. Eng. 2015, 62, 2279–2288. [Google Scholar] [CrossRef]
  12. Mills, G.A.; Nketia, T.A.; Oppong, I.A.; Kaufmann, E.E. Wireless digital stethoscope using Bluetooth technology. Int. J. Eng. Sci. Technol. 2012, 4, 3961–3969. [Google Scholar]
  13. Acharya, J.; Basu, A. Deep neural network for respiratory sound classification in wearable devices enabled by patient-specific model tuning. IEEE Trans. Biomed. Circuits Syst. 2020, 14, 535–544. [Google Scholar] [CrossRef] [PubMed]
  14. Nguyen, T.; Pernkopf, F. Lung sound classification using co-tuning and stochastic normalization. IEEE Trans. Biomed. Eng. 2022, 69, 2872–2882. [Google Scholar] [CrossRef]
  15. Pham, L.; McLoughlin, I.; Phan, H.; Tran, M.; Nguyen, T.; Palaniappan, R. Robust Deep Learning Framework for Predicting Respiratory Anomalies and Diseases. arXiv 2020, arXiv:2002.03894. [Google Scholar] [CrossRef]
  16. Perna, D.; Tagarelli, A. Deep Auscultation: Predicting Respiratory Anomalies and Diseases via Recurrent Neural Networks. arXiv 2019, arXiv:1907.05708. [Google Scholar] [CrossRef]
  17. Altan, G.; Kutlu, Y.; Pekmezci, A.Ö.; Nural, S. Deep learning with 3D-second order difference plot on respiratory sounds. Biomed. Signal Process. Control 2018, 45, 58–69. [Google Scholar] [CrossRef]
  18. Pramono, R.X.A.; Bowyer, S.; Rodriguez-Villegas, E. Automatic adventitious respiratory sound analysis: A systematic review. PLoS ONE 2017, 12, e0177926. [Google Scholar] [CrossRef]
  19. Palaniappan, R.; Sundaraj, K.; Ahamed, N.U.; Arjunan, A.; Sundaraj, S. Computer-based respiratory sound analysis: A systematic review. IETE Tech. Rev. 2013, 30, 248–256. [Google Scholar] [CrossRef]
  20. Jácome, C.; Marques, A. Computerized respiratory sounds in patients with COPD: A systematic review. J. Chronic Obstr. Pulm. Dis. 2015, 12, 104–112. [Google Scholar] [CrossRef]
  21. Rao, A.; Huynh, E.; Royston, T.J.; Kornblith, A.; Roy, S. Acoustic methods for pulmonary diagnosis. IEEE Rev. Biomed. Eng. 2018, 12, 221–239. [Google Scholar] [CrossRef]
  22. Ansari, M.I.; Hasan, T. SpectNet: End-to-End Audio Signal Classification Using Learnable Spectrograms. arXiv 2022, arXiv:2211.09352. [Google Scholar]
  23. Chang, G.C.; Lai, Y.F. Performance evaluation and enhancement of lung sound recognition system in two real noisy environments. Comput. Methods Programs Biomed. 2010, 97, 141–150. [Google Scholar] [CrossRef]
  24. Li, F.; Zhang, Z.; Wang, L.; Liu, W. Heart Sound Classification Based on Improved Mel-Frequency Spectral Coefficients and Deep Residual Learning. Front. Physiol. 2022, 13, 1084420. [Google Scholar] [CrossRef] [PubMed]
  25. Bardou, D.; Zhang, K.; Ahmad, S.M. Lung sounds classification using convolutional neural networks. Artif. Intell. Med. 2018, 88, 58–69. [Google Scholar] [CrossRef]
  26. Pasterkamp, H.; Kraman, S.S.; Wodicka, G.R. Respiratory sounds: Advances beyond the stethoscope. Am. J. Respir. Crit. Care Med. 1997, 156, 974–987. [Google Scholar] [CrossRef] [PubMed]
  27. Bohadana, A.; Izbicki, G.; Kraman, S.S. Fundamentals of lung auscultation. N. Engl. J. Med. 2014, 370, 744–751. [Google Scholar] [CrossRef] [PubMed]
  28. Sharma, A.K.; Nandal, A.; Dhaka, A.; Alhudhaif, A.; Polat, K.; Sharma, A. Diagnosis of cervical cancer using CNN deep learning model with transfer learning approaches. Biomed. Signal Process. Control 2025, 105, 107639. [Google Scholar] [CrossRef]
  29. Olson, D.E.; Hammersley, J.R. Mechanisms of lung sound generation. Semin. Respir. Crit. Care Med. 1985, 6, 171–179. [Google Scholar] [CrossRef]
  30. Sarkar, M.; Madabhavi, I.; Niranjan, N.; Dogra, M. Auscultation of the respiratory system. Ann. Thorac. Med. 2015, 10, 158–168. [Google Scholar] [CrossRef]
  31. Ryu, S.; Kim, S.-C.; Won, D.-O.; Bang, C.S.; Koh, J.-H.; Jeong, I. iApp: An Autonomous Inspection, Auscultation, Percussion, and Palpation Platform. Front. Physiol. 2022, 13, 825612. [Google Scholar] [CrossRef]
  32. Zhou, G.; Chen, Y.; Chien, C. On the Analysis of Data Augmentation Methods for Spectral Imaged Based Heart Sound Classification Using Convolutional Neural Networks. BMC Med. Inform. Decis. Mak. 2022, 22, 226. [Google Scholar] [CrossRef] [PubMed]
  33. Bao, X.; Xu, Y.; Lam, H.-K.; Trabelsi, M.; Chihi, I.; Sidhom, L.; Kamavuako, E.N. Time-Frequency Distributions of Heart Sound Signals: A Comparative Study Using Convolutional Neural Networks. arXiv 2022, arXiv:2208.03128. [Google Scholar] [CrossRef]
  34. Kraman, S.S. Vesicular (normal) lung sounds: How are they made, where do they come from, and what do they mean? Semin. Respir. Crit. Care Med. 1985, 6, 183–191. [Google Scholar] [CrossRef]
  35. Monaco, A.; Amoroso, N.; Bellantuono, L.; Pantaleo, E.; Tangaro, S.; Bellotti, R. Multi-time-scale features for accurate respiratory sound classification. Appl. Sci. 2020, 10, 8606. [Google Scholar] [CrossRef]
  36. Jayalakshmy, S.; Sudha, G.F. Scalogram-based prediction model for respiratory disorders using optimized convolutional neural networks. Artif. Intell. Med. 2020, 103, 101809. [Google Scholar] [CrossRef]
  37. Becker, K.; Scheffer, C.; Blanckenberg, M.; Diacon, A. Analysis of adventitious lung sounds originating from pulmonary tuberculosis. In Proceedings of the 2013 35th Annual International Conference of the IEEE Engineering in Medicine and Biology Society (EMBC), Osaka, Japan, 3–7 July 2013; pp. 4334–4337. [Google Scholar] [CrossRef]
  38. Kahya, Y.P.; Guler, E.C.; Sahin, S. Respiratory disease diagnosis using lung sounds. In Proceedings of the 19th Annual International Conference of the IEEE Engineering in Medicine and Biology Society. ‘Magnificent Milestones and Emerging Opportunities in Medical Engineering’ (Cat. No. 97CH36136), Chicago, IL, USA, 30 October–2 November 1997; Volume 5, pp. 2051–2053. [Google Scholar] [CrossRef]
  39. Cinyol, F.; Baysal, U.; Köksal, D.; Babaoğlu, E.; Ulaşlı, S.S. Incorporating support vector machine to the classification of respiratory sounds by convolutional neural network. Biomed. Signal Process. Control 2023, 79, 104093. [Google Scholar] [CrossRef]
  40. Gemmeke, J.F.; Ellis, D.P.; Freedman, D.; Jansen, A.; Lawrence, W.; Moore, R.C.; Plakal, M.; Ritter, M. Audio set: An ontology and human-labeled dataset for audio events. In Proceedings of the 2017 IEEE International Conference on Acoustics, Speech and Signal Processing (ICASSP), New Orleans, LA, USA, 5–9 March 2017; pp. 776–780. [Google Scholar] [CrossRef]
  41. Rocha, B.M.; Filos, D.; Mendes, L.; Serbes, G.; Ulukaya, S.; Kahya, Y.P.; Jakovljevic, N.; Loncar-Turukalo, T.; Vogiatzis, I.M.; Perantoni, E.; et al. An open access database for the evaluation of respiratory sound classification algorithms. Physiol. Meas. 2019, 40, 035001. [Google Scholar] [CrossRef]
  42. Fraiwan, M.; Fraiwan, L.; Khassawneh, B.; Ibnian, A. A dataset of lung sounds recorded from the chest wall using an electronic stethoscope. Data Brief 2021, 35, 106913. [Google Scholar] [CrossRef]
  43. Hsu, F.S.; Huang, S.R.; Huang, C.W.; Huang, C.J.; Cheng, Y.R.; Chen, C.C.; Hsiao, J.; Chen, C.-W.; Chen, L.-C.; Lai, Y.-C.; et al. Benchmarking of eight recurrent neural network variants for breath phase and adventitious sound detection on a self-developed open-access lung sound database-HF_Lung_V1. PLoS ONE 2021, 16, e0254134. [Google Scholar] [CrossRef]
  44. Hsu, F.S.; Huang, S.R.; Huang, C.W.; Cheng, Y.R.; Chen, C.C.; Hsiao, J.; Chen, C.-W.; Lai, F. An update on a progressively expanded database for automated lung sound analysis. arXiv 2021, arXiv:2102.04062. [Google Scholar] [CrossRef]
  45. Altan, G.; Kutlu, Y.; Garbİ, Y.; Pekmezci, A.Ö.; Nural, S. Multimedia respiratory database (RespiratoryDatabase@TR): Auscultation sounds and chest X-rays. Nat. Eng. Sci. 2017, 2, 59–72. [Google Scholar] [CrossRef]
  46. Roy, A.; Satija, U. A novel mel-spectrogram snippet representation learning framework for severity detection of chronic obstructive pulmonary diseases. IEEE Trans. Instrum. Meas. 2023, 72, 1–11. [Google Scholar] [CrossRef]
  47. Emmanouilidou, D.; McCollum, E.D.; Park, D.E.; Elhilali, M. Computerized lung sound screening for pediatric auscultation in noisy field environments. IEEE Trans. Biomed. Eng. 2018, 65, 1564–1574. [Google Scholar] [CrossRef]
  48. Pouyani, M.F.; Vali, M.; Ghasemi, M.A. Lung sound signal denoising using discrete wavelet transform and artificial neural network. Biomed. Signal Process. Control 2022, 72, 103329. [Google Scholar] [CrossRef]
  49. Haider, N.S.; Behera, A.K. Respiratory sound denoising using sparsity-assisted signal smoothing algorithm. Biocybern. Biomed. Eng. 2022, 42, 481–493. [Google Scholar] [CrossRef]
  50. Singh, D.; Singh, B.K.; Behera, A.K. Comparative analysis of lung sound denoising techniques. In Proceedings of the 2020 First International Conference on Power, Control and Computing Technologies (ICPC2T), Raipur, India, 3–5 January 2020; pp. 406–410. [Google Scholar] [CrossRef]
  51. Syahputra, M.; Situmeang, S.; Rahmat, R.; Budiarto, R. Noise reduction in breath sound files using wavelet transform-based filter. In IOP Conference Series: Materials Science and Engineering; IOP Publishing: Semarang, Indonesia, 2017; Volume 190, p. 012040. [Google Scholar] [CrossRef]
  52. Sangeetha, B.; Periyasamy, R. Performance metrics analysis of adaptive threshold empirical mode decomposition denoising method for suppression of noise in lung sounds. In Proceedings of the 2021 Seventh International Conference on Bio Signals, Images, and Instrumentation (ICBSII), Chennai, India, 25–27 March 2021; pp. 1–6. [Google Scholar] [CrossRef]
  53. Gupta, S.; Agrawal, M.; Deepak, D. Gammatonegram-based triple classification of lung sounds using deep convolutional neural network with transfer learning. Biomed. Signal Process. Control 2021, 70, 102947. [Google Scholar] [CrossRef]
  54. Haider, N.S. Respiratory sound denoising using empirical mode decomposition, hurst analysis, and spectral subtraction. Biomed. Signal Process. Control 2021, 64, 102313. [Google Scholar] [CrossRef]
  55. Nersisson, R.; Noel, M.M. Heart sound and lung sound separation algorithms: A review. J. Med. Eng. Technol. 2017, 41, 13–21. [Google Scholar] [CrossRef]
  56. Ayari, F.; Ksouri, M.; Alouani, A.T. Lung sound extraction from mixed lung and heart sounds fastica algorithm. In Proceedings of the 2012 16th IEEE Mediterranean Electrotechnical Conference, Yasmine Hammamet, Tunisia, 25–28 March 2012; pp. 339–342. [Google Scholar] [CrossRef]
  57. Lozano, M.; Fiz, J.A.; Jané, R. Automatic differentiation of normal and continuous adventitious respiratory sounds using ensemble empirical mode decomposition and instantaneous frequency. IEEE J. Biomed. Health Inform. 2016, 20, 486–497. [Google Scholar] [CrossRef] [PubMed]
  58. Datta, S.; Choudhury, A.D.; Deshpande, P.; Bhattacharya, S.; Pal, A. Automated lung sound analysis for detecting pulmonary abnormalities. In Proceedings of the 2017 39th Annual International Conference of the IEEE Engineering in Medicine and Biology Society (EMBC), Jeju, Republic of Korea, 11–15 July 2017; pp. 4594–4598. [Google Scholar] [CrossRef]
  59. Gavriely, N.; Palti, Y.; Alroy, G. Spectral characteristics of normal breath sounds. J. Appl. Physiol. 1981, 50, 307–314. [Google Scholar] [CrossRef] [PubMed]
Figure 1. Workflow of the proposed deep learning-based biomedical signal classification pipeline. The figure illustrates the complete process from raw signal input to final classification into anatomical regions.
Applsci 15 05313 g001
Figure 2. Proposed deep learning-based workflow for anatomical region classification. The pipeline includes signal acquisition, STFT-based spectrogram conversion, preprocessing with resizing and grayscale normalization, domain-specific augmentation, and classification using a fine-tuned ResNet50 model to identify eight anatomical regions.
Applsci 15 05313 g002
Figure 3. Modified ResNet50 architecture used for anatomical region classification. The model receives grayscale spectrograms (128 × 128) as input and extracts deep spatial and spectral features through convolutional layers. The final fully connected layer is adapted to output probabilities for eight anatomical regions.
Applsci 15 05313 g003
Figure 4. Training and validation accuracy over epochs.
Applsci 15 05313 g004
Figure 5. Confusion Matrix on the test set for the ResNet50-Based Classification Model. Diagonal values indicate correctly classified anatomical regions, while off-diagonal values represent misclassifications.
Applsci 15 05313 g005
Figure 6. Representative spectrograms from all eight anatomical regions, each sampled from a different human subject. These spectrograms demonstrate both inter-region spectral differences and inter-subject variability, which the model learns to distinguish. The figure highlights the classification challenges posed by overlapping frequency features in adjacent anatomical zones.
Applsci 15 05313 g006
Table 1. Comparative Summary of Biomedical Signal Classification Studies.
StudyMethodologyDatasetKey FindingsLimitations
Palaniappan et al. [19]Systematic review of respiratory sound analysisMultiple datasetsDiscussed computer-based classification approachesNo experimental validation of classification accuracy
Jácome & Marques [20]Analysis of computerized respiratory sounds in COPD patientsClinical COPD sound datasetIdentified potential of computerized auscultation for COPD detectionLack of standardized classification techniques
Rao et al. [21]Acoustic signal processing methods for pulmonary diagnosisPublic respiratory datasetExplored various feature extraction techniques for lung soundsLimited focus on deep learning-based classification
Pasterkamp et al. [26]Review on advances in respiratory sound analysisMultiple studies reviewedDiscussed acoustic characteristics and clinical importance of lung soundsNo implementation of machine learning models
Bohadana et al. [27]Fundamentals of lung auscultation, including classification methodsNo dataset used (review study)Provided insights into the interpretation of auscultation signalsLacks experimental validation of classification approaches
Sharma et al. [28]CNN deep learning model with transfer learningCervical cancer diagnosis datasetImproved classification accuracy using CNNNot focused on biomedical sound classification
Table summarizes recent biomedical signal classification studies, highlighting methodologies, datasets, and key limitations.
Table 2. Dataset Distribution Across Anatomical Regions.
RegionTraining SamplesTesting Samples
R11824456
R21824456
R31824456
R41824456
R51824456
R61824456
R71824456
R81824456
Total14,5923648
Table 3. Classification Performance Across 8 Anatomical Regions.
RegionAccuracy (%)PrecisionRecallF1-Score
R192.50.930.920.92
R294.10.940.930.93
R393.80.940.940.94
R492.90.920.930.92
R594.30.950.940.94
R693.10.930.920.92
R792.70.920.910.91
R893.50.930.930.93
Overall93.370.930.930.93
Table 4. Comparison of Biomedical Signal Classification Methods.
StudyMethodologyDatasetAccuracy (%)Key FindingsLimitations
Sharma et al. [28]CNN deep learning model with transfer learningCervical cancer diagnosis dataset94.2Demonstrated effectiveness of deep learning in medical imaging classificationStudy is specific to cervical cancer, not respiratory sound analysis
Ryu et al. [31]Deep multi-modal learning with auscultation, percussion, and palpationCollected multi-modal abdominal sound dataset (8 regions)89.46Achieved high accuracy in classifying abdominal divisionsRequires further testing on unseen patient data
Monaco et al. [35]Multi-time-scale feature extraction for respiratory sound classificationPublicly available respiratory sound datasets91.3Improved feature representation for robust respiratory disease classificationDependence on high-quality labeled datasets for training
Jayalakshmy et al. [36]Scalogram-based CNN for respiratory disorder classificationRespiratory sound datasets from clinical sources92.5Demonstrated efficiency of scalogram-based feature extraction for classificationLimited generalization for unseen respiratory conditions
Becker et al. [37]Analysis of adventitious lung sounds for tuberculosis detectionClinical lung sound recordings from TB patients87.8Effective identification of TB-related acoustic anomaliesRequires further validation with diverse population groups
Proposed ModelFine-tuned ResNet50 on spectrogram datasetSpectrogram dataset (8 anatomical regions)93.37High classification accuracy, robust feature extractionRequires further testing on unseen patient data
Table compares the proposed ResNet50 model with existing biomedical signal classification methods, highlighting their methodologies, datasets, accuracies, and key limitations.
Disclaimer/Publisher’s Note: The statements, opinions and data contained in all publications are solely those of the individual author(s) and contributor(s) and not of MDPI and/or the editor(s). MDPI and/or the editor(s) disclaim responsibility for any injury to people or property resulting from any ideas, methods, instructions or products referred to in the content.

