Abstract
The inherent mineralogical alignment in stratified rock formations engenders pronounced mechanical anisotropy, presenting persistent challenges across geological, geotechnical, and petroleum engineering disciplines. While substantial progress has been made in modeling transversely isotropic media, current methodologies exhibit limitations in reconciling theoretical predictions with complex failure mechanisms. This investigation examines the anisotropic response of diverse lithologies through triaxial testing across bedding orientations (0–90°) and confinement levels (0–60 MPa), revealing a pressure-dependent attenuation of directional strength variations. Experimental evidence identifies three dominant failure modes: cross-bedding shear fracturing, bedding-parallel sliding, and hybrid mechanisms combining both, with transition thresholds governed by confinement intensity and bedding angle. Analytical comparisons demonstrate that conventional single weakness plane models produce characteristic shoulder-shaped strength curves with overpredictions, particularly in hybrid failure regimes. Conversely, the modified patchy weakness plane formulation achieves superior predictive accuracy through parametric representation of anisotropy gradation, effectively capturing strength transitions between end-member failure modes. The Pariseau criterion, though marginally less precise in absolute terms, provides critical insights into directional strength contrasts through its explicit differentiation of vertical versus parallel bedding responses. These findings advance the fundamental understanding of anisotropic rock behavior while establishing practical frameworks for optimizing stability assessments in bedded formations, particularly in high-confinement environments characteristic of deep reservoirs and engineered underground structures.
1. Introduction
The applicability of anisotropic failure criteria in layered rock formations and their associated engineering applications constitute a critical research focus in rock mechanics and hydrocarbon reservoir evaluation [1,2,3,4]. Characterized by distinct bedding structures, layered rocks exhibit significant mechanical anisotropy that challenges the predictive accuracy of conventional isotropic failure criteria in determining strength parameters and fracture propagation patterns [5,6,7,8,9,10]. As an interdisciplinary field investigating rock stress–strain relationships, strength characteristics, and failure mechanisms under multifactorial stress conditions, rock mechanics provides fundamental theoretical support for geological exploration, petroleum engineering, mining operations, and related industrial practices [11,12,13,14,15,16]. Within this domain, shale formations have garnered particular research attention due to their complex laminated textures and pronounced directional dependence of mechanical properties [9,17,18,19]. This structural anisotropy manifests as orientation-dependent variations in shale’s physical and mechanical responses to external loading, making the development of appropriate strength criteria and failure models for anisotropic rocks both theoretically valuable and practically essential for optimizing engineering designs in hydrocarbon extraction and underground storage applications [20,21,22,23,24,25].
In geological engineering, the anisotropic characteristics of shale can significantly impact aspects such as formation pressure, wellbore stability, and reservoir modification [9,26,27,28,29]. Therefore, research into the strength criteria and failure mechanisms of anisotropic shale holds crucial theoretical significance and practical application value.
Current understanding of anisotropic rock mechanics reveals significant advancements and limitations in strength criterion development. Foundational work by Jaeger [7] established the single plane of weakness model for sedimentary rocks, later challenged by experimental evidence showing overestimation of shale strength at low loading angles [12,30,31,32,33]. McLamore et al. [24] demonstrated the critical dependence of laminated rock failure on initial stress states and structural orientations, prompting subsequent revisions to conventional criteria. The Hoek-Brown framework has been adapted for anisotropy, notably through Saroglou et al. [9]’s introduction of a directional strength parameter and Shi et al. [17]’s integration of empirical anisotropic functions that account for curvature variations in failure envelopes. These modified criteria incorporate piecewise functions describing uniaxial compressive strength (UCS) variations with bedding angles (β), particularly addressing minimum strength observed between β = 45–60° while preserving boundary values at β = 0° and 90°. Complementary studies by Iferobia et al. [23] quantified pore water loss effects, showing substantial shale strengthening during preservation. Comparative analyses highlight the modified Hoek–Brown criterion’s superior predictive capability over Jaeger’s model [31,33], though persistent discrepancies arise from heterogeneous rock matrices and bedding plane irregularities. Saeidi et al. [30] advanced this field by introducing an anisotropy-driven strength reduction parameter, outperforming both modified Hoek–Brown and Ramamurthy criteria in transversely isotropic rock predictions. Recent innovations include Bautmans et al. [34]’s “patchy weakness” concept, reconciling transverse isotropy with coupled failure modes through localized bedding plane defects. While numerous criteria exist, their judicious application in drilling and wellbore engineering necessitates careful consideration of material brittleness–ductility transitions and rigorous physical interpretation of underlying failure mechanisms. Experimental validations by Li et al. [35] revealed moisture-dependent mechanical responses, with transverse laminations exhibiting superior strength and Young’s modulus compared to longitudinal orientations, while water saturation paradoxically increased cohesion but reduced friction angles in Mohr–Coulomb formulations.
Shale, with its finely laminated structure, natural fractures, and low permeability, is a common sedimentary rock widely distributed throughout the Earth’s crust [24,36,37,38,39]. Due to its layered structure and mineral composition, shale exhibits significant mechanical properties with pronounced anisotropy [40,41].
Recent advances in shale anisotropy research have revealed critical insights through multidisciplinary experimental approaches. Jia et al. [42] employed in situ micro-CT imaging to characterize shale’s internal microstructure, demonstrating how fine mineral band distributions govern fracture propagation dynamics and failure mode formation under uniaxial compression and identifying two distinct failure patterns: vertical fractures in bedding-parallel orientations and inclined fractures under transverse loading. Complementing these structural analyses, Wang et al. [43] quantified microstructural evolution during in situ steam pyrolysis of oil shale, documenting a 12.2-fold porosity increase with bedding-aligned microfractures and thermal propagation extending 22.4 times beyond conductive heating zones, while subsequent experiments on rapid steam injection elucidated percolation pathway controls on thermal cracking efficiency. Yang et al. [41] investigated bedding angle effects, revealing dry shale’s characteristic U-shaped peak strength profile (maximum at 0° and 90° orientations) contrasted with saturated specimens’ enhanced anisotropy, while high-concentration NaCl solutions demonstrated mineral-stabilizing restorative effects. Yang et al. [41] mechanistically linked saline-induced mechanical degradation to fluid infiltration along bedding planes causing selective mineral dissolution, establishing quantitative correlations between solution chemistry and strength deterioration rates. Jia et al. [42] delineated confinement-dependent failure regimes, observing U-shaped compressive strength variations with bedding angle alongside three distinct fracture modes: transverse shear failure under parallel loading, 45° shear slip at intermediate angles, and macroscopic bedding-transverse fractures under high confinement. Field studies by Wang et al. [43] in the Jiyang Depression identified intersecting high-angle fracture networks and low matrix strength as primary drivers of wellbore instability, while Zheng Yanni et al. [44] quantified confinement effects on failure mode transitions, demonstrating progressive intensification of U-shaped strength–bedding angle relationships under elevated pressures. Xing Dandan et al. [45] further differentiated mechanical responses through elastic modulus V-shaped versus strength U-shaped bedding angle dependencies, with confinement-induced anisotropy attenuation and failure mode transitions from tensile (uniaxial) to shear dominance (triaxial). Petrophysical analyses by Liu Zichun et al. [46] on Sichuan Basin shales established strong anisotropy–clay content correlations (R2 = 0.82), modulated by oriented clay particle arrangements and quartz–TOC associations that partially decoupled organic content from anisotropic strength relationships. Collectively, these studies provide a comprehensive framework for understanding shale’s anisotropic behavior across scales, from microstructural mechanisms to macroscopic failure patterns, with critical implications for reservoir geomechanics and hydrocarbon extraction optimization.
Current anisotropic strength models are broadly classified into three categories based on bedding angle-dependent strength curves: shoulder-type, U-type, and undulatory-type configurations [47,48,49,50,51,52]. From a mathematical perspective, these models further divide into continuous, discontinuous, and empirical formulations, each with distinct mechanistic interpretations. Discontinuous criteria, while adept at distinguishing shear failure from bedding plane slippage, face limitations in transitional failure regimes. Ambrose et al. [8] identified such transitional behavior in layered organic-rich shales, where failure surfaces alternate between matrix rupture and bedding plane detachment, leading to significant predictive deviations in discontinuous models. This underscores the necessity of aligning criteria selection with material-specific failure mechanisms, particularly in geomechanical applications like drilling and wellbore stability. To evaluate predictive efficacy, this study examines three representative models: the Single Plane of Weakness (SPW) model—a discontinuous, shoulder-type formulation; the Patchy Plane of Weakness (PPW) model—a hybrid discontinuous-undulatory approach accounting for localized bedding defects; and Pariseau’s continuous U-type criterion. Leveraging triaxial strength data from 12 lithologically diverse laminated rocks, a comprehensive assessment was conducted using least-squares regression, with predictive accuracy quantified through the root mean square error (RMSE), mean absolute error (MAE), and coefficient of determination (R2). This analysis not only elucidates the interplay between anisotropy intensity and shale strength variability but also identifies optimal criteria for specific geological scenarios, bridging theoretical formulations with practical engineering applications.
2. Anisotropic Strength Criteria
2.1. Jaeger’s Plane of Weakness Model
The single plane of weakness was first proposed by Jaeger [7] based on the Mohr conception, which is most widely used to predict anisotropic strength of sedimentary rocks, especially shales. The failure model for homogeneous material with cohesion So and internal friction angle is given in Equation (1):
The sliding failure occurring along the weak bedding plane, inclined at an angle β between the bedding plane normal and the maximum principal loading, with cohesion Sbp and internal friction angle , is given in Equation (2),
where σm is the mean normal stress, σm = (σ1 + σ3)/2, τm is the maximum shear stress on the bedding plane, τm = (σ1 − σ3)/2, σ1 is the maximum principal stress, MPa; and σ3 is the minimum principal stress, MPa.
According to the single weak plane criterion, the trend of rock strength concerning the angle β is illustrated in Figure 1. Based on the physical significance and geometric features of the Mohr circle, it can be deduced that the upper and lower boundaries of the angles between the crack surface normal and the maximum principal stress correspond to the internal friction angle of the crack surface along which sliding failure occurs. When the angle β1 approaches infinity close to the internal friction angle of the bedding plane or β2 approaches 90°, the crack surface strength tends toward infinity.
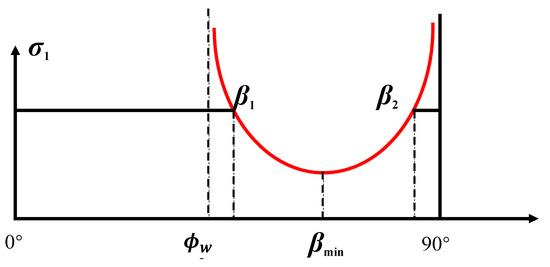
Figure 1.
Theoretical strength variation with bedding angle (β) predicted by Jaeger’s single plane of weakness model (adapted from [7]).
2.2. Plane of Patchy Weakness Model
The plane of patchy weakness model [28,31,32,33] extended the conception of Jaeger’s plane of weakness, considering that the planes of weakness are heterogenous and contain some weak patches along the bedding orientation. Those patches are so weak that they fail at a lower loading force, which causes higher local stress and, consequently, global failure at lower external stress. The model for intrinsic rock strength and the plane of weak patchy failure is expressed in Equations (3) and (4):
where is a dimensionless parameter that represents the property of weak patches. In case no weak patches exist in the bedding plane, is zero, and the model degrades to the single plane of weakness criterion.
2.3. Pariseau’s Model
The Model of Pariseau [8], satisfying the symmetry requirements for the transversely isotropic medium, is an extensive form of the Drucker–Prager model. The anisotropic strength with variational bedding orientations predicted by this criterion is continuous and smooth, which is different from the plane of weakness model and patchy weakness strength model. Additionally, the model is able to describe the different strengths between that of samples perpendicular to bedding and parallel to bedding, as well as representing the mixed failure well, with a single function over the total orientations. But few evaluations have applied it to experimental datasets in geotechnical engineering. In order to fit false triaxial compressional experiment data using the Pariseau’s model, it should be reduced to the pattern in Equation (5):
where F, G, M, U, and V are rock property parameters determined through laboratory experiments.
3. Analysis of Experimental Results
This study incorporates peak strength datasets from twelve distinct transversely isotropic rock formations, encompassing diverse lithologies and confining pressure conditions, to evaluate anisotropic strength criteria. The analyzed data draw from seminal experimental investigations including Ambrose et al. [8]’s work on Bossier and Vaca Muerta shales, Duveau et al. [9]’s characterization of Angiers Schist, Donath [9]’s analysis of Martinsburg Slate, and McLamore and Gray [24]’s examinations of Austin Slate with Green-River Shale variants. Additional datasets derive from Ramamurthy et al. [13]’s phyllite studies (Quartz, Carbona, and Micaceous types), Attewell and Sandford [9]’s Penrhyn Slate analysis, and Niandou et al. [9]’s Tournemire Shale experiments. All strength parameters are standardized in MPa units to enable direct lithological comparisons. These layered formations exhibit characteristic transverse isotropy—displaying quasi-isotropic behavior within bedding planes but marked directional dependence perpendicular to stratification. This mechanical anisotropy manifests in preferential failure along bedding planes under low-energy mechanical disruption, contrasting with enhanced resistance to cross-bedding deformation. The compiled datasets capture this fundamental anisotropy through controlled variations in bedding plane orientations relative to principal stress directions, providing a robust foundation for comparative analysis of strength criterion performance across geological materials.
The strength of bedded rocks shows a transition zone at the relative angle between 0~β1 and β2~90°, wherein the failure mode is beyond the conception of the plane of weakness model, and is lower than both the intact rock and the plane of weakness in this transition caused by the mixed failure pattern.
For relatively homogeneous lithological formations subjected to comparable confining pressure conditions, minimal strength disparity would be anticipated across different orientations. In contrast, transversely isotropic rocks demonstrate significant directional dependency, manifesting either U-curve or inverted V-shaped strength evolution patterns relative to bedding plane inclinations under equivalent confinement. This study’s evaluation framework for twelve sets of peak strength predictions through anisotropic criteria necessitates preliminary quantification of lithological anisotropy. The coefficient of variation emerges as an effective statistical measure for characterizing material heterogeneity, particularly suitable for cross-comparisons between diverse lithotypes under varying confinement states. This dimensionless metric, derived from the ratio of the standard deviation to the arithmetic mean, enables standardized assessment of mechanical property fluctuations across measurement scales and unit systems, thereby facilitating analysis of stress-dependent anisotropic responses in stratified geological media.
Figure 2 characterizes confinement-dependent anisotropy across twelve lithologies, all of which reveal a consistent pressure–sensitivity pattern, except for Micaceous Phyllite. The analyzed rock types demonstrate progressive anisotropy diminution with confinement reduction, exhibiting distinct pressure response phases: rapid anisotropy attenuation dominates at lower confining pressures, transitioning to pressure-insensitive behavior above critical confinement thresholds. Comparative analysis identifies Angiers Schist and Martinsburg Slate as exhibiting pronounced anisotropy, contrasting with Green River Shale variants showing the least anisotropic responses and minimal bedding angle sensitivity. Building on these lithological anisotropy profiles, subsequent analysis evaluates three dominant strength criteria against the experimental database to quantify their predictive capabilities in capturing confinement-modulated directional strength variations.
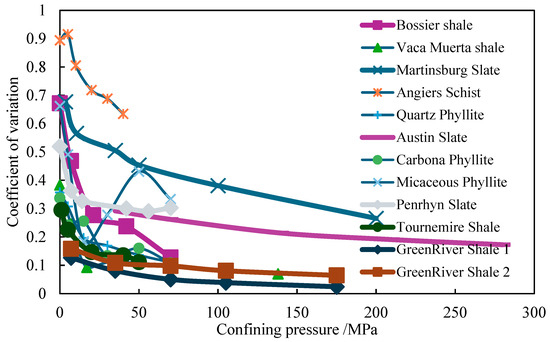
Figure 2.
Summary of coefficient of variation for different rock types.
4. Comparison of Prediction Accuracy
4.1. Fitting Method
In order to predict anisotropic rock strength, indispensably, the parameters embedded in the selected model should be carefully fit by accurate experimental data of anisotropic failure. In this paper, the least-squares method is adopted as the data fitting approach to determine the strength parameters. The three types of criteria above are applied to fit the 12 different datasets of transversely isotropic rocks, wherein the parameters of the models are selected to provide a global minimum magnitude for the root mean squar error, shown in Equation (6):
In the equation, RMSE represents the root mean square error of the errors, in MPa; denotes the tested peak strength of shale, in MPa; signifies the predicted peak strength of shale, in MPa; and N stands for the number of strength tests. The range of these strength parameters is refined using MATLAB 2022a, and the optimal parameters with the lowest RMSE are identified iteratively.
Following the derivation of the best-fit parameters for strength criteria, the square of the correlation coefficient between experimental and predicted values is computed to evaluate the predictive accuracy of different anisotropic strength criteria, as shown in Equation (7).
In the equation, represents the average test value of rock peak strength at bedding angle β, in MPa. Another error evaluation metric is the mean absolute error (MAE), as shown in Equation (8).
Based on the aforementioned indicators, a smaller RMSE and MAE, along with a larger square of the correlation coefficient, indicate that the theoretical calculated values are closer to the test values, reflecting a better fitting effect.
4.2. Results and Analysis
Employing a methodological framework based on the least-squares principle, this study applied the three distinct anisotropic strength criteria outlined in Section 2 to perform quantitative evaluation of strength parameters across 12 lithological varieties. Through rigorous optimization processes focused on RMSE minimization, the computational procedure successfully identified optimal parameter configurations for each criterion, thereby establishing robust correlations between theoretical predictions and experimental rock strength data. The resultant calibration parameters, representing the most accurate predictive solutions for the SPW, PPW, and Pariseau criteria, are documented in Table 1, Table 2 and Table 3, corresponding to each respective criterion. This parametric optimization not only validates the mathematical applicability of these criteria but also provides critical reference values for future geo-mechanical modeling involving anisotropic rock formations.

Table 1.
Fitting parameters of single plane of weakness model.
Table 2.
Fitting parameters of patchy plane of weakness model.
Table 3.
Fitting parameters of Parisaeu’s model.
Using the fitting results from Table 1 to Table 3, the experimental data of Bossier shale and Angiers Schist, along with the predicted results of SPW, PPW, and Pariseau criteria, are simultaneously plotted in Figure 3 and Figure 4.
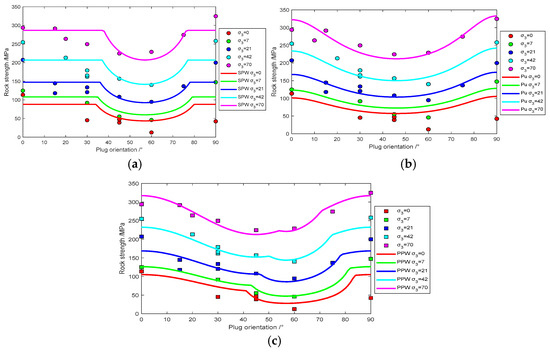
Figure 3.
Experimental data of Bossier shale fit with three anisotropic strength models: (a) single plane of weakness model (b) Pariseau’s model, and (c) patchy plane of weakness model.
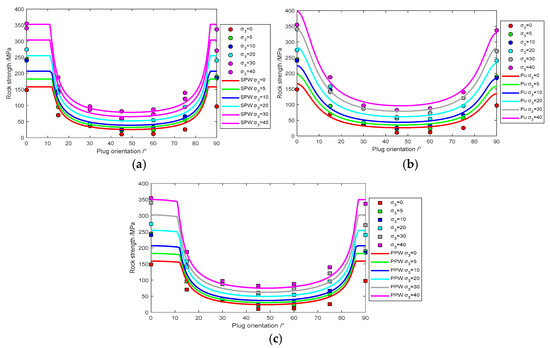
Figure 4.
Experimental data of Angiers Schist fit with three anisotropic models: (a) single plane of weakness model (b) Pariseau’s model, and (c) patchy plane of weakness model.
The mechanical behavior of anisotropic rock exhibits complex failure characteristics influenced not only by hydrostatic pressure but also significantly by the angular relationship between the axial loading direction and the bedding plane orientation. A comparative analysis of three distinct anisotropic strength criteria reveals that the SPW criterion uniquely demonstrates a distinctive shoulder-shaped pattern in its predicted strength variation curve across different bedding plane angles. This characteristic manifest as maintained consistency between theoretical predictions and actual strength changes within specific ranges of both low- and high-bedding plane angles. Notably, experimental measurements show a marked discrepancy between peak strength values at 0° and 90° bedding plane orientations, with perpendicular loading configurations (90°) generally yielding higher strength values than parallel loading scenarios (0°). This phenomenon arises because axial loading parallel to bedding planes predominantly induces tensile failure along weak planes, whereas perpendicular loading typically causes shear failure across bedding planes. Given that most rocks demonstrate substantially lower tensile strength compared to compressive resistance, this inherent material property fundamentally explains the observed strength hierarchy between different loading orientations relative to bedding planes. Moreover, within the range of 0° to β1 and β2 to 90°, the SPW criterion underestimates the rock’s strength and fails to reflect the difference in strength between rocks oriented perpendicular and parallel to the bedding plane. However, between β1 and β2, the predictive results of the SPW criterion align closely with the test values.
Analyzing the characteristics of the Pariseau criterion predictive curves as shown in Figure 3b and Figure 4b, it is noted that Pariseau’s model comprises a single expression encompassing all stress ranges, depicting a smooth transition in strength from shear fracture, mixed failure mode to sliding along weak planes. This criterion is a continuous function of the bedding plane angle (β). Another aspect of Pariseau’s model is its capability to capture strength differences between β = 0° and β = 90°, unlike the JPW model, which assumes the same strength at these angles, leading to a more accurate predictive performance.
A comprehensive examination of the PPW criterion’s predictive behavior, as visualized in Figure 3c, Figure 4c, Figure 5, Figure 6, Figure 7, Figure 8, Figure 9, Figure 10, Figure 11, Figure 12, Figure 13 and Figure 14, reveals a distinctive sinusoidal oscillation pattern in its strength–angle relationship for layered rocks, reflecting the criterion’s capacity to accommodate materials with diverse anisotropy levels. The fluctuation amplitude of these characteristic curves is governed by the dimensionless parameter η, which directly correlates with the magnitude of mechanical anisotropy exhibited by the rock strata. Strongly anisotropic formations such as Angiers Schist and Penrhyn Slate manifest heightened η values, producing pronounced wave-like strength variations across bedding orientations under equivalent confinement, whereas weakly anisotropic lithologies like Tournemire Shale and GreenRiver Shale sequences display subdued undulations with minimized η values. Furthermore, confining pressure exerts a transformative influence on curve morphology: under low confinement, the PPW criterion generates sharp, angular peaks and troughs in strength predictions, while elevated confining pressures progressively attenuate these oscillations, ultimately collapsing the waveform into a continuous, symmetrical U-shaped profile. This pressure-dependent transition from discontinuous waviness to smooth continuity is particularly evident in materials such as Austin Slate and Carbona Phyllite, where the interplay between confinement-induced stress redistribution and bedding plane weakness governs the evolution of failure mechanisms across angular domains.
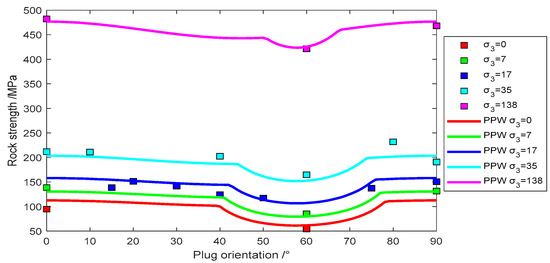
Figure 5.
Experimental data of Vaca Muerta shale fit with Pariseau’s model.
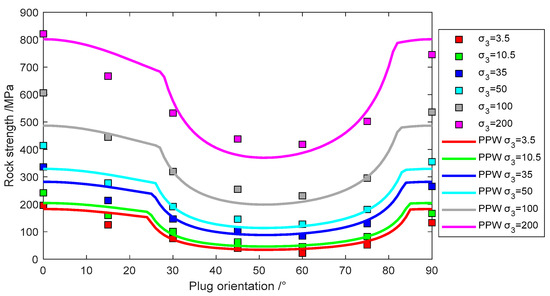
Figure 6.
Experimental data of Martinsburg Slate fit with patchy plane of weakness model.
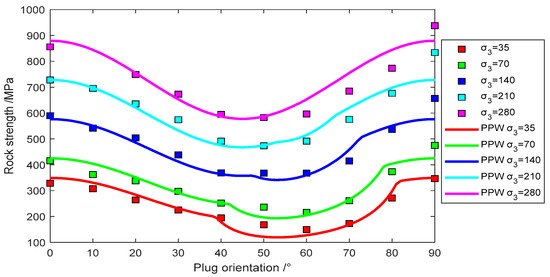
Figure 7.
Experimental data of Austin Slate fit by plane with patchy weakness model.
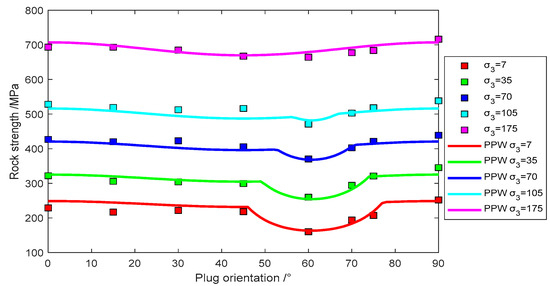
Figure 8.
Experimental data of GreenRiver Shale 1 fit with Pariseau’s model.
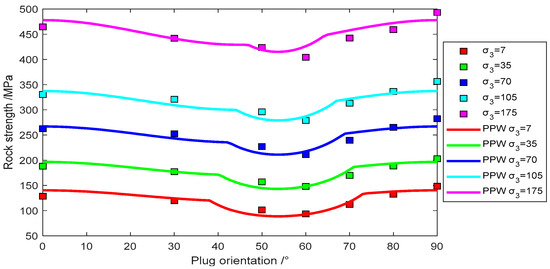
Figure 9.
Experimental data of GreenRiver Shale 2 fit with Pariseau’s model.
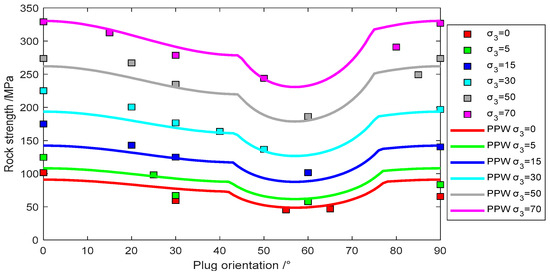
Figure 10.
Experimental data of Quartz Phyllite fit with plane of patchy weakness model.
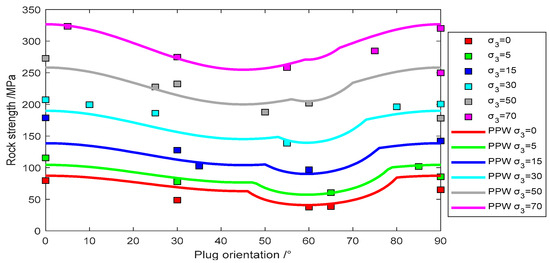
Figure 11.
Experimental data of Carbona Phyllite fit with Pariseau’s model.
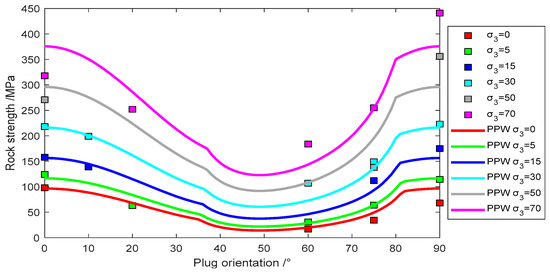
Figure 12.
Experimental data of Micaceous Phyllite fit with Pariseau’s model.
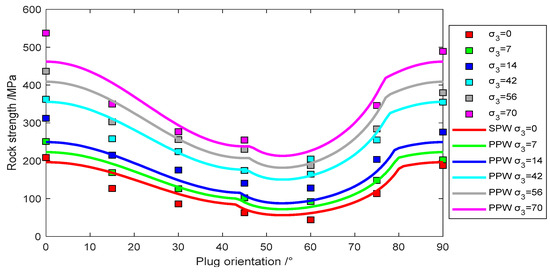
Figure 13.
Experimental data of Penrhyn Slate fit with plane of patchy weakness model.
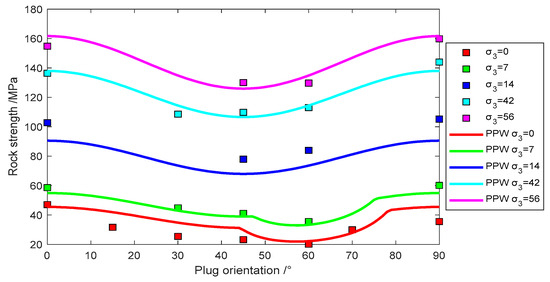
Figure 14.
Experimental data of Tournemire Shale fit with Pariseau’s model.
This suggests that the PPW criterion, by introducing the dimensionless parameter η in the SPW criterion, brings the strength predictive results closer to the tested values within the range of 0° to β1 and β2 to 90° of bedding plane angles. Moreover, it accommodates variations in strength anisotropy under different types of rocks and different confining pressures. However, unlike the Pariseau criterion predictive results, the limitation of the PPW criterion lies in its inability to distinguish between the strength of rocks oriented perpendicular to the bedding plane and those parallel to it.
4.3. Discussion
After studying the characteristics of three different anisotropic strength criteria, this paper evaluates the prediction performance of different strength criteria using the root mean square error (RMSE), square of the correlation coefficient, and mean absolute error. The RMSE, square of the correlation coefficient, and mean absolute error for the fitting of strength in 12 different types of rocks are depicted in Figure 15, Figure 16 and Figure 17, respectively.
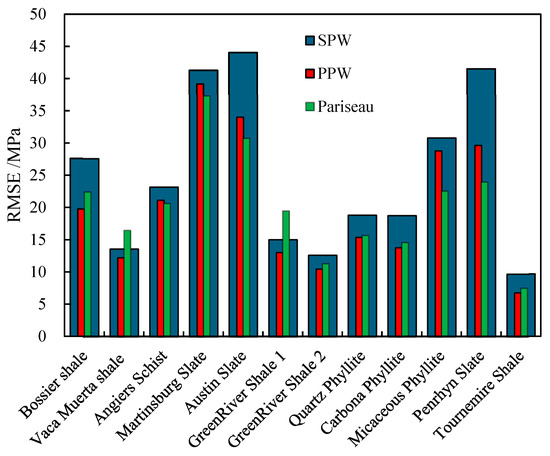
Figure 15.
Comparison of RMSE predicated using SPW, PPW, and Pariseau criteria for various anisotropic rocks.
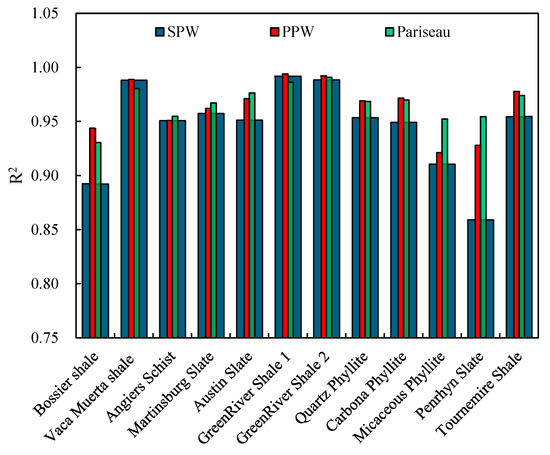
Figure 16.
Comparison of R2 predicted using SPW, PPW, and Pariseau criteria for various anisotropic rocks.
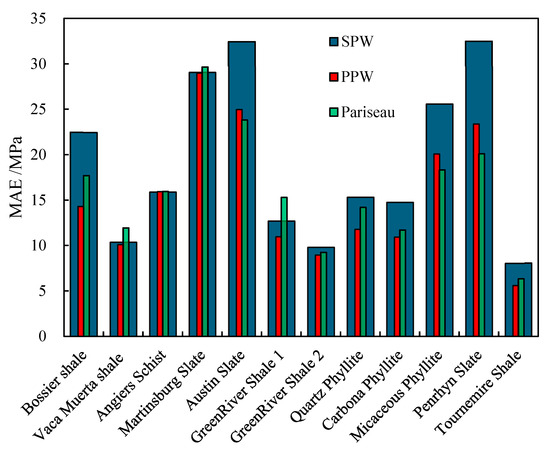
Figure 17.
Comparison of MAE predicted using SPW, PPW, and Pariseau criteria for various anisotropic rocks.
A comparative evaluation of predictive accuracy among the three criteria, as illustrated in Figure 15, reveals variations in RMSE performance across different anisotropic rock formations. The SPW criterion demonstrates the largest prediction errors for ten out of twelve lithological groups, with exceptions observed only in Vaca Muerta shale and Green River Shale 1. This limited predictive capability, as previously discussed, stems from its inability to account for complex hybrid failure mechanisms that involve concurrent bedding-parallel sliding and cross-bedding shear failure. In contrast, the PPW criterion achieves superior predictive precision, yielding the lowest RMSE values for seven distinct stratified rock types, while the Pariseau criterion exhibits optimal performance for the remaining five formations. Although both the PPW and Pariseau criteria substantially outperform the SPW criterion in prediction fidelity, a nuanced comparison of their RMSE distributions suggests marginally greater practical reliability of the PPW criterion for heterogeneous layered rock systems. This hierarchical performance pattern underscores the critical importance of incorporating multi-modal failure considerations in anisotropic strength modeling, particularly for lithologies exhibiting pronounced mechanical contrasts between bedding planes and matrix materials.
Assessing the predictive accuracy of different anisotropic strength criteria, the square of the correlation coefficient was used as an indicator, as shown in Figure 16. Analysis reveals that except for Bossier shale and Penrhyn Slate, the square of the correlation coefficient for strength prediction by SPW, PPW, and Pariseau criteria exceeds 0.9 for various rock types. This indicates the strong predictive capability of these three anisotropic strength criteria for the characteristics of layered rock strength. Statistically, the PPW criterion yields the highest R2 values for predicting the strength of seven different types of rock, while the Pariseau criterion achieves the highest R2 values for the remaining five types of layered rock strength prediction. Consequently, the PPW criterion demonstrates reasonably good predictive capabilities for anisotropic rock strength.
A complementary quantitative assessment through mean absolute error (MAE) evaluation, as visualized in Figure 17, reinforces the hierarchical performance pattern observed in RMSE analysis. The SPW criterion demonstrates statistically superior MAE magnitudes across eight lithological groups, corroborating its overestimation tendencies in strength predictions. In marked contrast, the PPW criterion achieves precision dominance with minimized MAE values for nine distinct stratified formations, whereas the Pariseau criterion shows optimal performance for three residual cases. This comparative analysis reveals a consistent predictive hierarchy: the PPW mechanism emerges as the most reliable predictor for anisotropic rock strength, closely trailed by the Pariseau formulation, while the SPW framework exhibits the weakest correlation with experimental measurements. The pronounced MAE disparities between these criteria quantitatively validate the necessity of incorporating multi-scale failure interactions in geomechanical modeling, particularly for complex layered systems where stress redistribution mechanisms operate across multiple bedding orientations.
The SPW criterion’s reliance on idealized bedding plane homogeneity overlooks matrix–pore fluid interactions and localized stress concentrations at bedding interfaces, leading to overpredictions in hybrid failure regimes (Figure 3a). While the PPW model introduces parameter η to account for patchy weakness distribution, its formulation assumes uniform defect spacing, neglecting spatial heterogeneity in natural laminations. Pariseau’s criterion, though continuous, lacks explicit representation of bedding plane friction–cohesion dynamics, limiting its capacity to resolve multi-scale failure interactions. All models inadequately address strain rate effects, which may alter anisotropy thresholds under dynamic loading conditions encountered in drilling or seismic events. While the PPW achieves the lowest aggregate errors, its operational complexity (five parameters) limits field utility compared to Pariseau’s fewer variables. The SPW remains viable for quick-look analyses in weakly anisotropic formations (CV < 0.2) but requires empirical correction factors (~0.85) for hybrid failures. Engineers must prioritize model selection based on lithology, stress regime, and acceptable error margins—e.g., the PPW for fault-proximal stability assessments vs. Pariseau for salt cavern design.
5. Conclusions
This study implemented three anisotropic strength criteria (SPW, PPW, and Pariseau) through least-squares optimization to simulate the strength characteristics of 12 stratified rock types. Predictive performance was quantitatively assessed across varying confining pressures and bedding orientations through RMSE, R2, and MAE analyses, establishing rigorous benchmarks for each criterion’s ability to replicate experimental strength profiles in anisotropic geological media.
The research findings indicate that the anisotropy of layered rock strength decreases with decreasing confining pressures. Under low confining pressures, the anisotropy value decreases rapidly with increasing confining pressure. Conversely, at high confining pressures, the anisotropy variation diminishes. Analyzing the strength of layered rocks at different bedding angles reveals that perpendicular bedding rock strength surpasses parallel bedding rock strength. Additionally, within the range of bedding angles 0° to β1 and β2 to 90°, the strength of layered rocks is lower than the intact rock strength. The observed strength variations stem from fundamental differences in failure mechanisms relative to bedding plane orientation. When loading aligns with bedding planes (0°), the rock exhibits diminished capacity due to preferential fracturing along these planes of weakness. Conversely, perpendicular loading (90°) induces matrix-dominated failure through intact rock material, achieving maximum strength comparable to non-stratified specimens. Notably, intermediate orientations (β1–β2 range) reveal hybrid failure modes, combining cross-bedding shear fracturing and bedding-parallel sliding. This composite mechanism produces transitional strength values exceeding pure bedding plane failure but remaining inferior to intact rock performance. The resultant strength profile therefore demonstrates an angular dependence governed by competing failure pathways—bedding plane activation versus matrix shearing—with the critical transition angles β1 and β2 demarcating the boundaries between dominant failure modes.
Regarding the anisotropic strength criteria, the SPW criterion predicts a “shoulder-shaped” strength curve for rocks at different bedding angles, overestimating the strength of rocks within the ranges of 0° to β1 and β2 to 90°, leading to significant predictive errors in layered rock strength. In contrast to other approaches, the PPW criterion characterizes rock strength variation across bedding orientations through a distinctive undulating curve governed by parameter η, demonstrating its versatility in modeling rocks with diverse anisotropic characteristics. This formulation effectively captures the complex interplay between intact shear failure and bedding plane sliding mechanisms while maintaining adaptability to varying lithological compositions and confining pressure conditions. A notable limitation, however, lies in its inability to differentiate strength properties between orthogonal and parallel bedding orientations. Pariseau’s model presents an alternative framework through a unified mathematical expression that seamlessly bridges distinct failure regimes—from shear fracturing through transitional mixed modes to planar sliding—achieving continuous strength prediction across the full stress spectrum. While this integrated formulation successfully discriminates strength differences between perpendicular and parallel bedding configurations, its capacity to accurately predict strength parameters across heterogeneous layered rock formations proves marginally inferior to the PPW criterion’s performance. The comparative analysis reveals a fundamental trade-off between model universality and lithology-specific predictive precision in anisotropic rock mechanics. In conclusion, the comprehensive analysis suggests that the PPW criterion demonstrates the best predictive performance for layered rock strength, followed by the Pariseau criterion, and finally the SPW criterion. Future research should focus on developing unified multi-scale anisotropic models and multifield-coupled strength criteria for thermal–hydrological–chemical (THC) interactions, establishing dynamic constitutive relationships to reveal rate-dependent effects under cyclic loading, and creating machine learning-driven intelligent prediction systems. Efforts should integrate anisotropic criteria with engineering rock mass classification systems, validate practicality through in situ testing, and ultimately form an integrated workflow spanning geological modeling, strength prediction, and stability assessment.
Author Contributions
Conceptualization, Y.L.; methodology, Y.L.; software, Y.L.; validation, Y.L. and Z.Y.; formal analysis, Z.Y.; investigation, Z.Y.; resources, J.W.; data curation, Z.Y. and J.W.; writing—original draft, J.W.; writing—review and editing, Y.Y. and J.W.; visualization, Y.Y.; supervision, Y.Y.; project administration, Y.Y. All authors have read and agreed to the published version of the manuscript.
Funding
This research received no external funding.
Institutional Review Board Statement
All research activities were conducted in accordance with the ethical guidelines and principles outlined by the Committee on Publication Ethics.
Informed Consent Statement
All individuals involved in this study have provided their consent for the publication of the study findings. Any personal or identifying information that could potentially compromise privacy has been carefully removed or anonymized.
Data Availability Statement
The data and materials used in this study are available upon request.
Conflicts of Interest
Author Yongfeng Liu was employed by the company Shenzhen Zhongjin Lingnan Non-ferrous metal Company Limited, and Zhengxing Yu, Yongming Yin, Jinglin Wen were employed by the company Cathay Safety Technology Co., Ltd. The remaining authors declare that the research was conducted in the absence of any commercial or financial relationships that could be construed as a potential conflict of interest.
References
- Deng, W.; Yang, T.; Liu, H.; Liu, F.; Xu, H. Applicability of anisotropic failure criteria and associated application with layered rocks. Adv. Civ. Eng. 2021, 2021, 1–21. [Google Scholar] [CrossRef]
- Bai, B.; Elgmati, M.; Zhang, H.; Wei, M. Rock characterization of Fayetteville shale gas plays. Fuel 2013, 105, 645–652. [Google Scholar] [CrossRef]
- Chenevert, M.E.; Amanullah, M. Shale preservation and testing techniques for borehole-stability studies. SPE Drill. Compl. 2001, 16, 146–149. [Google Scholar] [CrossRef]
- Ghorbani, A.; Zamora, M.; Cosenza, P. Effects of desiccation on the elastic wave velocities of clay-rocks. Int. J. Rock Mech. Min. Sci. 2009, 46, 1267–1272. [Google Scholar] [CrossRef]
- Ismael, M.S.M.; Chang, M.S.L.; Konietzky, H.H. Behavior of Anisotropic Rocks; Technical Report; Geotechnical Institute, TU Berg Akademie Freiberg: Freiberg, Germany, 2017. [Google Scholar]
- Hoek, E.; Brown, E.T. Empirical strength criterion for rock masses. J. Geotech. Geoenviron. Eng. 1980, 106, 1013–1035. [Google Scholar] [CrossRef]
- Jaeger, J.C. Shear failure of anisotropic rocks. Geol. Mag. 1960, 97, 65–72. [Google Scholar] [CrossRef]
- Ambrose, J.; Zimmerman, R.W.; Suarez-Rivera, R. Failure of shales under triaxial compressive stress. In Proceedings of the 48th US Rock Mechanics/Geomechanics Symposium, Minneapolis, MN, USA, 1–4 June 2014; American Rock Mechanics Association: Alexandria, VA, USA, 2014. [Google Scholar]
- Saroglou, H.; Tsiambaos, G. A modified Hoek–Brown failure criterion for anisotropic intact rock. Int. J. Rock Mech. Min. Sci. 2008, 45, 223–234. [Google Scholar] [CrossRef]
- Rybacki, E.; Reinicke, A.; Meier, T.; Makasi, M.; Dresen, G. What controls the mechanical properties of shale rocks?—Part I: Strength and Young’s modulus. J. Pet. Sci. Eng. 2015, 135, 702–722. [Google Scholar] [CrossRef]
- Rybacki, E.; Meier, T.; Dresen, G. What controls the mechanical properties of shale rocks?—Part II: Brittleness. J. Pet. Sci. Eng. 2016, 144, 39–58. [Google Scholar] [CrossRef]
- Tien, Y.M.; Kuo, M.C. A failure criterion for transversely isotropic rocks. Int. J. Rock Mech. Min. Sci. 2001, 38, 399–412. [Google Scholar] [CrossRef]
- Ramamurthy, T. Strength and modulus responses of anisotropic rocks. In Comprehensive Rock Engineering; Hudson, J.A., Ed.; Pergamon: Oxford, UK, 1993; Volume 1, pp. 313–329. [Google Scholar]
- Lee, Y.K.; Pietruszczak, S.; Choi, B.H. Failure criteria for rocks based on smooth approximations to Mohr–Coulomb and Hoek–Brown failure functions. Int. J. Rock Mech. Min. Sci. 2012, 56, 146–160. [Google Scholar] [CrossRef]
- Benz, T.; Schwab, R. A quantitative comparison of six rock failure criteria. Int. J. Rock Mech. Min. Sci. 2008, 45, 1176–1186. [Google Scholar] [CrossRef]
- Colmenares, L.B.; Zoback, M.D. A statistical evaluation of intact rock failure criteria constrained by polyaxial test data for five different rocks. Int. J. Rock Mech. Min. Sci. 2002, 39, 695–729. [Google Scholar] [CrossRef]
- Shi, X.; Yang, X.; Meng, Y.; Li, G. Modified Hoek–Brown failure criterion for anisotropic rocks. Environ. Earth Sci. 2016, 75, 995. [Google Scholar] [CrossRef]
- Hoek, E.; Brown, E.T. Practical estimates of rock mass strength. Int. J. Rock Mech. Min. Sci. 1997, 34, 1165–1186. [Google Scholar] [CrossRef]
- Hoek, E.; Carranza-Torres, C.; Corkum, B. Hoek–Brown failure criterion—2002 edition. In Proceedings of the North American Rock Mechanics Symposium (NARMS-TAC), Toronto, ON, Canada, 7–10 July 2002; pp. 267–273. [Google Scholar]
- Ramamurthy, T.; Rao, G.V.; Singh, J. A strength criterion for anisotropic rocks. In Proceedings of the Fifth Australia–New Zealand Conference on Geomechanics, Sydney, Australia, 22–23 August 1988; pp. 253–257. [Google Scholar]
- Rao, K.S.; Rao, G.V.; Ramamurthy, T. A strength criterion for anisotropic rocks. Indian Geotech. J. 1986, 16, 317–333. [Google Scholar]
- Li, D.; Wong, L.N.Y.; Liu, G.; Zhang, X. Influence of water content and anisotropy on the strength and deformability of low porosity meta-sedimentary rocks under triaxial compression. Eng. Geol. 2012, 126, 46–66. [Google Scholar] [CrossRef]
- Iferobia, C.C.; Ahmad, M. A review on the experimental techniques and applications in the geomechanical evaluation of shale gas reservoirs. J. Nat. Gas Sci. Eng. 2020, 74, 103090. [Google Scholar] [CrossRef]
- McLamore, R.; Gray, K.E. The mechanical behavior of anisotropic sedimentary rocks. J. Eng. Ind. 1967, 89, 62–73. [Google Scholar] [CrossRef]
- Willson, S.M.; Edwards, S.T.; Crook, A.J.; Bere, A.; Moos, D.; Peska, P.; Last, N. Assuring stability in extended reach wells-analyses, practices and mitigations. In Proceedings of the SPE/IADC Drilling Conference, Amsterdam, The Netherlands, 20–22 February 2007; Society of Petroleum Engineers: Richardson, TX, USA, 2007. [Google Scholar]
- You, M. True-triaxial strength criteria for rock. Int. J. Rock Mech. Min. Sci. 2009, 46, 115–127. [Google Scholar] [CrossRef]
- Alqahtani, A.A.; Mokhtari, M.; Tutuncu, A.N.; Sonnenberg, S. Effect of mineralogy and petrophysical characteristics on acoustic and mechanical properties of organic rich shale. In Proceedings of the Unconventional Resources Technology Conference, Denver, CO, USA, 12–14 August 2013; pp. 399–411. [Google Scholar]
- Fjær, E.; Nes, O.M. Strength anisotropy of Mancos shale. In Proceedings of the 47th US Rock Mechanics/Geomechanics Symposium, San Francisco, CA, USA, 23–26 June 2013; American Rock Mechanics Association: Alexandria, VA, USA, 2013. [Google Scholar]
- Saroglou, H.; Marinos, P.; Tsiambaos, G. The anisotropic nature of selected metamorphic rocks from Greece. J. S. Afr. Inst. Min. Metall. 2004, 104, 215–222. [Google Scholar]
- Saeidi, O.; Rasouli, V.; Vaneghi, R.G.; Gholami, R.; Torabi, S.R. A modified failure criterion for transversely isotropic rocks. Geosci. Front. 2014, 5, 215–225. [Google Scholar] [CrossRef]
- Fjær, E.; Nes, O.M. The impact of heterogeneity on the anisotropic strength of an outcrop shale. Rock Mech. Rock Eng. 2014, 47, 1603–1611. [Google Scholar] [CrossRef]
- Fjær, E.; Stenebråten, J.F.; Holt, R.M.; Bauer, A.; Horsrud, P.; Nes, O.M. Modeling strength anisotropy. In Proceedings of the ISRM Conference on Rock Mechanics for Natural Resources and Infrastructure (SBMR), Goiânia, Brazil, 9–13 September 2014; International Society for Rock Mechanics: Lisbon, Portugal, 2014. [Google Scholar]
- Cho, J.W.; Kim, H.; Jeon, S.; Min, K.B. An experimental study on deformation and strength anisotropy of transversely isotropic rocks in Korea. In Harmonising Rock Engineering and the Environment; CRC Press: Boca Raton, FL, USA, 2011; pp. 293–296. [Google Scholar]
- Bautmans, P.; Fjær, E.; Horsrud, P. The effect of weakness patches on wellbore stability in anisotropic media. Int. J. Rock Mech. Min. Sci. 2018, 104, 165–173. [Google Scholar] [CrossRef]
- Li, C.; Li, C.; Zhao, R.; Zhou, L. A strength criterion for rocks. Mech. Mater. 2020, 154, 103721. [Google Scholar] [CrossRef]
- Hang, W.; Chen, M.; Yan, J.; Wang, K.; Xia, Y.; Dong, J.; Niu, C. A chemo-mechanical coupling model of deviated borehole stability in hard brittle shale. Pet. Explor. Dev. 2014, 41, 817–823. [Google Scholar]
- Josh, M.; Esteban, L.; Delle Piane, C.; Sarout, J.; Dewhurst, D.N.; Clennell, M.B. Laboratory characterization of shale properties. J. Pet. Sci. Eng. 2012, 88, 107–124. [Google Scholar] [CrossRef]
- Quante, N. Geophysical Characteristics of Underground Igneous Rocks in Medina County, Texas. Master’s Thesis, University of Texas at Austin, Austin, TX, USA, 2017. [Google Scholar]
- Roostaei, R. Quantifying the Error Associated with the Use of Triaxial Rock Strength Criteria in Rock Stability Assessment Around Underground Openings. Ph.D. Thesis, University of Alberta, Edmonton, AB, Canada, 2014. [Google Scholar]
- Gao, Y.; Feng, X.T.; Wang, Z.; Zhang, X. Strength and failure characteristics of jointed marble under true triaxial compression. Bull. Eng. Geol. Environ. 2020, 79, 891–905. [Google Scholar] [CrossRef]
- Yang, S.Q.; Hong, W.X.; Sun, B.W.; Tang, X.H. Triaxial mechanics and failure characteristics of shale in different saline environments. Chin. J. Rock Mech. Eng. 2023, 45, 2217–2226. (In Chinese) [Google Scholar]
- Jia, L.C.; Sun, B.F.; Lian, T.W. Experimental study on the anisotropic mechanical properties of organic-rich shale. Drill. Prod. Technol. 2017, 40, 20–23. (In Chinese) [Google Scholar]
- Wang, A.; Wang, F.; He, W. Experimental study on mechanical properties of oil shale in Jiyang Depression. Spec. Oil Gas Reserv. 2023, 30, 144–150. (In Chinese) [Google Scholar]
- Zheng, Y.N.; Zhang, Q.; Zhang, S.; Jia, C.J.; Lei, M.F. Study on the transversely isotropic yield criterion of rocks based on Hoek-Brown. Rock Soil Mech. 2023, 43, 139–150. (In Chinese) [Google Scholar]
- Xing, D.D.; Han, S.Y.; Zhu, Y.Q.; Wang, C.; Xu, Q.; Hou, Z.Z.; Zhang, M.M. Experimental study on the mechanical properties of layered shale in the new Yan’an tunnel. Sci. Technol. Eng. 2023, 23, 5201–5209. (In Chinese) [Google Scholar]
- Liu, Z.C.; Zhang, F.; Li, X.Y. Elastic anisotropy characteristics and influencing factors of organic-rich marine shale in southern China. Sci. China Earth Sci. 2019, 49, 1801–1816. (In Chinese) [Google Scholar]
- Dong, Z.; Tian, S.; Xue, H.; Lu, S.; Liu, B.; Erastova, V.; Chen, G.; Zhang, Y. A novel method for automatic quantification of different pore types in shale based on SEM-EDS calibration. Mar. Pet. Geol. 2025, 173, 107278. [Google Scholar] [CrossRef]
- Gao, R.; Kuang, T.J.; Meng, X.B.; Huo, B.J. Effects of ground fracturing with horizontal fracture plane on rock breakage characteristics and mine pressure control. Rock Mech. Rock Eng. 2021, 54, 3229–3243. [Google Scholar] [CrossRef]
- Gao, R.; Dou, B.; Yu, B.; Yang, T.; Meng, X.B.; Zhang, W.Y. Ground fracturing of multi-strata for strong ground pressure control in extra-thick coal seams with hard roofs: Numerical simulation and case study. Eng. Fract. Mech. 2024, 303, 110129. [Google Scholar] [CrossRef]
- Zou, X.W.; Zhou, T.; Li, G.; Hu, Y.; Deng, B.; Yang, T. Intelligent inversion analysis of surrounding rock parameters and deformation characteristics of a water diversion surge shaft. Designs 2024, 8, 116. [Google Scholar] [CrossRef]
- Ma, W.B.; Zou, W.H.; Zhang, J.L.; Li, G. Prediction of shear strength in anisotropic structural planes considering size effects. Designs 2025, 9, 17. [Google Scholar] [CrossRef]
- Abbaszadeh Shahri, A.; Larsson, S.; Johansson, F. Updated relations for the uniaxial compressive strength of marlstones based on P-wave velocity and point load index test. Innov. Infrastruct. Solut. 2016, 1, 17. [Google Scholar] [CrossRef]
Disclaimer/Publisher’s Note: The statements, opinions and data contained in all publications are solely those of the individual author(s) and contributor(s) and not of MDPI and/or the editor(s). MDPI and/or the editor(s) disclaim responsibility for any injury to people or property resulting from any ideas, methods, instructions or products referred to in the content. |
© 2025 by the authors. Licensee MDPI, Basel, Switzerland. This article is an open access article distributed under the terms and conditions of the Creative Commons Attribution (CC BY) license (https://creativecommons.org/licenses/by/4.0/).