


Advancing Sustainable Textile Metrology: Reflectivity Measurement with Controlled Light Sources


Abstract
1. Introduction
2. Materials and Methods
2.1. Materials
2.2. Methods
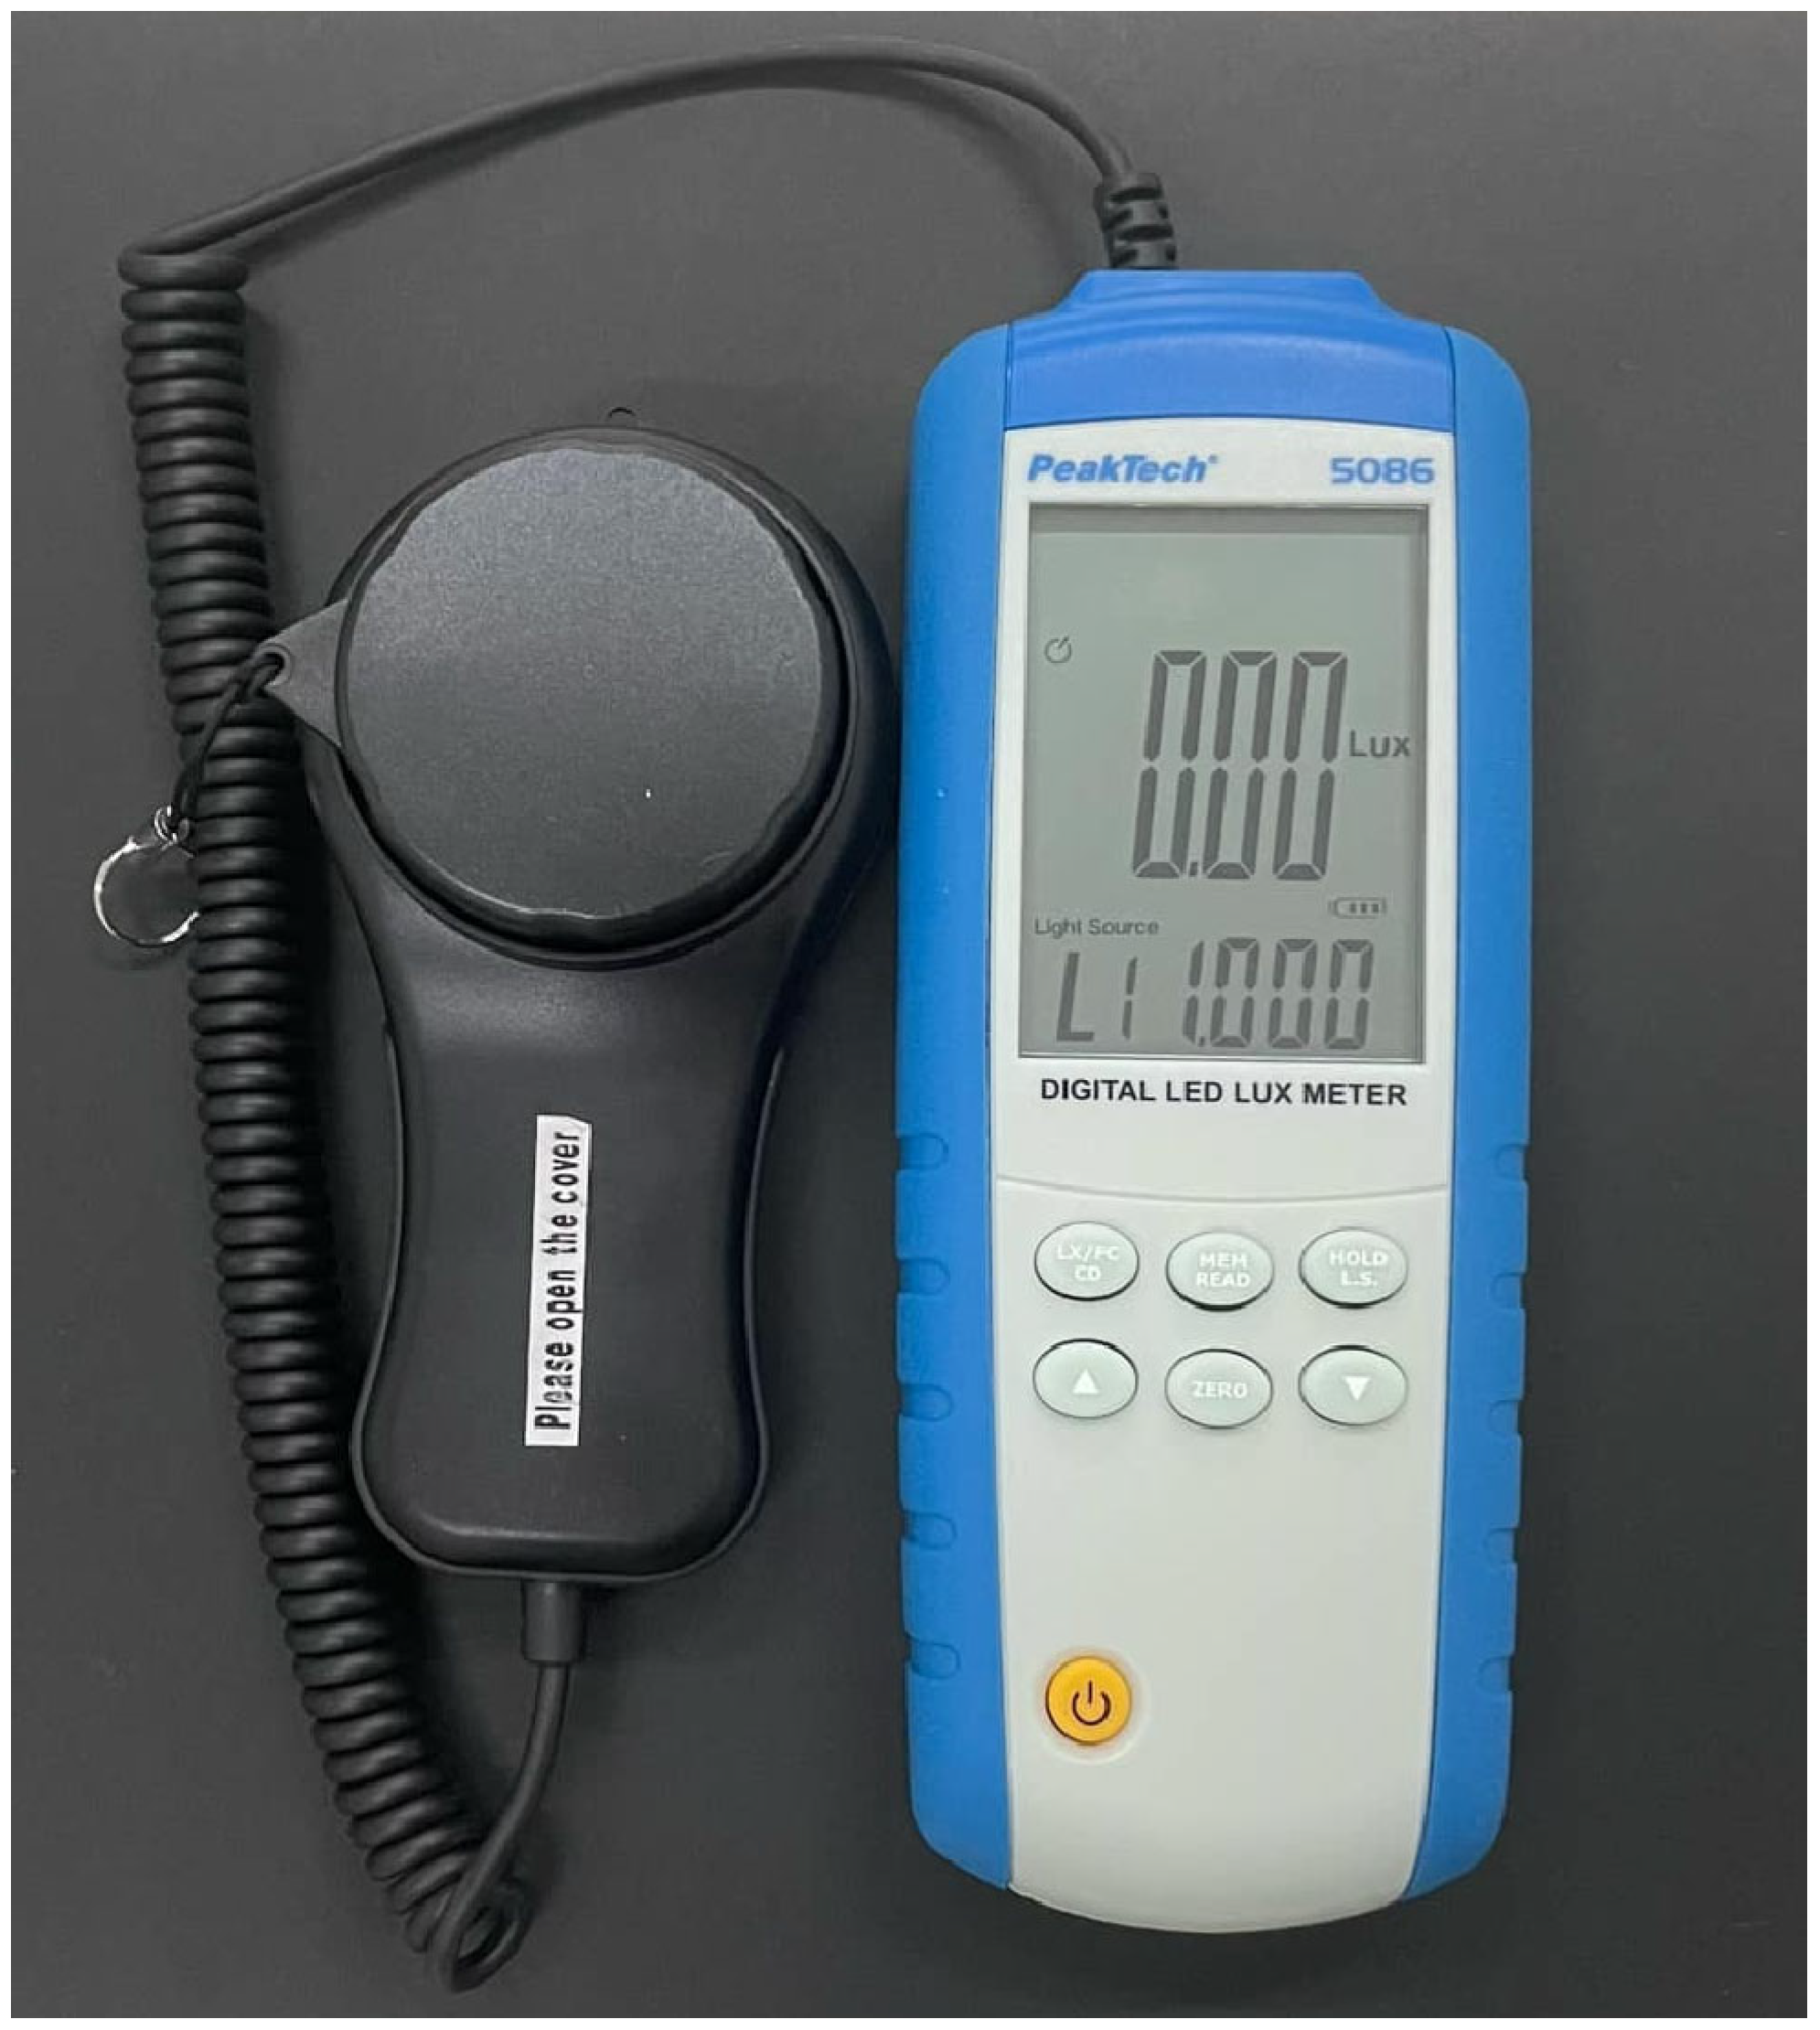
- Luxmeter;
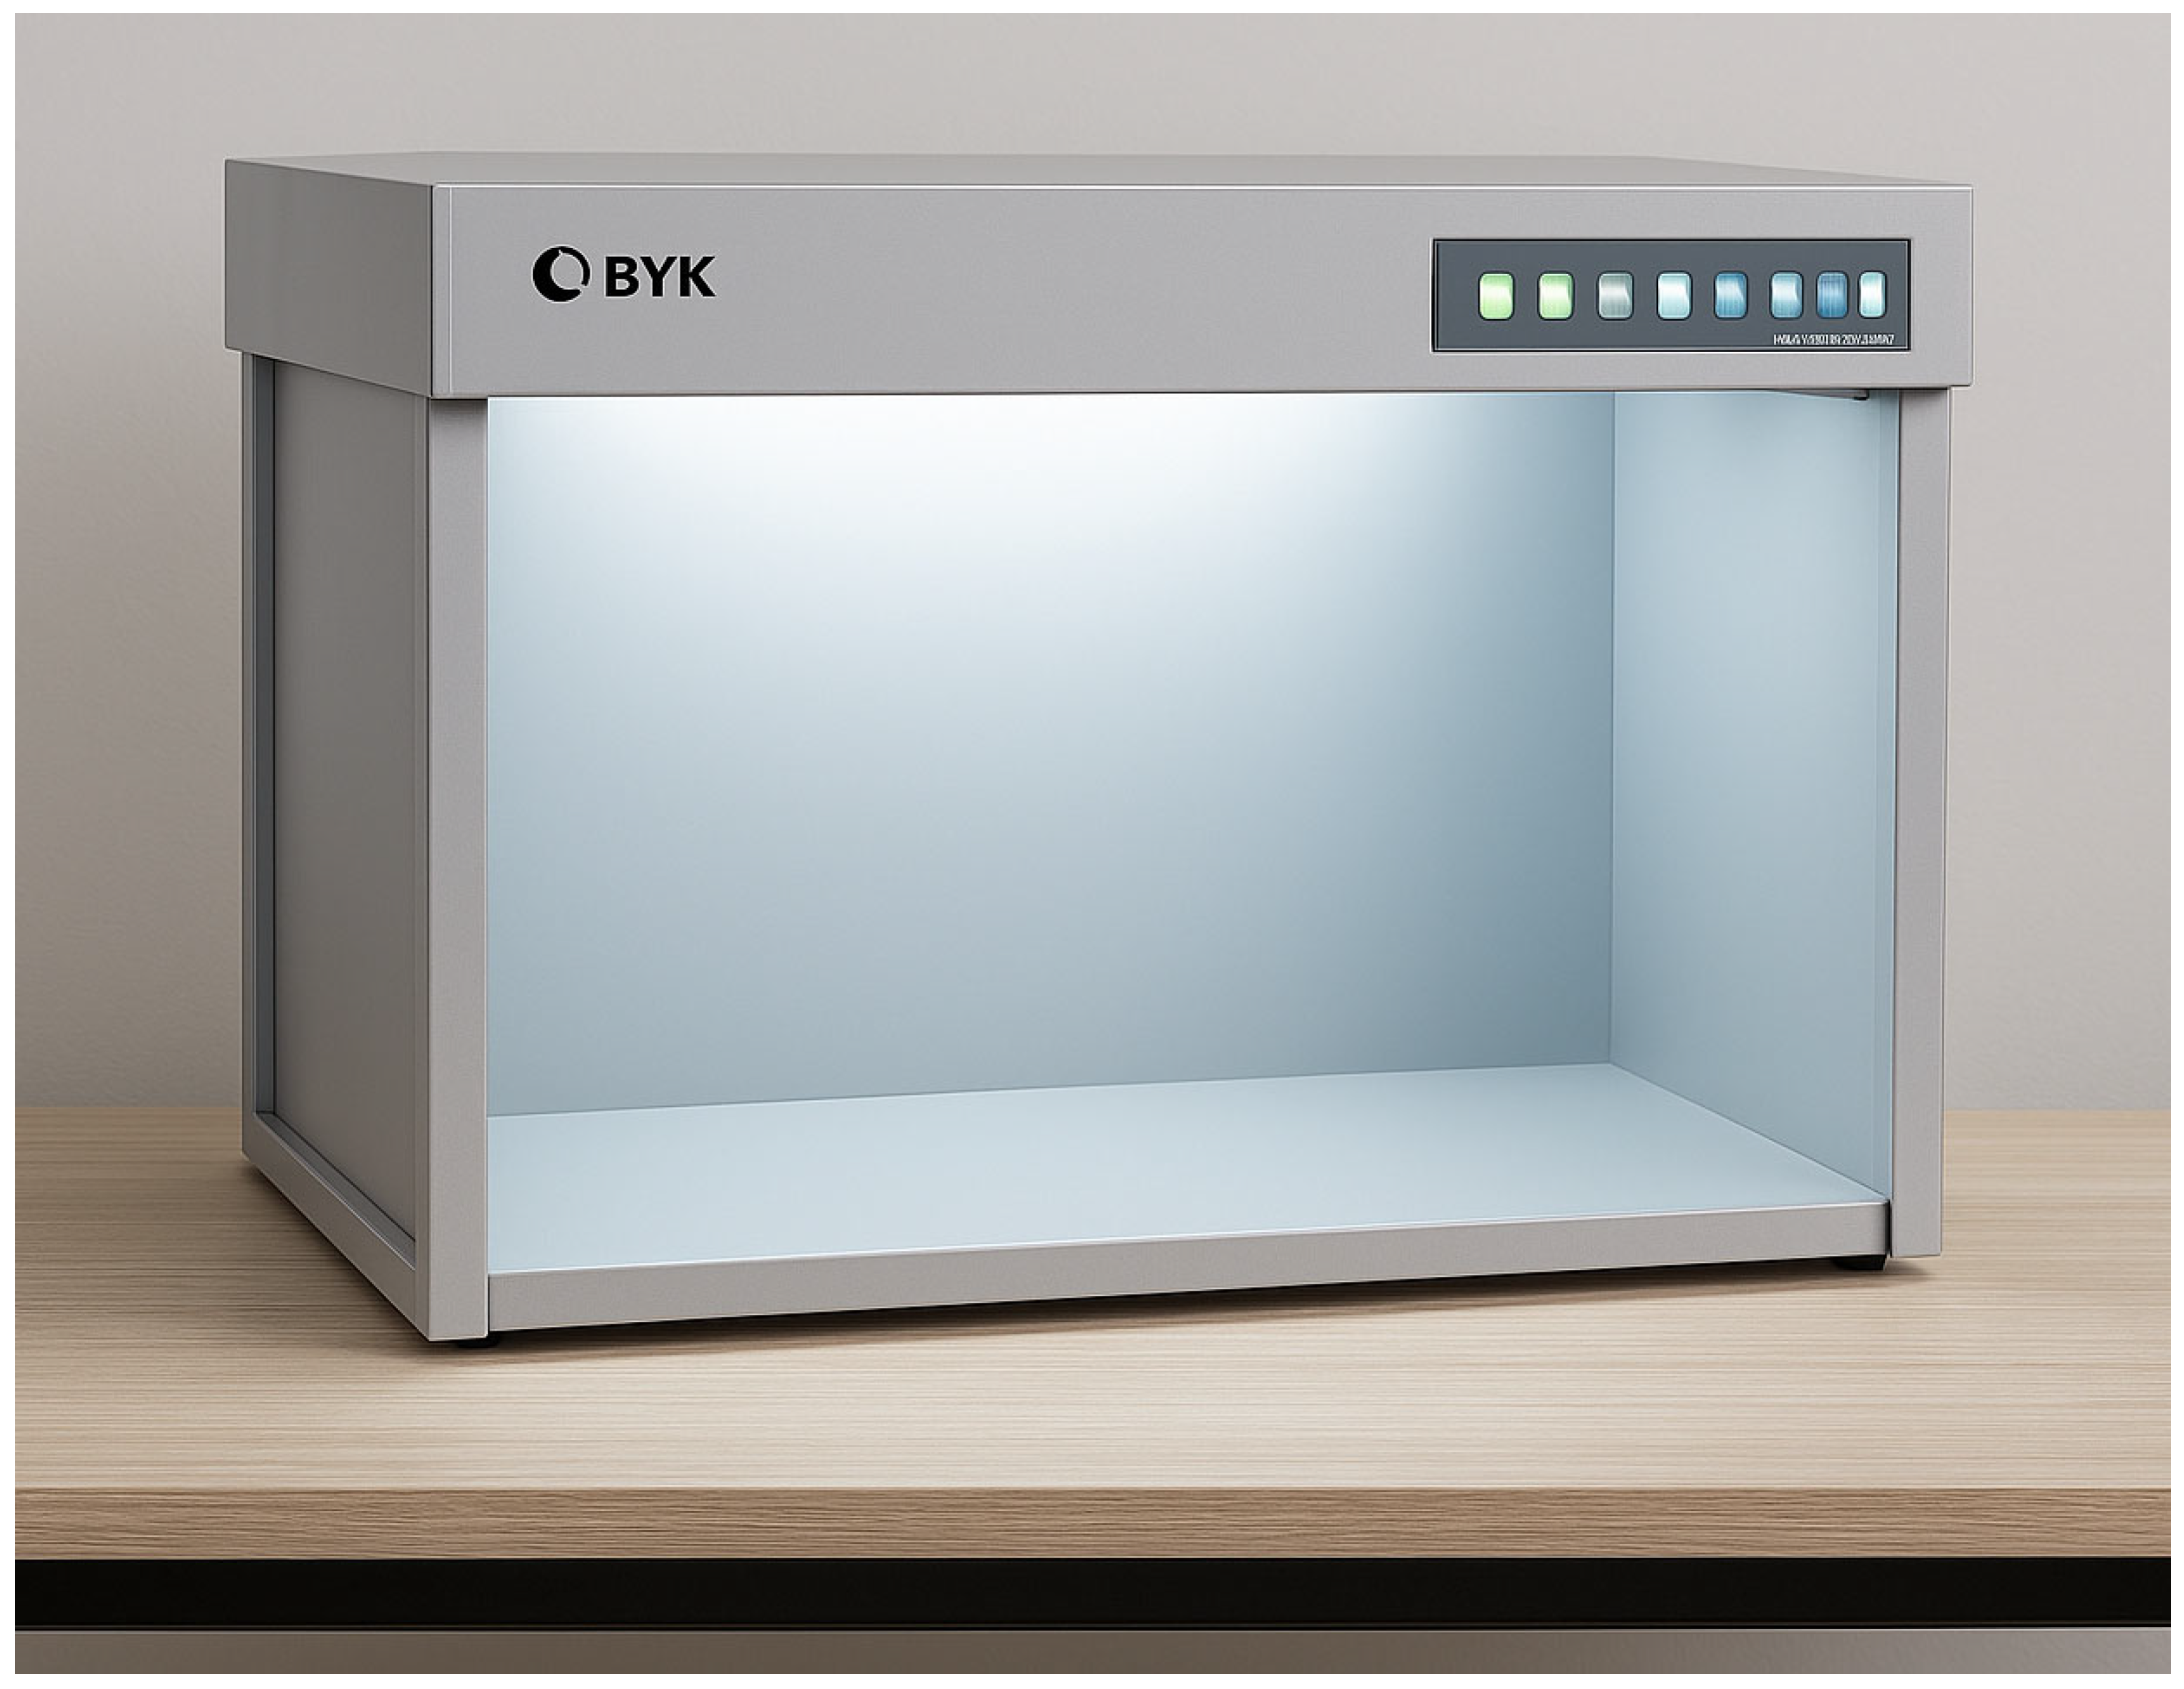
- Light Booth with controlled light sources;
- Black pad background to reduce ambient reflections;
- Stand or fixed position for the luxmeter;
- Textile sample with reflective properties.
- Daylight D65 (Class B)—a standard light source simulating natural daylight with a color temperature of approximately 6500 K, used in colorimetry for visual assessment of materials.
- Incandescent light A—traditional incandescent lighting with a warm yellow-orange spectrum (~2856 K), commonly used for testing in home environments or streetlights.
- Department store light CWF—cool white fluorescent light (~4150 K), widely used in stores and offices.
- Department store light TL84—neutral “warm” fluorescent light (~4000 K), commonly found in European commercial establishments.
2.3. Statistical Analysis
3. Results and Discussion
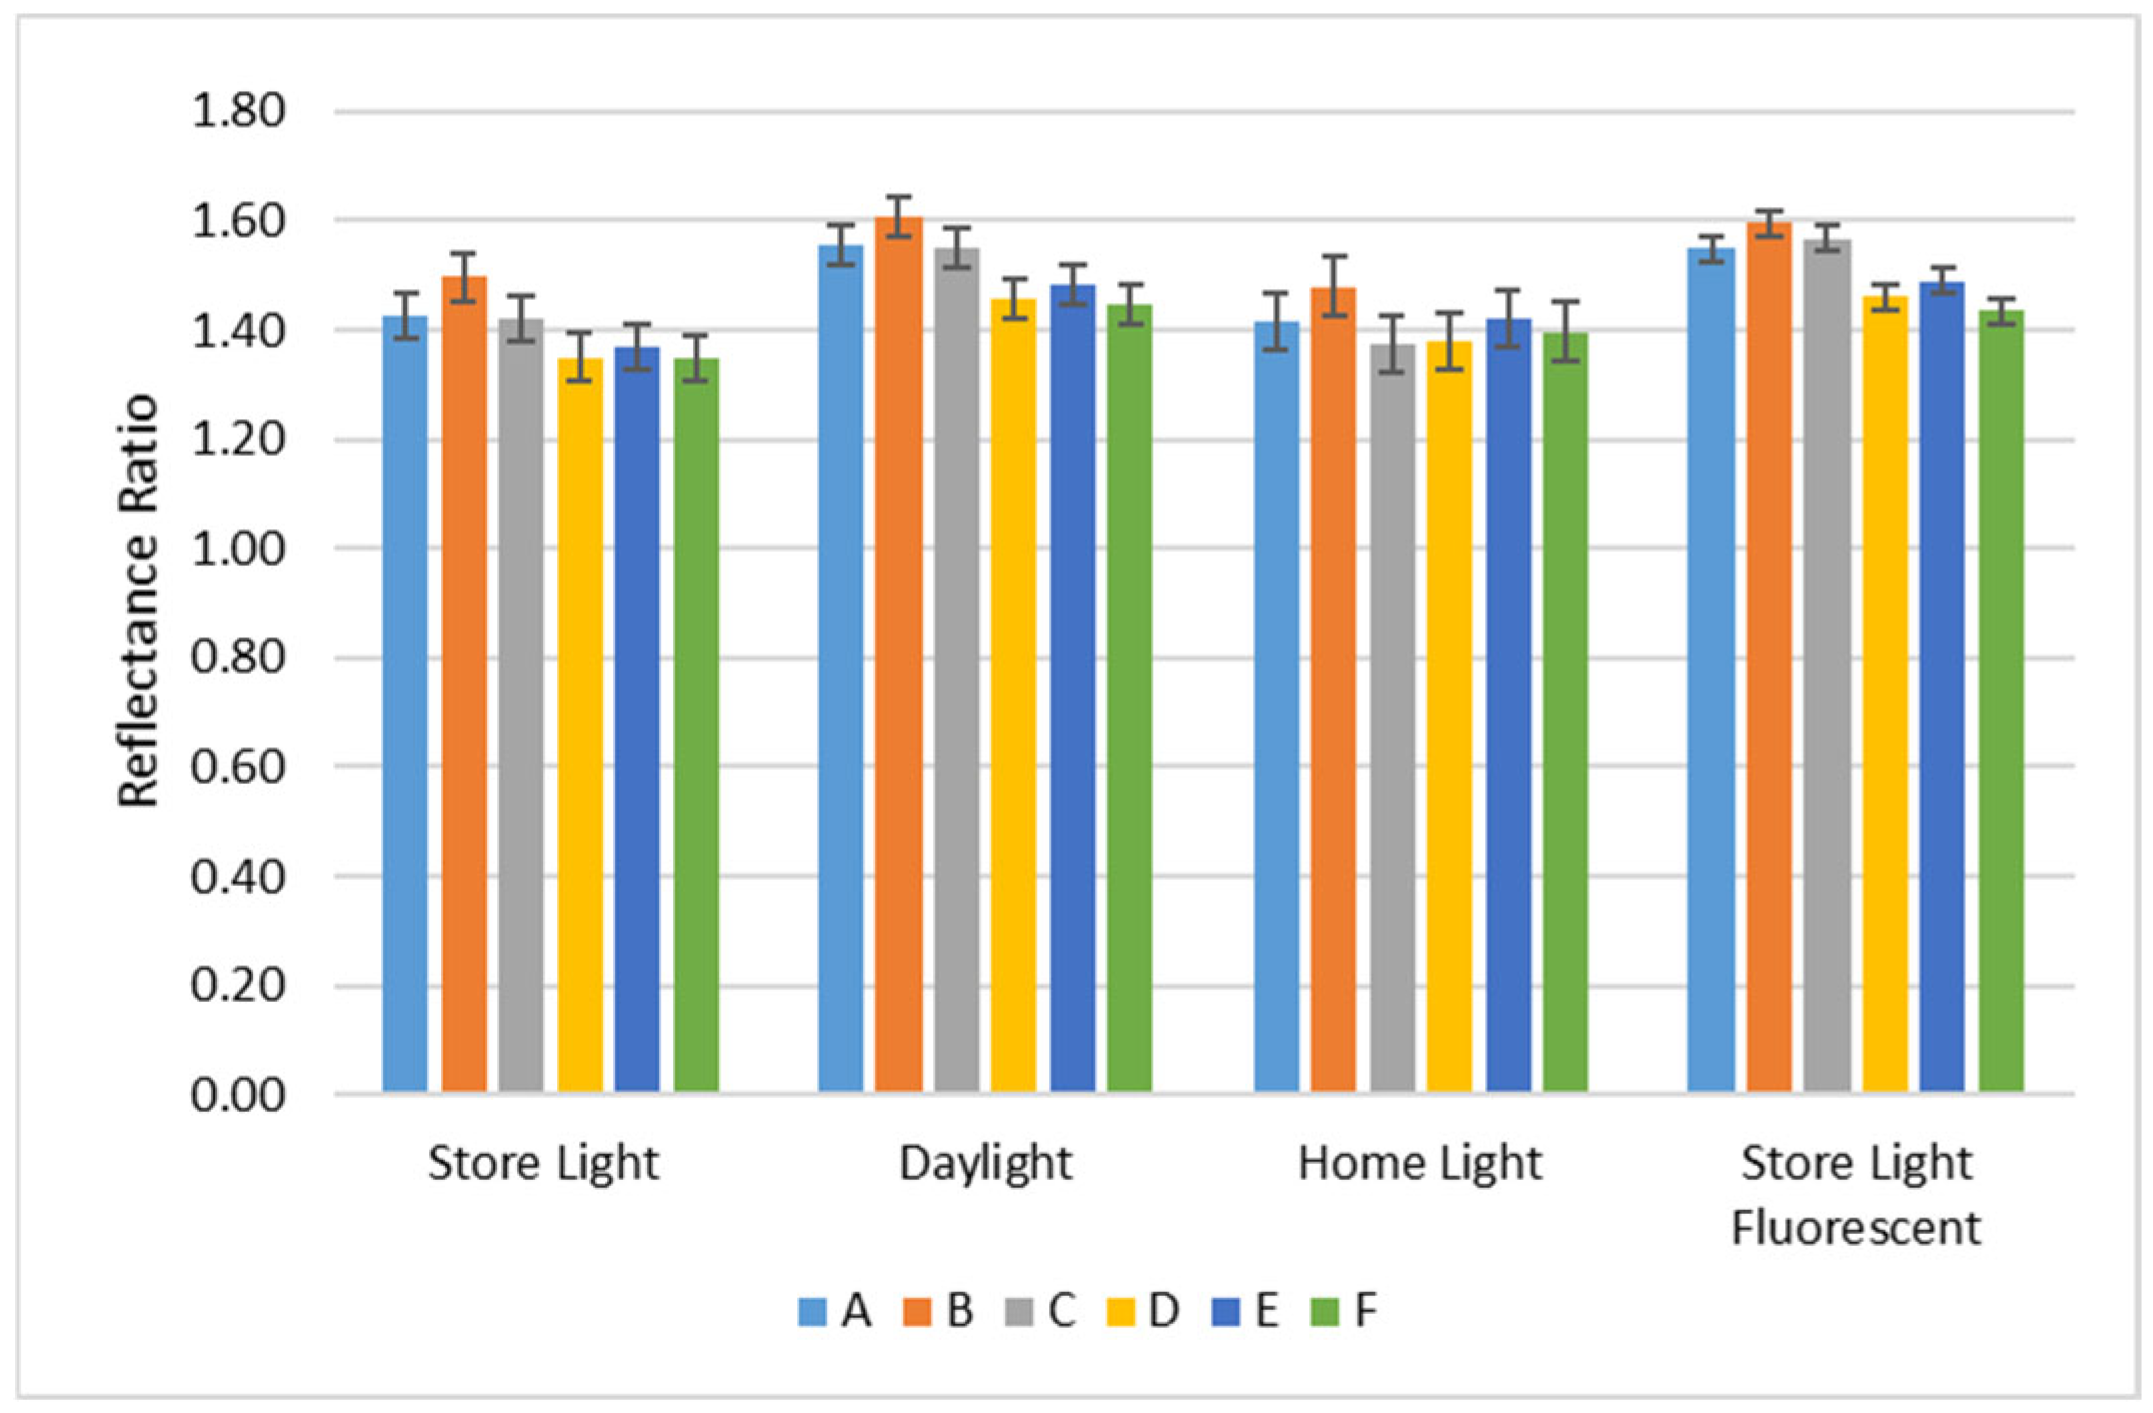
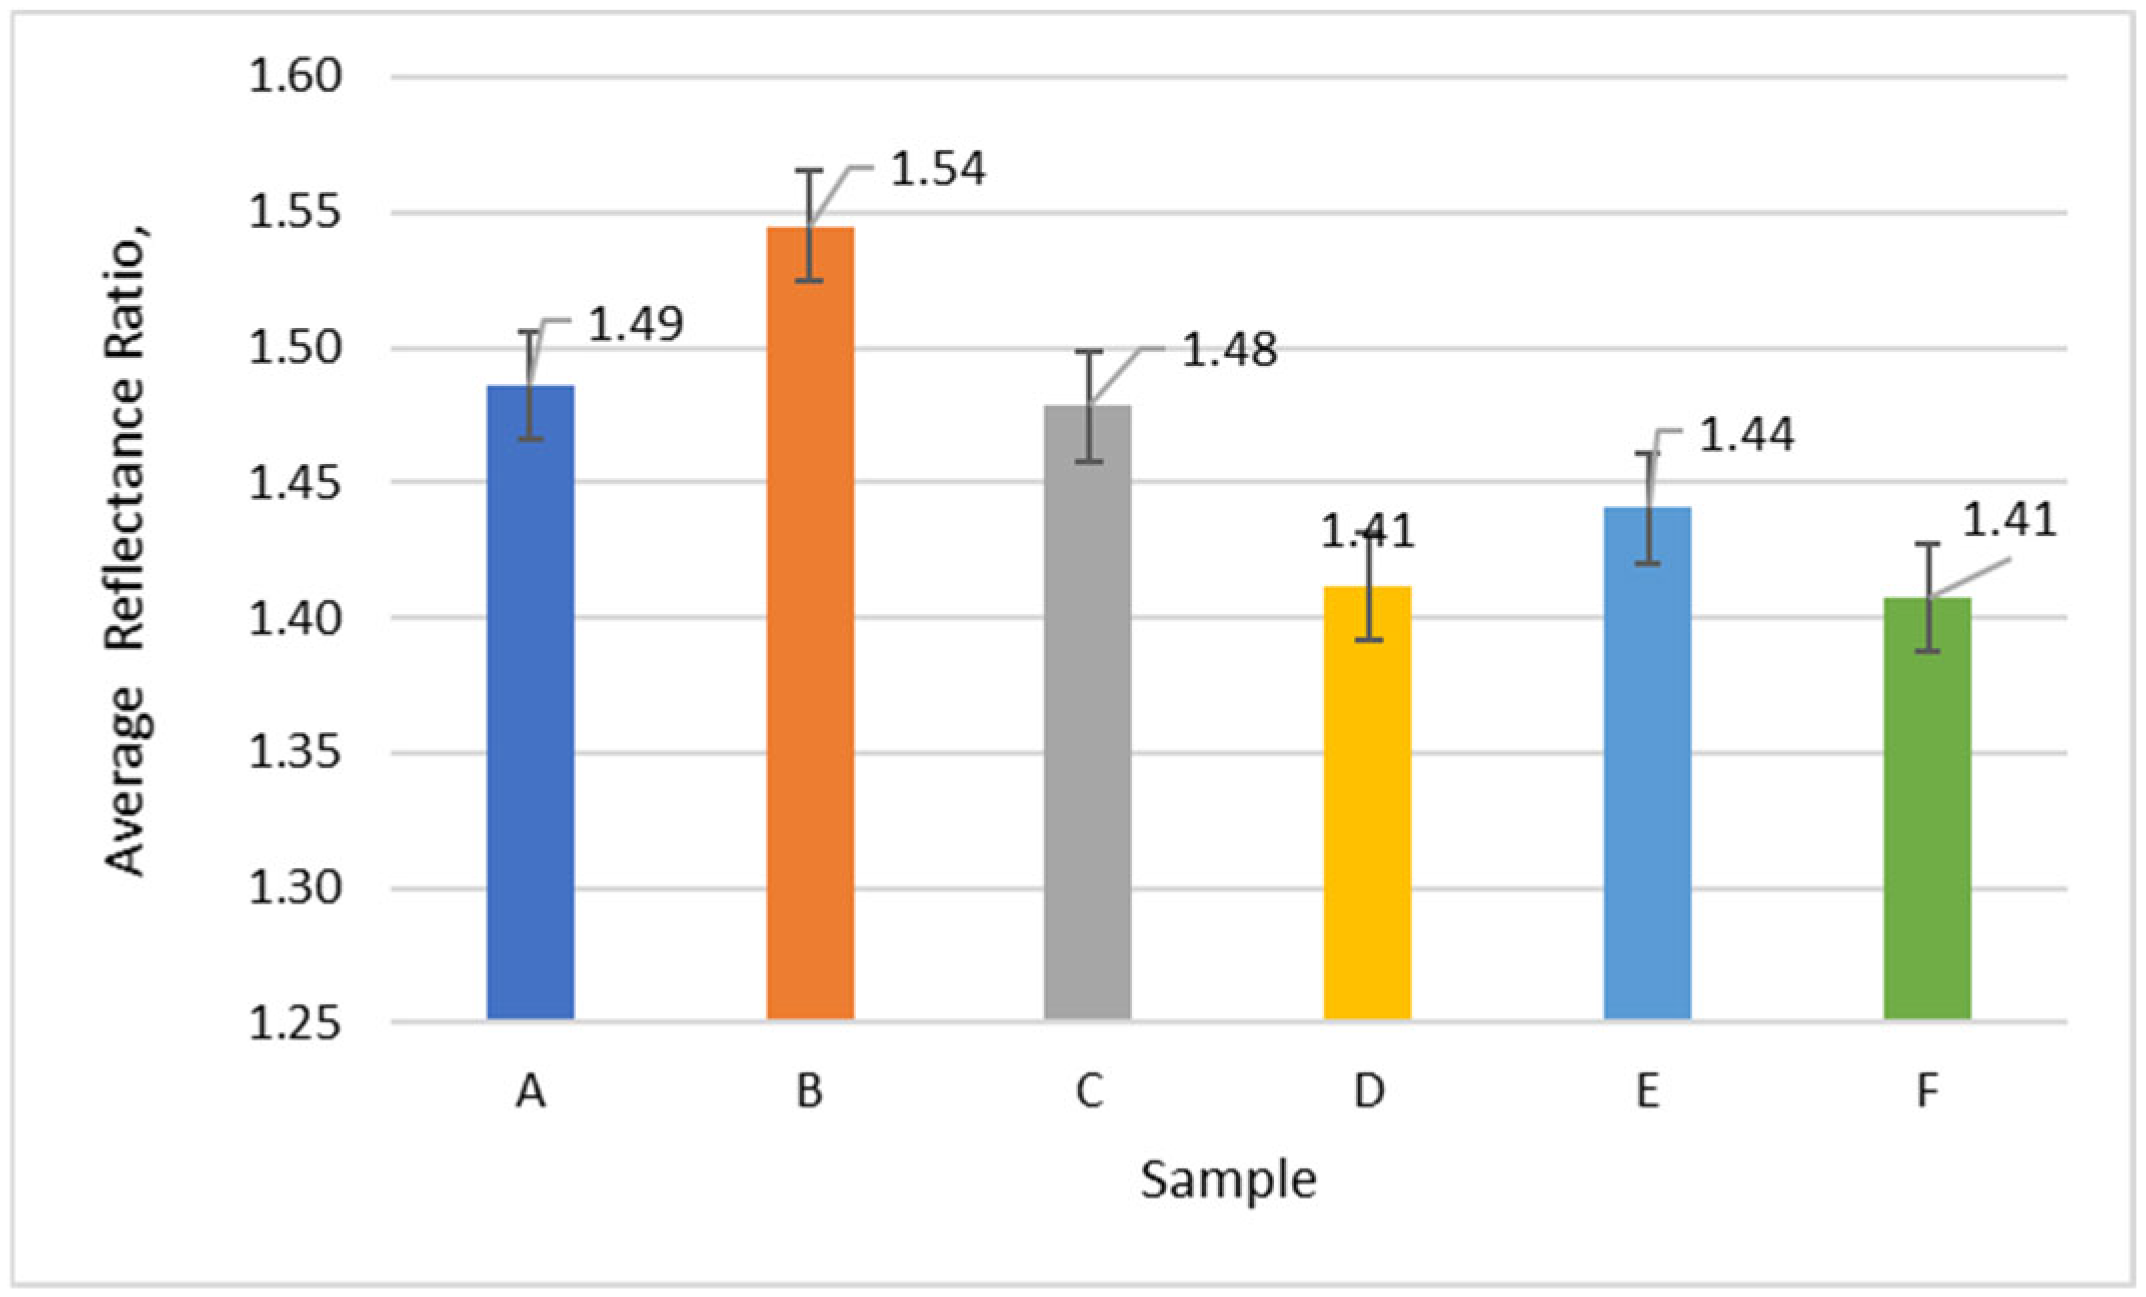
3.1. Reflectance Ratio
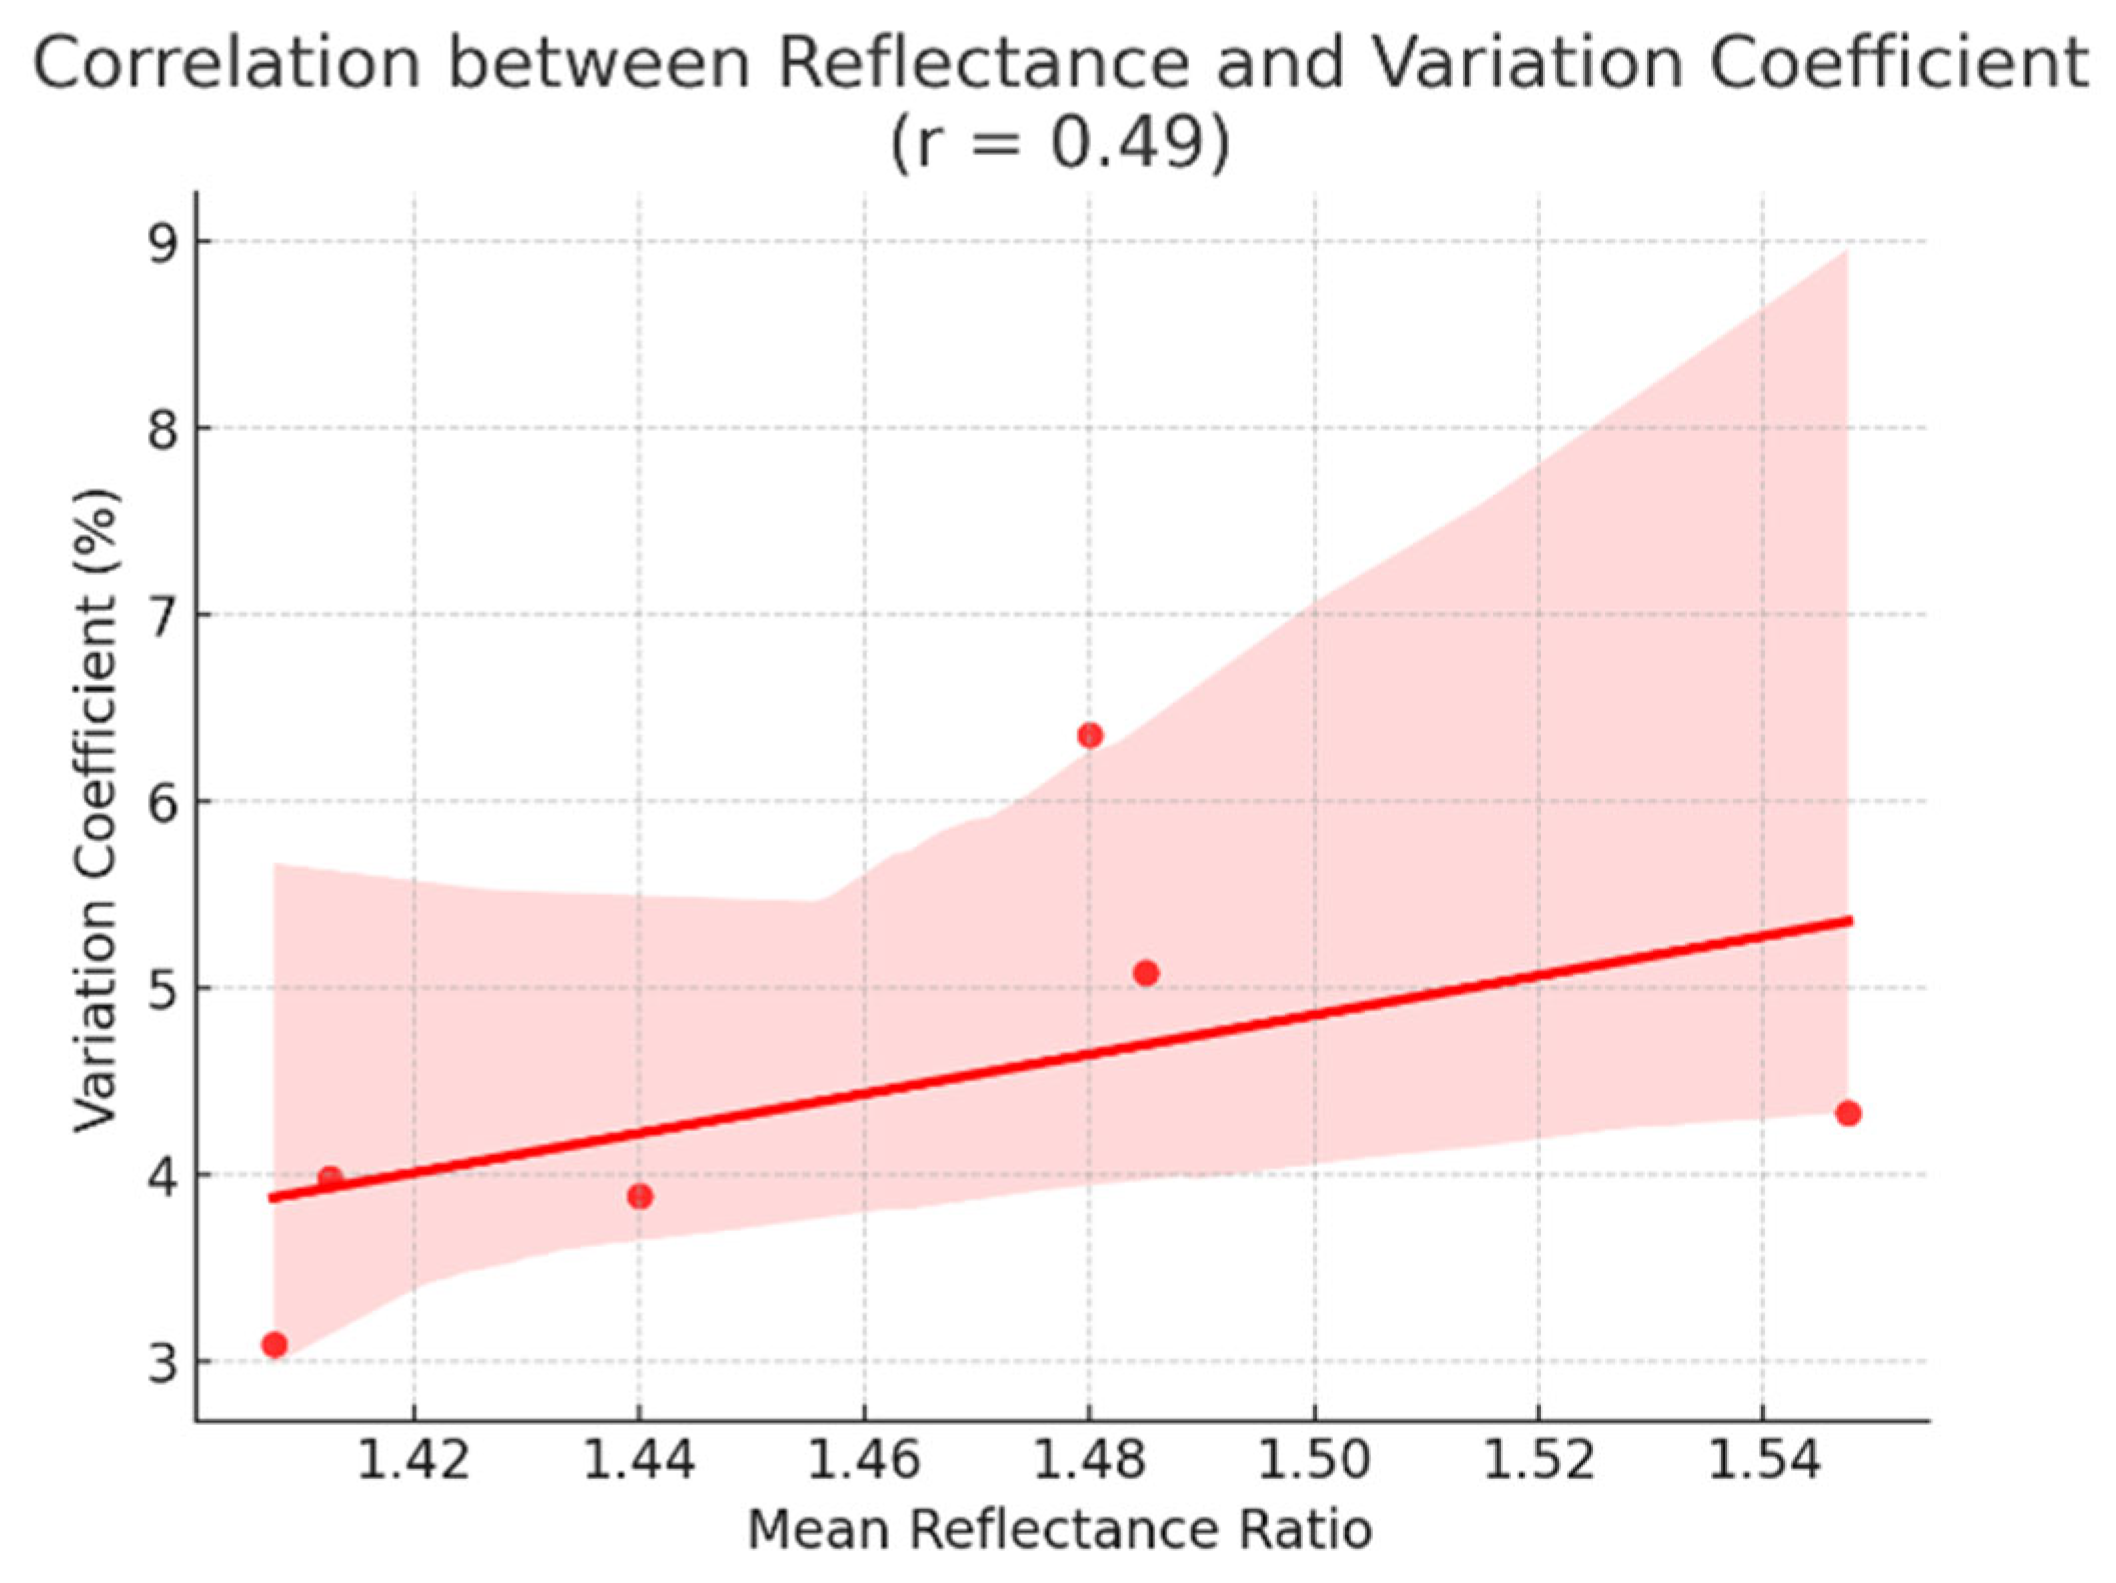
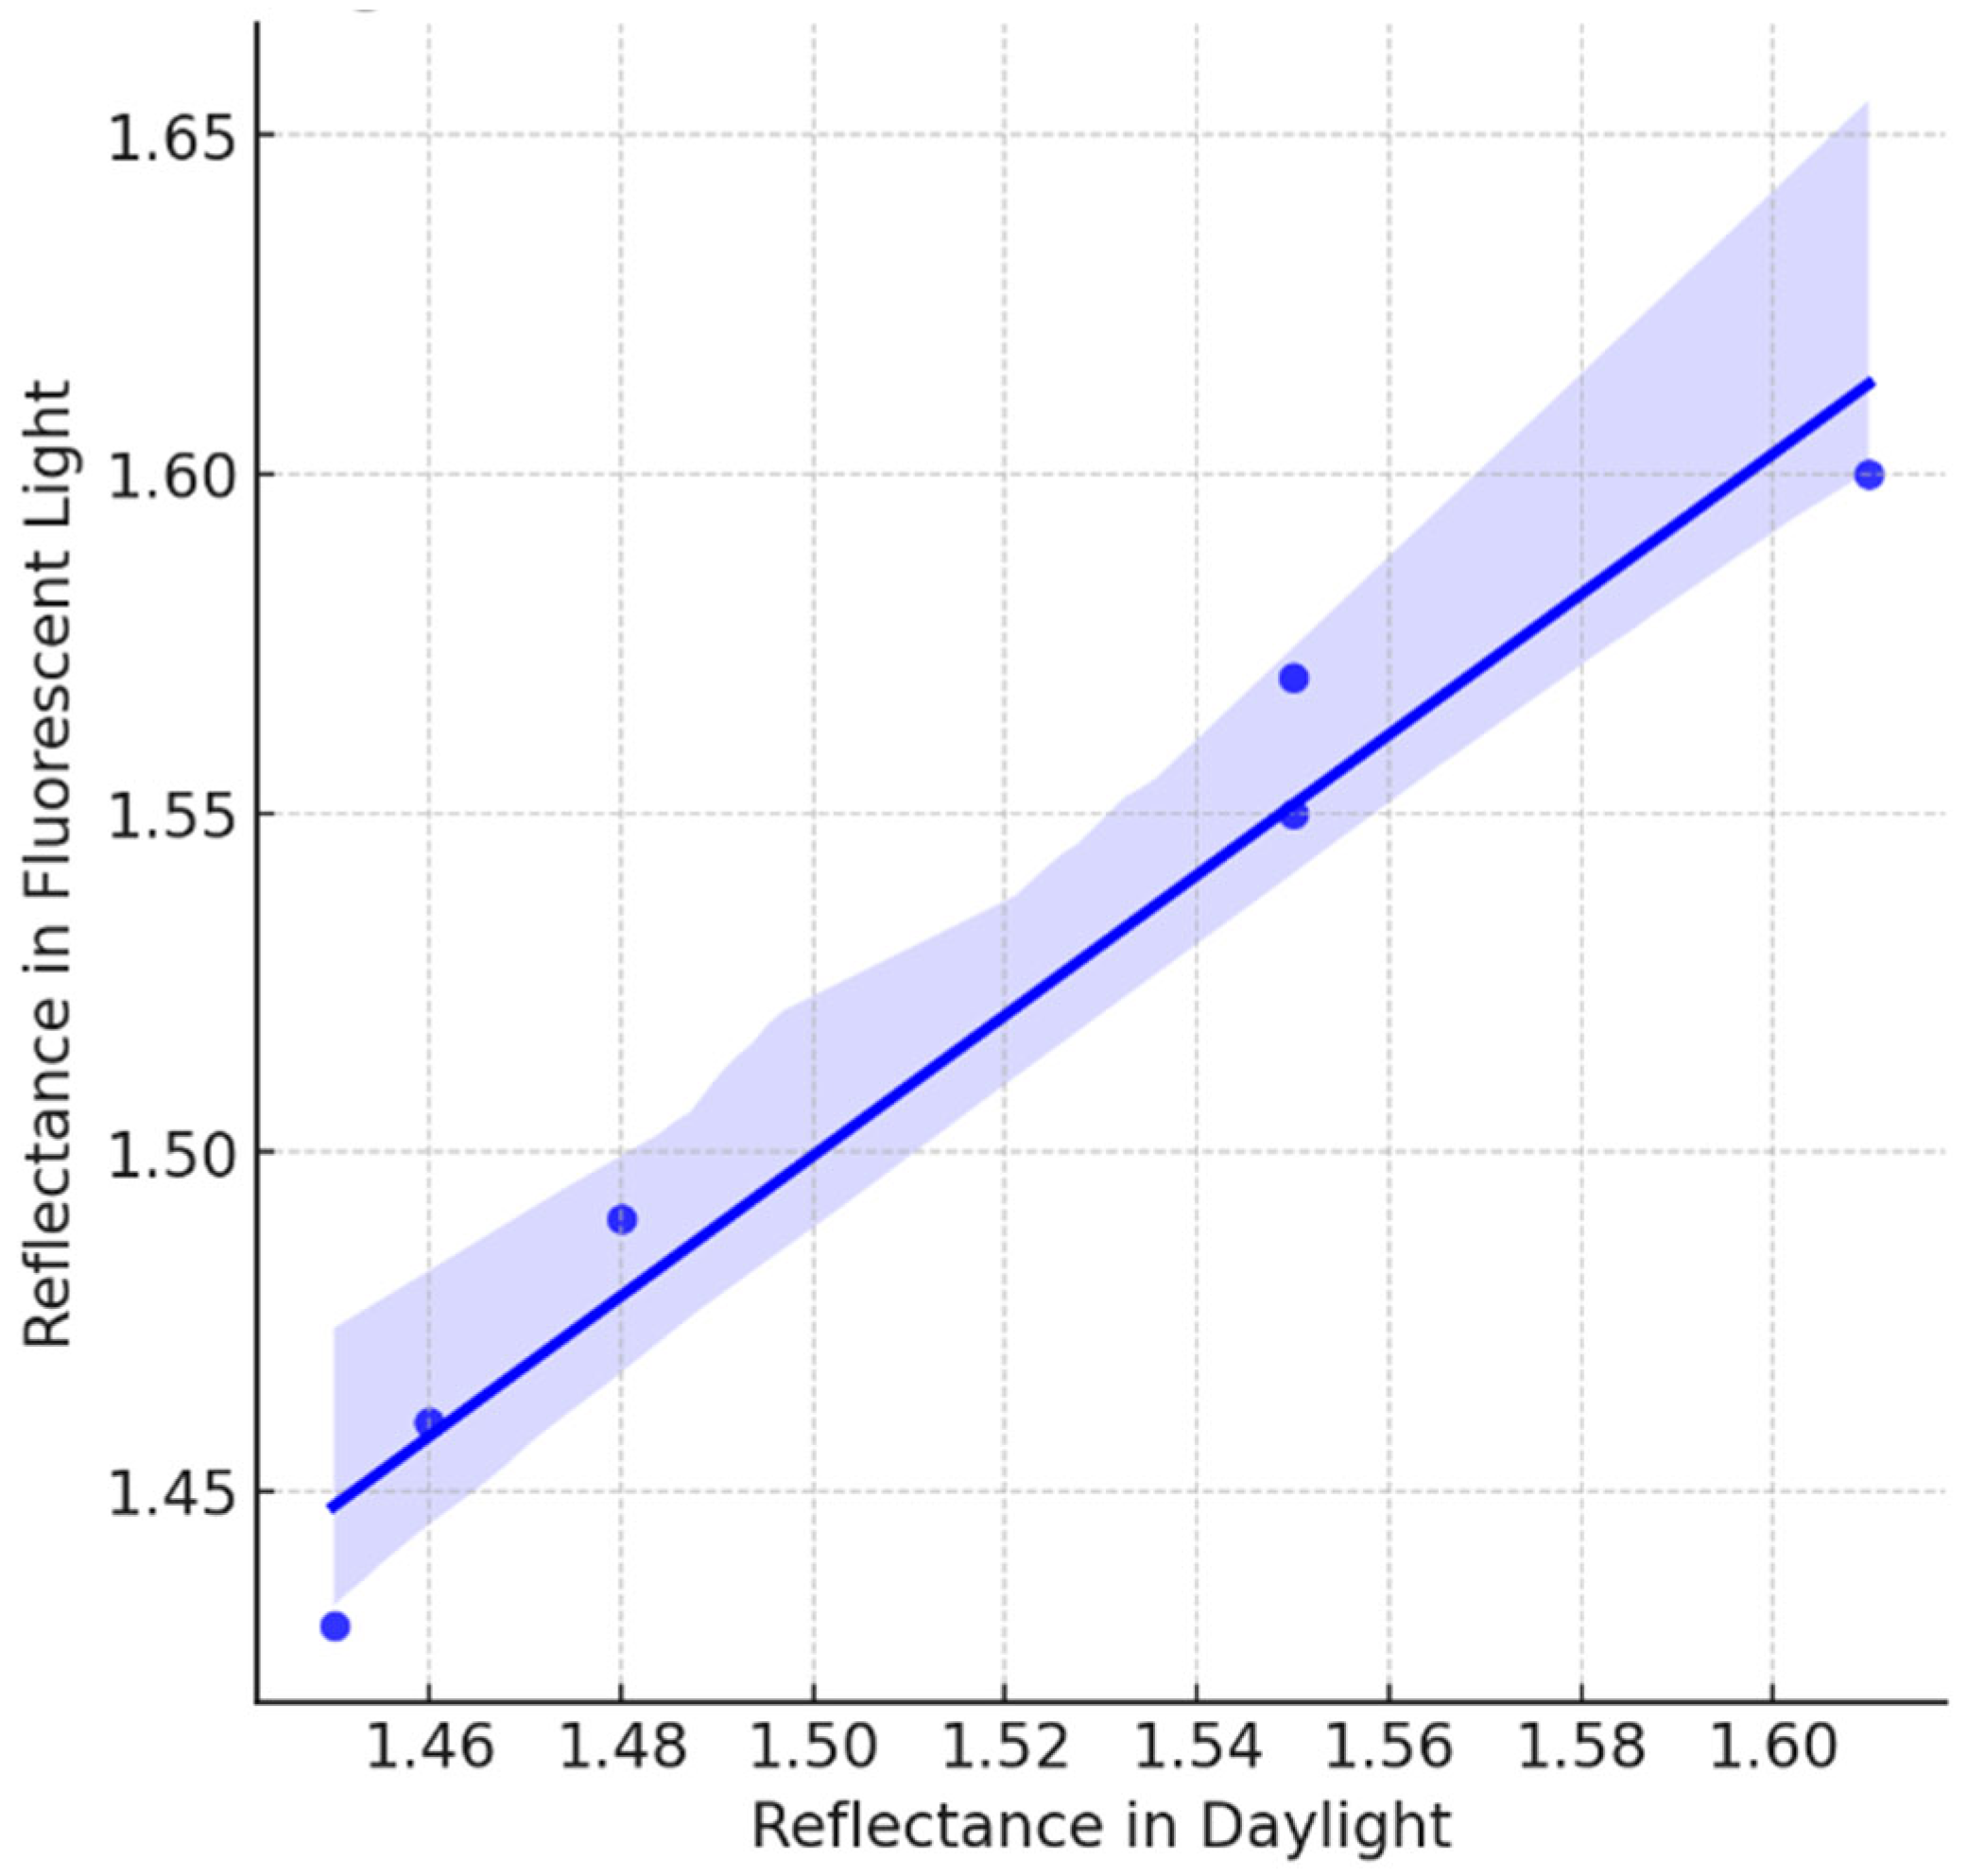
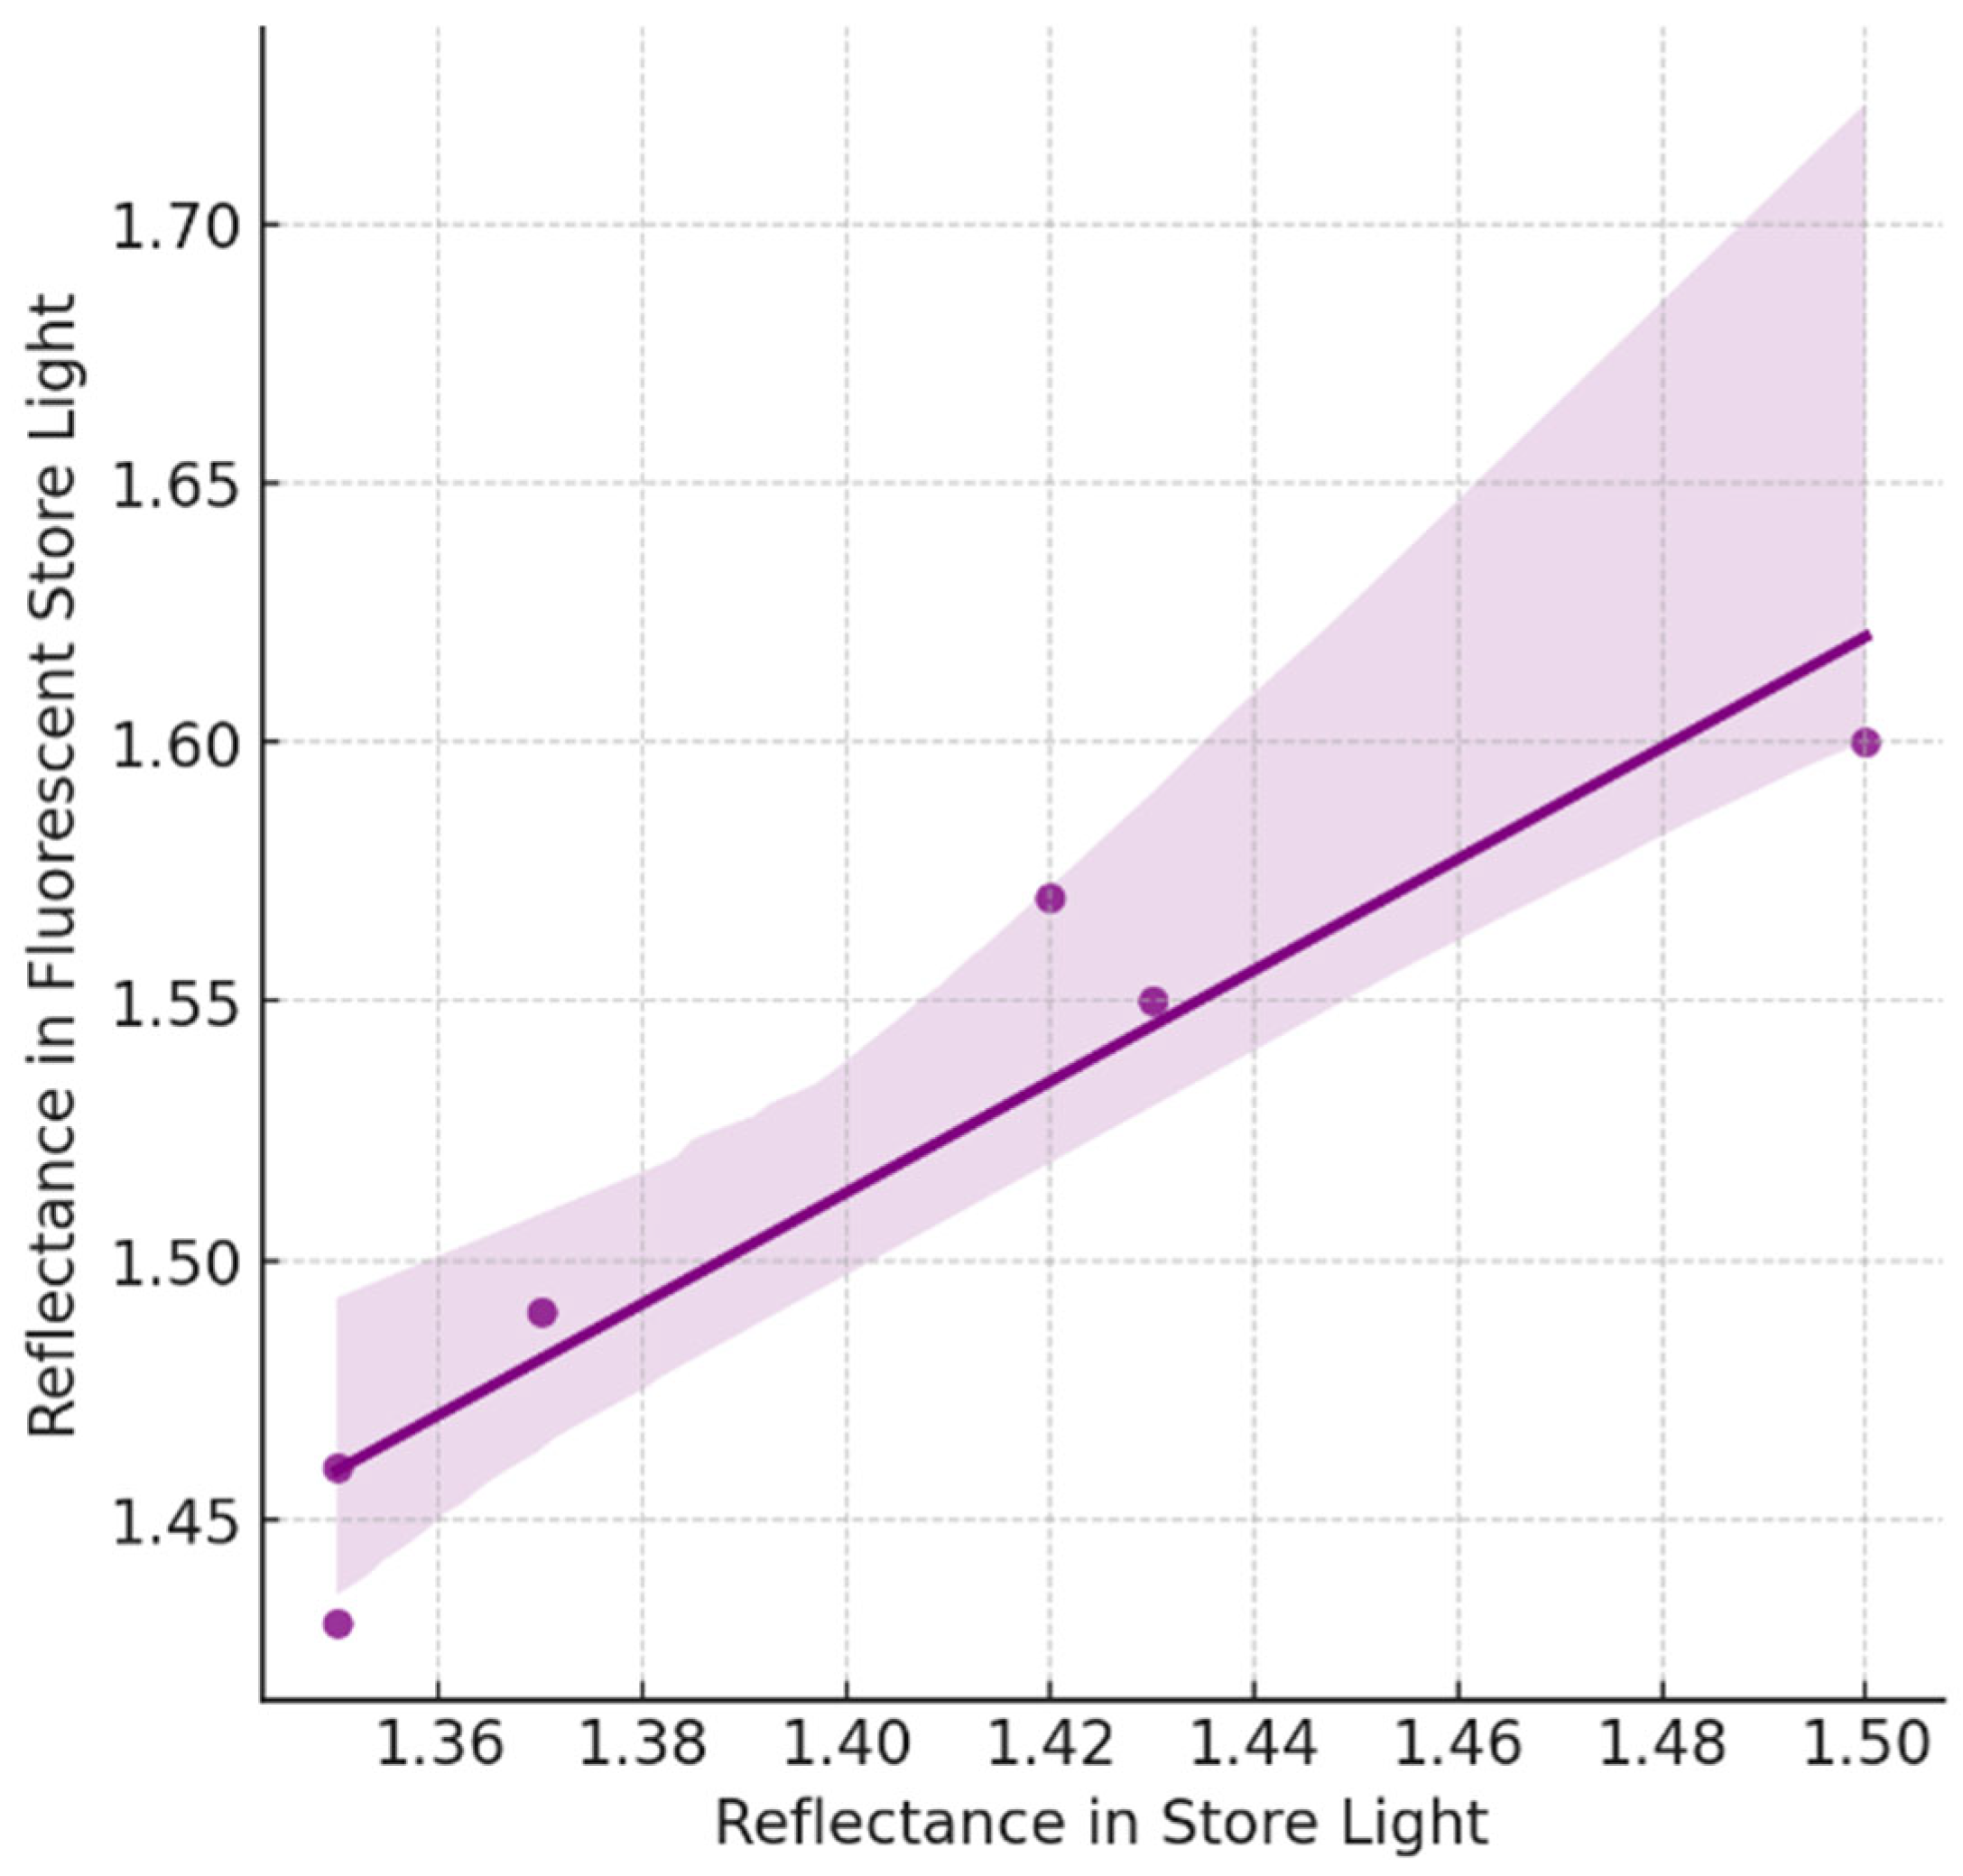
3.2. Correlation Analysis
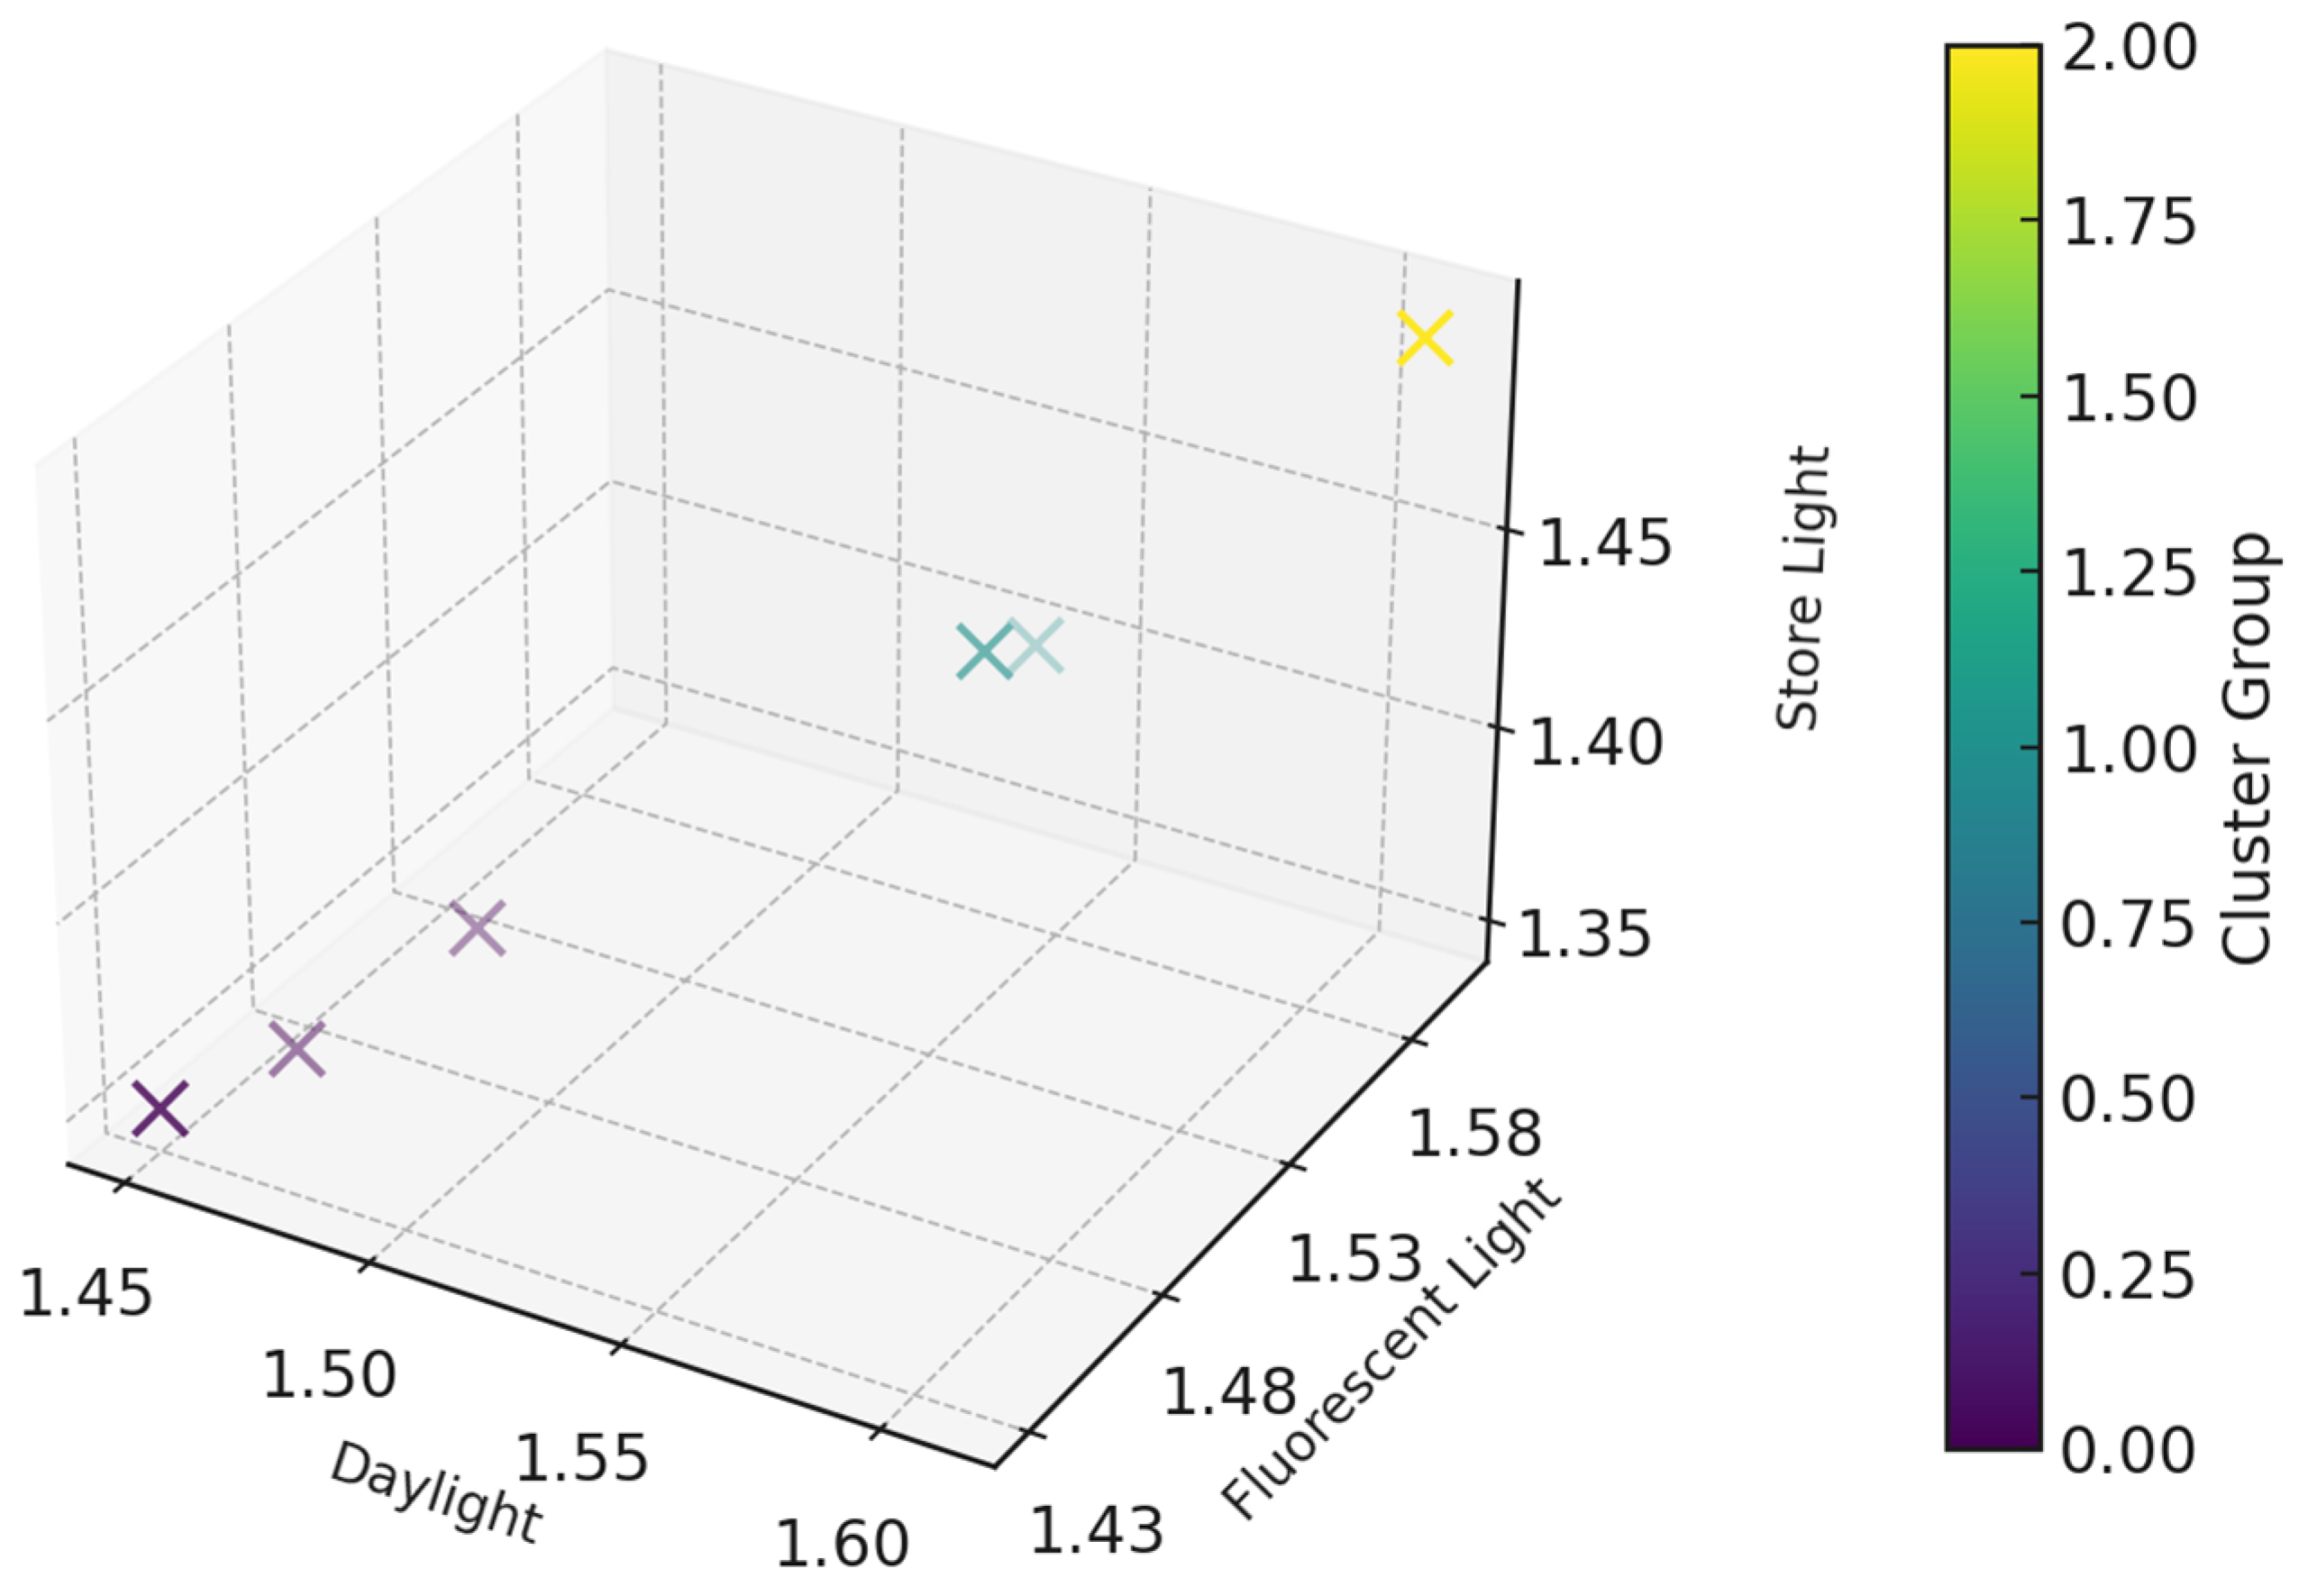
3.3. Cluster Analysis
- Purple dots (Cluster 0) represent the samples with low reflectivity under all conditions. These are samples D, E, and F.
- Blue dots (Cluster 1) are samples with medium reflectivity. These include samples A and C.
- The yellow dot (Cluster 2) illustrates the most reflective sample B.
3.4. Summarizing Discussion
3.5. Measurement Repeatability and Uncertainty
- The use of a lux meter inside a photometric chamber with controlled lighting sources;
- Measurements conducted against a fixed black background;
- Calculation of the reflectance ratio relative to the reference black surface.
3.6. Plans for Future Research
4. Conclusions
Author Contributions
Funding
Data Availability Statement
Conflicts of Interest
References
- Maity, S.; Singha, K.; Pandit, P. Introduction to functional and technical textiles. In Functional and Technical Textiles; Woodhead Publishing: New Delhi, India, 2023; pp. 1–30. [Google Scholar]
- Sun, Y. Spectral measurement and data processing of textile surface reflection. Res. J. Text. Appar. 2007, 11, 1–30. [Google Scholar] [CrossRef]
- Seidu, R.K.; Sun, L.; Jiang, S. A systematic review on retro-reflective clothing for night-time visibility and safety. J. Text. Inst. 2024, 115, 1138–1150. [Google Scholar] [CrossRef]
- Bettermann, I.; Löcken, H.; Greb, C.; Gries, T.; Oses, A.; Pauw, J.; Datashvili, L. Review and evaluation of warp-knitted patterns for metal-based large deployable reflector surfaces. CEAS Space J. 2023, 15, 477–493. [Google Scholar] [CrossRef]
- Yang, J.; Ikeuchi, K. A rendering method for woven clothes reflections. Comput. Vis. Image Media (CVIM-140) 2003, 88, 33–40. [Google Scholar]
- Seidu, R.K.; Jiang, S. Functional performance of thin Ag, SS, and Ti films on retro-reflective fabrics. J. Text. Inst. 2024, 115, 781–790. [Google Scholar] [CrossRef]
- Seidu, R.K.; Jiang, S. Analysis of performance properties of retro-reflective woven fabrics made with retro-reflective yarns and natural yarns. Text. Res. J. 2024, 94, 533–551. [Google Scholar] [CrossRef]
- Heider, E.C.; Stucki, C.; Hill, T.; Bell-Hunley, C.; Campiglia, A.D.; Harper, J.K. Activity for examining light reflectance, transmittance, and absorbance with textiles and light-emitting diodes. J. Chem. Educ. 2024, 101, 1325–1331. [Google Scholar] [CrossRef]
- Brittain, H.G. UV/Vis reflectance spectroscopy. In Spectroscopy of Pharmaceutical Solids; CRC Press: Boca Raton, FL, USA, 2006; pp. 141–170. [Google Scholar]
- Periyasamy, A.P.; Vikova, M.; Vik, M. A review of photochromism in textiles and its measurement. Text. Prog. 2017, 49, 53–136. [Google Scholar] [CrossRef]
- Hill, B.; Roger, T.; Vorhagen, F.W. Comparative analysis of the quantization of color spaces on the basis of the CIELAB color-difference formula. ACM Trans. Graph. (TOG) 1997, 16, 109–154. [Google Scholar] [CrossRef]
- Gómez-Polo, C.; Muñoz, M.P.; Luengo, M.C.L.; Vicente, P.; Galindo, P.; Casado, A.M.M. Comparison of the CIELab and CIEDE2000 color difference formulas. J. Prosthet. Dent. 2016, 115, 65–70. [Google Scholar] [CrossRef]
- O’Neill, C.; Hawkes, F.R.; Hawkes, D.L.; Lourenço, N.D.; Pinheiro, H.M.; Delée, W. Colour in textile effluents—Sources, measurement, discharge consents and simulation: A review. J. Chem. Technol. Biotechnol. Int. Res. Process Environ. Clean Technol. 1999, 74, 1009–1018. [Google Scholar] [CrossRef]
- Goodpaster, J.V.; Liszewski, E.A. Forensic analysis of dyed textile fibers. Anal. Bioanal. Chem. 2009, 394, 2009–2018. [Google Scholar] [CrossRef] [PubMed]
- Sule, A.D. Computer Colour Analysis: Textile Applications; New Age International: New Delhi, India, 2002. [Google Scholar]
- Workman, J.J. A review of calibration transfer practices and instrument differences in spectroscopy. Appl. Spectrosc. 2018, 72, 340–365. [Google Scholar] [CrossRef] [PubMed]
- Wang, T.; Lee, E.S.; Ward, G.J.; Yu, T. Field validation of data-driven BSDF and peak extraction models for light-scattering fabric shades. Energy Build. 2022, 262, 112002. [Google Scholar] [CrossRef]
- Chen, C.H. Goniophotometer. In Encyclopedia of Color Science and Technology; Springer International Publishing: Cham, Switzerland, 2023; pp. 860–863. [Google Scholar]
- Fiorentin, P.; Scroccaro, A. Analysis of the performance of a goniometer for studying surface reflection. IEEE Trans. Instrum. Meas. 2008, 57, 2522–2527. [Google Scholar] [CrossRef]
- Bergen, T.; Young, R. Fifty years of development of light measurement instrumentation. Light. Res. Technol. 2018, 50, 141–153. [Google Scholar] [CrossRef]
- Barati, B.; Karana, E.; Sekulovski, D.; Pont, S.C. Retail lighting and textiles: Designing a lighting probe set. Light. Res. Technol. 2017, 49, 173–194. [Google Scholar] [CrossRef]
- Workman, J., Jr.; Mark, H. Using Reference Materials, Part II: Photometric Standards; BaySpec, Inc.: San Jose, CA, USA, 2014. [Google Scholar]
- Lopes, B.M.D.C. LED Light Fixtures Efficiency Analysis and Characterization. Master’s Thesis, Coimbra University, Coimbra, Portuguese, 2013. [Google Scholar]
- Oral, O.; Ozdil, N.; Dirgar, E. Investigation of the changes in reflective properties of reflective tapes due to various effects. Ind. Textila 2023, 74, 267–272. [Google Scholar] [CrossRef]
- ISO 20471:2013; High Visibility Clothing—Test Methods and Requirements. International Organization for Standardization: Geneva, Switzerland, 2013. Available online: https://www.iso.org/standard/42832.html (accessed on 7 March 2025).
- ASTM E808-01(2013); Standard Practice for Measuring Photometric Characteristics of Retroreflectors. ASTM International: West Conshohocken, PA, USA, 2013.
- EN 471:2003; High-Visibility Warning Clothing for Professional Use—Test Methods and Requirements. CEN: Brussels, Belgium, 2003. Available online: https://www.en-standard.eu/ (accessed on 7 March 2025).
- Rotzler, S.; Krshiwoblozki, M.V.; Schneider-Ramelow, M. Washability of e-textiles: Current testing practices and the need for standardization. Text. Res. J. 2021, 91, 2401–2417. [Google Scholar] [CrossRef]
- Altaş, S.; Yılmaz, E.; Adman, N. Improving the repetitive washing and abrasion resistance properties of fabrics produced with metallized yarns. J. Ind. Text. 2022, 52, 1528083720942961. [Google Scholar] [CrossRef]
- Synnefa, A.; Santamouris, M.; Livada, I.J.S.E. A study of the thermal performance of reflective coatings for the urban environment. Sol. Energy 2006, 80, 968–981. [Google Scholar] [CrossRef]
- Panda, H. Handbook on Paint Testing Methods; ASIA Pacific Business Press Inc.: New Delhi, India, 2010. [Google Scholar]
- Hu, B.; Li, D.; Ala, O.; Manandhar, P.; Fan, Q.; Kasilingam, D.; Calvert, P.D. Textile-based flexible electroluminescent devices. Adv. Funct. Mater. 2011, 21, 305–311. [Google Scholar] [CrossRef]
- Fei, L.; Zhang, Q.; Deng, Y. Identifying influential nodes in complex networks based on the inverse-square law. Phys. A Stat. Mech. Its Appl. 2018, 512, 1044–1059. [Google Scholar] [CrossRef]
- Tominaga, S.; Wandell, B.A. Standard surface-reflectance model and illuminant estimation. J. Opt. Soc. Am. A 1989, 6, 576–584. [Google Scholar] [CrossRef]
- Wolff, L.B. Generalizing Lambert’s law for smooth surfaces. In Proceedings of the Computer Vision—ECCV’96: 4th European Conference on Computer Vision, Cambridge, UK, 15–18 April 1996; Springer: Berlin/Heidelberg, Germany, 1996; Volume II 4, pp. 40–53. [Google Scholar]
- BYK-Gardner. Operating Manual: Byko-Spectra Standard. Available online: https://www.byk-instruments.com/en/Color-Control/byko-spectra-LightBooth/Cost-effective-light-booths-with-5-Illuminants/c/p-442 (accessed on 12 March 2025).
- Akbarinia, A.; Gegenfurtner, K.R. Color metamerism and the structure of illuminant space. J. Opt. Soc. Am. A 2018, 35, B231–B238. [Google Scholar] [CrossRef]
- Uddin, A.J. Novel technical textile yarns. In Technical Textile Yarns; Woodhead Publishing: Cambridge, UK, 2010; pp. 259–297. [Google Scholar]
- Reinert, G.; Fuso, F.; Hilfiker, R.; Schmidt, E. UV-protecting properties of textile fabrics and their improvement. Text. Chem. Color. 1997, 29, 36. [Google Scholar]


| Sample | Pattern | Simulation Technical Face | Simulation Technical Back | Knitted Samples | Density | |
|---|---|---|---|---|---|---|
| Wales/10 cm | Courses/10 cm | |||||
| A | Single jersey |  | 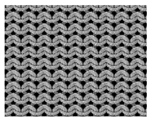 | 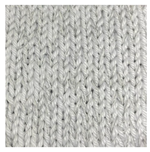 | 26 | 37 |
| B | Single jersey | 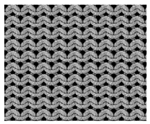 | 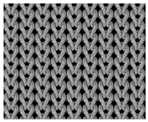 | 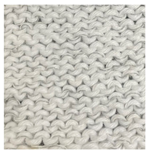 | 26 | 37 |
| C | Purl | 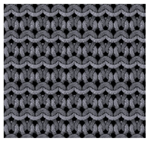 | 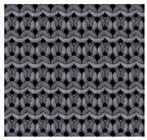 |  | 26 | 26 |
| D | Double jersey |  |  |  | 19 | 30 |
| E | Single jersey with float |  | 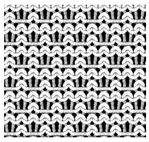 | 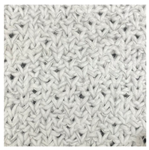 | 22 | 30 |
| F | Modified purl | 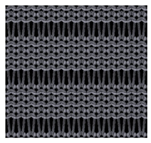 | 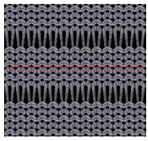 | 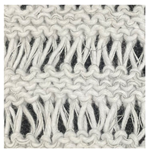 | 26 | 22 |
Disclaimer/Publisher’s Note: The statements, opinions and data contained in all publications are solely those of the individual author(s) and contributor(s) and not of MDPI and/or the editor(s). MDPI and/or the editor(s) disclaim responsibility for any injury to people or property resulting from any ideas, methods, instructions or products referred to in the content. |
© 2025 by the authors. Licensee MDPI, Basel, Switzerland. This article is an open access article distributed under the terms and conditions of the Creative Commons Attribution (CC BY) license (https://creativecommons.org/licenses/by/4.0/).
Share and Cite
Angelova, R.A.; Borisova, E.; Sofronova, D. Advancing Sustainable Textile Metrology: Reflectivity Measurement with Controlled Light Sources. Appl. Sci. 2025, 15, 5305. https://doi.org/10.3390/app15105305
Angelova RA, Borisova E, Sofronova D. Advancing Sustainable Textile Metrology: Reflectivity Measurement with Controlled Light Sources. Applied Sciences. 2025; 15(10):5305. https://doi.org/10.3390/app15105305
Chicago/Turabian StyleAngelova, Radostina A., Elena Borisova, and Daniela Sofronova. 2025. "Advancing Sustainable Textile Metrology: Reflectivity Measurement with Controlled Light Sources" Applied Sciences 15, no. 10: 5305. https://doi.org/10.3390/app15105305
APA StyleAngelova, R. A., Borisova, E., & Sofronova, D. (2025). Advancing Sustainable Textile Metrology: Reflectivity Measurement with Controlled Light Sources. Applied Sciences, 15(10), 5305. https://doi.org/10.3390/app15105305