Article

Research on the Yunnan Large-Leaf Tea Tree Disease Detection Model Based on the Improved YOLOv10 Network and UAV Remote Sensing

1
Wuhan Donghu College, Wuhan 430071, China
2
College of Tea Science, Yunnan Agricultural University, Kunming 650201, China
3
Yunnan Organic Tea Industry Intelligent Engineering Research Center, Yunnan Agricultural University, Kunming 650201, China
*
Authors to whom correspondence should be addressed.
These authors contributed equally to this work.
Appl. Sci. 2025, 15(10), 5301; https://doi.org/10.3390/app15105301
Submission received: 24 March 2025 / Revised: 30 April 2025 / Accepted: 8 May 2025 / Published: 9 May 2025
(This article belongs to the Section Agricultural Science and Technology)

Abstract

:
In response to issues such as low resolution, severe occlusion, and insufficient fine-grained feature extraction in tea plantation disease detection, this study proposes an improved YOLOv10 network based on low-altitude unmanned aerial vehicle remote sensing for the detection of diseases in Yunnan large-leaf tea trees. Through the use of a Shape-IoU optimized loss function, a Wavelet Transform Convolution to enhance the network’s Backbone, and a Histogram Transformer to optimize the network’s Neck, the detection accuracy and localization precision of disease targets were significantly improved. Through testing of common diseases, the research results indicate that, for the improved YOLOv10 network, the Box Loss, Cls Loss, and DFL Loss were reduced by 15.94%, 13.16%, and 8.82%, respectively, in the One-to-Many Head, and by 14.58%, 17.72%, and 8.89%, respectively, in the One-to-One Head. Compared to the original YOLOv10 network, precision, recall, and F1 increased by 3.4%, 10.05%, and 6.75%, respectively. The improved YOLOv10 network not only effectively addresses phenomena such as blurry images, complex backgrounds, strong illumination, and occlusion in disease detection, but also demonstrates high levels of precision and recall, thereby providing robust technological support for precision agriculture and decision-making, and to a certain extent promoting the development of agricultural modernization.

1. Introduction

In the context of continuously changing global environments, abnormal weather has become increasingly frequent, exacerbating the occurrence of plant diseases [1]. During the growth process of Yunnan large-leaf tea trees, the occurrence of diseases not only leads to the loss of nutrients within the plant but also affects the metabolism and the proportion of important substances, thereby resulting in reduced yield, diminished quality, and increased food safety risks [2,3]. Currently, tea cultivation disease detection primarily relies on on-site inspections by experts and technical personnel; however, this method incurs high training costs, long time investments, and suffers from inefficiencies and high subjectivity [4,5]. Therefore, how to quickly and accurately obtain tea cultivation disease information has become a critical issue that urgently needs to be addressed in tea production [6].
In recent years, with the rapid development of computer technology, the application of deep learning in the field of agriculture has become more and more extensive, which has brought new opportunities and solutions for the detection of tea diseases. To accurately detect plant diseases, Sheng Yu et al. designed an innovative Transformer module for the detection and classification of plant diseases. In this algorithm, Transformer architecture is used to model long-distance features, and soft split token embedding is used to capture local information in surrounding pixels and blocks. Finally, accuracy values of 99.94%, 99.22%, 86.89%, and 77.54% were achieved on VillagePlant, ibean, AI2018, and PlantDoc, respectively [7].
Sapna Nigam et al. proposed a wheat disease identification model based on EfficientNet architecture to automatically detect major wheat rusts. The test results show that the fine-tuned EfficientNet B4 model achieves 99.35% accuracy on the WheatRust21 dataset [8].
Enlin Li et al. used DenseNet121 as the primary feature extraction network and combined multiple dilated modules with a convolutional block attention module to construct the multi-dilated-CBAM-DenseNet model for the recognition of maize leaf diseases. Tested on the PlantVillage dataset and the authors’ self-built dataset, the model achieved an accuracy of 98.84% on small samples [9].
Compared to traditional manual detection methods, these deep learning-based disease detection approaches not only significantly enhance efficiency and reduce costs but also minimize human interference, thereby improving the objectivity and accuracy of the detection results [10]. However, existing technologies still have significant limitations when faced with detection scenarios in tea cultivations where the distribution density is low and disease sizes are small. In particular, there remains further room for optimization in detection efficiency and coping with complex environments.
To address the above issues and achieve efficient and flexible tea cultivation disease detection, this study focuses on common diseases such as coal disease, anthracnose, and leaf blight. Low-altitude UAV (unmanned aerial vehicle) remote sensing technology was used to collect disease data in tea cultivations, obtaining high-spatial-resolution and high-temporal-resolution disease remote sensing images [11,12]. To resolve detection errors caused by overlapping and occlusion of diseases, a Shape-IoU is applied to optimize the Bounding Box Regression Loss of the YOLOv10 (You Only Look Once version 10) network. In response to the weak response of traditional convolutions to low-frequency information and the high computational complexity of large-kernel convolutions, the YOLOv10 network’s Backbone is optimized using Wavelet Transform Convolution. To simultaneously accommodate local details and global background information, a Histogram Transformer is introduced for network optimization. This study aims to provide an efficient, flexible, and highly adaptable technical solution for the detection of agricultural crop diseases, thereby promoting the development of agricultural monitoring systems.

2. Materials and Methods

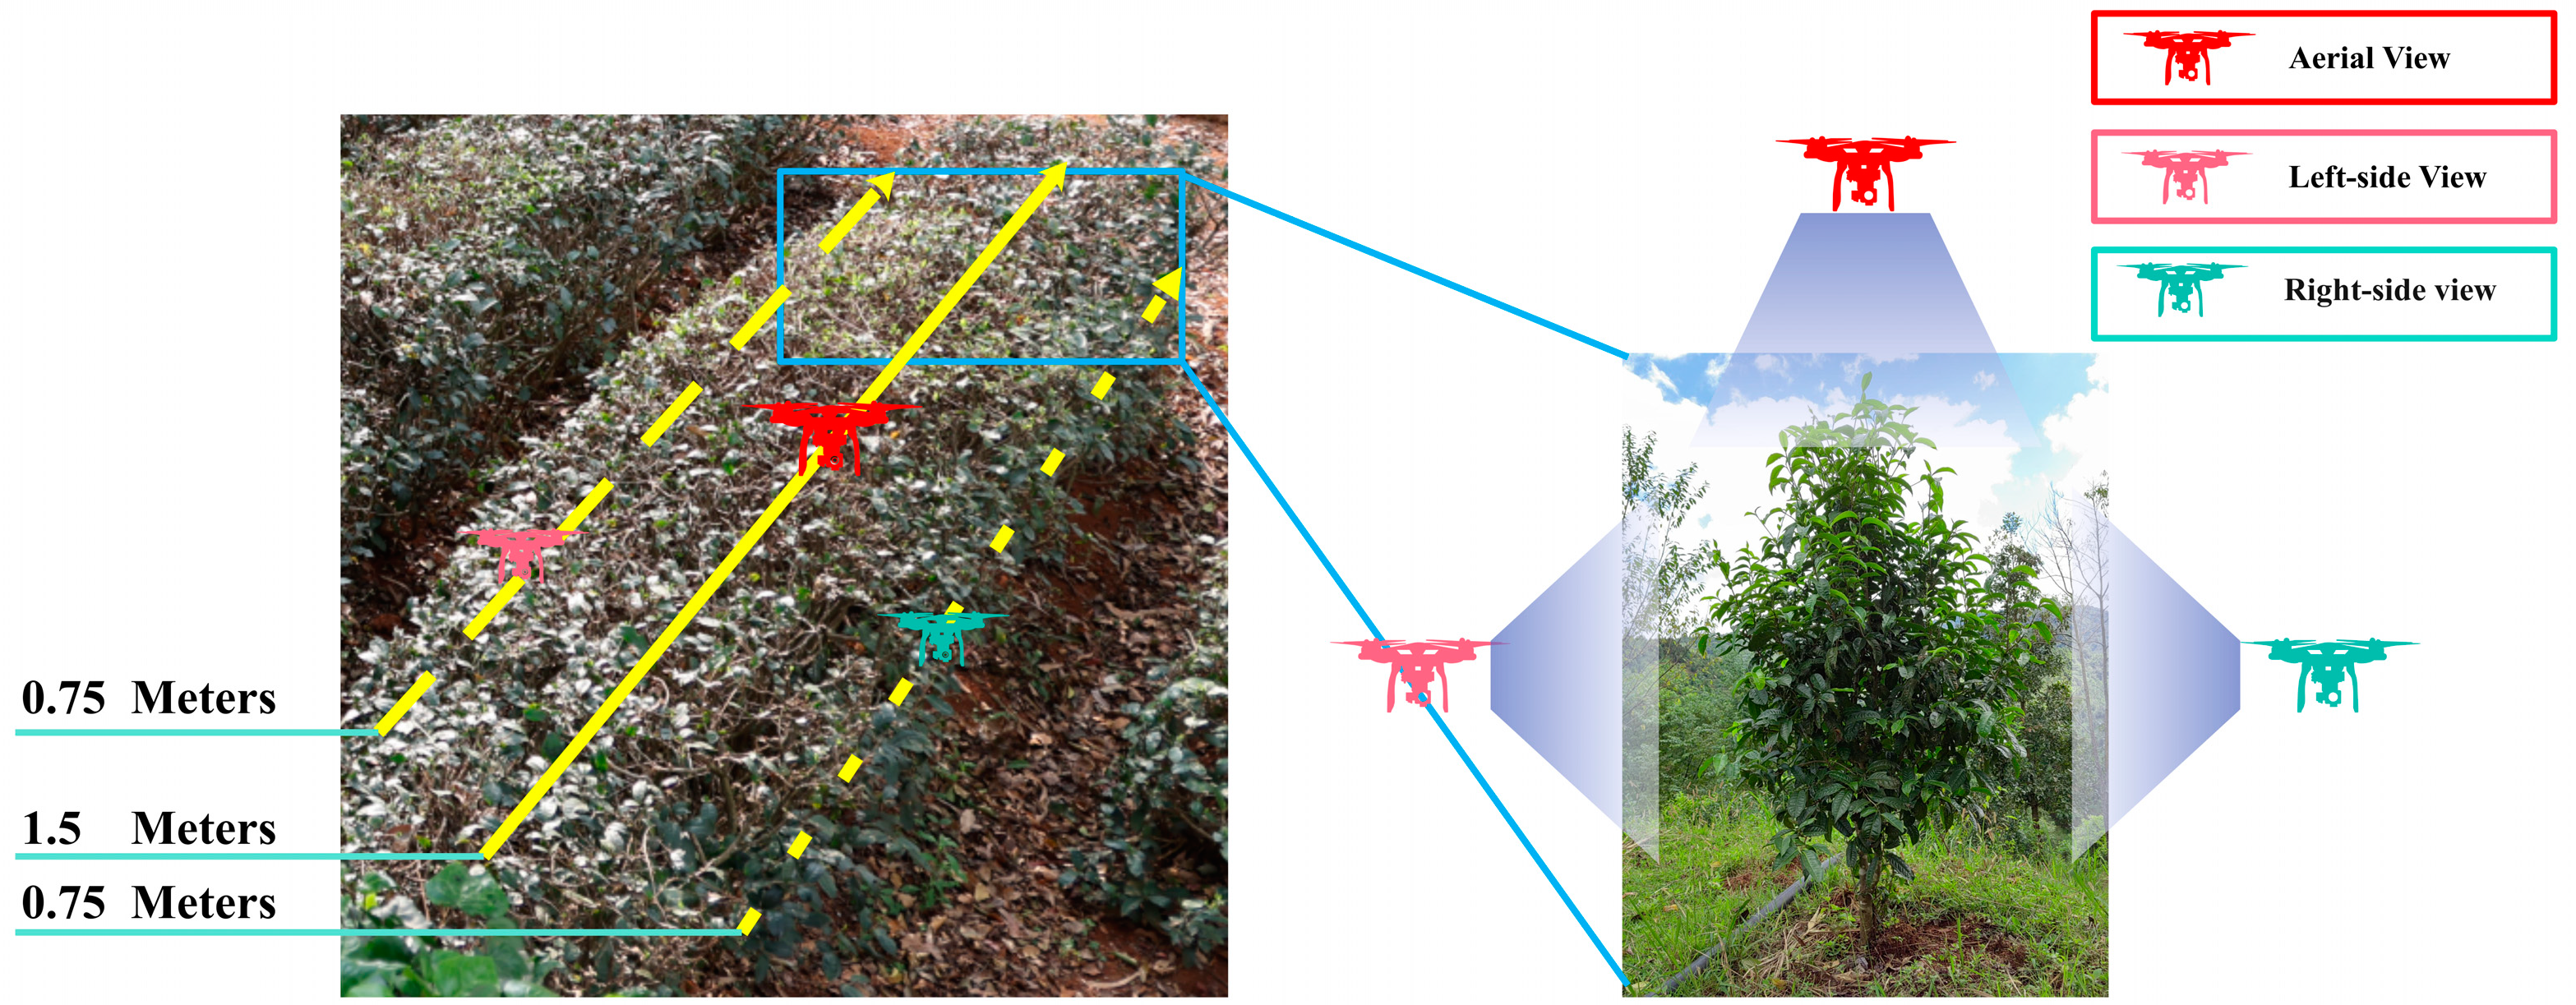
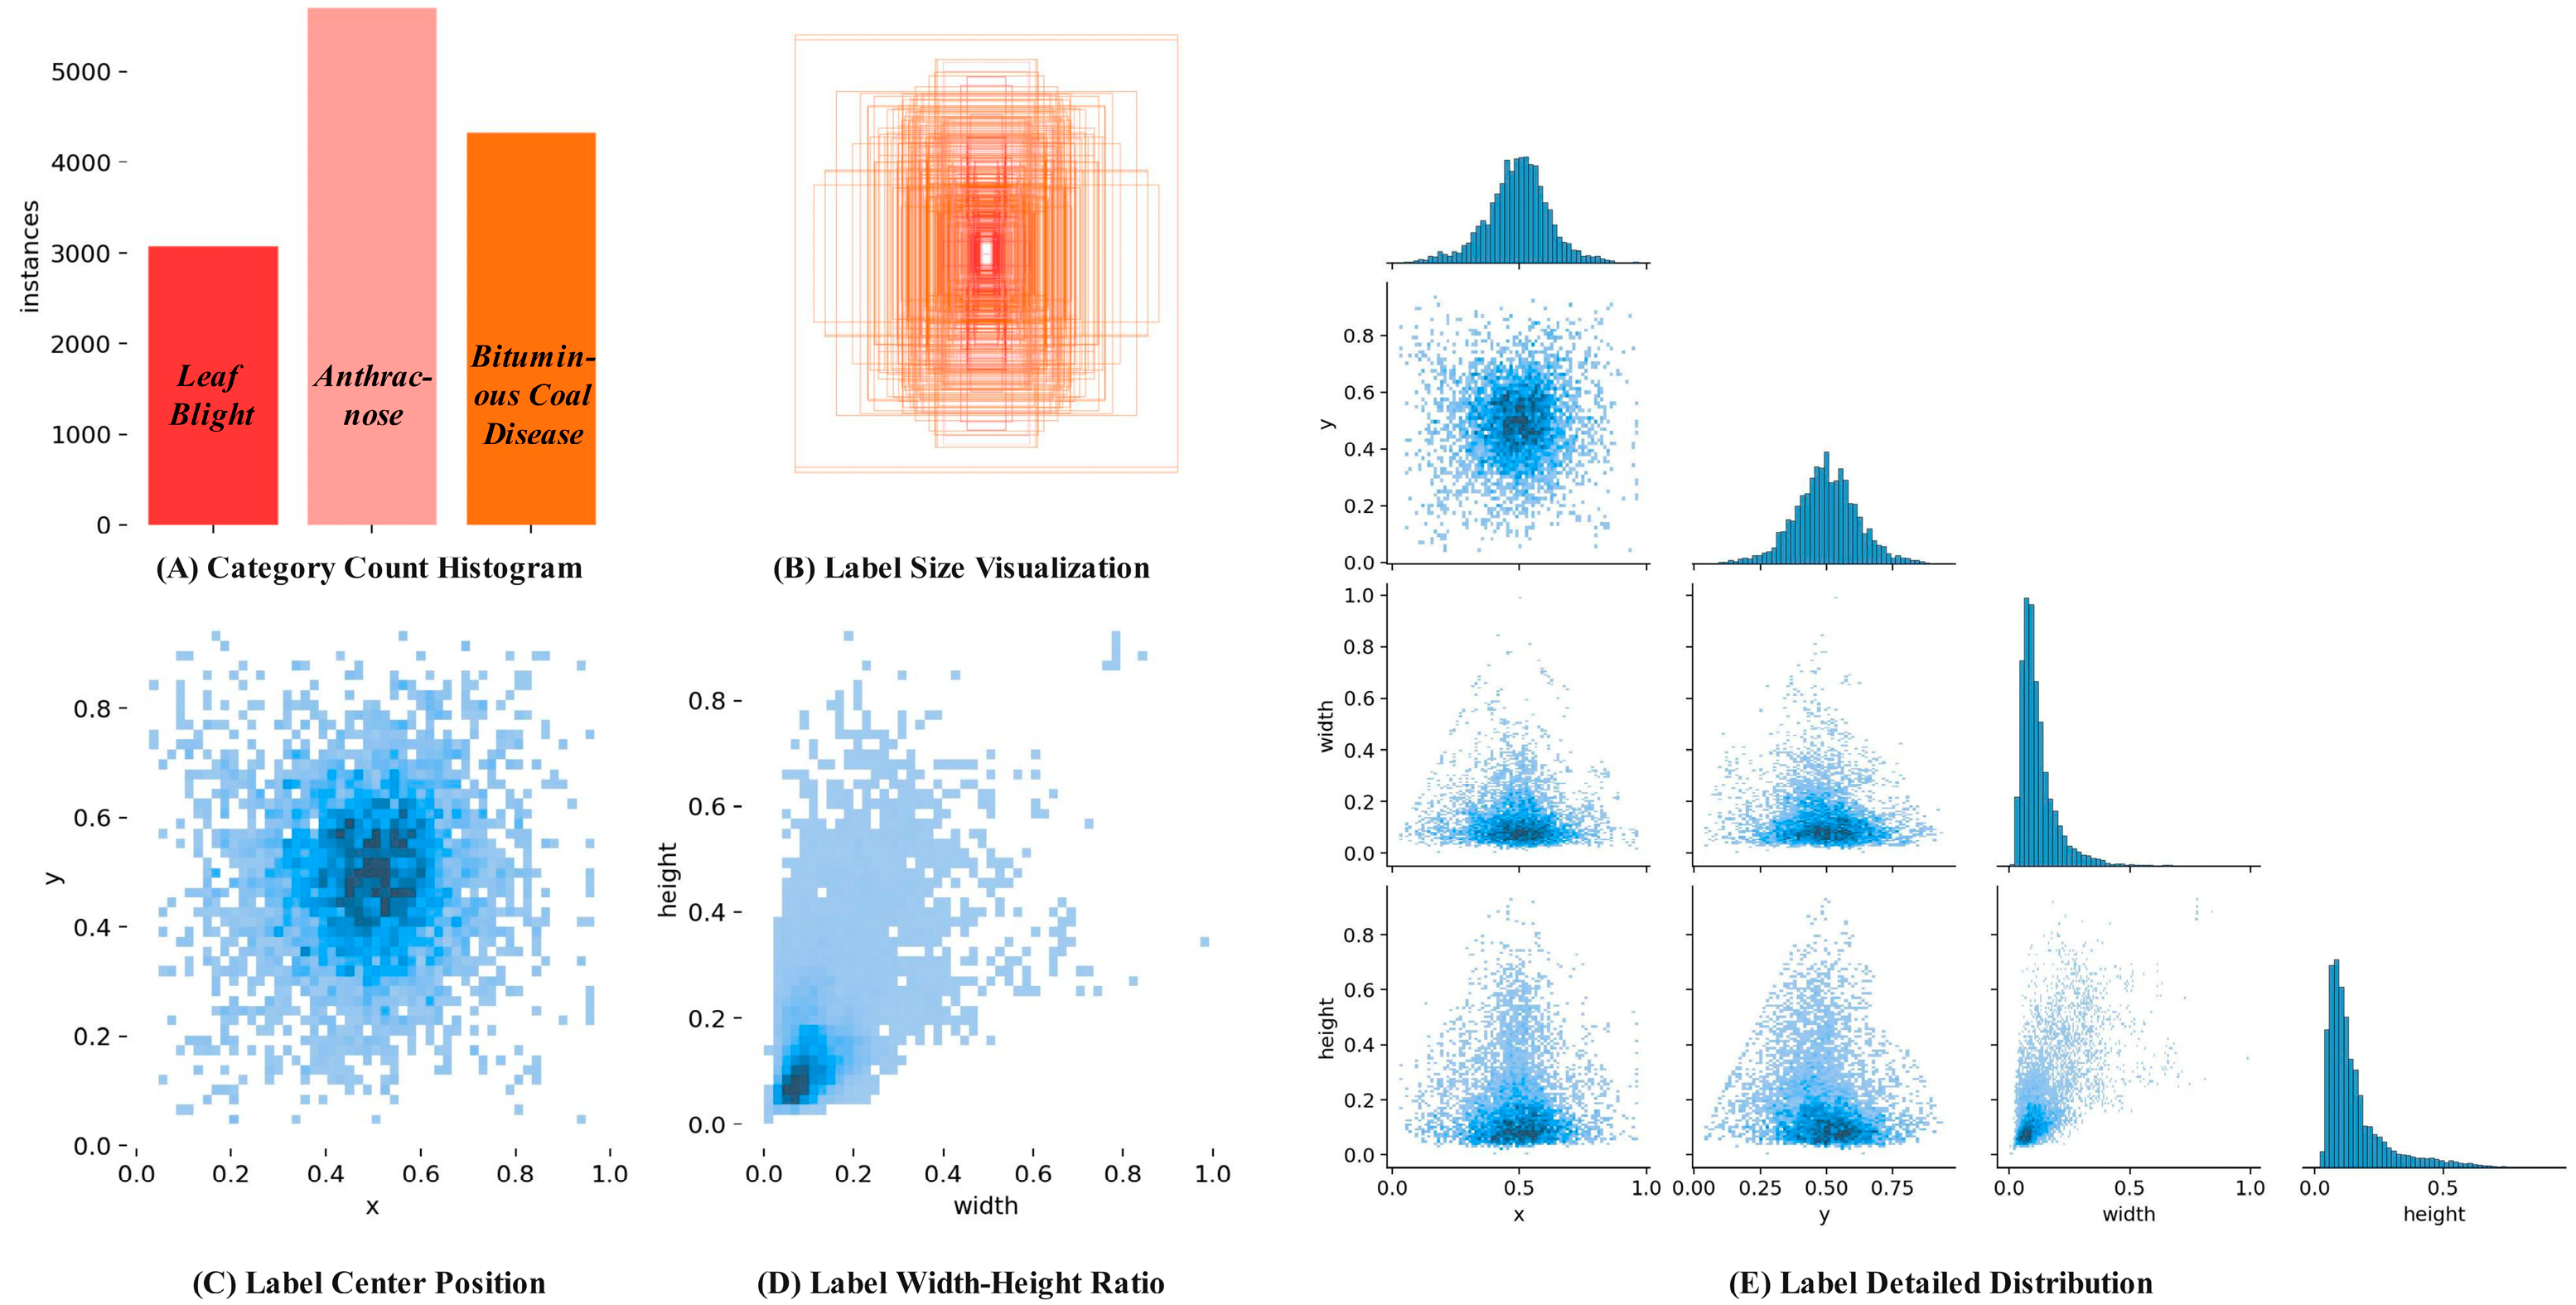
2.1. Dataset Construction

The data collection sites of this study were tea cultivations in Yunxian and Fengqing counties of Lincang City (99°E, 24°N), Yunnan Province, and organic tea cultivations in Xishuangbanna (100°E, 21°N). Xishuangbanna organic tea cultivations are located in southwest China, belonging to the tropical monsoon climate area. The region is located in the southwest monsoon climate zone. The average daily temperature is 22 °C, the annual average relative humidity is 79%, the annual average rainfall is 1665 mm, and the annual runoff is 700 mm [13]. Lincang City is one of the renowned tea-producing regions in Yunnan Province, with tea cultivations distributed across mountainous areas characterized by a humid climate and fertile soil that are conducive to tea tree growth. Its tea is famed for its unique flavor and high quality, particularly its black tea, which is highly popular among tea consumers.
To ensure the clarity of the original images, the image acquisition device used was the DJI AIR 2S unmanned aerial vehicle, equipped with a 1-inch 20-megapixel Exmor R CMOS sensor. The collected images’ wavelength range is visible light, with the UAV flying at a speed of 2 m per second, capturing images every 0.5 s. To ensure the generalizability of the final model, image data were collected between 7 and 9 in the morning, 12 and 14 at noon, and 16 and 18 in the afternoon. The data collection method is illustrated in Figure 1. For the tea trees, data were acquired from three angles: aerial view, left-side view, and right-side view. Given that the subjects have a height ranging from 1 to 1.3 m, the unmanned aerial vehicle was required to fly at an altitude of 1.5 m for the top-down view and at an altitude of 0.75 m for the left and right views [14].
A total of 1358 original diseased samples were collected in this study, including coal disease, anthracnose, and leaf blight, under different light intensities. To enhance the generalization ability of the model under complex environments and low-light conditions, and to better extract the characteristics of tea plant diseases at different distances and perspectives, data enhancement technology was used to expand the training set. The image brightness and contrast were randomly adjusted to 0.5 to 1.5 times, and the image was randomly scaled on the x-axis and y-axis, as shown in Figure 2 [15].
After data augmentation, a total of 7128 images were selected to construct the dataset, with the labeling details shown in Figure 3. Figure 3A illustrates the distribution of the number of labels for each disease in the dataset; Figure 3B shows the width and height of the label box after unifying the x and y coordinates of all labels. Figure 3C displays the distribution of the label x and y coordinates within the images. Figure 3D reflects the distribution of the aspect ratios of the labels in the dataset. Figure 3E shows the detailed information of the label distribution in the dataset.
To further enhance data utilization efficiency and reduce bias caused by erroneous data, this study employed a five-fold cross-validation strategy during dataset partitioning. The entire dataset was evenly divided into five parts, with four parts used as the training set and one part as the test set in each iteration of model training. After five rounds of training, the model with the highest accuracy was selected as the final model for that round [16].

2.2. YOLOv10 Network Improvement

As a novel real-time object detection network, YOLOv10 greatly reduces computational redundancy and parameter count through the use of a lightweight classification head and spatial-channel decoupled downsampling. To achieve efficient feature extraction, multi-scale feature fusion, and fully retained fine-grained information, rank-guided block design is further introduced. In addition, by incorporating large-kernel convolution and selected self-attention modules, the network effectively expands its receptive field and enhances its global information modeling capabilities, thereby significantly improving detection accuracy and robustness [17]. However, the YOLOv10 network exhibits limited ability to extract fine-grained features from low-resolution images and complex backgrounds. In tea cultivation disease images acquired through unmanned aerial vehicle remote sensing, where the disease distribution density is low, the disease objects are small, and issues such as overlap and occlusion are prevalent, its detection accuracy and robustness are noticeably insufficient.
Therefore, based on the YOLOv10 network, this study uses Shape-IoU to optimize the Bounding Box Regression Loss of the YOLOv10 network for the detection error caused by morphological diversity in the case of overlap and occlusion. Aiming to solve the problems of weak response to low-frequency information in traditional convolution and the high computational complexity of large-kernel convolution, the input image is decomposed into low-frequency and high-frequency components by Wavelet Transform Conv improvement, and then multi-level decomposition and small-kernel deep convolution are used to achieve efficient extraction of frequency components. Aiming to solve the problem that the fixed receptive field cannot take into account both local details and global background information, Histogram Transformer is introduced to improve the Neck layer of the YOLOv10 network. The optimized YOLOv10 network structure is shown in Figure 4, and the detailed parameters are shown in Table 1.

2.2.1. Bounding Box Regression Loss Optimization

Bounding Box Regression Loss is one of the core parts of the YOLOv10 network, which is mainly used to evaluate the difference between the predicted bounding box and the real bounding box. However, in the existing YOLOv10 network, the original bounding box regression method uses the relative position and relative shape between the bounding boxes to calculate the loss. It only considers the geometric relationship between the predicted bounding box and the real bounding box, but ignores the influence of the shape and size of the bounding box itself. When using unmanned aerial vehicles for disease detection in Yunnan large-leaf tea trees, diseases often exhibit overlap, occlusion, and diverse morphological variations, which result in suboptimal recognition accuracy in the original YOLOv10 network [18].
To address this issue, this study considers the scale factor of the target in the dataset using Shape-IoU, and introduces the weight coefficient related to the shape of the real bounding box to optimize the loss function of the YOLOv10 network [19]. The improved Bounding Box Loss is expressed in Equation (1); in Equations (2)–(7), B denotes the predicted bounding box, B g t denotes the ground-truth bounding box, w g t denotes the width of the ground-truth bounding box, h g t denotes the height of the ground-truth bounding box, w denotes the width of the predicted bounding box, and h denotes the height of the predicted bounding box. S c a l e represents the aspect ratio factor related to the disease, while W w and H h , which are related to the shape of the ground-truth bounding box, are the weight coefficients in the horizontal and vertical directions, respectively. x c and y c denote the x and y coordinates of the center of the predicted bounding box, and x c g t and y c g t denote the x and y coordinates of the center of the ground-truth bounding box.
L S I o U = 1 I o U + d i s t a n c e s + 0.5 × Ω s
I o U = B B g t B B g t
W w = 2 × ( w g t ) s c a l e ( w g t ) s c a l e + ( h g t ) s c a l e
H h = 2 × ( h g t ) s c a l e ( w g t ) s c a l e + ( h g t ) s c a l e
d i s t a n c e s = H h × ( x c x c g t ) 2 c 2 + W w × ( y c y c g t ) 2 c 2
Ω s = t = w , h ( 1 e ω t ) θ , θ = 4
ω w = H h × w w g t max ( w , w g t ) ω h = W w × h h g t max ( h , h g t )

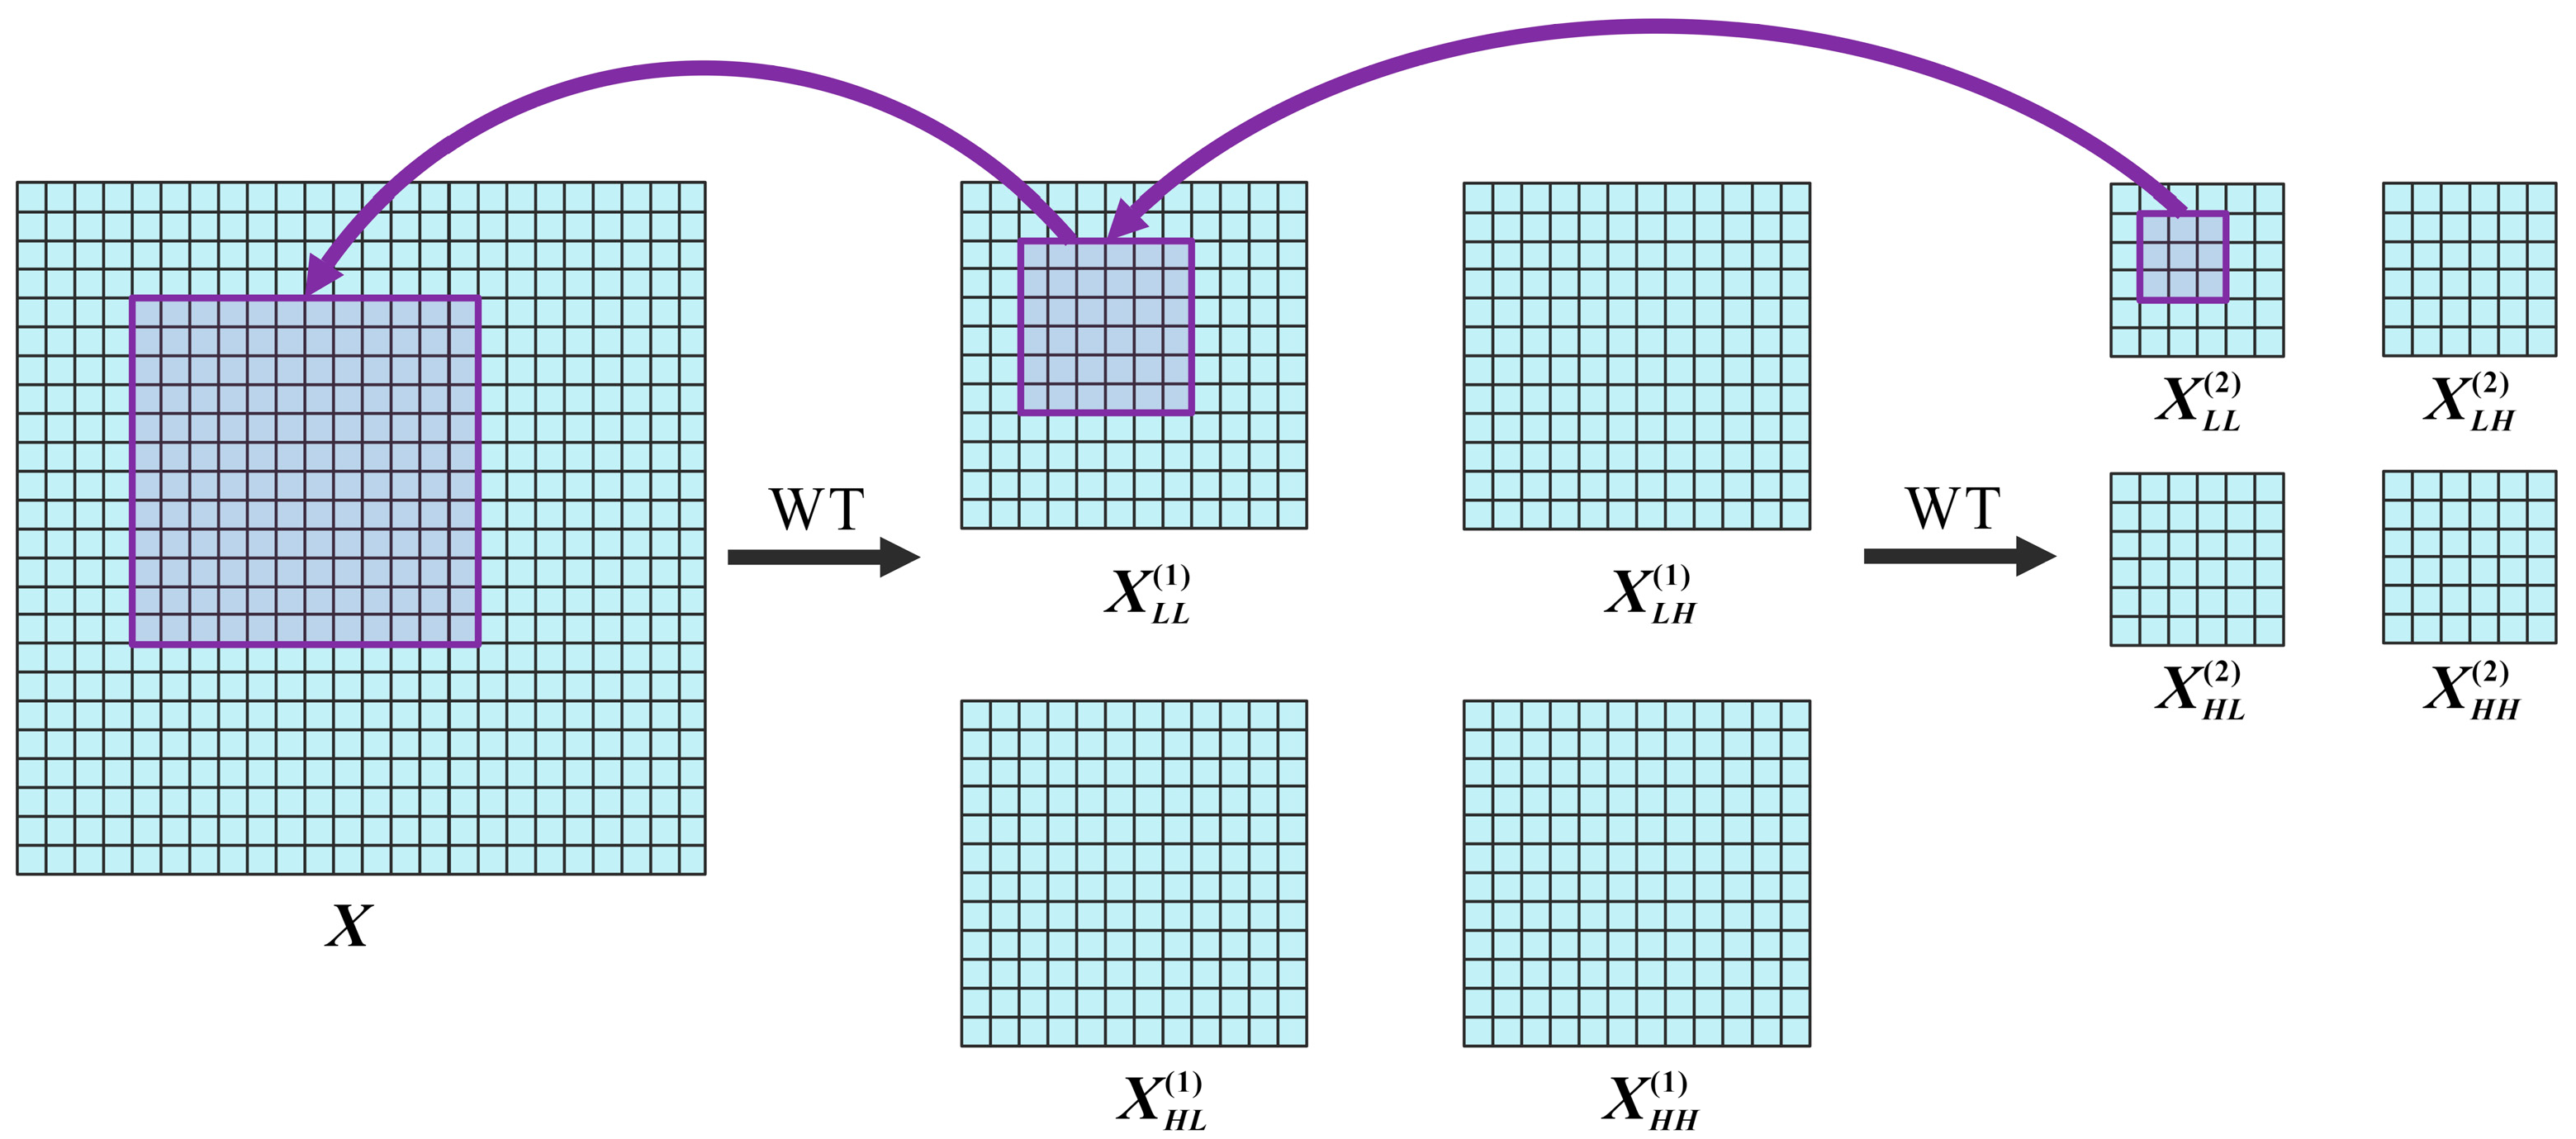
2.2.2. Wavelet Transform Conv Optimization

In the YOLOv10 network, Conv (convolution) serves as a crucial component for feature extraction, where the size of the receptive field depends on the dimensions of the convolution kernel and the number of network layers [20]. With the increase in the size of the convolution kernel, the receptive field will gradually expand, but this will also significantly increase the complexity of the calculation and the number of parameters. In the case of large receptive fields, the YOLOv10 network is prone to overfitting and the computational efficiency is reduced. Moreover, traditional Conv is more sensitive to high-frequency features while exhibiting a weak response to low-frequency features. In view of the above problems, this study optimizes the Conv in the YOLOv10 network. It aims to enhance the response of the network to low-frequency information and achieve a larger receptive field with fewer parameters, thereby improving the stability and efficiency of the model. The core steps of the improved WTConv (Wavelet Transform Conv) are illustrated in Figure 5 [21].
WTconv first uses Haar Wavelet Transform to decompose the input image into a low-frequency component and three high-frequency components, and the spatial resolution of the component is 50% of the original image. This is expressed in Equations (8) and (9), where X L L denotes the low-frequency component, and X L H , X H L , and X H H denote the horizontal, vertical, and diagonal high-frequency components, respectively; f L L is the low-pass filter, while f L H , f H L , and f H H represent a set of high-pass filters. Meanwhile, to increase the frequency resolution and reduce spatial resolution, the low-frequency component is further decomposed into multiple levels, as shown in Equation (10), where i indicates the current level, and X L L ( 0 ) = X . To enable the convolution kernel to operate over a larger area and thus increase the receptive field, this study utilizes the WT (Wavelet Transform) to filter and downsample the input, and performs small-kernel depthwise convolution on different frequency maps. Finally, the convolved results of each frequency component are recombined through the IWT (Inverse Wavelet Transform) to generate the output image, as shown in Equation (11), where X and W denote the input tensor and the weight tensor of a k × k depthwise convolution kernel, respectively.
f L L = 1 2 1 1 1 1 ,   f L H = 1 2 1 1 1 1 ,   f H L = 1 2 1 1 1 1 ,   f H H = 1 2 1 1 1 1
X L L , X L H , X H L , X H H = C o n v ( f L L , f L H , f H L , f H H , X )
X L L ( i ) , X L H ( i ) , X H L ( i ) , X H H ( i ) = W T ( X L L ( i 1 ) )
Y = I W T ( C o n v ( W , W T ( X ) ) )

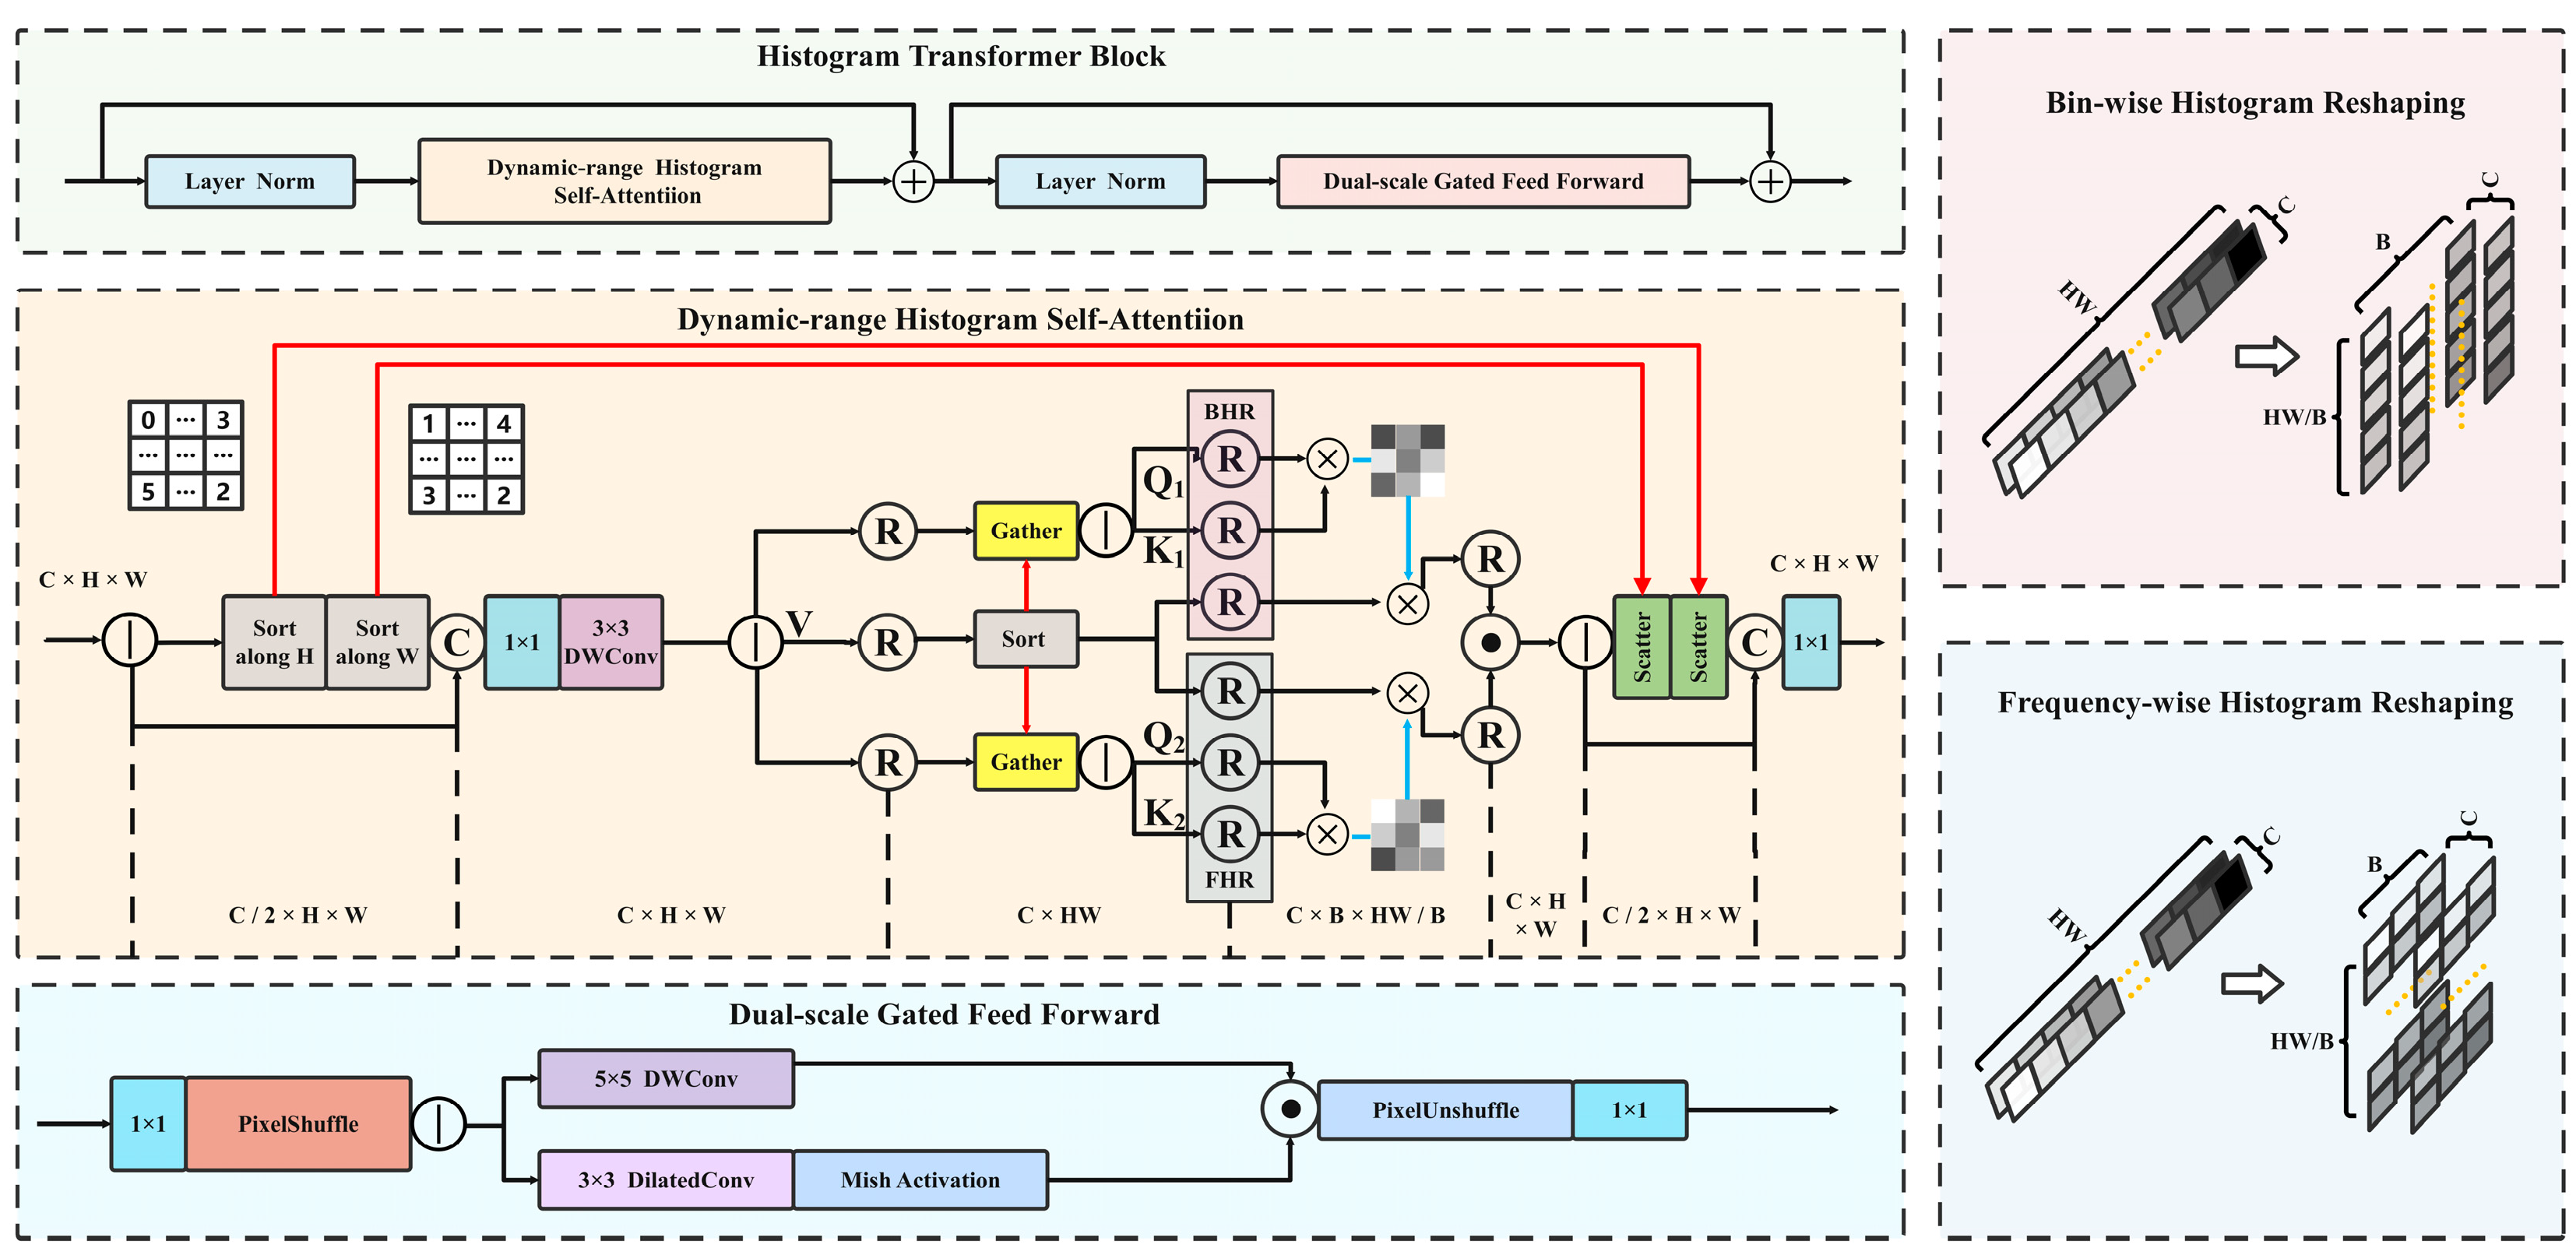
2.2.3. Histogram Transformer Optimization

In the YOLOv10 network, the extraction of image features mainly relies on convolutional kernels with fixed receptive fields, which makes it difficult for the model to simultaneously focus on local details and global information. This causes the model, under complex backgrounds, to tend to overlook the subtle features of tea tree diseases, resulting in missed or false detections of small-area diseases.
To address this issue, this study introduces the Histogram Transformer to optimize the YOLOv10 network, aiming to enhance the feature extraction capability of the original network, reduce background interference, and improve the detection accuracy of disease regions [22]. The core idea is to group the spatial features of the image using histograms, and to assign pixels to different groups based on pixel intensity or other features. As shown in Figure 6, the Histogram Transformer is mainly composed of two parts: DHSA (Dynamic-range Histogram Self-Attention) and DGFF (Dual-scale Gated Feed-Forward).
DHSA primarily captures the histogram information within the image by dynamically adjusting the weights of the self-attention mechanism, thereby enhancing the model’s understanding of the overall distribution of the image. DGFF introduces a multi-scale perspective by capturing key information from the image at different scales during feature processing. Through a gating mechanism, the DGFF module can effectively control the transmission and fusion of features from different scales, thus helping the model to better handle both local and global features in the image. As shown in Equations (12) and (13), Equation (12) indicates that at layer l , the input feature F l 1 is processed by Layer Normalization and then input to DHSA. The output from DHSA is added to the previous layer output F l 1 to produce the current layer output F l . Equation (13) shows that after processing F l with Layer Normalization, it is input to DGFF, and the output of DGFF is added to the input to form the new F l .
F l = F l 1 + D H S A ( L N ( F l 1 ) )
F l = F l + D G F F ( L N ( F l ) )
To more effectively capture and integrate features from different scales during image processing, the Histogram Transformer incorporates two types of reshaping within DHSA: BHR (Bin-wise Histogram Reshaping) and FHR (Frequency-wise Histogram Reshaping). In BHR, features are grouped into different bins based on intensity, with each bin including a specific range of pixel values. This method enables the model to integrate and process features on a global level, thus achieving a more comprehensive understanding of the overall distribution and structure of the image. In contrast, FHR reshapes the features according to frequency, grouping the features into specific frequency dimensions, with each bin concentrating on a narrower range of intensity values and containing fewer pixels. This allows the model to capture the local details in the image more precisely, thereby enhancing its ability to perceive and process fine details.

2.3. Model Evaluation Metrics

To further evaluate the performance of the improved YOLOv10 network in the task of detecting diseases in Yunnan large-leaf tea trees using UAV remote sensing, this study employs precision, recall, F1 score, and mAP (mean average precision) as the performance evaluation metrics for the model [23]. As shown in Equations (14)–(18), precision is used to measure the proportion of diseases actually identified as diseases in the target predicted by the model. In the formula, T P represents the number of correctly predicted disease targets, and F P represents the number of incorrectly predicted disease targets. Recall represents the proportion that the model can successfully detect in all real disease targets, and F N represents the number of disease targets that exist but are not detected. As the harmonic mean of precision and recall, the F 1 score is used to comprehensively evaluate the balance between reducing false detection and missed detection, and intuitively reflects the comprehensive level of detection ability. AP (average precision) represents the evaluation of the detection accuracy of a single category of disease under different IoU thresholds, and its value is the area under the PR curve of the category, while mAP is the mean value of each category of AP. In the formula, n is the number of discrete points divided when calculating the PR curve, r i is the recall value at the i-th point, P i is the precision value at the i-th point, and k is the total number of categories in target detection.
    P r e c i s i o n = T P T P + F P      
R e c a l l = T P T P + F N
F 1 = 2 P r e c i s i o n R e c a l l P r e c i s i o n + R e c a l l
A P = i = 1 n ( r i r i 1 ) P ( i )  
m A P = i = 1 k A P i k

3. Results

To validate the effectiveness of the optimized Bounding Box Regression Loss, the improved Wavelet Transform Conv, and the enhanced Histogram Transformer in the YOLOv10 network for detecting bituminous coal disease, anthracnose, and leaf blight in Yunnan large-leaf tea trees, this study conducted five sets of comparative experiments.
To ensure the scientific rigor and accuracy of the model testing results, this study utilized identical hardware equipment and software environments throughout the experiments. Model training was performed on a Windows 10 operating system with GPU acceleration, using a host equipped with an NVIDIA RTX A6000 graphics card, 2933 MHz DDR4 ECC memory, an M.2 1TB PCIe NVMe Class 50 solid-state drive, an Intel Xeon Gold 6230R processor, NVIDIA driver 537.70, and CUDA version 12.2. Network development was carried out using Python 3.9 and PyCharm 2024, with the training batch size uniformly set to 128 and the number of epochs set to 1000.
To further enhance the performance and stability of the model, this study introduces a hyperparameter tuning strategy into the improved YOLOv10 network [24]. In order to alleviate gradient fluctuations under complex backgrounds, smooth gradient updates were achieved and model convergence accelerated by setting the momentum to 0.937. To effectively prevent overfitting or underfitting, control the complexity of the model, suppress unnecessary parameter growth, and enhance the generalization ability of the model, the weight decay parameter was set to 0.001. To improve the model’s adaptability to high learning rates during the initial training phase and to prevent instability caused by abrupt weight changes, the number of warmup epochs was set to 2.8. Additionally, to accelerate the rapid adaptation of the bias term to the data distribution and to capture local features during the warmup phase, the warmup_bias_lr was set to 0.1. To improve the accuracy of disease region boundary localization under complex backgrounds, the box parameter was set to 7. Finally, to balance the model’s performance in both classification and localization tasks—ensuring both accurate differentiation of various disease categories and precise localization—the cls parameter was set to 0.5, and the DFL (Distribution Focal Loss) parameter was set to 1.5, thereby enhancing the model’s ability to handle uncertainty in class predictions and reducing the risk of class confusion.

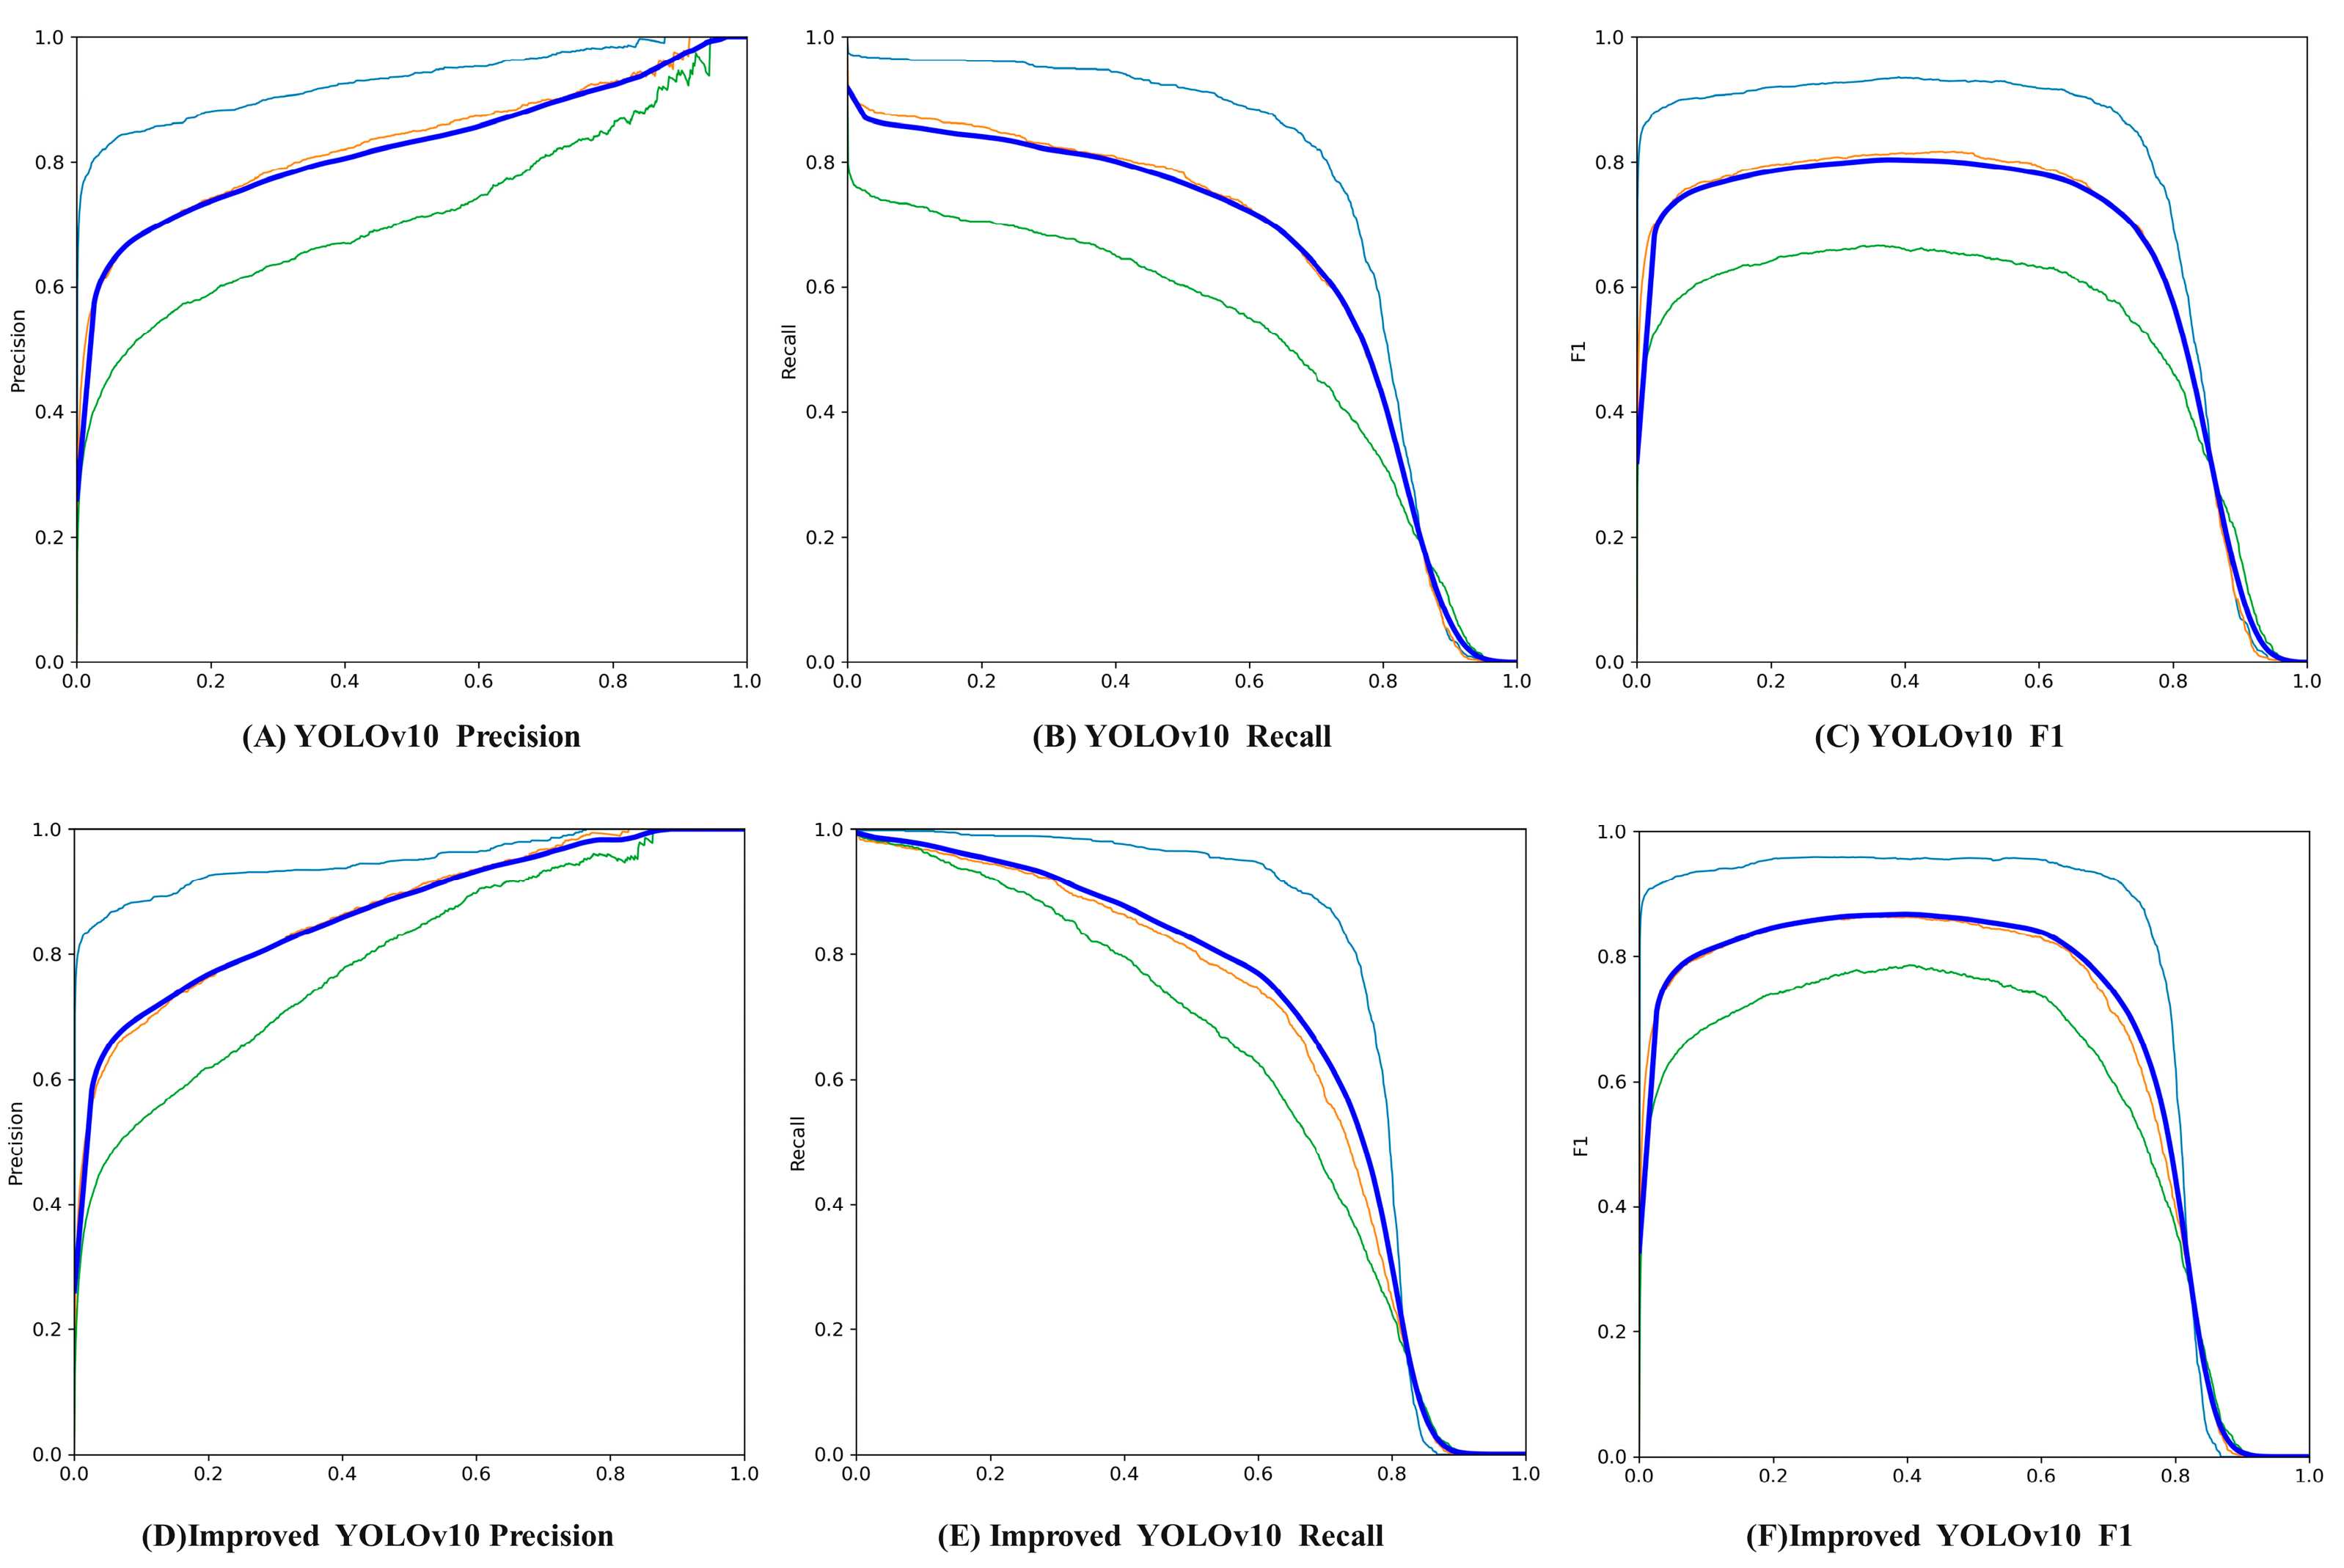
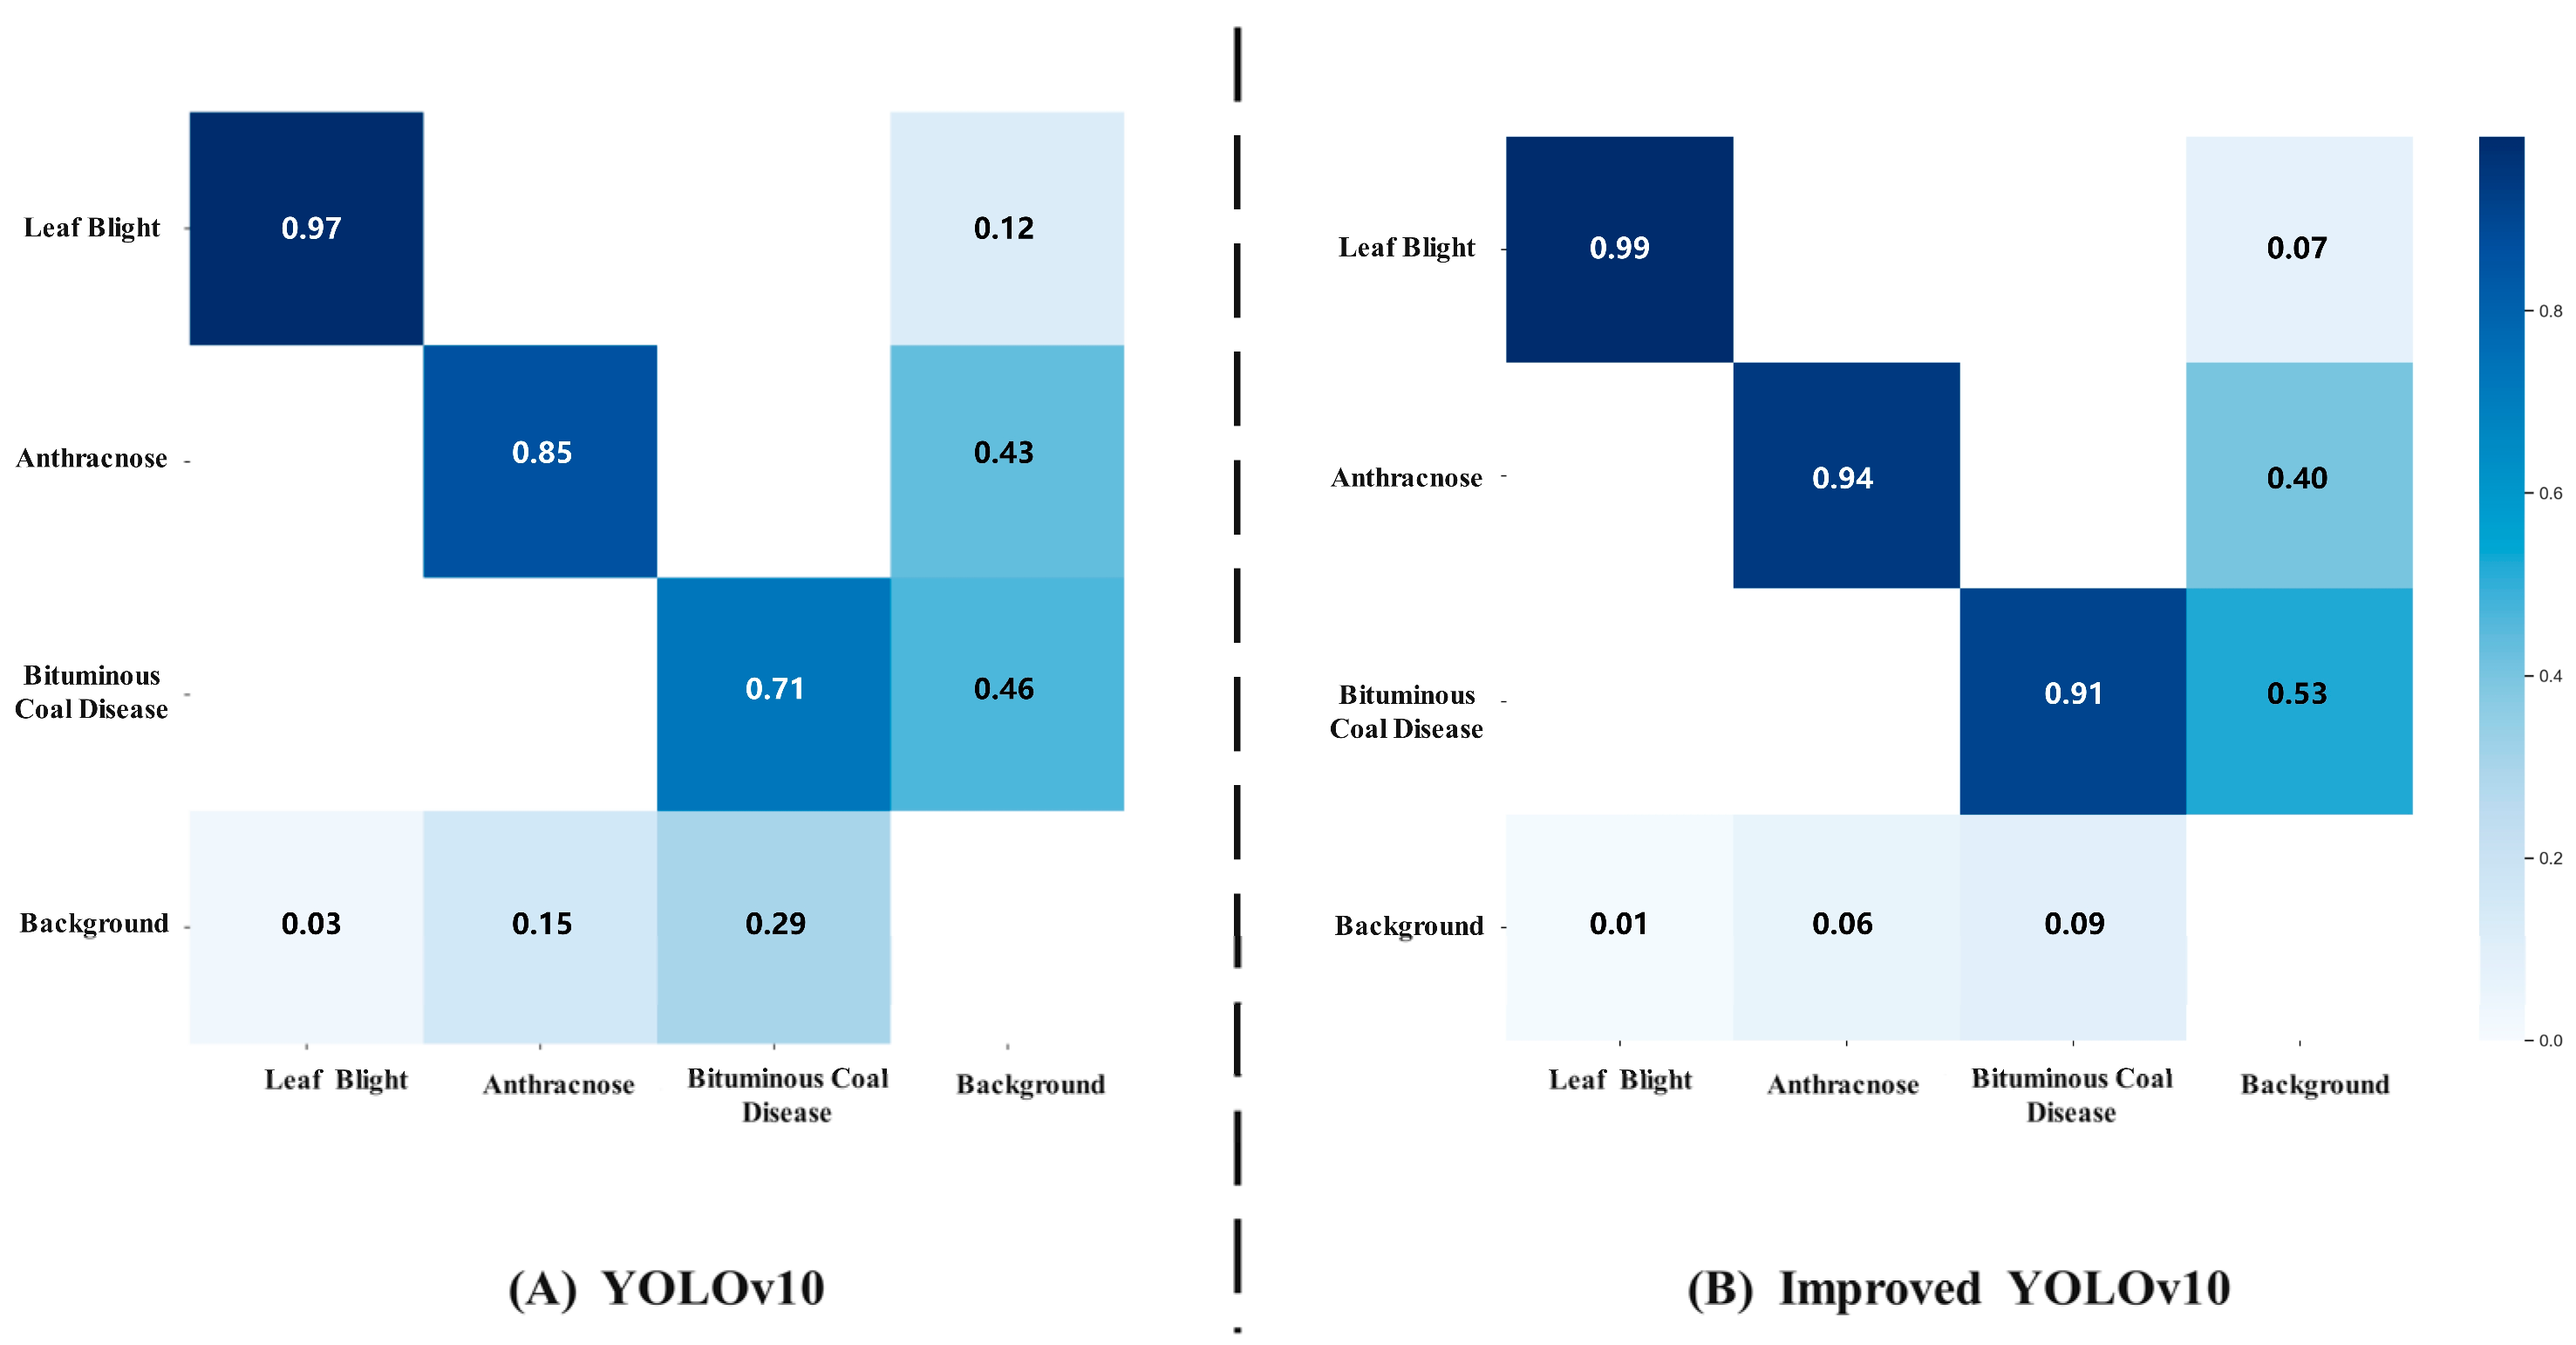
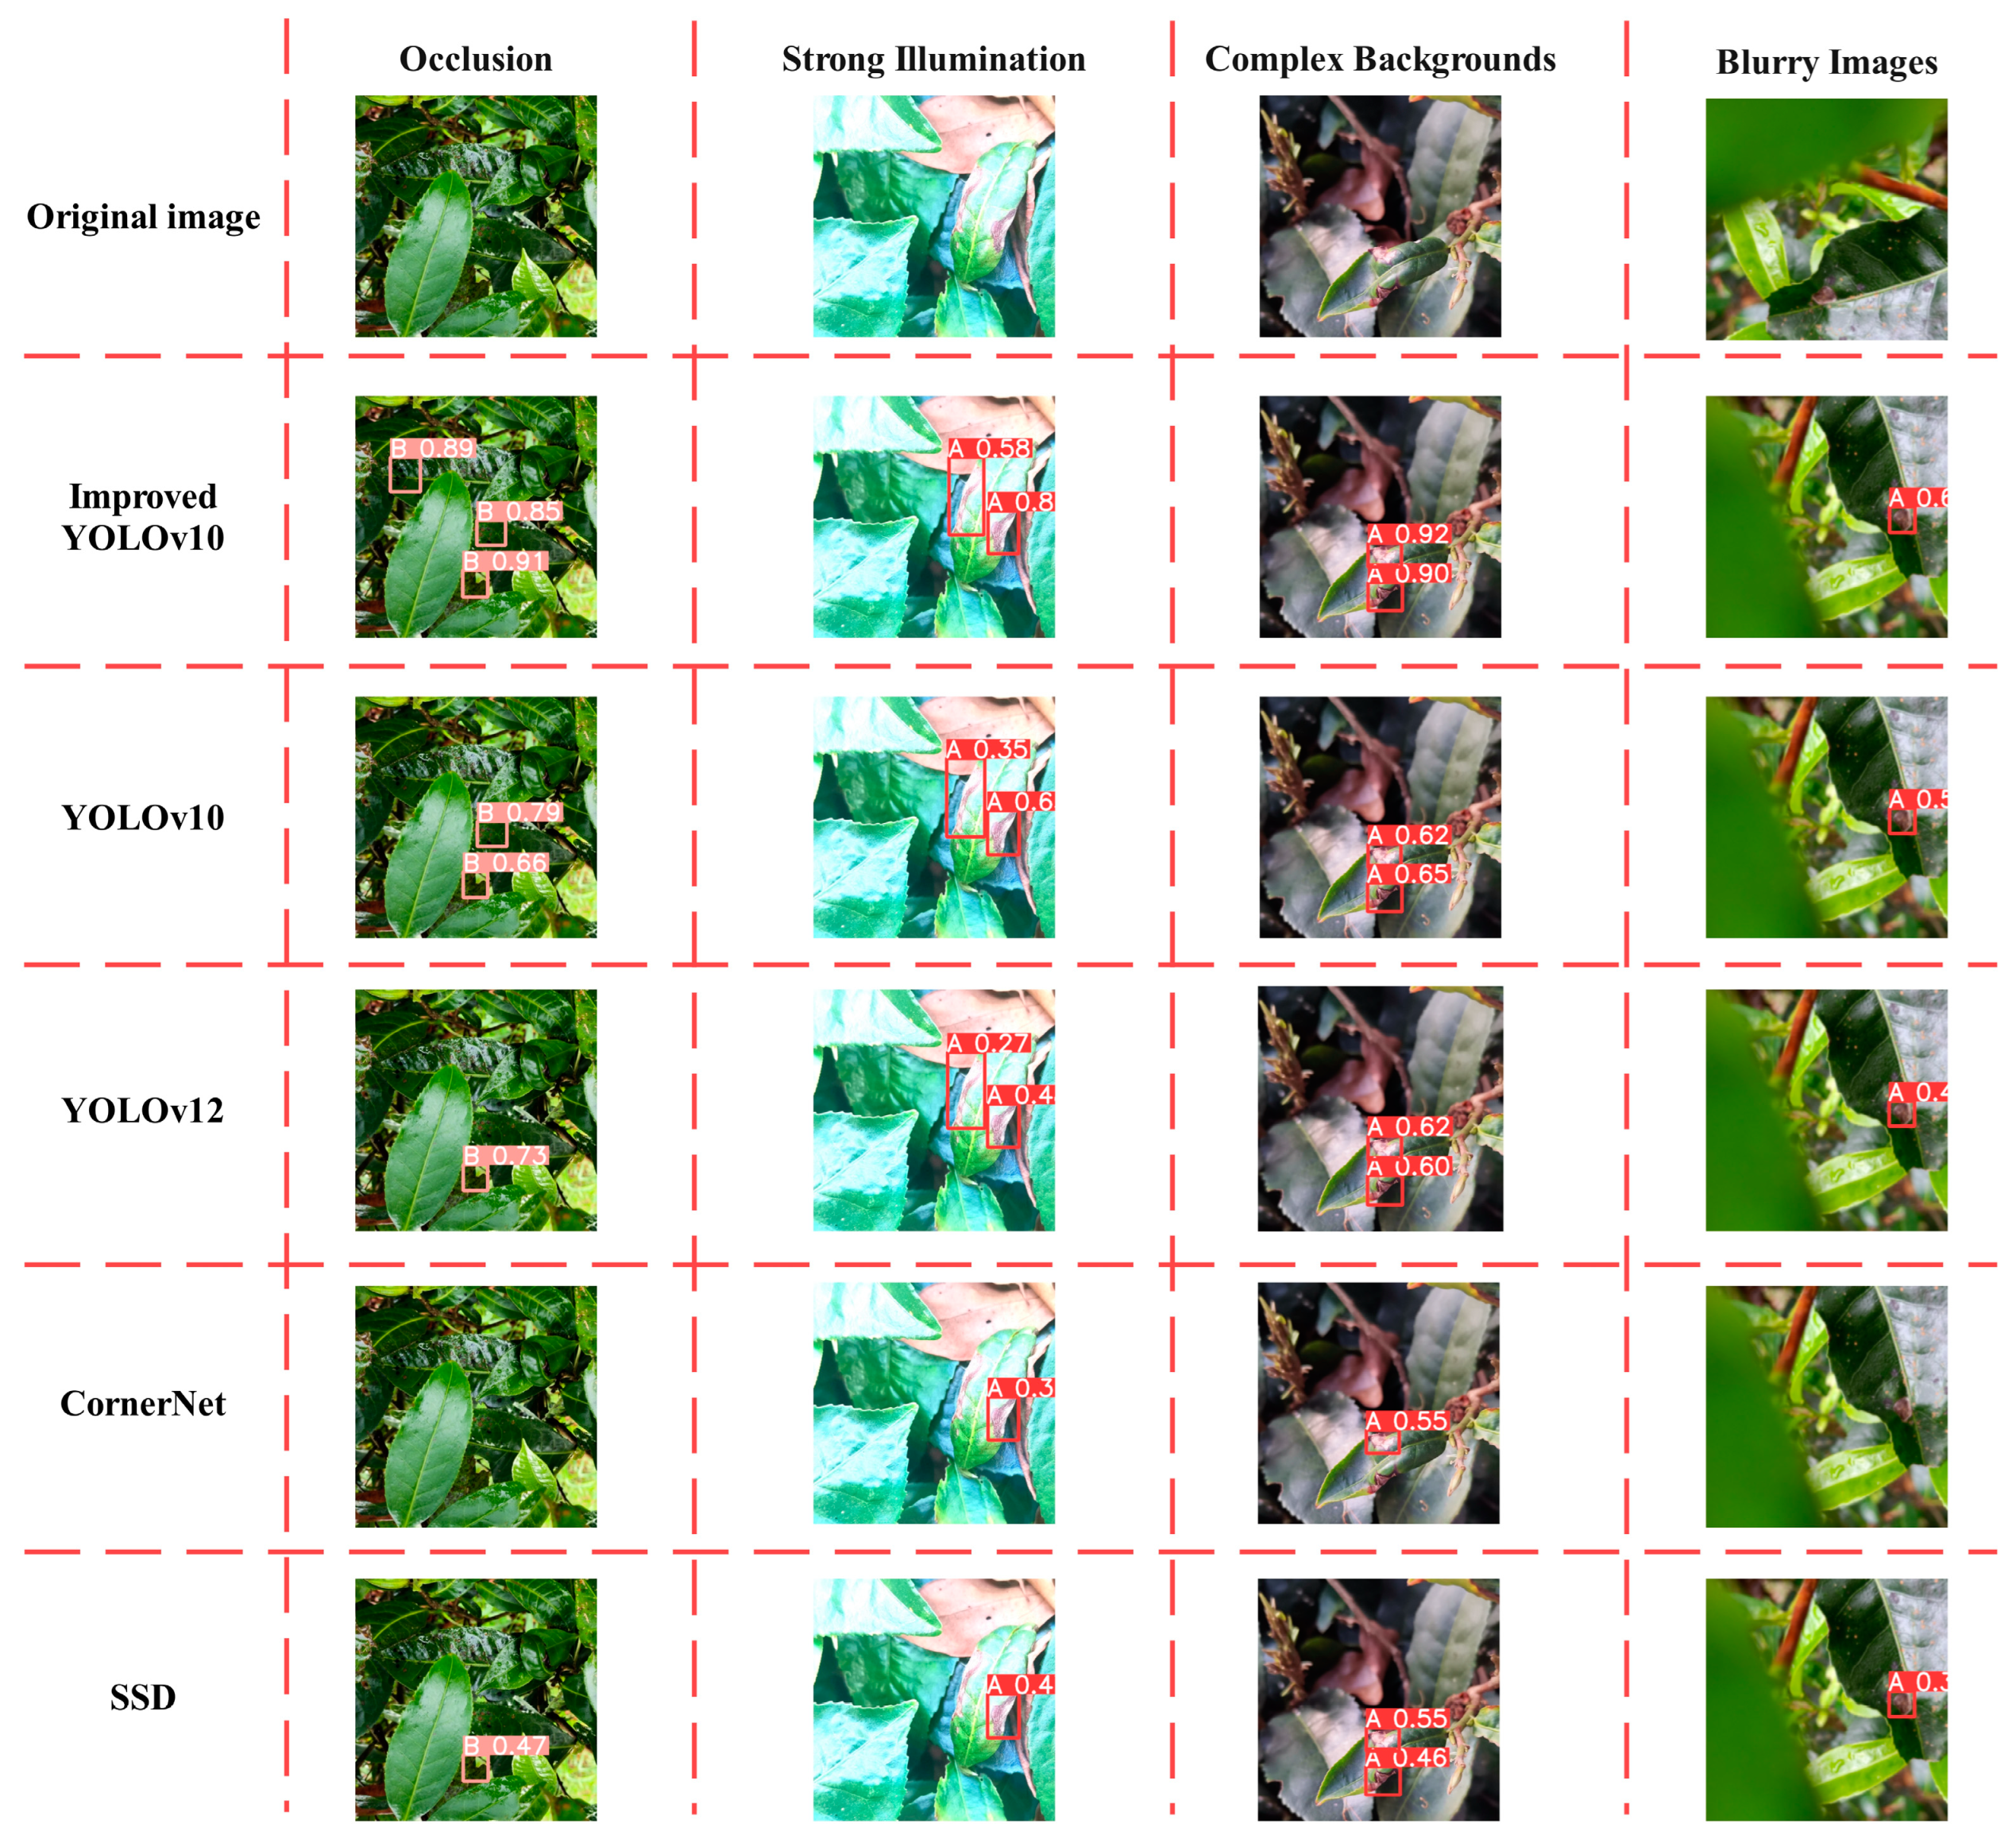
3.1. Model Result Analysis

The loss function is mainly used to quantify the error between the predicted results and the real annotation of the model in the disease detection task, and guide the continuous updating and optimization of the parameters during the model training process to achieve error minimization, detection performance improvement, and generalization ability enhancement. As shown in Figure 7, the results show that the loss function of the improved YOLOv10 network decreases significantly faster than that of the original YOLOv10. After 500 epochs of training, the improved YOLOv10 achieved Box Loss, Cls Loss, and DFL Loss values of 1.16, 0.66, and 1.24, respectively, under the One-to-Many Head, which represents reductions of 15.94%, 13.16%, and 8.82% compared to the original YOLOv10 network’s values of 1.38, 0.76, and 1.36. Under the One-to-One Head, the Box Loss, Cls Loss, and DFL Loss were 1.23, 0.65, and 1.23, respectively, which are 14.58%, 17.72%, and 8.89% lower than those of the original YOLOv10 network (1.44, 0.79, and 1.35). The lower Box Loss value indicates that the improved YOLOv10 exhibits smaller errors in disease region localization and can more accurately capture target boundaries. The reduction in Cls Loss demonstrates that the model possesses higher discriminative accuracy in distinguishing disease categories. Meanwhile, the decrease in DFL Loss indicates that the model is more sensitive in capturing the distribution of fine-grained features, which helps to enhance the overall detection performance.
As shown in Figure 8, the different colors of the thin lines represent different categories, while the dark blue thick line represents all categories. The precision, recall, and F1 of the improved YOLOv10 network are 85.38%, 88.08%, and 86.71%, respectively, which are 3.4%, 10.05%, and 6.75% higher than the original YOLOv10. The results show that the improved model can more accurately identify the target area when detecting diseases, and reduce the missed detection and false detection.
In the confusion matrix, the horizontal axis represents the prediction result of the model, and the vertical axis represents the real labeled category [25]. The larger the value of each element in the matrix, the higher the proportion of the corresponding predicted category for that true category. The more the diagonal region approaches 1, the higher the accuracy of correct predictions for that disease, while the values of the off-diagonal elements reflect the degree of confusion among different categories. As shown in Figure 9, the values of the elements in the matrix are influenced both by the type of disease and by the results of model optimization and improvement. Compared with the original YOLOv10 network, the improved network shows a significant performance improvement in disease detection, with detection accuracy improvements of 6% for anthracnose, 20% for bacterial coil disease, and 2% for leaf blight. The research results indicate that the improved network has a higher discriminative ability in extracting and differentiating various disease features, which enables it to more accurately classify the true disease samples, thereby reducing misclassification rates and enhancing the overall detection accuracy.

3.2. Ablation Study

To systematically evaluate the independent contributions of each optimization strategy to the overall network performance, this study further conducted an ablation study by sequentially combining different optimization modules, and analyzing in detail their effects on detection accuracy, recall, and the comprehensive evaluation metric [26]. As shown in Table 2, when only the Wavelet Transform Conv optimization was applied, although the precision decreased by 1.65%, the recall and mAP increased by 3.72% and 3.96%, respectively, with noticeable improvements, and the parameters and gradients increased by only 0.26 M. When solely applying the Histogram Transformer optimization, the precision decreased by 1.49%, while the recall and mAP increased by 4.44% and 4.7%, respectively, with the parameters and gradients increasing by 0.89 M. In the case of loss optimization, with parameters and gradients remaining unchanged, the precision decreased by 1.11%, while the recall and mAP increased by 3.32% and 4.24%, respectively. When all three optimization strategies were applied simultaneously, the improved YOLOv10 network achieved increases in precision, recall, and mAP of 3.4%, 10.05%, and 11.95%, respectively, with the number of layers reduced by 15.67% and the parameters and gradients increasing by only 0.31 M. Through the synergistic integration of multiple strategies, the improved YOLOv10 network not only significantly enhanced detection accuracy and recall but also achieved a degree of structural simplification.

3.3. Model Comparison Experiments

To further explore the applicability and robustness of the model, reduce the impact of randomness and data bias, and provide strong evidence for the reproducibility and interpretability of the results, five groups of comparative experiments were set up in this study [27]. In these experiments, the improved YOLOv10, YOLOv10, YOLOv12, CornerNet, and SSD networks were used for model training and testing on the dataset. The comparison results are shown in Table 3. Compared with YOLOv10, YOLOv12, CornerNet, and SSD, the improved YOLOv10 achieved increases in precision of 3.40%, 9.22%, 16.25%, and 13.51%, in recall of 10.05%, 12.05%, 18.59%, and 17.53%, in F1 of 6.75%, 10.62%, 17.40%, and 15.51%, and in mAP of 11.95%, 12.59%, 20.31%, and 18.04%, respectively.
To further verify the adaptability of improved YOLOv10 in the disease detection task of Yunnan large-leaf tea tree based on UAV remote sensing, this study conducted external validation under scenarios including blurry images, complex backgrounds, strong illumination, and occlusion, with all data collected at Yunnan Agricultural University. Some of the comparative results are shown in Figure 10. The research results indicate that the improved YOLOv10 network maintains high effectiveness under various interference factors, accurately capturing and localizing disease targets.

4. Conclusions

In the traditional YOLOv10, only the geometric relationship is considered. In this study, by optimizing the Bounding Box Regression Loss and incorporating disease morphology and aspect ratio factors, the accuracy and robustness of disease target localization have been improved. The Wavelet Transform Conv optimization employs the Haar Wavelet Transform to decompose low- and high-frequency information, and combines multi-level decomposition with small-kernel depthwise convolution to strengthen the extraction of low-frequency features, thereby improving detection accuracy under complex backgrounds. The Histogram Transformer optimization utilizes histogram grouping combined with dynamic self-attention and a Dual-scale Gated Feed-Forward mechanism to simultaneously capture local details and global background information, effectively reducing the rates of missed detections and false detections. Experimental results indicate the following:
(1)
Regarding the model loss function, under the One-to-Many Head, the improved YOLOv10 exhibits Box Loss, Cls Loss, and DFL Loss values of 1.16, 0.66, and 1.24, respectively, which represent reductions of 15.94%, 13.16%, and 8.82% compared to the original network values of 1.38, 0.76, and 1.36. Under the One-to-One Head, the Box Loss, Cls Loss, and DFL Loss are 1.23, 0.65, and 1.23, respectively, corresponding to reductions of 14.58%, 17.72%, and 8.89% relative to the original YOLOv10 network values of 1.44, 0.79, and 1.35.
(2)
In terms of detection performance, compared with YOLOv10, YOLOv12, CornerNet, and SSD, the improved YOLOv10 achieves increases in precision of 3.40%, 9.22%, 16.25%, and 13.51%, respectively; recall increases of 10.05%, 12.05%, 18.59%, and 17.53%; F1 score increases of 6.75%, 10.62%, 17.40%, and 15.51%; and mAP increases of 11.95%, 12.59%, 20.31%, and 18.04%, respectively. In the confusion matrix, compared with the original YOLOv10 network, the improved YOLOv10 shows an increase in detection accuracy of anthracnose by 6%, bacterial coil disease by 20%, and leaf blight by 2%. The improved YOLOv10 network not only exhibits excellent adaptability in addressing issues such as blurry images, complex backgrounds, strong illumination, and occlusion in disease detection, but also achieves high levels of precision and recall, thereby laying a solid technological foundation for precision agriculture and intelligent decision-making.

Author Contributions

Conceptualization, writing—original draft preparation, methodology, X.G. and C.Y.; software, investigation, Z.W.; formal analysis, J.Z.; conceptualization, writing—review and editing, funding acquisition, S.Z. and B.W. All authors have read and agreed to the published version of the manuscript.

Funding

This research was funded by Study on the screening mechanism of phenotypic plasticity characteristics of large-leaf tea plants in Yunnan driven by AI based on data fusion (202301AS070083); Yunnan Menghai County Smart Tea Industry Science and Technology Mission (202304Bl090013); and National Natural Science Foundation (32460782).

Institutional Review Board Statement

Not applicable.

Informed Consent Statement

Not applicable.

Data Availability Statement

The raw data supporting the conclusions of this article will be made available by the authors on request.

Conflicts of Interest

The authors declare no conflicts of interest.

References

  1. Lee, S.; Lee, S. Efficient Data Augmentation Methods for Crop Disease Recognition in Sustainable Environmental Systems. Big Data Cogn. Comput. 2025, 9, 8. [Google Scholar] [CrossRef]
  2. Li, Z.; Sun, J.; Shen, Y.; Yang, Y.; Wang, X.; Wang, X.; Tian, P.; Qian, Y. Deep migration learning-based recognition of diseases and insect pests in Yunnan tea under complex environments. Plant Methods 2024, 20, 101. [Google Scholar] [CrossRef]
  3. Yang, W.; Yang, H.; Bao, X.; Hussain, M.; Bao, Q.; Zeng, Z.; Xiao, C.; Zhou, L.; Qin, X. Brevibacillus brevis HNCS-1: A biocontrol bacterium against tea plant diseases. Front. Microbiol. 2023, 14, 1198747. [Google Scholar] [CrossRef]
  4. Liang, J.; Liang, R.; Wang, D. A novel lightweight model for tea disease classification based on feature reuse and channel focus attention mechanism. Eng. Sci. Technol. Int. J. 2025, 61, 101940. [Google Scholar] [CrossRef]
  5. Ye, R.; Shao, G.; Yang, Z.; Sun, Y.; Gao, Q.; Li, T. Detection Model of Tea Disease Severity under Low Light Intensity Based on YOLOv8 and EnlightenGAN. Plants 2024, 13, 1377. [Google Scholar] [CrossRef]
  6. Lin, J.; Bai, D.; Xu, R.; Lin, H. TSBA-YOLO: An improved tea diseases detection model based on attention mechanisms and feature fusion. Forests 2023, 14, 619. [Google Scholar] [CrossRef]
  7. Yu, S.; Xie, L.; Huang, Q. Inception convolutional vision transformers for plant disease identification. Internet Things 2023, 21, 100650. [Google Scholar] [CrossRef]
  8. Nigam, S.; Jain, R.; Marwaha, S.; Arora, A.; Haque, M.A.; Dheeraj, A.; Singh, V.K. Deep transfer learning model for disease identification in wheat crop. Ecol. Inform. 2023, 75, 102068. [Google Scholar] [CrossRef]
  9. Li, E.; Wang, L.; Xie, Q.; Gao, R.; Su, Z.; Li, Y. A novel deep learning method for maize disease identification based on small sample-size and complex background datasets. Ecol. Inform. 2023, 75, 102011. [Google Scholar] [CrossRef]
  10. Li, H.; Yuan, W.; Xia, Y.; Wang, Z.; He, J.; Wang, Q.; Zhang, S.; Li, L.; Yang, F.; Wang, B. YOLOv8n-WSE-Pest: A Lightweight Deep Learning Model Based on YOLOv8n for Pest Identification in Tea Gardens. Appl. Sci. 2024, 14, 8748. [Google Scholar] [CrossRef]
  11. Mohammadi, S.; Uhlen, A.K.; Aamot, H.U.; Dieseth, J.A.; Shafiee, S. Integrating UAV-based multispectral remote sensing and machine learning for detection and classification of chocolate spot disease in faba bean. Crop Sci. 2025, 65, e21454. [Google Scholar] [CrossRef]
  12. Ji, J.; Zhao, Y.; Li, A.; Ma, X.; Wang, C.; Lin, Z. Dense small object detection algorithm for unmanned aerial vehicle remote sensing images in complex backgrounds. Digit. Signal Process. 2025, 158, 104938. [Google Scholar] [CrossRef]
  13. Di, S.; Zong, M.; Li, S.; Li, H.; Duan, C.; Peng, C.; Zhao, Y.; Bai, J.; Lin, C.; Feng, Y.; et al. The effects of the soil environment on soil organic carbon in tea plantations in Xishuangbanna, southwestern China. Agric. Ecosyst. Environ. 2020, 297, 106951. [Google Scholar] [CrossRef]
  14. Huang, Z.; Bai, X.; Gouda, M.; Hu, H.; Yang, N.; He, Y.; Feng, X. Transfer learning for plant disease detection model based on low-altitude UAV remote sensing. Precis. Agric. 2025, 26, 15. [Google Scholar] [CrossRef]
  15. Du, M.; Wang, F.; Wang, Y.; Li, K.; Hou, W.; Liu, L.; He, Y.; Wang, Y. Improving long-tailed pest classification using diffusion model-based data augmentation. Comput. Electron. Agric. 2025, 234, 110244. [Google Scholar] [CrossRef]
  16. Ünalan, S.; Günay, O.; Akkurt, I.; Gunoglu, K.; Tekin, H.O. A comparative study on breast cancer classification with stratified shuffle split and K-fold cross validation via ensembled machine learning. J. Radiat. Res. Appl. Sci. 2024, 17, 101080. [Google Scholar] [CrossRef]
  17. Wang, A.; Chen, H.; Liu, L.; Chen, K.; Lin, Z.; Han, J. Yolov10: Real-time end-to-end object detection. Adv. Neural Inf. Process. Syst. 2024, 37, 107984–108011. [Google Scholar]
  18. Lu, Z.; Liao, L.; Xie, X.; Yuan, H. SCoralDet: Efficient real-time underwater soft coral detection with YOLO. Ecol. Inform. 2025, 85, 102937. [Google Scholar] [CrossRef]
  19. Mao, H.; Chen, Y.; Li, Z.; Chen, P.; Chen, F. Sctracker: Multi-object tracking with shape and confidence constraints. IEEE Sens. J. 2023, 24, 3123–3130. [Google Scholar] [CrossRef]
  20. Li, Y.; Yang, W.; Wang, L.; Tao, X.; Yin, Y.; Chen, D. HawkEye Conv-Driven YOLOv10 with Advanced Feature Pyramid Networks for Small Object Detection in UAV Imagery. Drones 2024, 8, 713. [Google Scholar] [CrossRef]
  21. Finder, S.E.; Amoyal, R.; Treister, E.; Freifeld, O. Wavelet convolutions for large receptive fields. In Proceedings of the European Conference on Computer Vision, Milan, Italy, 29 September–4 October 2024; Springer: Cham, Switzerland, 2024; pp. 363–380. [Google Scholar]
  22. Sun, S.; Ren, W.; Gao, X.; Wang, R.; Cao, X. Restoring Images in Adverse Weather Conditions via Histogram Transformer; Springer: Cham, Switzerland, 2024; pp. 111–129. [Google Scholar]
  23. Guan, S.; Lin, Y.; Lin, G.; Su, P.; Huang, S.; Meng, X.; Liu, P.; Yan, J. Real-time detection and counting of wheat spikes based on improved YOLOv10. Agronomy 2024, 14, 1936. [Google Scholar] [CrossRef]
  24. Yuan, W.; Lan, L.; Xu, J.; Sun, T.; Wang, X.; Wang, Q.; Hu, J.; Wang, B. Smart Agricultural Pest Detection Using I-YOLOv10-SC: An Improved Object Detection Framework. Agronomy 2025, 15, 221. [Google Scholar] [CrossRef]
  25. Mandal, A.K.; Dehuri, S.; Sarma, P.K.D. Analysis of machine learning approaches for predictive modeling in heart disease detection systems. Biomed. Signal Process. Control 2025, 106, 107723. [Google Scholar] [CrossRef]
  26. Wang, Z.; Zhang, S.; Chen, Y.; Xia, Y.; Wang, H.; Jin, R.; Wang, C.; Fan, Z.; Wang, Y.; Wang, B. Detection of small foreign objects in Pu-erh sun-dried green tea: An enhanced YOLOv8 neural network model based on deep learning. Food Control 2025, 168, 110890. [Google Scholar] [CrossRef]
  27. Pan, W.; Chen, J.; Lv, B.; Peng, L. Lightweight marine biodetection model based on improved YOLOv10. Alex. Eng. J. 2025, 119, 379–390. [Google Scholar] [CrossRef]
Figure 1. Data collection.
Applsci 15 05301 g001
Figure 2. Data enhancement.
Applsci 15 05301 g002
Figure 3. Dataset label visualization.
Applsci 15 05301 g003
Figure 4. Structure of the improved YOLOv10 network.
Applsci 15 05301 g004
Figure 5. Wavelet Transform Conv.
Applsci 15 05301 g005
Figure 6. Histogram Transformer.
Applsci 15 05301 g006
Figure 7. Loss function change curve.
Applsci 15 05301 g007
Figure 8. Comparison of precision, recall, and F1 before and after the YOLOv10 network improvement.
Applsci 15 05301 g008
Figure 9. Confusion matrix.
Applsci 15 05301 g009
Figure 10. External validation comparison.
Applsci 15 05301 g010
Table 1. Detailed parameters of the improved YOLOv10 network.
IDFromParamsModuleArguments
0−1464Conv[3, 16, 3, 2]
1−14672Conv[16, 32, 3, 2]
2−15216WTConv[32, 32]
3−118,560Conv[32, 64, 3, 2]
4−120,864WTConv[64, 64]
5−173,984Conv[64, 128, 3, 2]
6−141,728WTConv[128, 128]
7−1295,424Conv[128, 256, 3, 2]
8−141,728WTConv[256, 256]
9−1164,608SPPF[256, 256, 5]
10−1249,728PSA[256, 256]
11−10Upsample[None, 2, ‘nearest’]
12[−1, 6]0Concat[1]
13−1148,224C2f[None, 2, ‘nearest’]
14−10Upsample[1]
15[−1, 4]0Concat[192, 64, 1]
16−137,248C2f[64]
17−159,540Histogram Transformer[64, 64, 3, 2]
18−136,992Conv[1]
19[−1, 13]0Concat[192, 128, 1]
20−1123,648C2f[128, 128, 3, 2]
21−1147,712Conv[1]
22[−1, 10]0Concat[384, 256, 1]
23−1493,056C2f[1]
24[17, 20, 23]862,888v10Detect[4, [64, 128, 256]]
Note: Params represents the number of parameters used in the network module. The Module column represents the module of the layer. Arguments is the specific parameter configuration of the module, which describes the detailed information of the input and output dimensions of the module.
Table 2. Ablation experiment results.
ModelPrecision (%)Recall (%)mAP (%)LayersParametersGradients
YOLOv1081.9878.0380.974022,497,7782,497,762
YOLOv10 + W80.3381.7584.933232,766,3542,744,834
YOLOv10 + H80.4982.4785.673693,431,3023,431,286
YOLOv10 + L80.8781.3585.214022,497,7782,497,762
YOLOv10 + W + H82.9784.8889.483392,825,8942,804,374
YOLOv10 + W + L81.0383.5787.333232,766,3542,744,834
YOLOv10 + H + L83.8586.3790.163693,431,3023,431,286
YOLOv10 + W + H + L85.3888.0892.923392,825,8942,804,374
Note: L represents loss optimization, W represents Wavelet Transform Conv optimization, and H represents Histogram Transformer improvement.
Table 3. Model comparison experiment results.
ModelPrecision (%)Recall (%)F1 (%)mAP (%)
Improved YOLOv1085.3888.0886.7192.92
YOLOv1081.9878.0379.9680.97
YOLOv1276.1676.0376.0980.33
CornerNet69.1369.4969.3172.61
SSD71.8770.5571.2074.88
Disclaimer/Publisher’s Note: The statements, opinions and data contained in all publications are solely those of the individual author(s) and contributor(s) and not of MDPI and/or the editor(s). MDPI and/or the editor(s) disclaim responsibility for any injury to people or property resulting from any ideas, methods, instructions or products referred to in the content.

