Article

Advancing Concrete Pavement Rehabilitation and Strategic Management Through Nondestructive Testing at Toll Stations

by
Konstantinos Gkyrtis
1,
Christina Plati
2,* and
Andreas Loizos
2
1
Department of Civil Engineering, Democritus University of Thrace (DUTh), 67100 Xanthi, Greece
2
Laboratory of Pavement Engineering, National Technical University of Athens (NTUA), 15772 Athens, Greece
*
Author to whom correspondence should be addressed.
Appl. Sci. 2025, 15(10), 5304; https://doi.org/10.3390/app15105304
Submission received: 9 April 2025 / Revised: 1 May 2025 / Accepted: 6 May 2025 / Published: 9 May 2025

Abstract

In contrast to maintaining asphalt pavements, maintaining healthy and functional concrete pavements is a much greater challenge due to the especially brittle nature of concrete, which may require a more complex rehabilitation plan. Thanks to nondestructive testing, noninvasive on-site inspections can be carried out to assess a pavement’s condition, with the falling weight deflectometer (FWD) being the most representative example. In this study, five toll stations with concrete pavements in operation, for which no long-term monitoring protocols existed yet, were evaluated mainly with deflectometric tests using the FWD. The objective of the study was to propose a methodological framework to support responsible decision-makers in the strategic management of concrete pavements at toll stations. To meet this aim, a test campaign was organized to evaluate the pavement condition of individual slabs or lanes, assess the durability of the slabs, and determine the efficiency of load transfer across joints and cracks. As a key finding, pavement slab deflections were found to exhibit a considerable range; in particular, a range of 50–1450 μm for the maximum deflection of the FWD was observed. This finding stimulated a distribution fitting analysis to estimate characteristic values and thresholds for common deflection indicators that were validated on the basis of pavement design input data. Finally, the study proceeded with the development of a conceptual approach proposing evaluation criteria for individual slab assessment and the condition mapping of in-service concrete pavements.

1. Introduction

Concrete is a composite material defined as an artificial stone-like mass produced by mixing binders (cement or lime) with aggregates, water, additives, etc., in a specific ratio. Most concrete consists of Portland cement, aggregates (gravel and crushed stone), and sand, to which water is added. It is a cost-effective material that has good compressive strength and does not crush or break, even under high compressive forces. When used in pavement construction, its special properties require particular care to maintain the strength and serviceability of the pavement [1]. For example, when the first crack appears in a concrete pavement, it is more likely to become a deep crack immediately due to the brittleness of the material [2]. If the crack is not sealed in time, the crack width will increase over time, and the cracked slab will split into independent parts, which may indicate poor load transfer [3]. For this reason, minor rehabilitation measures, such as minor repairs, partial replacement, etc., which may work for asphalt pavements, are not always effective for concrete pavements [4]. Even if it is decided to renew the entire pavement, in a relatively large study area, it is inefficient to select individual slabs for replacement, as this will lead to additional pavement damage in the adjacent undamaged slabs [5].
Another common cause of damage to concrete pavement near edges or corners is the condition of the joints, especially in jointed plain concrete pavement (JPCP). With this type of pavement, the joints must be properly maintained to control the location where cracking may occur [6]. Joints with poor load transfer efficiency (LTE) may indicate poor pavement performance, susceptibility to failure, and lack of cooperation with adjacent slabs [7]. In addition, the effects of environmental factors are critical to the behavior of concrete pavements [8]. Temperature differences across the slab thickness can lead to shrinkage cracking and thus to an increased risk of failure, regardless of the traffic load [9,10]. For this reason, both material quality control (i.e., correct mix composition, control of voids, etc.) and structural aspects (e.g., curing time of the material, climatic conditions during paving, etc.) are equally important from the beginning of the service life of a concrete pavement [11,12]. In addition, road pavements are an important means of transportation within a nation and need to be strategically monitored and continuously maintained. However, developing pavement rehabilitation plans is always a challenge, simply due to budget constraints. Accurately determining the pavement condition on site is again the first and most important measure for rational pavement management [1].
The use of nondestructive testing (NDT) dominates in the field of pavement condition assessment due to its non-invasive nature [8,13,14]. Deflection tests with the well-established falling weight deflectometer (FWD) are usually performed at different locations of a concrete slab, e.g., in the center, at the edges, and in the corners [1,15,16]. The evaluation of deflection changes within a single slab provides information about possible problems with the durability of the pavement. The FWD is also a powerful tool for assessing the ability of the pavement to transfer loads on both sides of a joint or crack. Given these capabilities, there are numerous studies that support the use of the FWD for the condition assessment of concrete pavements [17,18,19]. However, when evaluating layer properties by back-calculating the stiffness profile, concerns have been raised about the efficiency of modeling the deflection profile, especially for aged or cracked pavements [20]. More recently, continuous deflection measurements have also been carried out using the rolling wheel deflectometer (RWD) [18,21,22]. However, the key operating principles of the RWD have yet to be fully understood and adopted by engineers, as the FWD is versatile and has gained worldwide acceptance. Ground-penetrating radar (GPR) is another nondestructive testing method used to complement deflectometric testing by measuring the thickness of pavement layers and assessing the condition of the subgrade, e.g., voids, defects, settlement, and moisture ingress into pavement layers [18,23,24]. Advanced methods for the nondestructive detection of the depth of origin of cracks using GPR have also been proposed in the literature [6,25]. To a lesser extent, the use of other nondestructive testing methods, such as ultrasonic testing and seismic survey methods, has also been reported [1].
Despite the challenges mentioned above, NDT methods for assessing the condition of concrete pavements are not standardized for three main reasons. The first reason is that the main focus of road authorities is on asphalt pavements, which make up the majority of the road network, while concrete pavements may account for only a small percentage in different countries. Secondly, the large number of different NDT systems makes it difficult to standardize the test methods used in practice. Thirdly, the evaluation of concrete pavements is often neglected in pavement management due to their high material strength, which means that these pavements may not be structurally monitored or maintained on a regular basis [26]. This, in turn, can lead to a lack of performance data over the life of the pavement, which hinders the development of robust management strategies. Therefore, many researchers involved in field pavement evaluation are forced to resort to case-based methods when inspecting concrete pavements, although there is a consensus that the FWD is the most commonly used method. This is also confirmed by many reports from the USA where, unlike other countries, the proportion of concrete pavements is significant. Therefore, the use of the FWD is recommended because of its versatility in assessing deflection changes over the length of the investigated areas; thus, many authorities worldwide are familiar with this system, and the data collected are accurate overall [4,5].
With this background, the authors present a methodological framework developed ad hoc for the condition assessment of a considerable number of toll stations on a highly trafficked urban highway with a JPCP section. A trial campaign was organized that included a detailed visual inspection of the study area, deflectometric testing with an FWD, and core drilling to assess the thickness of the concrete slab and support the interpretation of the FWD data. The aim of this campaign was to assess the condition of individual pavement slabs or lanes and to assist relevant decision-makers in the condition mapping and strategic management of these pavements. The main issues in this particular case of the study were the age of the pavements at the time of testing, which was more than fifteen years, and, most importantly, the lack of previous monitoring data that could be used as a reference for assessing the evolution of pavement performance over time.

2. Materials and Methods

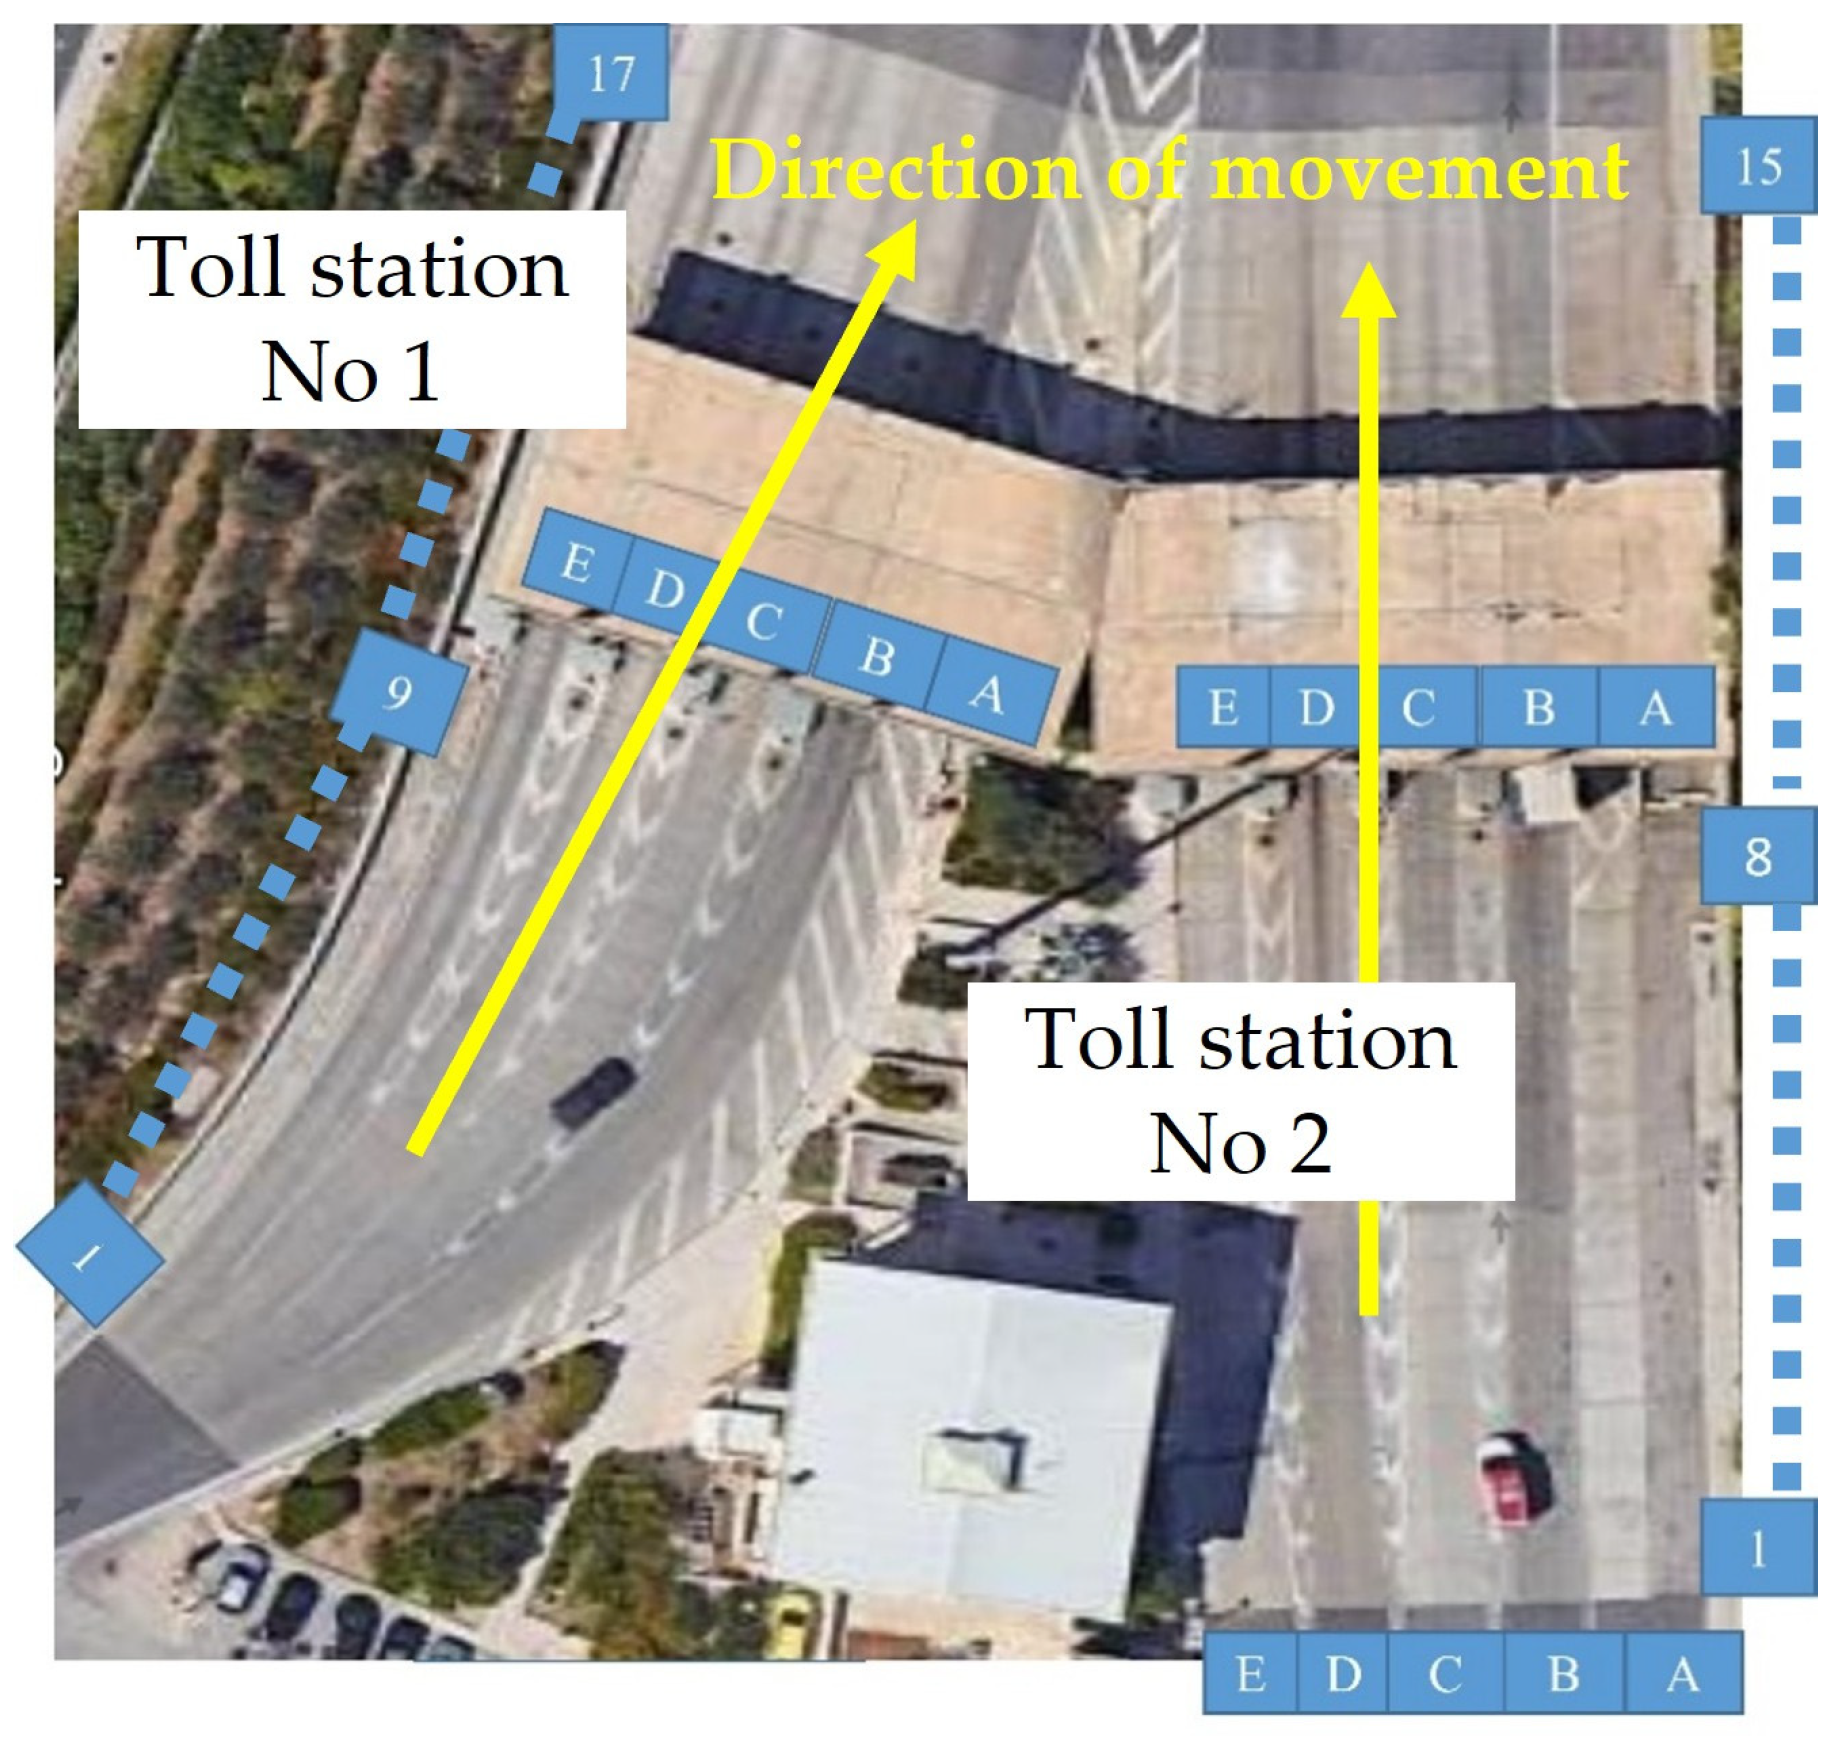
2.1. Test Site and Pavement Structure

The investigation area included five toll stations. The first action during the inspection procedures was to consistently code all slabs of a station; an example is shown in Figure 1. The slabs were named alphabetically in the transverse direction, while a typical lane numbering system was used in the longitudinal direction.
A typical cross-section of the pavements under investigation is presented in Figure 2. A concrete layer of around 25–27 cm was laid upon a crushed-stone granular base, and the whole structure was grounded on a subgrade of high-quality natural gravel.
The illustrated thicknesses in Figure 2 refer to the design values. In situ coring results verified the thickness of the concrete layer at various locations.

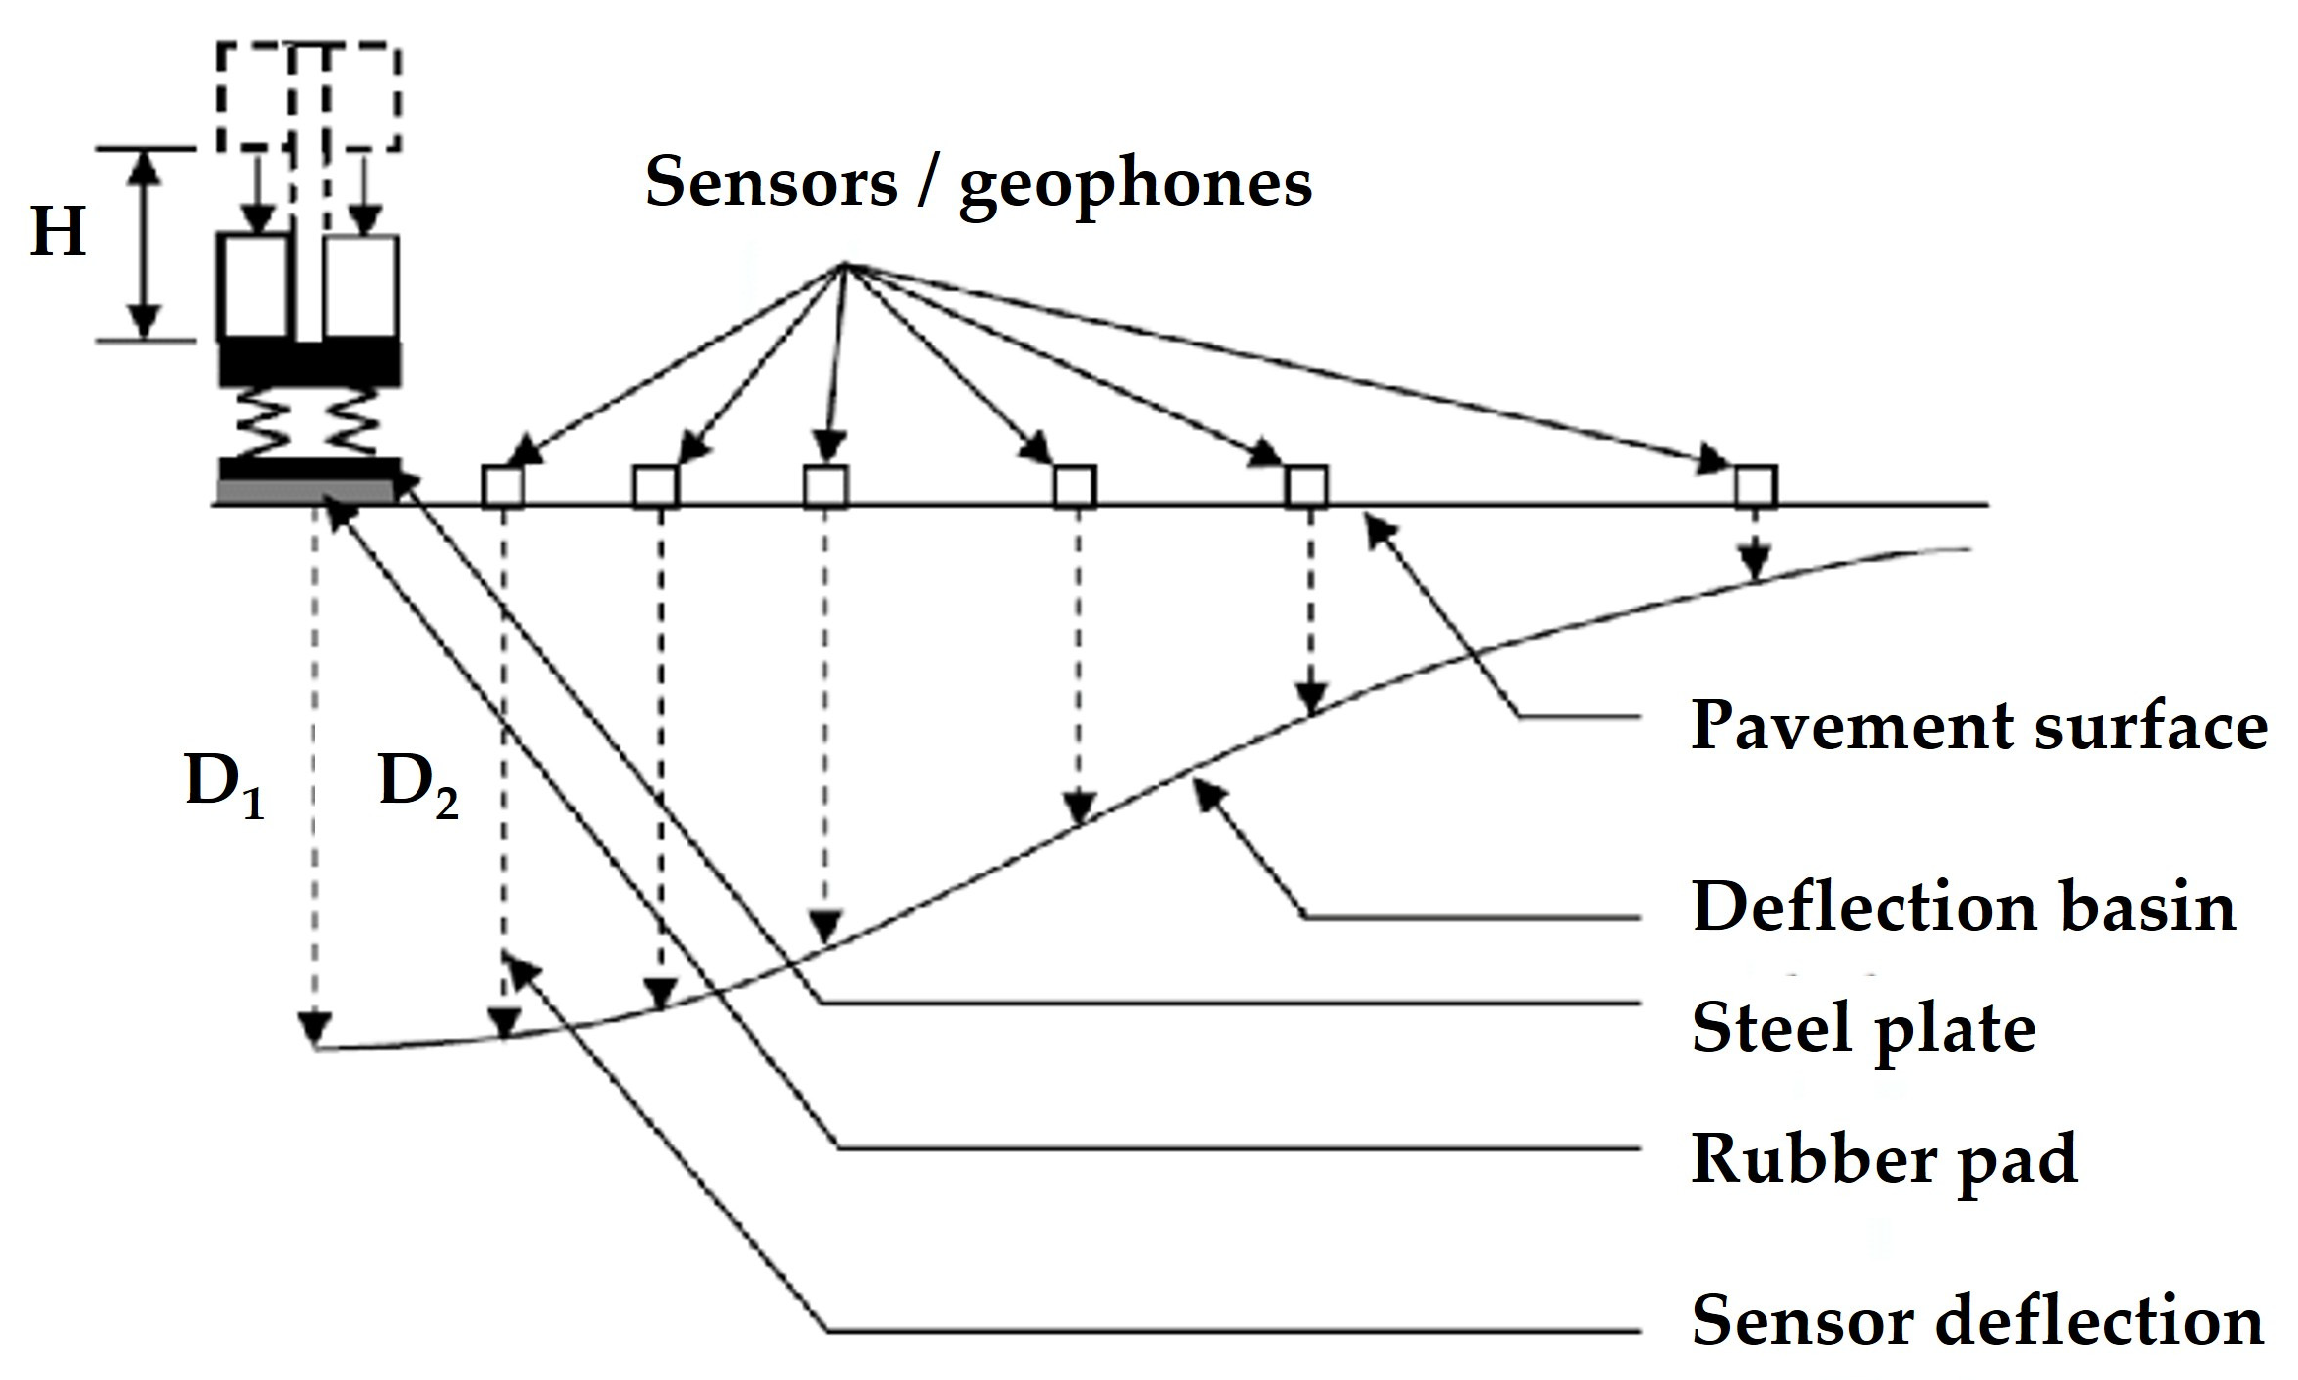
2.2. Inspection Procedure

Visual inspection was carried out in accordance with [27]. Overall, several types of damage were found, including longitudinal cracks in the center of the pavement slabs, transverse cracks, limited corner breakouts, and sealing damage at joints and cracks. At one of the toll plazas, the phenomenon of map cracking (or “crazy” cracking), similar to the pattern of alligator cracking in asphalt pavements, was observed (e.g., Figure 3a), followed by site-specific potholes (e.g., Figure 3b) of considerable size. In addition, the longitudinal and transverse cracks appeared to be connected in most cases and ran along adjacent slabs (e.g., Figure 3c). Finally, the presence of faulting was observed in some fully damaged slabs (e.g., Figure 3d), with the individual parts of a cracked slab behaving completely independently of each other under load.
Based on the visual inspection findings, the assessment with the FWD could be a further aid in differentiating the condition of the examined pavements. It is worth mentioning that the FWD is a testing system that uses a load pulse applied stationary to the pavement surface to simulate a moving truck by dropping a known mass from a given height onto a steel plate embedded in the pavement surface [15]. The result of this process is a typical deflection profile, the so-called deflection basin, which is shown in Figure 4. The deflections of the pavement are usually recorded with a series of sensors/geophones at predefined distances from the center of the load plate. During the test, random samples of slabs were loaded in the direction of travel at each toll station (Figure 5a) so that the entire test area was covered. The focus was naturally set on the damaged slabs, but intact slabs were also tested for comparison purposes.
Based on the deflection basin recorded at each location, two deflectometric indicators were evaluated, namely:
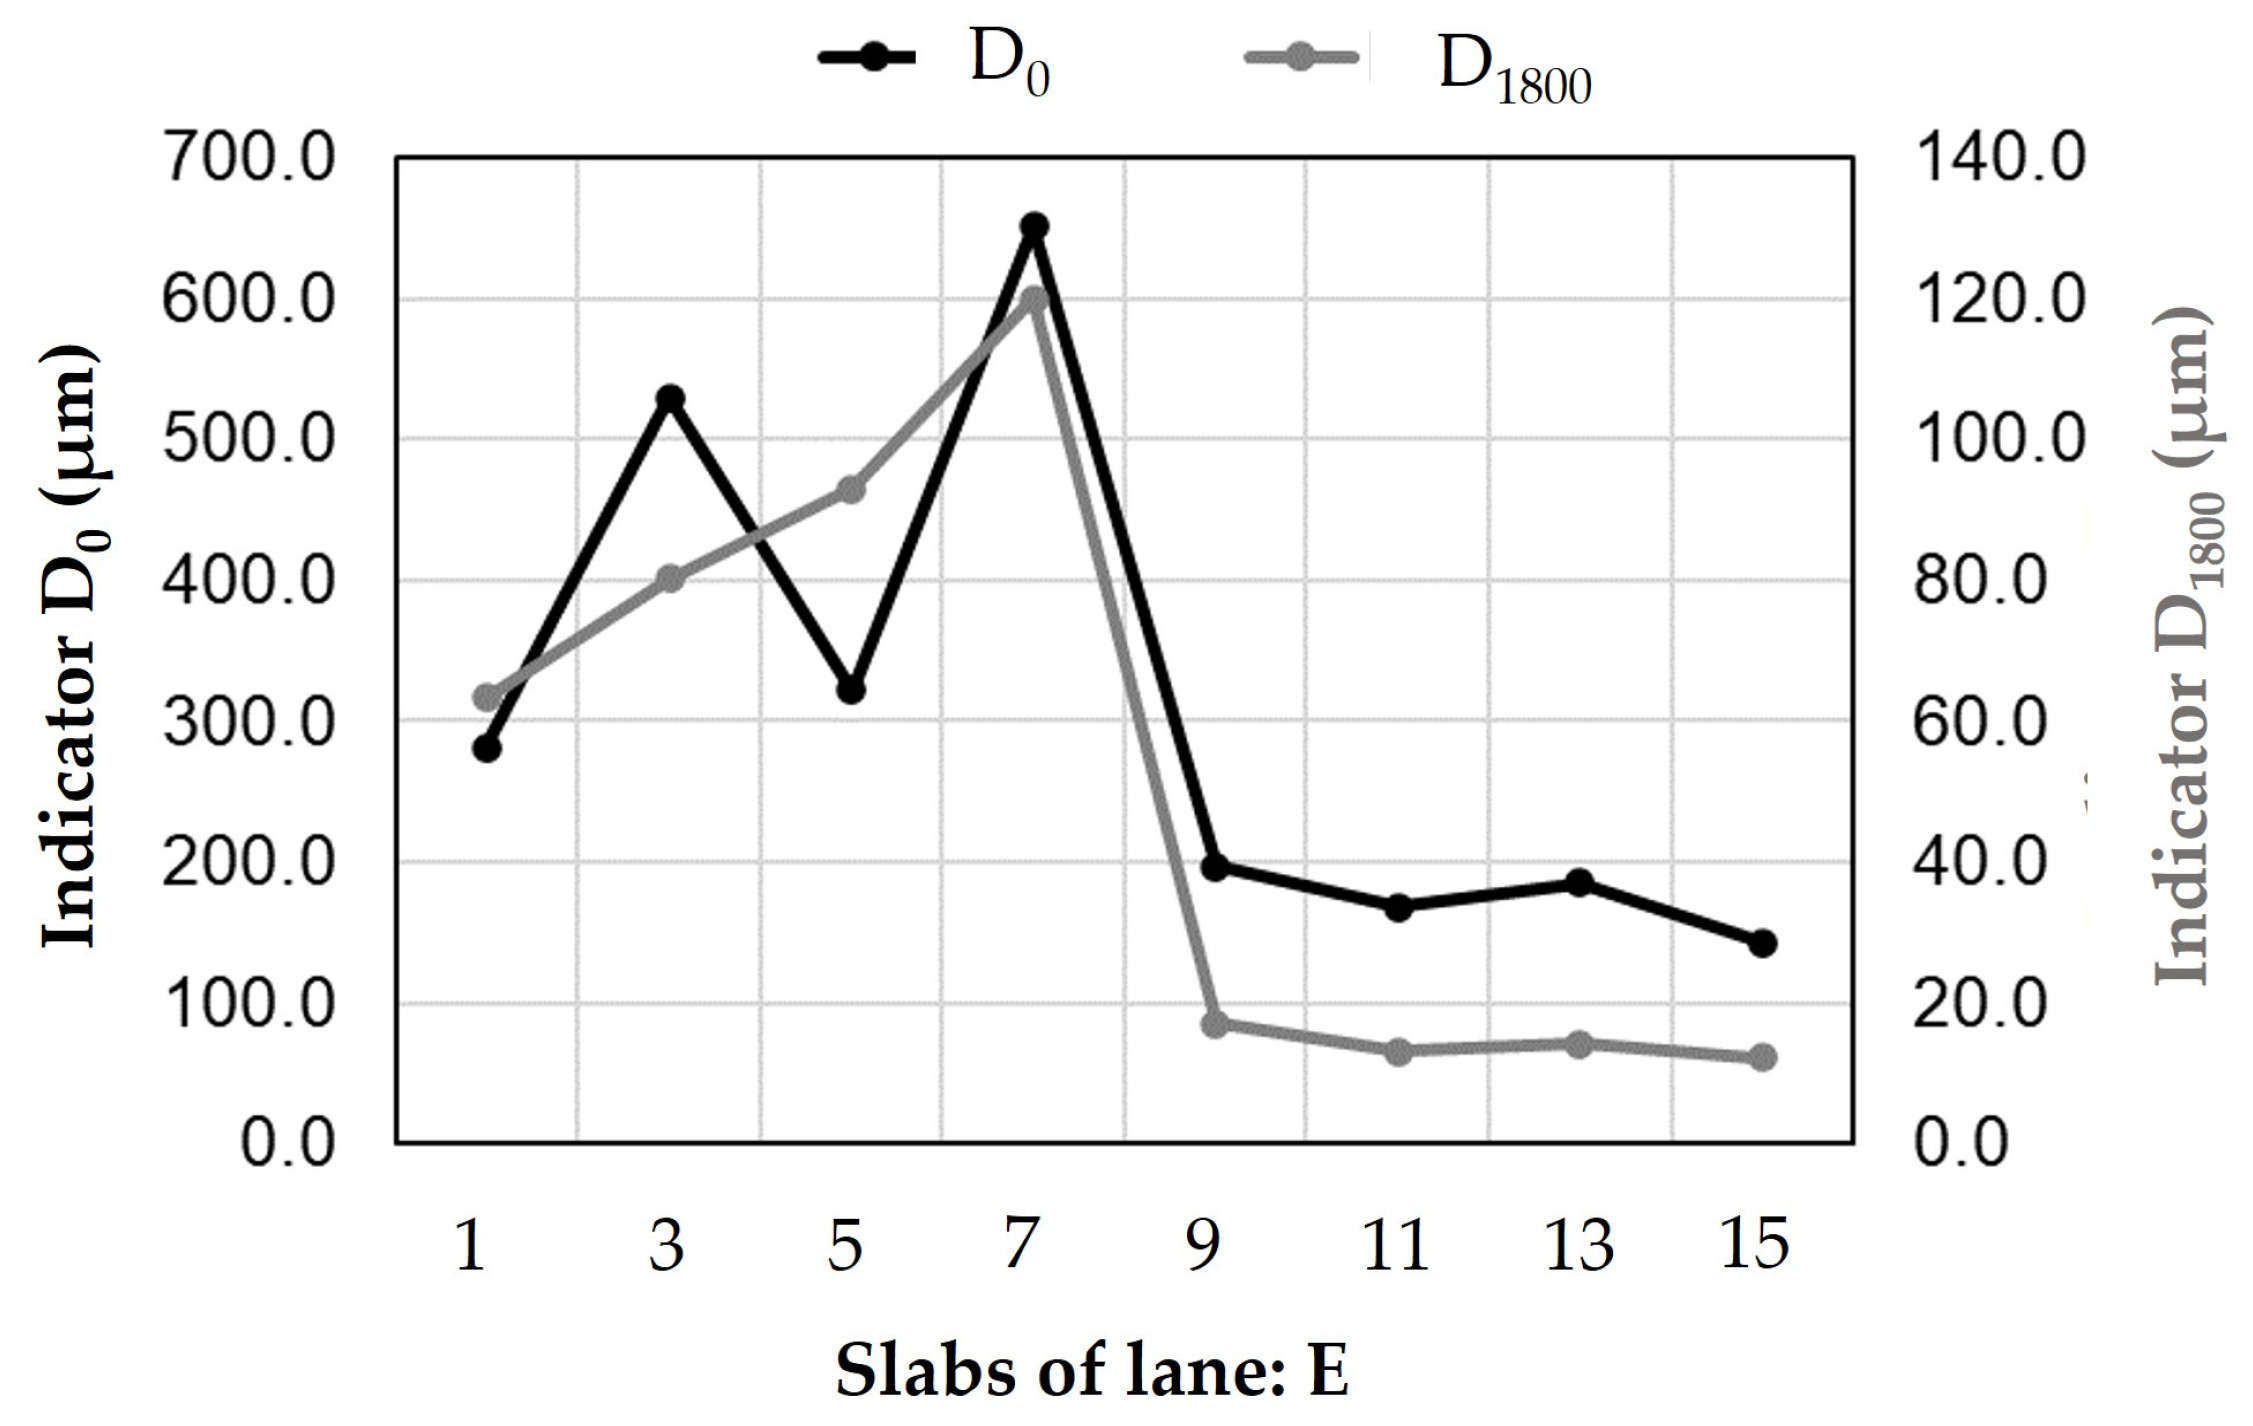
  • D0 (μm): the maximum central deflection, recorded in the loading plate directly beneath the loading point. This indicator reflects the overall pavement condition.
  • D1800 (μm): the deflection recorded from the outer sensor/geophone located at a distance of 1800 mm from the loading center. This indicator is known to reflect the substructure condition.
It should be noted that there are no guidelines or rules for the magnitude of the FWD load for concrete pavements, but the general trend is to use higher loads than for asphalt pavements to activate the proper pavement responses and provide meaningful data [16]. In this study, a load of 95 kN was applied and distributed on a 150 mm-diameter loading plate, in accordance with the authors’ previous relevant experience [15].
The FWD load was then applied near the slab edges (Figure 5b) and corners (Figure 5c) to assess the deflection differences within a single slab and evaluate the durability of the pavement. The slabs subjected to durability testing were again randomly selected to cover a large portion of the study area. It is noted that durability is likely to be more critical for airfield pavements, as the movement of aircraft does not always coincide with the slab’s axis; therefore, the behavior of the slab at the edges and corners is equally important. Durability is assessed on the basis of the impulse stiffness modulus (ISM) at the edges or corners, which is defined as follows [28]:
I S M i = F c e n t e r D 0 c e n t e r F i D 0 i
where:
  • F c e n t e r , D 0 c e n t e r : load and maximum deflection at the slab center;
  • i : location referring to either a slab edge or corner;
  • F i , D 0 i : load and maximum deflection at the i -location of a slab.
The last part of the FWD measures was devoted to the assessment of the ability of adjacent slabs to distribute load, which was performed with the LTE ratio, defined as:
L T E   ( % ) = D u n l o a d e d D l o a d e d
where:
  • D l o a d e d : deflection (μm) recorded in the loaded slab, normally under the FWD plate (i.e., D0);
  • D u n l o a d e d : deflection (μm) recorded in the adjacent unloaded slab, usually at a radial distance of 300 mm from the FWD plate center (i.e., D300).
For the assessment of LTE at joints, the FWD configuration in Figure 5b was used, as well as for the measurement of slab edges. In this case, it is clarified that the distance between the sensor/geophone measuring the loaded slab and the sensor/geophone measuring the unloaded slab is 30 cm, and the FWD system is placed so that the joint is exactly in the middle. Similar to the LTE calculation for joints, LTE assessment is useful for assessing the ability of two individual slab sections separated by a crack to cooperate with each other and transfer loads efficiently. Therefore, additional FWD measurements were performed on randomly selected cracks with small and large widths. The FWD was positioned so that the crack was at the midpoint between the loading plate and the third sensor/geophone measuring the deflection D300 (Figure 5d).
For the destructive part of the test campaign, a limited number of cores were taken to obtain an overview of the concrete thickness and to check the crack propagation depth of random cracks, regardless of their width. A total of sixteen cores were taken, with a mean thickness of 27.2 cm and a coefficient of variation (CV) of 6%. With this value, the upper limit of the thickness range shown in Figure 2 was satisfactorily achieved at all stations investigated.

2.3. Conceptual Measures and Analysis

The methodological framework for data collection and analysis is shown in Figure 6. The main problem with the assessment of the deflection indicators D0 and D1800 is the lack of internationally available benchmarking values, which is somewhat justified due to the variety of parameters that affect pavement performance, such as pavement layers, material properties, etc. Wherever thresholds are developed, they have limited validity for the pavements under consideration. In addition, the test load for concrete pavements is not clearly defined and is usually chosen during the assessment based on case-dependent conditions. Based on limited available information, Chen et al. [18] specified the limit value D0 = 127 μm at a load of 45 kN to distinguish structurally sound pavements for the case of continuously reinforced structures.
A critical issue in this study was that there were no previous deflectometric measurements that could be used as a reference. Therefore, it was not possible to assess the evolution of the performance of the pavement over time. For this reason, it was necessary to establish threshold values (i.e., control values—Figure 6) that would apply to the pavements in question depending on their condition at the time of assessment. The procedure to achieve this objective was first based on the determination of characteristic values through a distribution-fitting analysis considering the whole sample of D0 and D1800 values. Then, a critical engineering judgment was made to increase the characteristic values by a certain percentage to obtain the threshold values. The latter values were evaluated on the basis of the theoretical response of the pavement structure, considering the thicknesses and properties assumed in the design but under the in situ test load.
As already mentioned, durability tests are mainly recommended for airfield pavements. Nevertheless, this type of assessment was also performed here, following the Federal Aviation Administration (FAA) guidelines for condition assessment based on durability. The FAA [28] specifies ISM thresholds for the quantitative assessment of durability problems. ISM values above 3 may indicate poor durability at a corner or edge of the pavement slab. Values between 3 and 1.5 indicate questionable durability, while ISM values below 1.5 guarantee good condition. These values were retrieved from the international literature [28] and were also used for this study.
In relation to the LTE assessment, this indicator lies between 0% and 100%. High values indicate complete cooperation between adjacent slabs, which can be enhanced by the presence of dowels that improve the performance of the pavement. Dowels were present in the tested slabs. Low LTE values indicate poor joint condition and increased susceptibility to faulting or corner breaks. In general, values falling below the threshold of 60–70% have been reported to indicate poor performance that may require action to rehabilitate the joints [3,4,29]. It should be noted that LTE is subject to daily variation depending on the surface temperature, which may cause the slab to expand and the joints to close. For this reason, LTE measurements are recommended at ambient temperatures of around 20–25 °C [4]. In this study, a value of 60% was conservatively used as a warning threshold for LTE at both joints and cracks.

3. Results and Discussion

3.1. Deflectometric Indicators

Overall, a closer examination of the deflectometric data at the center of pavement slabs revealed a considerable range over the length of a single lane and thus over the entire area of a single toll station. This was not necessarily expected, given the limited length of the toll stations compared to the total length of the highway, but it is entirely consistent with the varying extent of surface damage at the locations examined. An example of the observed trend is shown in Figure 7, where the change in D0 and D1800 over the length of a particular lane is shown. It is clarified that the deflection changes shown in Figure 7 refer to the whole lane, reflecting the damage evolution over the length of the lane, rather than to each slab. Each point on the lines in Figure 7 corresponds to a unique slab. The complete deflection data from all slabs and lanes at each toll station are presented in the form of descriptive statistics for both indicators (minimum, mean, standard deviation, CV, and maximum) in Table 1 and Table 2.
Similar to the sample lane shown in Figure 7, Table 1 and Table 2 show a considerable range of deflection indicators in all cases. These results are meaningful because the severity of the observed pavement damage varies, even within the same lane (as shown in Figure 7). Considering that the data measured in the field reflect the “as-is” (i.e., real-world) condition of the pavement structures, the observed deflection range created a need to map the condition of individual slabs and lanes as a function of the data collected through NDT. Next, laboratory testing of the quality and strength of the concrete may be required to facilitate analytical design for the rehabilitation of the damaged pavement. However, this aspect is beyond the scope of this study, which aimed to formulate the mapping of the collected NDT data for the benefit of decision making.
Therefore, due to the high CV values, the mean values cannot be regarded as representative for the evaluation of the pavements under consideration. Because of this result and the lack of earlier measurements for reference, further statistical processing of the values of the two indicators was required to estimate the characteristic values for the current structural condition of the pavements more accurately. As these values are dependent on the individual case, they can only be valid for the concrete pavements in question and only for the given point in time of the evaluation. For this purpose, the values of the two deflection indicators from all toll stations were subjected to a distribution fitting analysis to determine the probability density function corresponding to the values of the two indicators. For each indicator, a predominant value (out of a total of 191 values) and an indicative range around this value were determined. The results for indicators D0 and D1800 are shown in Figure 8 and Figure 9.
In both cases, it was found that the generalized extreme value distribution sufficiently takes into account the available data according to the Anderson–Darling evaluation criterion for the assessment of the goodness of fit. Figure 8 shows that a characteristic value of 145 μm (according to the red arrow in Figure 8), with a typical range of ±50 μm, was found for indicator D0 based on the value at which the probability density function reaches its maximum. This means that the characteristic value represents the value with the highest probability of occurrence. Similarly, for the D1800 indicator, a characteristic value of 13 μm (according to the red arrow in Figure 9), with a typical range of ±7 μm, was determined from the peak of the curve in Figure 9. It is assumed that these values characterize the majority of the pavement slabs.

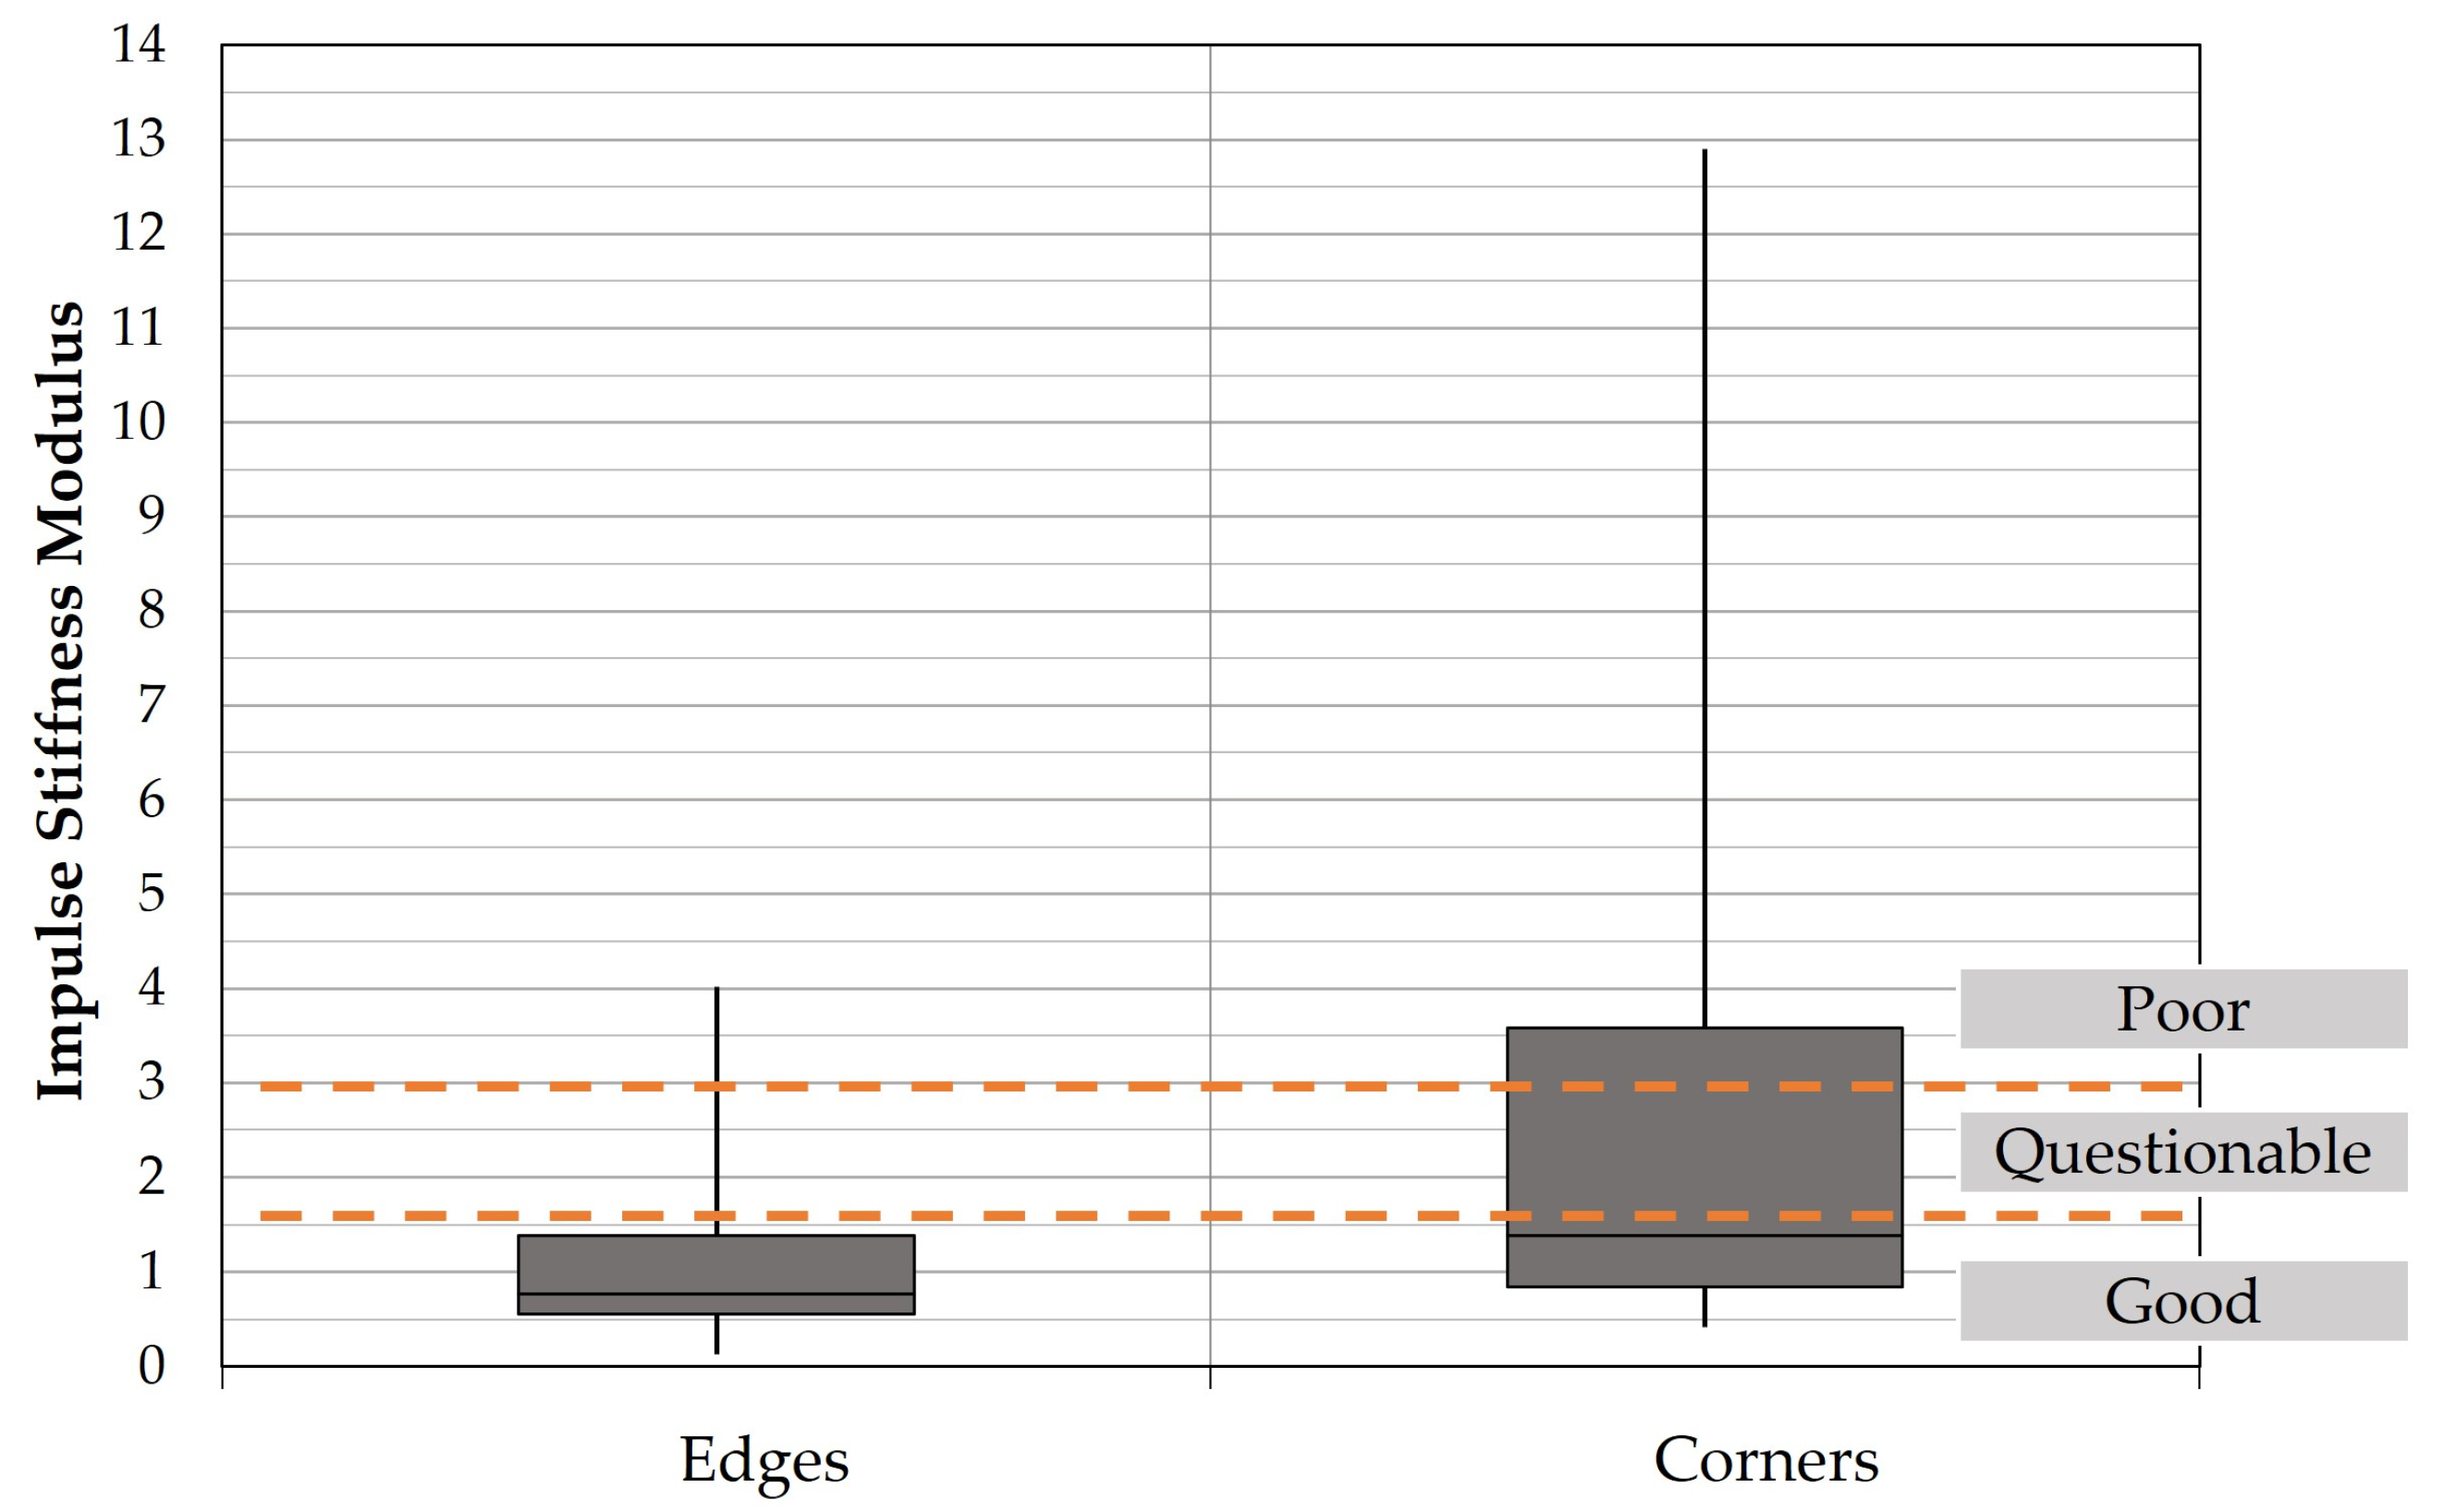
3.2. Durability Assessment

The assessment of durability makes sense considering that joints create discontinuities in a slab’s area. Following the discussion in Section 2.3 and the critical ISM values from the literature review [15,28], Figure 10 shows the results of the durability in the form of boxplots, taking into account the entire sample of data collected.
In general, durability was significantly better at the edges. The range of ISM at the corners was higher, indicating that the durability deteriorates locally when the load occurs at the corners. However, for toll stations that are predominantly in a straight line, vehicles have sufficient alignment length when approaching the toll booths, and the axis of movement does not deviate significantly from the axis of the individual lanes. Therefore, the direct load on the pavement slabs at the corners is limited, if not absent.

3.3. Load Transfer Efficiency

Based on Equation (2), the LTE results are presented in the form of boxplots for both joints and cracks in Figure 11. In general, the level of the LTE indicator is better for the joints and is more than 70% when considering the interquartile range of the whole sample, indicating satisfactory performance of the joints according to international experience [3,4,29]. In contrast, a greater deviation in load transfer is observed in cracks. This shows how important the results of the visual inspection are for a better interpretation of the LTE results. This means that higher LTE values were observed for cracks with a small opening width and shrinkage cracks, while lower values were observed for cracks with a larger width. This is consistent with observations from previous studies [15].
The presence of sealing material was found to have no specific influence on the LTE ratio. This is a reasonable finding given the age of the pavement and the fact that many of the cracks observed had formed several years prior to the time of assessment. This, combined with the brittleness of the concrete, may affect the long-term effectiveness of the waterproofing–sealing material, particularly if it is not applied in a timely manner. Finally, most of the cores taken over cracks were found to be penetrated to full depth, suggesting that the continuity of the surface layer of the pavement is interrupted, which is consistent with lower values of the LTE indicator.

3.4. Establishment of Criteria for Condition Assessment

The most important results of the test campaign so far include the following:
  • Deflectometric ranges increased across the study area, which required the definition of characteristic values through a distribution fitting analysis (characteristic D0 = 145 μm and characteristic D1800 = 13 μm).
  • The assessment of durability did not yield significant anomalies. Despite some high ISM values at individual slab corners, these are not directly loaded, implying that the durability assessment is less critical for the present case.
  • The LTE was satisfactory for the joints but showed a greater range for the cracks. Cracks with larger opening widths showed the lowest LTE values. The deflection indicators for the slabs with cracks were also of a higher order of magnitude than for the majority of the slabs. Therefore, it was assumed that the deflectometric assessment exceeded the LTE assessment.
Based on these results, there was a need to define thresholds (or control values) for both deflectometric indicators (i.e., D0 and D1800) to strategically manage the pavements under study. Based on the authors’ experience with deflectometric assessment of concrete pavements [15] and engineering judgment, it was decided to increase the characteristic values by 50% to define values beyond which the slabs should be considered ad hoc for possible rehabilitation planning. For this purpose, threshold values of D0 = 220 μm and D1800 = 20 μm were defined. To further verify the choice of these values, response calculations were performed for the design cross-section shown in Figure 2 using the in situ FWD load. Linear elastic behavior was assumed for all layers [30]. A maximum central deflection of 194 μm was determined, which is close to the limit value of 220 μm. To avoid being too conservative, a value of 220 μm was determined to be more suitable for slabs with a significant degree of damage.
Taking the above into account, three levels were defined to map the entire area. Since the purpose of this study was to develop a general framework for decision making, a color was assigned to each level to indicate the severity of a slab’s condition based on deflectometric assessment, LTE measures, and durability assessment, as shown in Figure 12. Orange indicates “Investigation for major rehabilitation, including slab replacement, etc.”; yellow indicates “Investigation for minor rehabilitation, including local repairs, joint restoration, crack sealing or resealing, etc.”; and green indicates “Do nothing.”
Of course, the final decision on what action to take should be made considering technoeconomic feasibility and the strategic priorities of the road owner. This means that even if individual slabs are assigned to the orange level, slab replacement in full lane still needs to be considered as an alternative, as in the former case, the anticipated service life of the restored slabs may be less than ten years [5]. In other words, slab replacement in a full lane could be a more rational preservation approach, as it limits the possibility that many surrounding undamaged slabs will reach failure potential earlier than initially expected because of the reconstruction procedure of individual slabs. An illustration of this concept is provided in Figure 13.
It should be noted that the way in which characteristic values and thresholds are defined is not unique and depends on the case-specific conditions on site, especially if there are no previous monitoring records for the pavement under investigation. In any case, the results of the visual inspection may trigger additional random deflectometric measurements and complement the interpretation of the deflectometric data. Furthermore, random locations may be also selected for core extraction and additional testing for material strength estimations to facilitate analytical design for potential rehabilitation. Nevertheless, this study emphasizes the need to collect NDT data on site to properly draw a preliminary map of the investigation area through the activation of the proposed conceptual procedure.

4. Conclusions

4.1. Key Findings

The planning of rehabilitation measures and the rational management of in-service concrete pavements is a difficult task, mainly due to the special properties of concrete and constructional aspects such as curing time, climatic conditions during the cutting process, etc. In the present study, an in-service JPCP structure was investigated without records of the initial condition as well as its condition over the lifespan. Three types of data were collected and analyzed based on FWD tests: deflection indicators, durability data, and load transfer data. The authors treated the collected data with descriptive statistics and distribution fitting analysis. The main findings of the study are as follows:
  • In situ deflectometric testing with the FWD detected changes in pavement slab deflections along the length of the lanes, with ranges of 50–1450 μm and 6–630 μm for the maximum deflection and the deflection of the outer geophone of the FWD, respectively.
  • The age of the pavements and the observed deterioration in the serviceability of the pavements were related to these deflection changes observed for both indicators.
  • Since field data reflect the “as is” condition of the pavement structures, decision-makers should rely on the produced results and their technoeconomic models for pavement management. Herein, the observed deflection ranges necessitated a probability analysis to define characteristic values that could reflect the condition of the majority of the pavement slabs investigated. These values were then increased to establish threshold values (or control values) that could classify the condition of the slabs and assist in the strategic management of pavements. In the present study, threshold values of D0 = 220 μm and D1800 = 20 μm were proposed.
  • The assessment of durability proved to be less critical, as individual cases with durability problems at the slab corners were already accounted for by the high values of the deflectometric indicators. In the present study, threshold values found in the literature [28] were proposed.
  • The LTE assessment showed relatively good conditions at the joints, while at the cracks, lower LTE values were consistent with the deflectometric indicators, indicating that lower LTE corresponded to higher deflectometric records. In the present study, a threshold value of 60% was proposed.
Based on the methodology followed with the FWD inspection and the above findings, an attempt was made to develop a framework to classify the condition of each slab based on the values of all deflection indicators analyzed. It was emphasized that, in parallel with the classification of slab condition, the technoeconomic feasibility of alternative maintenance strategies must be investigated to achieve optimal pavement management.

4.2. Prospects

The approach presented provides a generally applicable framework for the not-so-rare cases in which there are practically no existing monitoring records of a pavement’s status and therefore, new technical solutions are required based on the current state of the pavement under consideration. In addition, the framework may also be suitable for cases in which responsibility for road works is transferred from the public sector to the private sector (public–private partnership, PPP). In such cases, accurate assessments and the development of monitoring databases that can serve as references for future condition assessments are crucial for the feasibility of road management procedures. The contribution of the proposed framework to the decision-making in pavement assessment and rehabilitation planning will be further evaluated and verified by examining several in-service concrete pavements with varying levels of deterioration.

Author Contributions

Conceptualization, K.G., C.P. and A.L.; Methodology, K.G., C.P. and A.L.; Analysis, K.G.; Writing—original draft preparation, K.G.; Writing—review and editing, K.G., C.P. and A.L. All authors have read and agreed to the published version of the manuscript.

Funding

This research received no external funding.

Institutional Review Board Statement

Not applicable.

Informed Consent Statement

Not applicable.

Data Availability Statement

The data presented in this study are available in article.

Conflicts of Interest

The authors declare no conflicts of interest.

References

  1. Qiao, M.; Wang, X.; Hou, R. Case Study: Validation of the Spectral-Analysis-of-Surface-Waves Method for Concrete Pavement Condition Evaluation. Appl. Sci. 2023, 13, 11410. [Google Scholar] [CrossRef]
  2. Golewski, G.L. The Phenomenon of Cracking in Cement Concretes and Reinforced Concrete Structures: The Mechanism of Cracks Formation, Causes of Their Initiation, Types and Places of Occurrence, and Methods of Detection—A Review. Buildings 2023, 13, 765. [Google Scholar] [CrossRef]
  3. César, A.; Pradena, M. Sustainable Engineering: Load Transfer Characterization for the Structural Design of Thinner Concrete Pavements. Sustainability 2020, 12, 9153. [Google Scholar] [CrossRef]
  4. Federal Highway Administration (FHWA). Concrete Pavement Rehabilitation: Guide for Load Transfer Restoration; Publication No. FHWA-SA-97-103; U.S. Department of Transportation: Washington, DC, USA, 1997.
  5. California Department of Transportation (Caltrans). Concrete Pavement Guide, Part 3: Preservation Strategies; Chapter 320—Individual Slab Replacement; Division of Maintenance Pavement Program: Sacramento, CA, USA, 2015. [Google Scholar]
  6. Rasol, M.A.; Pérez-Gracia, V.; Fernandes, F.M.; Pais, J.C.; Solla, M.; Santos, C. NDT assessment of rigid pavement damages with ground penetrating radar: Laboratory and field tests. Int. J. Pavement Eng. 2022, 23, 900–915. [Google Scholar] [CrossRef]
  7. Vinay Babu, S.; Ushasree, J.; Soundararajan, M.; Dubey, S.; Sathish, T.; Chandramauli, A. Comparative analysis of load transfer efficiency in plain and continuously reinforced concrete pavements. In Materials Today: Proceedings; Elsevier: Amsterdam, The Netherlands, 2023. [Google Scholar] [CrossRef]
  8. Sun, Y.; Yu, X.; Liu, Z.; Liu, Y.; Tao, J. Advanced Ultrasonic Technology for Freezing Damage Prevention of Concrete Pavement. Int. J. Pavement Res. Technol. 2013, 6, 86–92. [Google Scholar]
  9. Yaqoob, S.; Silfwerbrand, J.; Balieu, R.G.R. A Parametric Study Investigating the Dowel Bar Load Transfer Efficiency in Jointed Plain Concrete Pavement Using a Finite Element Model. Buildings 2024, 14, 1039. [Google Scholar] [CrossRef]
  10. Rao, S.; Roesler, J.R. Characterizing Effective Built-In Curling from Concrete Pavement Field Measurements. J. Transp. Eng. 2005, 131, 320–327. [Google Scholar] [CrossRef]
  11. Yasien, A.; Ghazy, A.; Bassuoni, M. Performance of Concrete Pavement Incorporating Portland Limestone Cement in Cold Weather. Sustainability 2022, 14, 183. [Google Scholar] [CrossRef]
  12. Pradena, M.; Houben, L. Sustainable Pavements: Influence of the Saw-Cutting Method on the Performance of JPCP. In Proceedings of the 14th International Multidisciplinary Scientific GeoConference SGEM 2014, Albena, Bulgaria, 17–26 June 2014. [Google Scholar]
  13. Kosar, K.; Khazanovich, L.; Salles, L. Evaluation of Early Age Concrete Pavement Strength by Combined Nondestructive Tests. Appl. Sci. 2023, 13, 2240. [Google Scholar] [CrossRef]
  14. Beshr, A.A.A.; Heneash, O.G.; Fawzy, H.E.D.; El-Banna, M.M. Condition assessment of rigid pavement using terrestrial laser scanner observations. Int. J. Pavement Eng. 2022, 23, 4248–4259. [Google Scholar] [CrossRef]
  15. Gkyrtis, K.; Armeni, A.; Plati, C.; Loizos, A. Structural Performance Assessment of Airfield Concrete Pavements Based on Field and Laboratory Data. Infrastructures 2021, 6, 173. [Google Scholar] [CrossRef]
  16. Březina, I.; Grošek, J.; Janků, M. Measurement of Deflections and Determination of Jointed Plain Concrete Pavements Stiffness by Falling Weight Deflectometer. Procedia Eng. 2017, 190, 162–169. [Google Scholar] [CrossRef]
  17. Lee, H.; Koirala, N.; Choi, P.; Seo, H. A Case Study on Distresses of Concrete Pavements Supported on a Retaining Wall. Appl. Sci. 2023, 13, 11226. [Google Scholar] [CrossRef]
  18. Chen, D.H.; Scullion, T.; Nam, B.H. Characterization of structural conditions for pavement rehabilitations. Constr. Build. Mater. 2016, 121, 664–675. [Google Scholar] [CrossRef]
  19. Kuo, C.-M.; Lin, C.-C.; Huang, C.-H.; Lai, Y.-C. Issues in Simulating Falling Weight Deflectometer Test on Concrete Pavements. KSCE J. Civ. Eng. 2016, 20, 702–708. [Google Scholar]
  20. Díaz Flores, R.; Donev, V.; Aminbaghai, M.; Zelaya-Lainez, L.; Blab, R.; Buchta, M.; Eberhardsteiner, L.; Pichler, B.L. Innovative FWD Testing on Concrete Slabs. In International RILEM Conference on Synergising Expertise towards Sustainability and Robustness of Cement-Based Materials and Concrete Structures; Jędrzejewska, A., Kanavaris, F., Azenha, M., Benboudjema, F., Schlicke, D., Eds.; SynerCrete 2023. RILEM Bookseries; Springer: Cham, Switzerland, 2023; Volume 43, pp. 460–472. [Google Scholar] [CrossRef]
  21. Liu, X.; Zhang, X. A new load bearing capacity assessment method of the road pavement based on surface strain and the spectrum of the acceleration. Discov. Appl. Sci. 2023, 5, 169. [Google Scholar] [CrossRef]
  22. Deep, P.; Andersen, M.B.; Thom, N.; Lo Presti, D. Toward the Development of Load Transfer Efficiency Evaluation of Rigid Pavements by a Rolling Wheel Deflectometer. Infrastructures 2020, 5, 7. [Google Scholar] [CrossRef]
  23. Solla, M.; Fernández, N. GPR analysis to detect subsidence: A case study on a loaded reinforced concrete pavement. Int. J. Pavement Eng. 2023, 24, 2027420. [Google Scholar] [CrossRef]
  24. Joshaghani, A.; Shokrabadi, M. Ground penetrating radar (GPR) applications in concrete pavements. Int. J. Pavement Eng. 2022, 23, 4504–4531. [Google Scholar] [CrossRef]
  25. Rasol, M.A.; Pérez-Gracia, V.; Solla, M.; Pais, J.C.; Fernandes, F.M.; Santos, C. An experimental and numerical approach to combine Ground Penetrating Radar and computational modeling for the identification of early cracking in cement concrete pavements. NDT E Int. 2020, 115, 102293. [Google Scholar] [CrossRef]
  26. Izevbekhai, B.I.; Khazanovich, L. Acoustic enhancement of concrete pavement surface through diamond grinding. Int. J. Pavement Eng. 2013, 14, 579–589. [Google Scholar] [CrossRef]
  27. Federal Highway Administration (FHWA). Distress Identification Manual for the Long-Term Pavement Performance Program; Publication No. FHWA-HRT-13-092; U.S. Department of Transportation: Washington, DC, USA, 2014.
  28. Federal Aviation Administration (FAA). Use of Nondestructive Testing in the Evaluation of Airport Pavements; Advisory Circular Νο: 150/5370-11B; U.S. Department of Transportation: Washington, DC, USA, 2011.
  29. Snyder, M.B. Guide to Dowel Load Transfer System for Jointed Concrete Roadway Pavements; Institute for Transportation at Iowa State University; National Concrete Consortium: Ames, IA, USA, 2011. [Google Scholar]
  30. BISAR. Shell Pavement Design Method. In BISAR PC User Manual; Shell International Petroleum Company Limited: London, UK, 1998. [Google Scholar]
Figure 1. Example of slab coding at toll stations (lanes A, B, etc., and slabs 1, 2, etc.).
Applsci 15 05304 g001
Figure 2. Pavement cross-section.
Applsci 15 05304 g002
Figure 3. Examples of distresses at the concrete pavements: (a) map cracking, (b) potholes, (c) interconnected cracks, and (d) faulting at damaged slabs.
Applsci 15 05304 g003
Figure 4. Typical FWD-based deflection basin.
Applsci 15 05304 g004
Figure 5. (a) FWD system, (b) test setup at an edge, (c) test setup at a corner, and (d) test setup at a crack.
Applsci 15 05304 g005
Figure 6. Analysis procedure.
Applsci 15 05304 g006
Figure 7. Evolution of both indicators along the length of a representative area (lane E of toll station No. 1).
Applsci 15 05304 g007
Figure 8. Distribution fitting analysis for the D0 indicator.
Applsci 15 05304 g008
Figure 9. Distribution fitting analysis for the D1800 indicator.
Applsci 15 05304 g009
Figure 10. Durability assessment—boxplots of ISM.
Applsci 15 05304 g010
Figure 11. Load transfer efficiency for joints and cracks.
Applsci 15 05304 g011
Figure 12. Framework for individual slab condition assessment.
Applsci 15 05304 g012
Figure 13. Example of preservation strategies according to individual slab condition ranking.
Applsci 15 05304 g013
Table 1. Descriptive statistics of D0.
Statistics of D0Toll Station 1Toll Station 2Toll Station 3Toll Station 4Toll Station 5
Min (μm)81.749.464.293.974.1
Mean (μm)256.286.4183.8320.4382.7
St. Dev. (μm)141.043.685.7264.9370.6
CV (dimensionless)55%51%47%83%97%
Max (μm)651.5208.8438.71437.81193.5
Table 2. Descriptive statistics of D1800.
Statistics of D1800Toll Station 1Toll Station 2Toll Station 3Toll Station 4Toll Station 5
Min (μm)6.26.70.113.523.0
Mean (μm)20.812.510.936.395.9
St. Dev. (μm)20.23.56.128.7165.9
CV (dimensionless)97%28%56%79%173%
Max (μm)120.023.027.6167.6631.6
Disclaimer/Publisher’s Note: The statements, opinions and data contained in all publications are solely those of the individual author(s) and contributor(s) and not of MDPI and/or the editor(s). MDPI and/or the editor(s) disclaim responsibility for any injury to people or property resulting from any ideas, methods, instructions or products referred to in the content.

