Article

Shear Properties and Failure Mechanism of Matched Discontinuities Between Two Different Rock Types Under Direct Shear

1
Jiangxi Hydraulic Safety Engineering Technology Research Center, Jiangxi Academy of Water Science and Engineering, Nanchang 330029, China
2
School of Infrastructure Engineering, Nanchang University, Nanchang 330031, China
*
Author to whom correspondence should be addressed.
Appl. Sci. 2025, 15(10), 5289; https://doi.org/10.3390/app15105289
Submission received: 28 February 2025 / Revised: 25 April 2025 / Accepted: 25 April 2025 / Published: 9 May 2025

Abstract

:
The shear mechanical properties of rock discontinuities with different joint wall compressive strengths are a practical basis for the stability analysis of layered rock mass. Shear tests on discontinuities possessing different joint wall strengths were carried out. The shear strength and failure characteristics were analyzed, and the influences of discontinuity morphology on its shear properties were investigated. Meanwhile, numerical tests were performed to study the shear mechanical behavior and dilation evolution of discontinuities possessing different joint wall compressive strengths. Results show that the shear process of discontinuities possessing different joint wall strengths can be divided into four stages: meshing and compacting, climbing wear of soft rock and crack formation of hard rock, shear of part of soft rock and crack expansion of hard rock, complete shearing of the rock discontinuity. Shear failure of discontinuities was mainly concentrated on the morphological structure facing the shear direction. The dilatancy evolution process of discontinuities was mainly affected by the roughness and normal stress. The magnitude of dilation, peak shear strength and residual shear strength of discontinuities possessing different joint wall strengths were between the discontinuities possessing identical joint wall strengths composed of soft and hard rock, under the same loading condition.

1. Introduction

Rock joint is a kind of geological discontinuity that widely exists in rock mass. The mechanical properties of rock joints are complex and are affected by many factors such as lithology, surface morphology, compressive strength of joint wall, filling materials and load actions [1,2,3,4,5]. Because the failure of rock masses is commonly manifested as shear slip along rock joints, the overall stability of the rock mass is largely controlled by the mechanical properties, especially the shear resistance behavior of rock joints. Therefore, the shear mechanical characteristics and the failure mechanism of rock joints have always been a research hotspot in the field of rock mechanics [6,7].
Over the years, a lot of researchers have carried out extensive research on the shear mechanism and shear strength of rock joints [2,8,9,10]. Barton and Choubey [11] systematically conducted shear tests on natural rock joints. A joint roughness coefficient (JRC) for estimating the roughness of rock joints was proposed and a JRC-JCS shear strength model of rock joints was developed, which have been of widespread interest for both researchers in laboratories and engineers in the field. Due to the limitation that JRC can only characterize joint roughness in two dimensions, Grasselli and Egger [12] introduced three-dimensional roughness-characterization parameters considering the contact area of rock joints, and developed a shear strength criterion based on three-dimensional roughness. Moradian et al. [13] carried out shear tests on joint specimens of three different materials and monitored the shear process using acoustic emission. The results showed that the peak value of acoustic-emission events appeared after the peak shear stress, which revealed the progressive shear failure of joints. Asadi et al. [14] conducted shear tests of sawtooth-shaped and wave-shaped mortar joints under different normal stresses, and adopted PFC2D to numerically study the mesoscopic shear mechanism of joints. The results showed that with the increase in joint roughness, the failure mode of the asperities changed from sliding friction failure to asperity degradation. Some researchers have conducted laboratory direct shear tests on the factors affecting the shear strength of rock joints. Taking into account the effects of the filling on the shear strength of joints, Oliveira and Indraratna [15] adopted the UDEC code to numerically study the shear behavior of soil infilled rock joints under constant normal stress, and a new shear strength model of soil infilled joints was proposed. In order to investigate the influence of joint materials on the shear strength of joints, Hossaini et al. [16] used plaster and concrete with different Young’s modulus to make artificial joints, and shear test results showed that the deformability of asperity significantly affected the shear mechanical behavior of joints. Atapour and Moosavi [17] prepared flat and rough artificial joints made by gypsum and concrete and conducted direct shear tests at different shear rates. The results showed that the shear strength of flat and rough joints decreased as the shear rate increased. For the purpose of studying the effect of roughness on the apparent cohesion of joints, Rulliere et al. [18] made four types of artificial mortar joints with different roughness and carried out direct shear tests under low normal stress. The results showed that the apparent cohesion was positively correlated with the roughness, and the apparent cohesion was significantly reduced when the specimen was damaged or poorly interlocked. In order to assess the effects of material strength of joints on apparent cohesion, Rulliere et al. [19] carried out shear tests on three types of joints composed of different materials under low normal stress. The results showed that due to the conditions of normal stress, the impacts of material strength and types of joints on shear behavior, shear strength, apparent cohesion and friction angle was limited. The above studies, however, neglected the influence of the effective contact area between the lower and upper joint surfaces during the shearing process on the shear properties of rock joints. Therefore, Tang and Wong [20] considered different contact states of rock joints using different dislocations in the shear direction and proposed an empirical formula for the shear strength of rock joints under different contact states. Based on shear test results, Zhang et al. [21] introduced a two-dimensional roughness parameter considering the shear contact area, and developed an empirical formula for predicting the peak shear strength of rock joints. Ban et al. [22] carried out shear tests of rock joints with different contact area ratios, and deduced an anisotropic parameter AAHD for proposing a new peak shear strength criterion.
The current studies on shear properties of rock discontinuities are mostly aimed at the discontinuities with identical joint wall strength; that is to say, the lithology on both sides of rock discontinuities is the same. However, there are few studies on the shear properties of discontinuities possessing different joint wall strengths. Soft–hard interbedded rock masses composed of different lithologic combinations are pretty common in practical engineering [23]. The discontinuity possessing different joint wall strengths is prone to shear slip failure under load action, which is a critical weak part affecting the strength and overall stability of soft–hard interbedded rock masses. Therefore, it is essential to study the shear mechanical behavior of discontinuities possessing different joint wall strengths. For this reason, Lin et al. [24] produced joints with different strengths by pouring mortar with different sand–cement ratios at the top of rock-like mortar materials to form binary medium structural planes. Direct shear tests revealed that the peak and residual shear strength of the binary structural plane were much lower than those of the unitary structural plane. The difference of cohesion between the unitary and binary structural planes decreased with the increase in the sand–cement ratio, while the friction angle φ increased first and then decreased with the increase in the sand–cement ratio. Jiang et al. [25] carried out shear tests of discontinuities possessing different joint wall strengths with different JRC, and stated that the peak shear strength of discontinuities possessing different joint wall compressive strengths increased exponentially with the increase in JRC. Lin et al. [26] employed thePFC2D code to establish a binary medium shear model including flat joints. Numerical shear tests under different constant normal loads were carried out on models with different parallel bond modulus ratios. Based on the simulation results, an empirical formula of shear strength considering modulus difference of discontinuities possessing different joint wall strengths was proposed. Wu et al. [27] conducted direct shear tests and numerical simulations on 14 pairs of natural discontinuities possessing different joint wall strengths to evaluate surface damage through damage zone distribution and variations in JRC. The results showed that when the JRC of the upper and lower sides of the discontinuity were similar, the shear damage difference between the upper and lower blocks of the specimen was closely related to the strength difference.
The aforementioned studies mainly focused on laboratory tests and numerical simulations, but neglected theoretical studies for shear strength of discontinuities possessing different joint wall strengths. To address this issue, Ghazvinian et al. [28] used three types of plaster mortars to make saw-toothed discontinuities possessing different joint wall strengths. Based on shear test results on these joints, a peak shear strength criterion of discontinuities possessing different joint wall strengths was derived. Wu et al. [29] conducted shear tests of serrated discontinuities possessing different joint wall strengths and developed a prediction model of shear strength of discontinuities possessing different joint wall strengths through a neural network approach. Tang et al. [30] fabricated three types of rock-like discontinuities with different joint wall strengths and different roughnesses. On the basis of shear test results, a shear strength model considering three-dimensional morphology of rock joints was proposed.
Generally, shear tests of rock joints need a certain amount of specimens with different surface morphologies. The traditional method of preparing rock joint specimens is often time-consuming and laborious when accurately fabricating rough rock joints in batches. Because of the fabrication errors, there might be a certain deviation between the test results and the shear properties of natural rock joints. Fortunately, the three-dimensional engraving technology developed in recent years can effectively solve this problem [31]. Using this technique, rock joints with complex surface morphology can be directly carved on natural rock with high precision; thereby, a mass of duplicable tests can be carried out to explore the influence of various factors on the shear properties of rock joints [32,33]. This study adopted the Barton standard rock joint profiles as prototypes; discontinuities possessing different joint wall strengths and with different surface morphologies were fabricated with three-dimensional (3D) engraving technology. The shear mechanical properties and shear failure characteristics were experimentally investigated. Simultaneously, numerical simulations were performed to reveal the influence mechanism of the joint wall strength difference and joint morphology on the shear behavior.

2. Specimen Preparation

2.1. Preparation of Rock and Rock-like Materials

Sandstone and granite blocks were collected from Jinjiang of Fujian Province, southeast China. These rock blocks were taken to the laboratory and processed into test specimens with a size of 100 mm × 100 mm × 50 mm (length × width × height). A total of 20 complete sandstone specimens and 20 complete granite specimens for subsequent 3D carving of rough joints were prepared. In order to obtain two kinds of different discontinuities possessing different joint wall strengths with the above sandstone and granite specimens, 40 cement mortar specimens of the same size were fabricated. The mortar specimens were made of quartz sand, 32.5# Portland cement and water with a weight ratio of 4:2:1.2. The specific manufacturing process is introduced as follows.
(1)
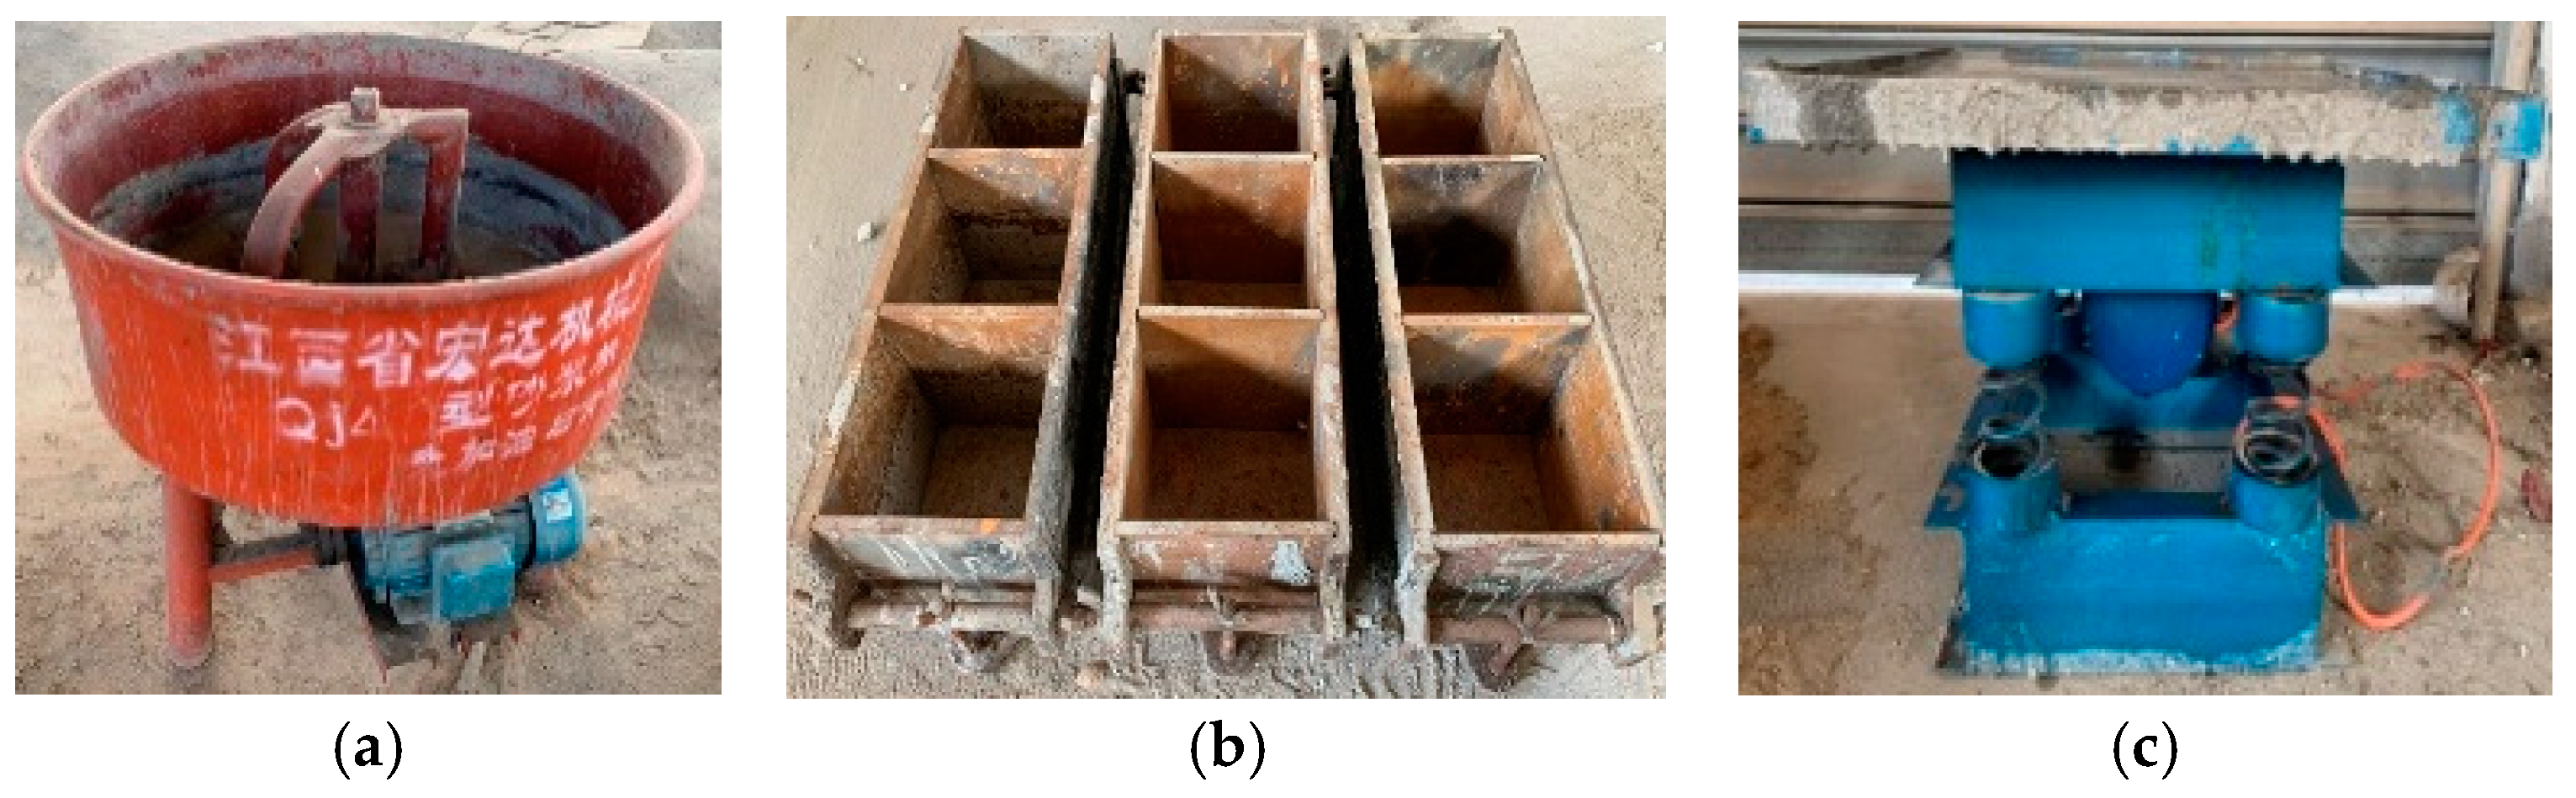
Quartz sand and cement were mixed in an electric mixer according to the designed weight ratio (as shown in Figure 1a). To ensure the initial strength and fluidity of the model material, early water reducing agent with 0.5% cement mass was added, and the mixture was fully stirred for 2 min.
(2)
Water was poured into the mixer and fully stirred with the dry material for 2 min to obtain the mortar material.
(3)
Mortar specimens were prepared using a triple cast iron mold with dimensions of 300 mm × 100 mm × 100 mm (length × width × height) (see Figure 1b). In order to facilitate the demolding of the sample after curing, a layer of demolding agent was sprayed on the inner surface of the mold. The mold filled with mortar was placed on the low-frequency electric vibration table (see Figure 1c).
(4)
In order to obtain the basic physical and mechanical properties of the mortar material, cylindrical specimens with size of ϕ 50 mm × 100 mm (diameter × height) and size of ϕ 50 mm × 30 mm (diameter × height) were prepared. The mortar was slowly poured into the mold, and then the mold was vibrated on the vibration table for 3 min.
(5)
After all mortar specimens were cured for 24 h, the specimens were extracted from the mold and placed at indoor temperature of about 25 °C for 4 weeks.

2.2. Three-Dimensional Carving of Rough Joints

A total of 12 sandstone specimens, 12 granite specimens and 24 mortar specimens were carved to form 12 pairs of sandstone–mortar rough discontinuities and 12 pairs of granite–mortar rough discontinuities. An HY-6060 stone mold engraving machine made by Jinan Heyi Machinery Equipment Company, Jinan, China, as shown in Figure 2, was adopted to carve the surface morphology of joint specimens. The joint morphology carving process is presented as follows.
(1)
Generation of JRC profiles. Three curves with JRC of 2.8, 10.8 and 18.7 from the Barton joint profiles were taken as the prototype. The coordinate points of the selected joint profiles given by Li and Zhang [34] were employed and were imported into AutoCAD 2016 software such that three JRC curves with length of 100 mm were plotted with the spline curve command and saved in R50 format.
(2)
Three-dimensional stretching of Barton joint profiles. By employing JD Paint software, the three two-dimensional (2D) JRC curves obtained by step (1) were stretched 100 mm along the direction perpendicular to the extension direction. By doing that, three 3D surfaces with dimensions 100 mm × 100 mm were obtained.
(3)
Curving parameter setting of the engraving machine. The vertex of the lower left corner of each 3D stretching surface generated by step (2) was selected as the coordinate origin. The path spacing of the carving tool was set to 0.06 mm and a taper ball-end cutter with a diameter of 0.6 mm was installed as the carving tool. The tool path obtained by JD Paint software was transformed into a format that can be recognized by the engraving machine.
(4)
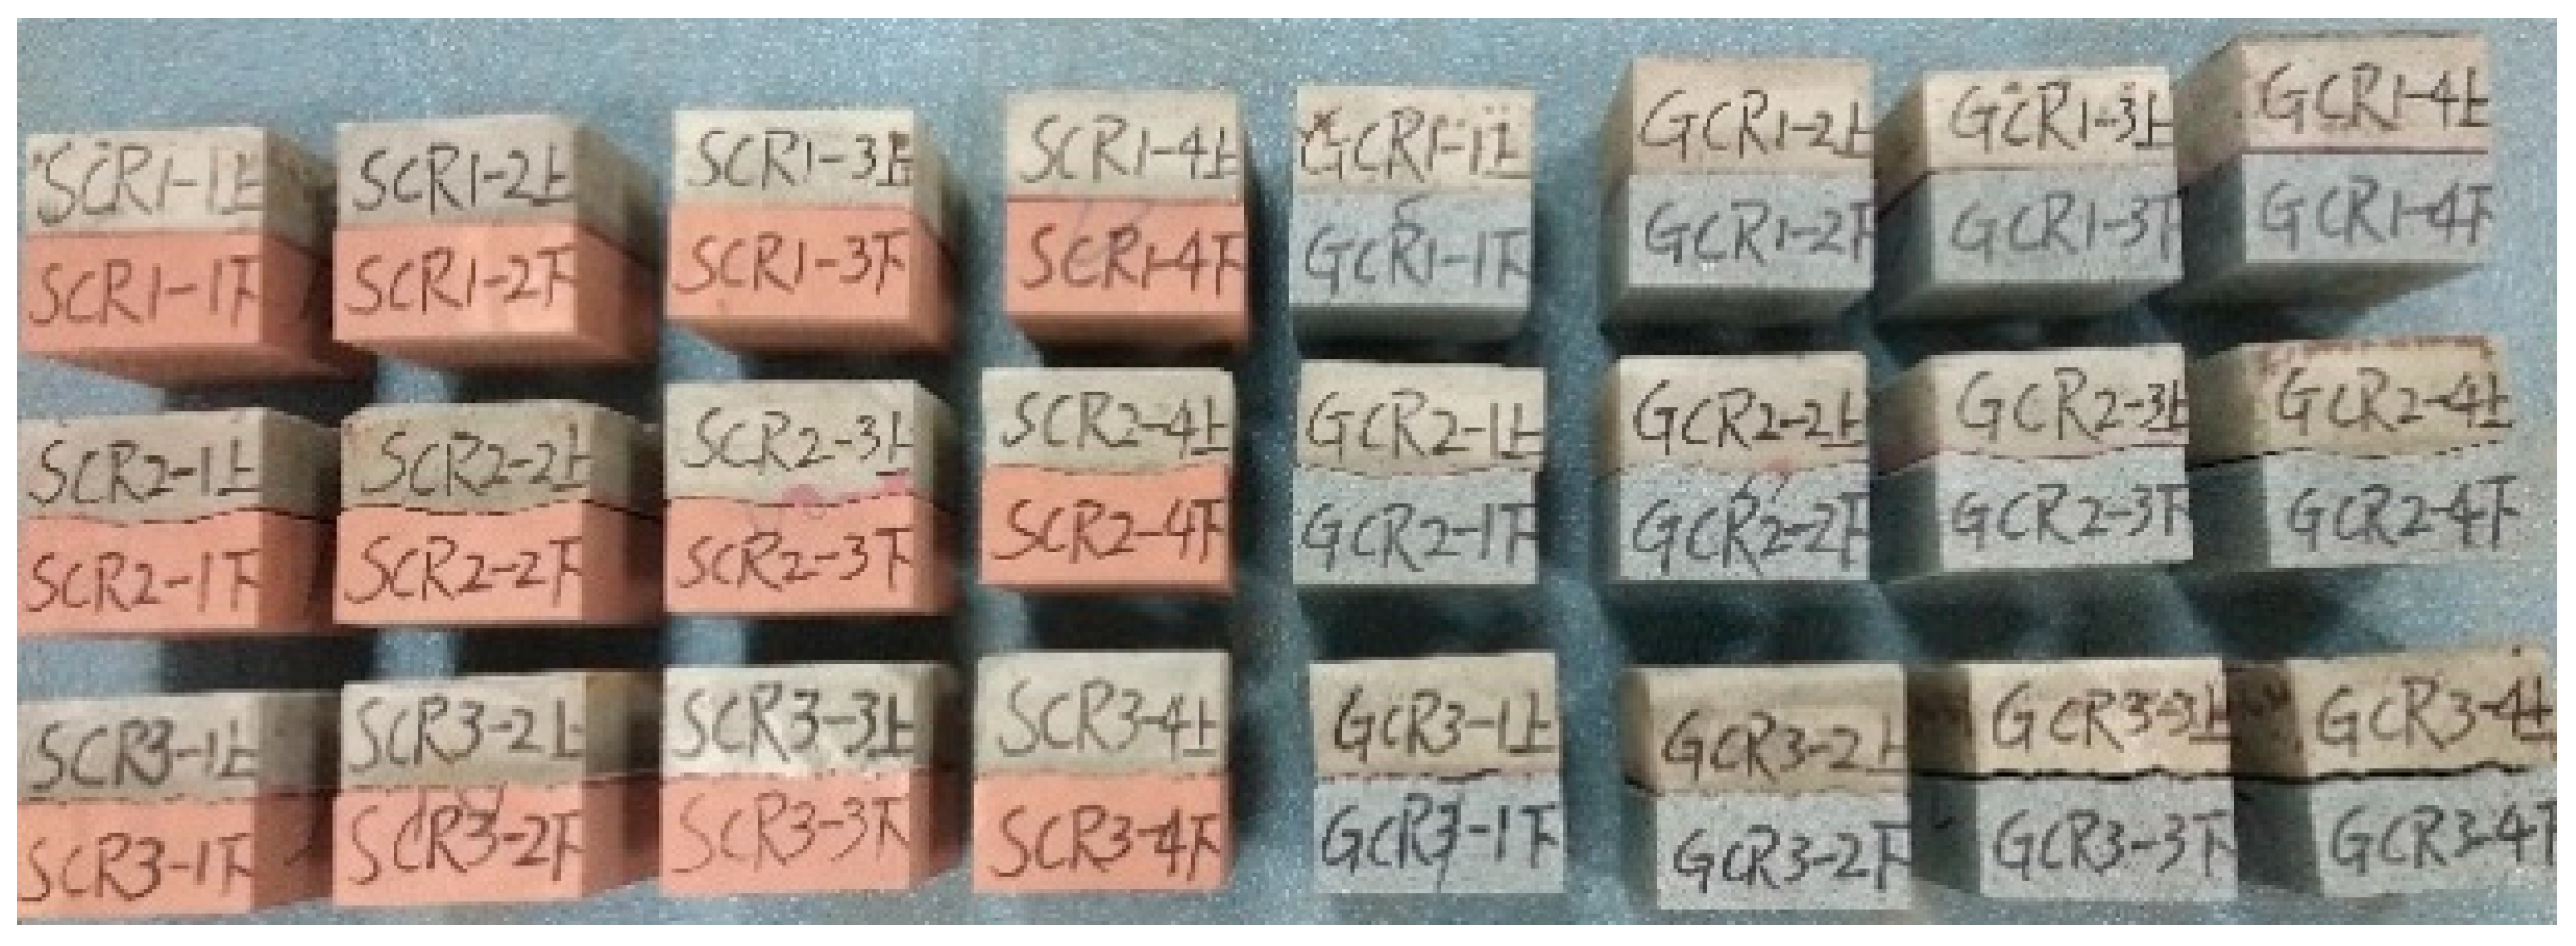
Surface morphology carving of joints. The prepared rock and mortar specimens with size 100 mm × 100 mm × 50 mm (length × width × height) were firmly fixed on the bench clamp of the engraving machine. The origin of the carving path and the carving origin were calibrated. Subsequently, the engraving machine was operated to automatically engrave the surface morphology of joints according to the carving path assigned by step (3). Once the carving for one specimen was completed, the cutting tool path was rotated 180° and the matching specimen was carved by repeating the above process to gain a pair of joint blocks with identical morphology. Finally, a pair of fully mated rough joint specimens was obtained.
(5)
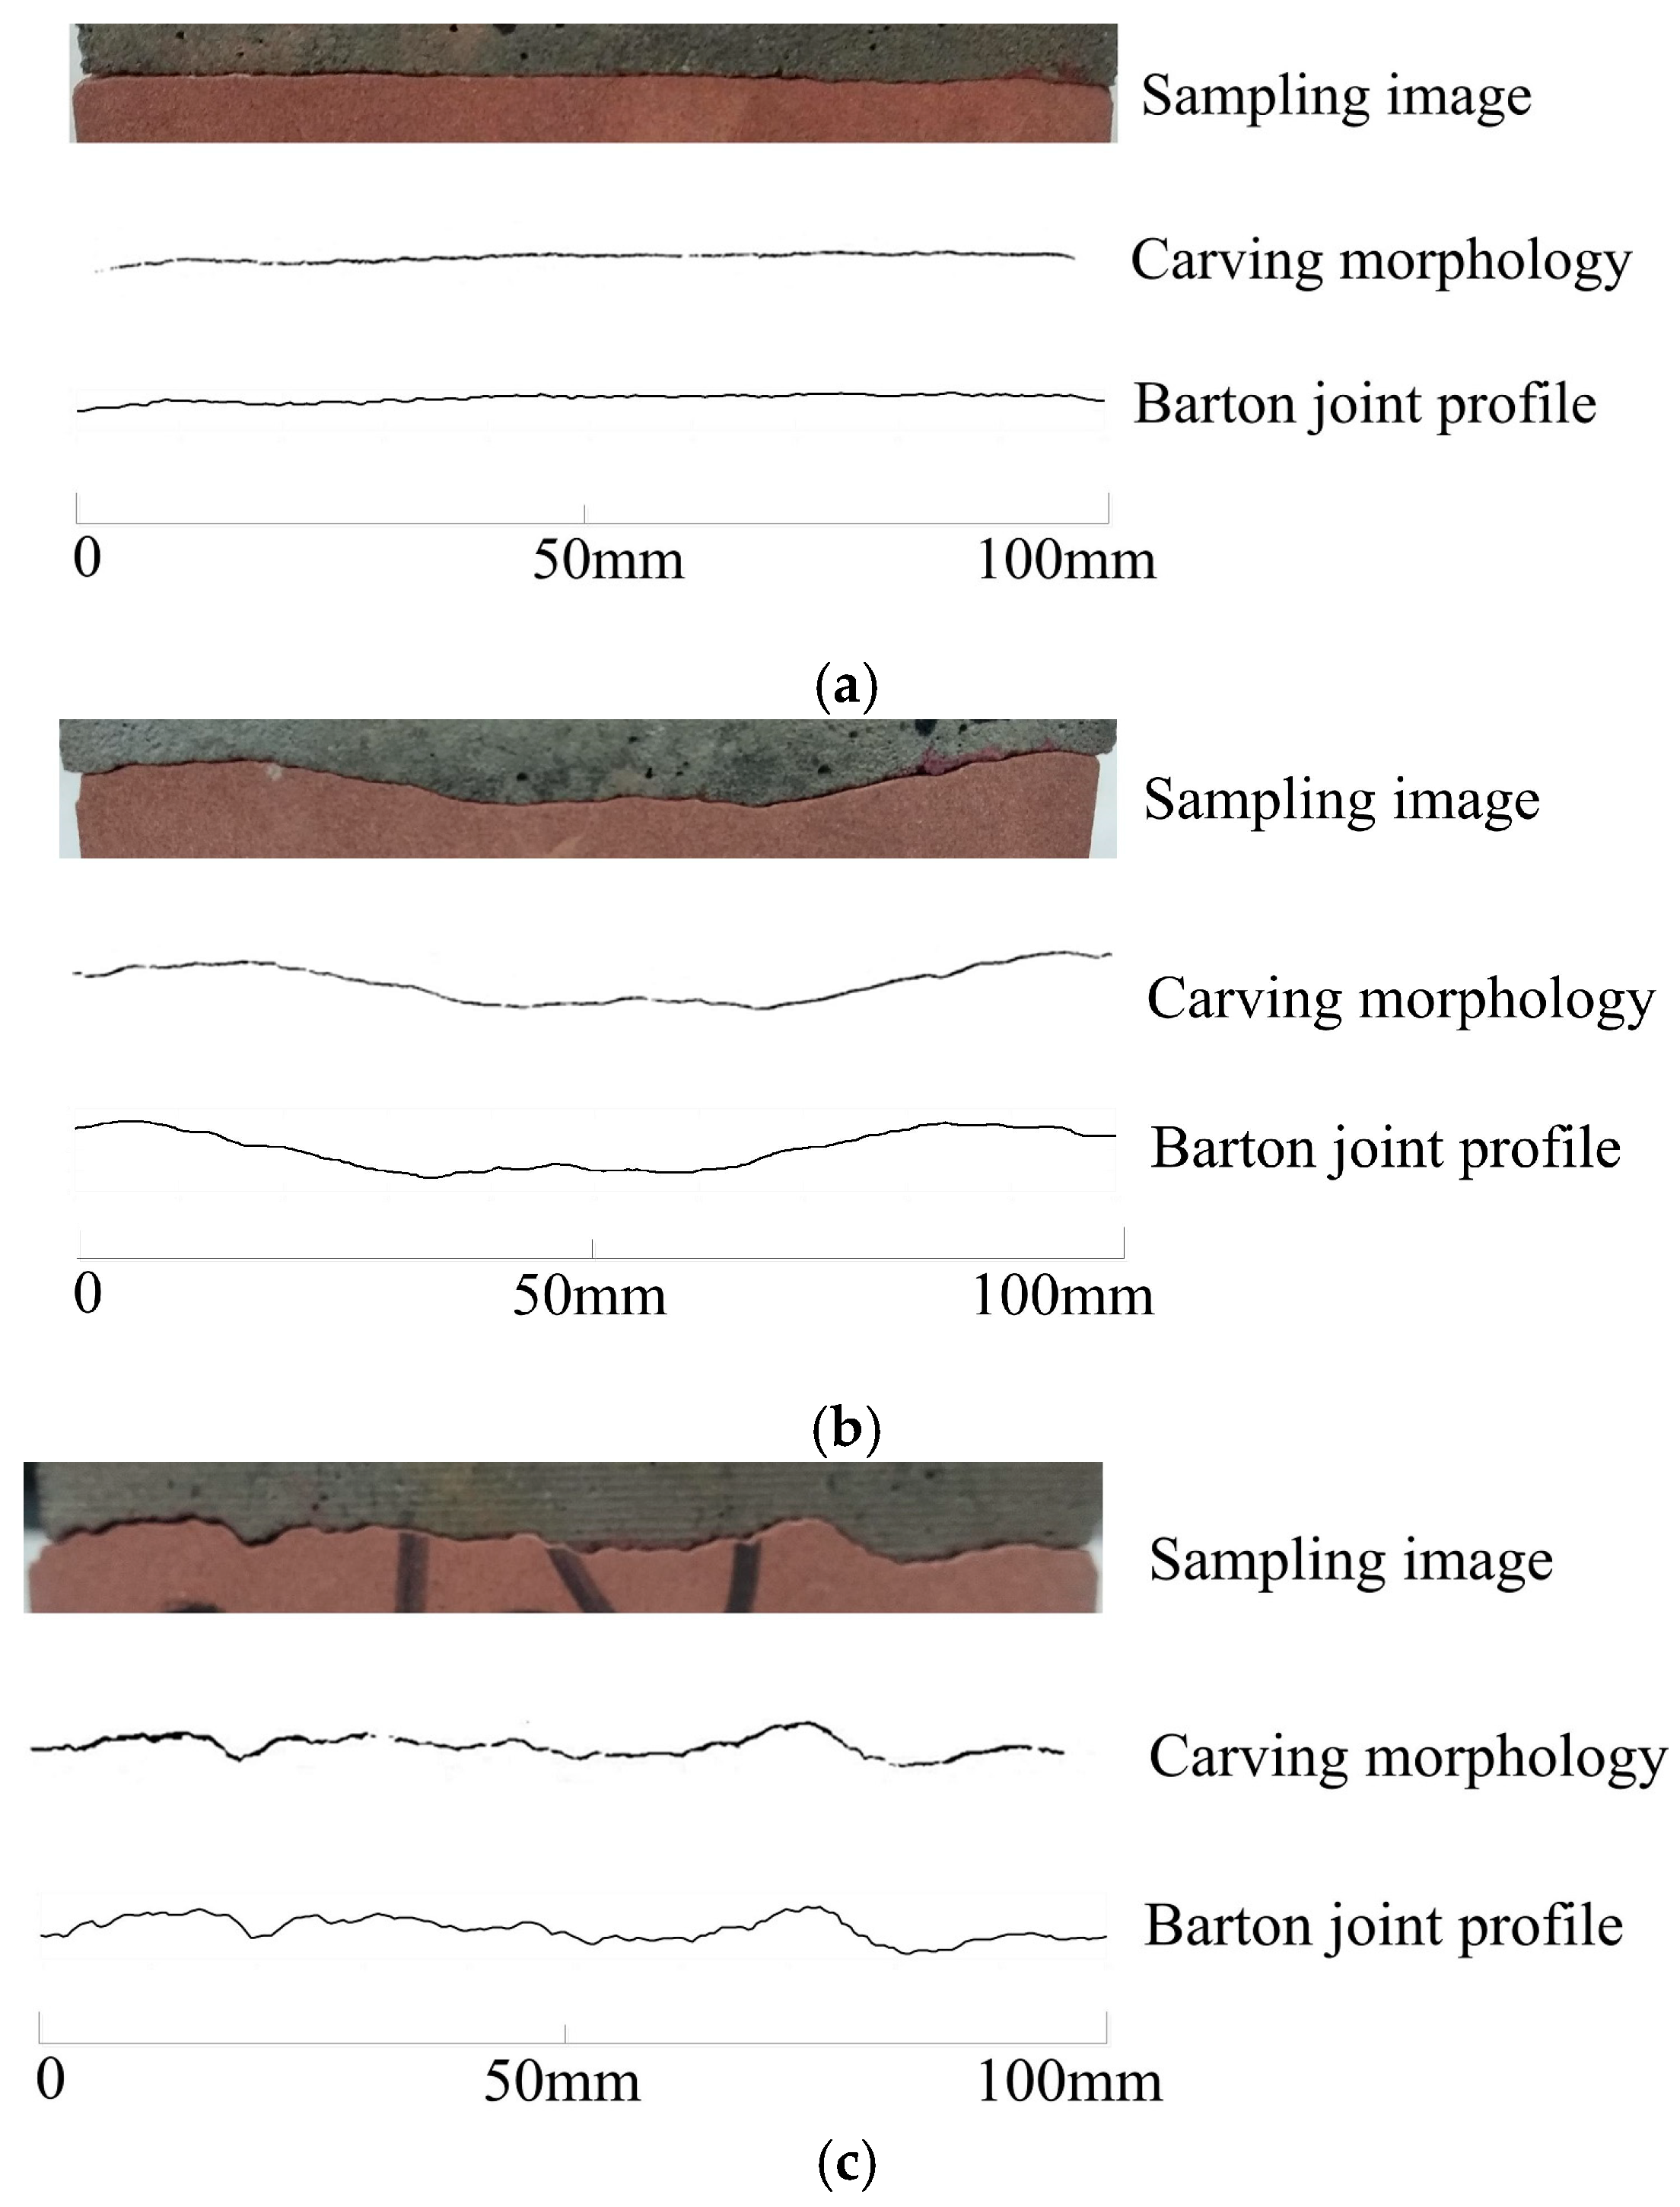
Evaluation of the joint-engraving precision. After completing the engraving work of all rough joint specimens, the morphological information of the rough joint was extracted to estimate the carving precision. The image of joints with different joint wall materials was binarized by the image-editing software ImageJ v1.8.0 to obtain the gray image of the carving acquisition line of joint. The joint image and the carving morphology of the joint were compared with the Barton joint profile, as shown in Figure 3. It can be realized from Figure 3 that the carving morphologies of the joint are in good agreement with the Barton joint profiles, indicating that the 3D carving method is applicable to carve the rock and rock-like materials to obtain rock joint specimens with specific morphology in batches.

3. Experiment Scheme

3.1. Physical and Mechanical Properties of Materials

In order to obtain the basic physical and mechanical properties of rock and cement mortar specimens, uniaxial compression tests, triaxial compression tests and Brazilian splitting tests were carried out using a temperature–stress–seepage coupling test system of rocks. Meanwhile, tilt tests were conducted on flat joint specimens by the three materials. The basic physical and mechanical properties obtained from tests are listed in Table 1. It can be seen from Table 1 that the three types of material used for matching joint specimens have different strength. Therefore, either the sandstone–mortar joint or the granite–mortar joint studied herein had different joint wall strengths.

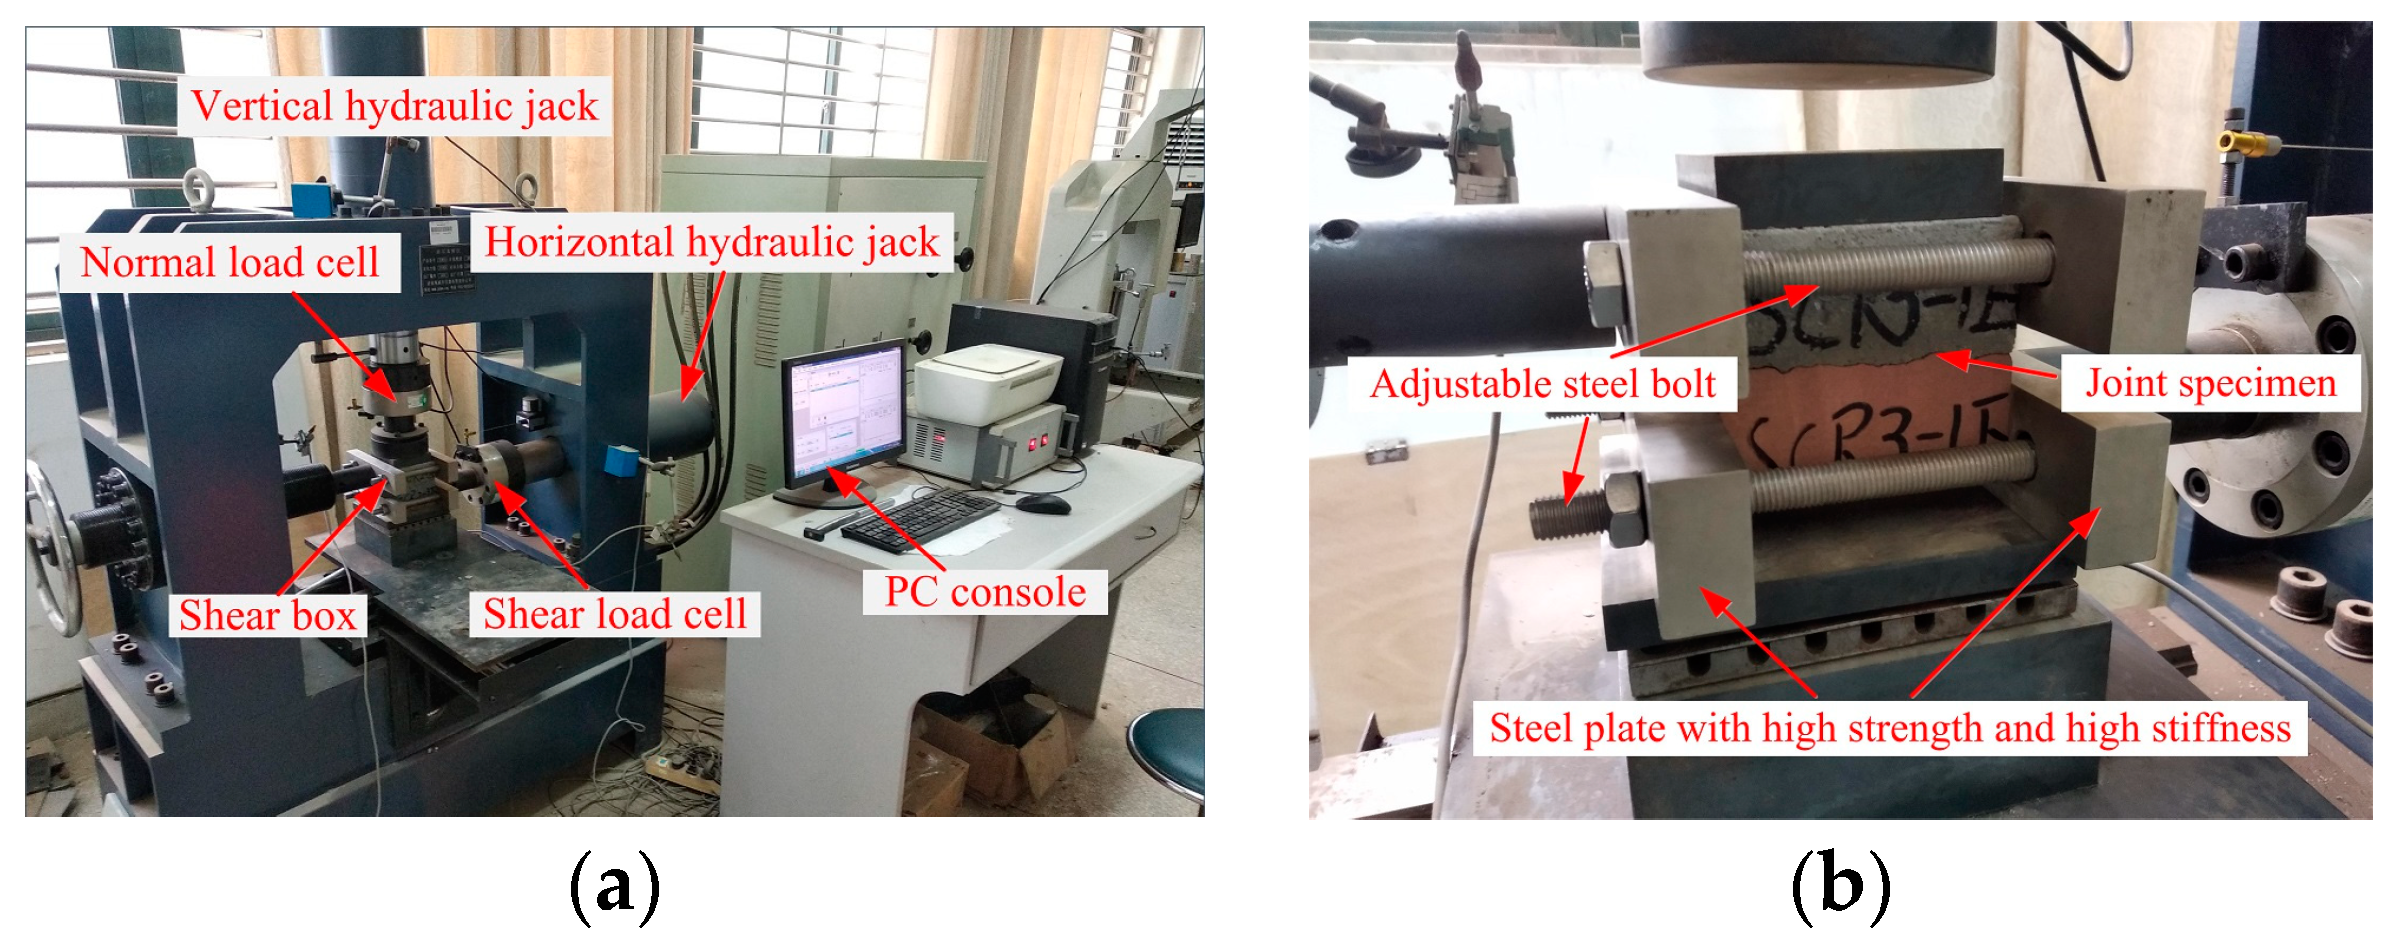
3.2. Shear Test Method

After the joint specimen was installed in the shear box, the normal load was applied at a rate of 0.5 kN/s until it reached the specific normal stress level, which then remained constant. Subsequently, the shear load was applied at a rate of 0.5 mm/min. Each test was terminated when the shear displacement reached 10 mm. Figure 4 shows the joint specimens used in the test.
All shear tests were performed on a YZW50 electro-hydraulic servo shear test system, as shown in Figure 5a. The shear apparatus has a servo control function, which can apply a normal load and a tangential load simultaneously. The maximum normal load and the maximum tangential load are 500 kN and 300 kN, respectively. The sensors equipped on the hydraulic cylinder can monitor the normal and tangential loads as well as displacements in real time. The shear box used in the test has semi-open structure, which is composed of four refined steel plates and four sets of high-strength bolts, as presented in Figure 5b.
The shear tests were conducted under normal stresses of 0.5, 1.0, 2.0 and 3.0 MPa. According to the type of joint materials, the sandstone–mortar joint and granite–mortar joint were named SC and GC, respectively. The specimens with JRC of 2.8, 10.8 and 18.7 were numbered R1, R2 and R3, respectively. For the sake of observing the failure characteristics of joint surfaces after test, the joint surface of all mortar blocks was coated with a layer of red ink and dried naturally for three days before shear test.

4. Experiment Results and Analyses

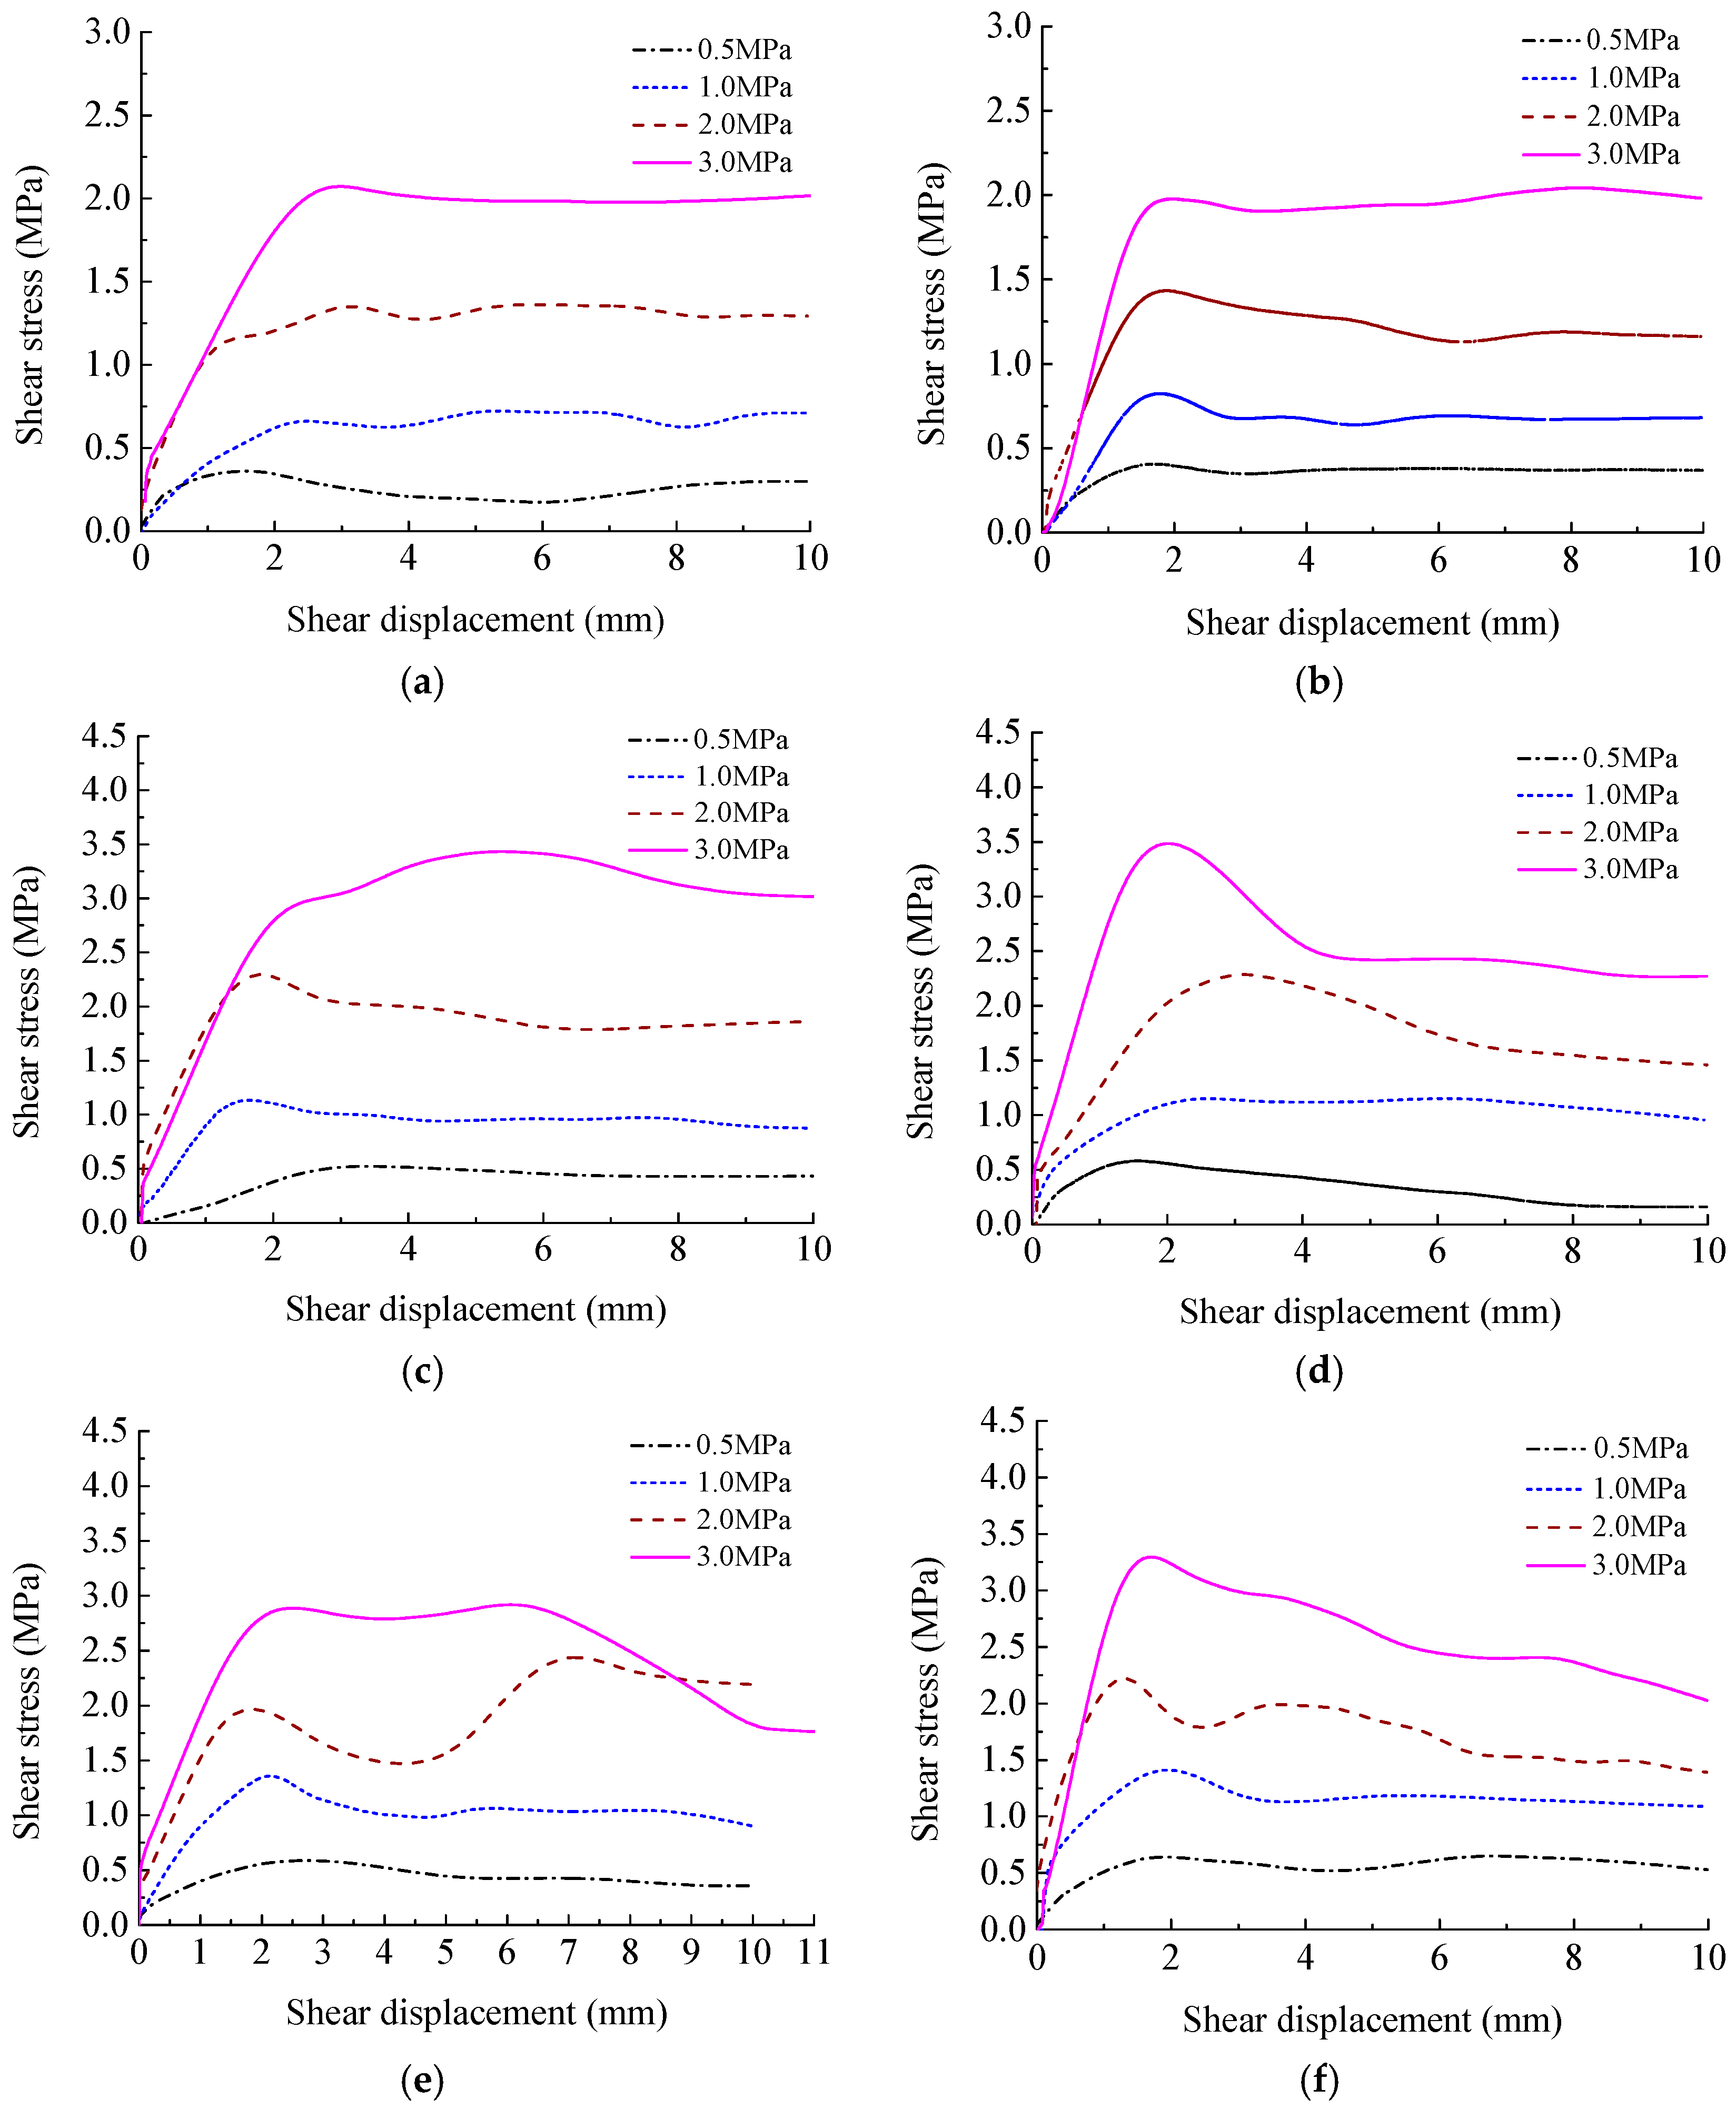
4.1. Shear Properties of Rough Discontinuities Possessing Different Joint Wall Strengths

Figure 6 presents the curves of shear stress vs. shear displacement of sandstone–mortar joints and granite–mortar joints with JRC of 2.8, 10.8 and 18.7. It can be found that with the increase in shear displacement, the shear stress increased approximately linearly until it reached the peak value. After the peak shear stress, with the continuous increase in shear displacement, the shear stress of joints with JRC of 2.8 remained almost stable, while the shear stress of joints with JRC of 10.8 and 18.7 appeared to show stress drop but eventually approached a stable value, namely the residual shear strength. In general, the shear stiffness and peak shear strength of the two types of rough discontinuities possessing different joint wall strengths increased significantly with the increase in normal stress.

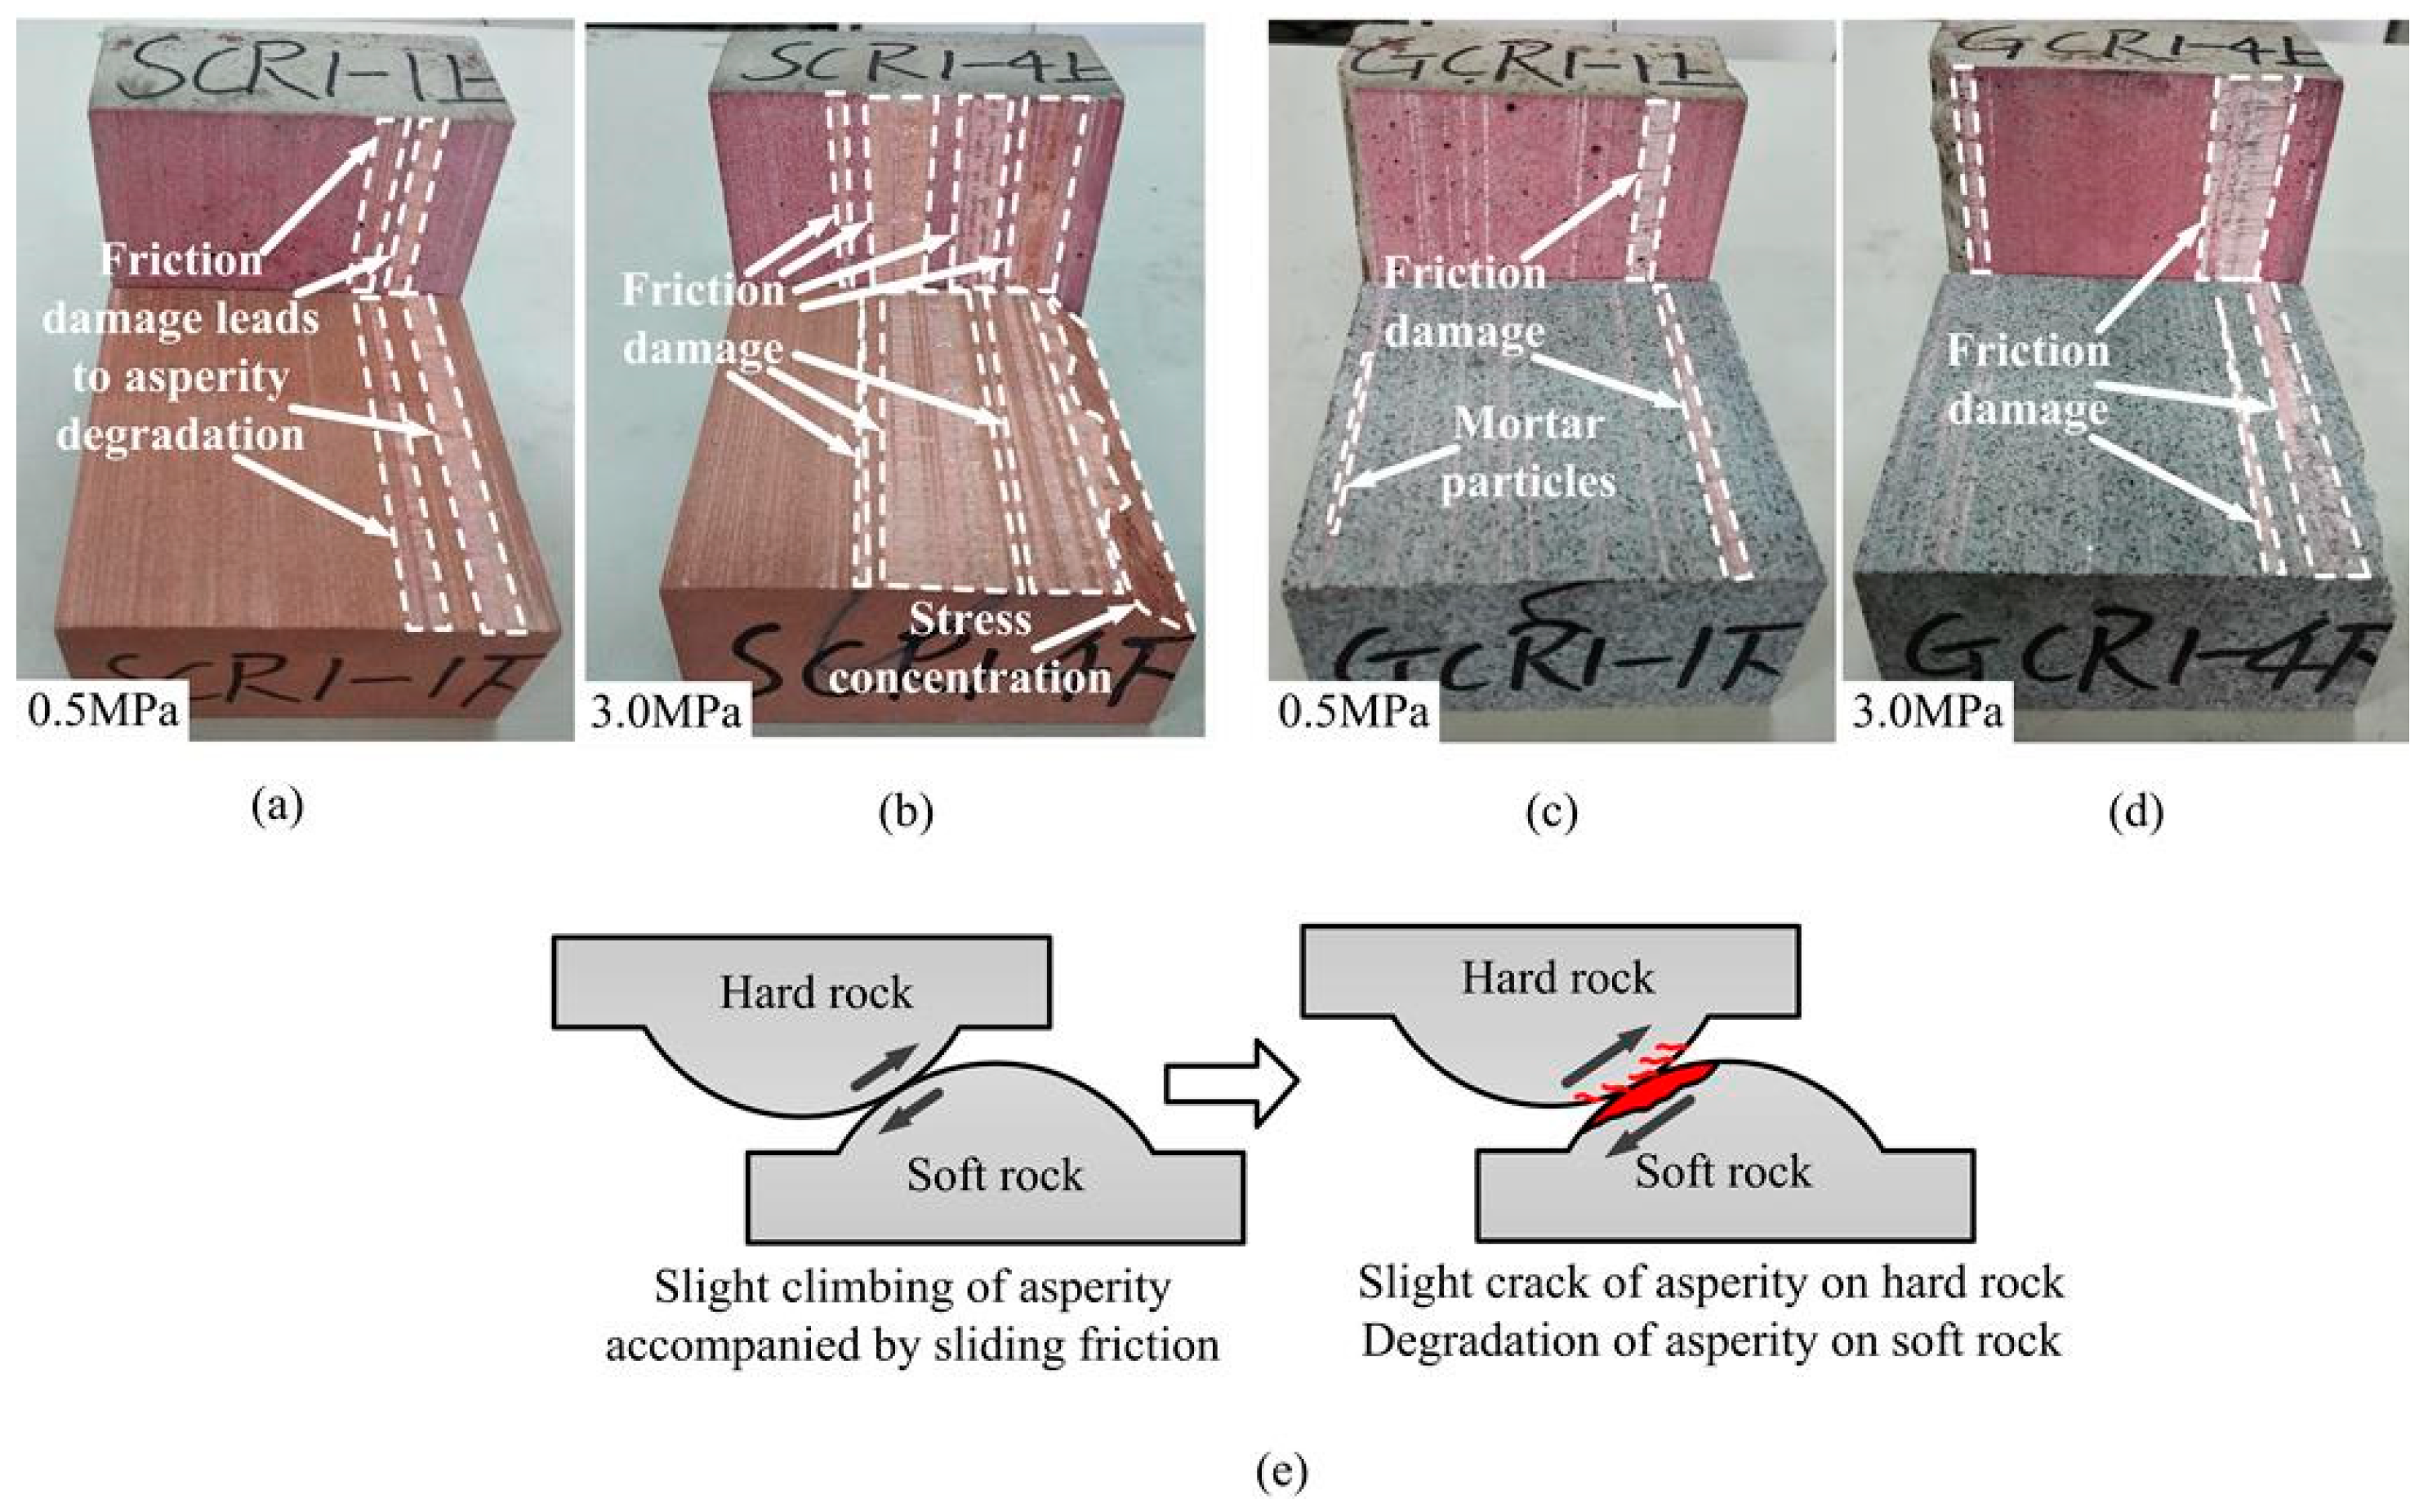
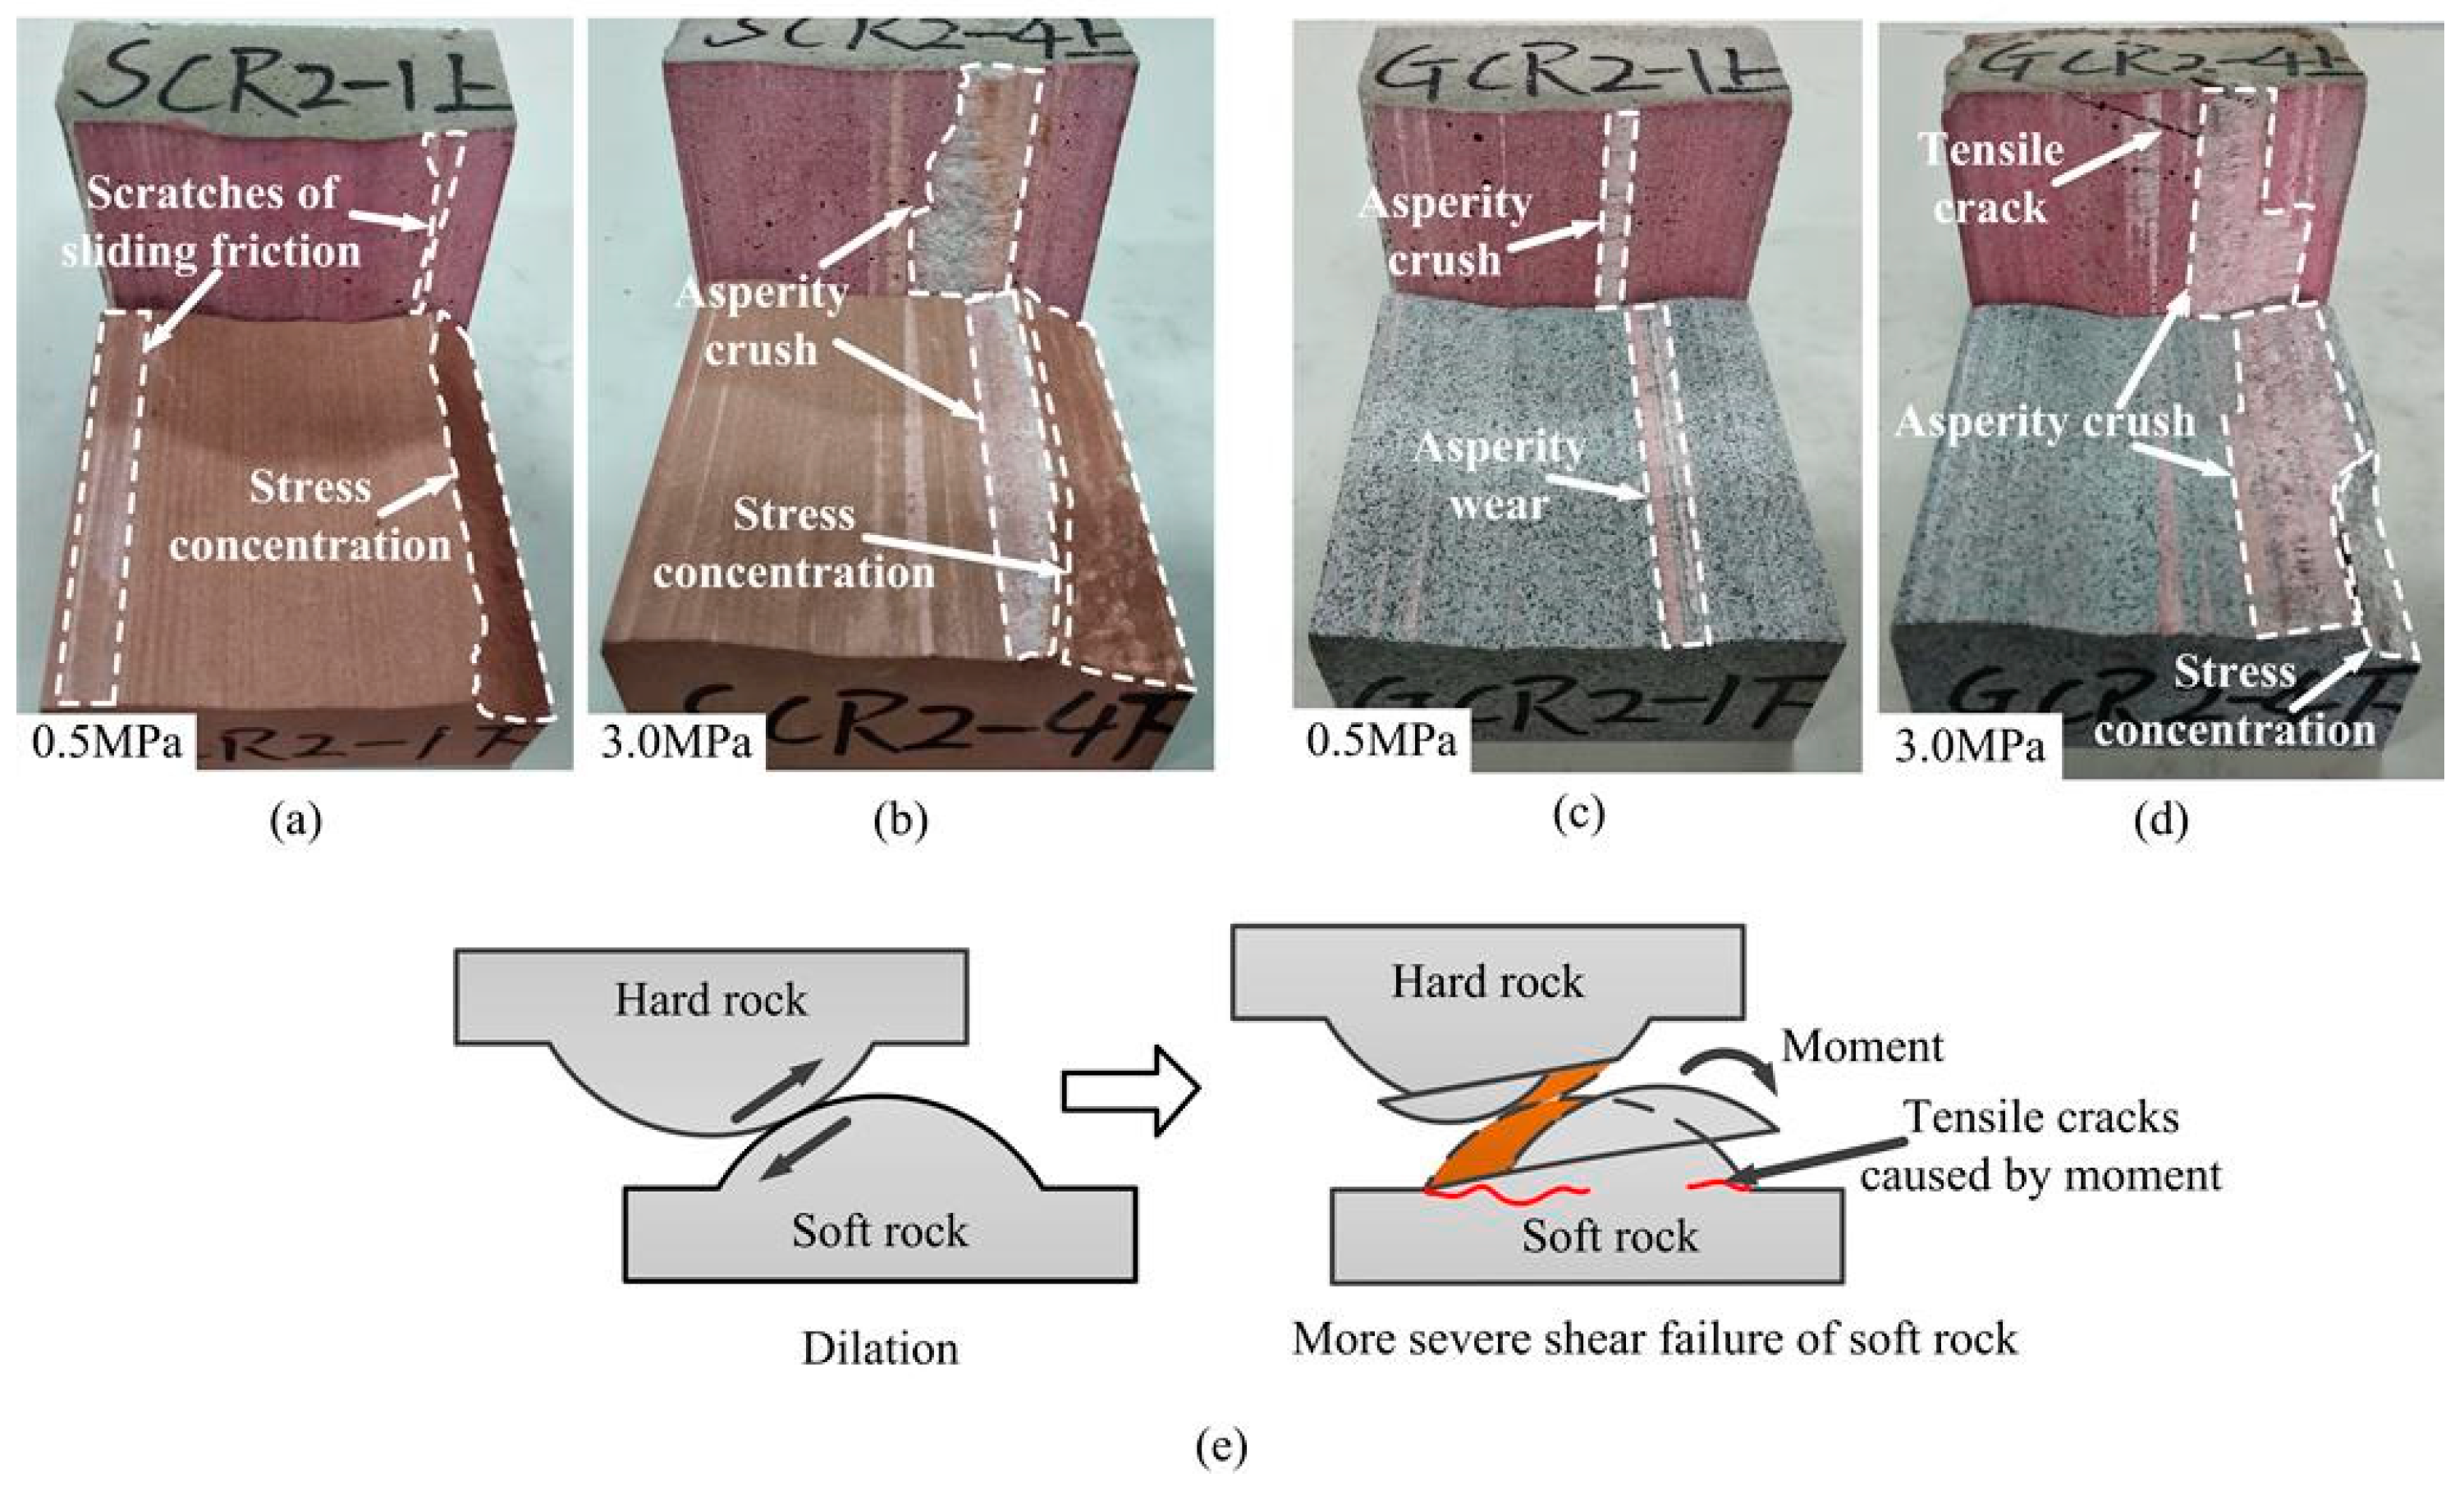
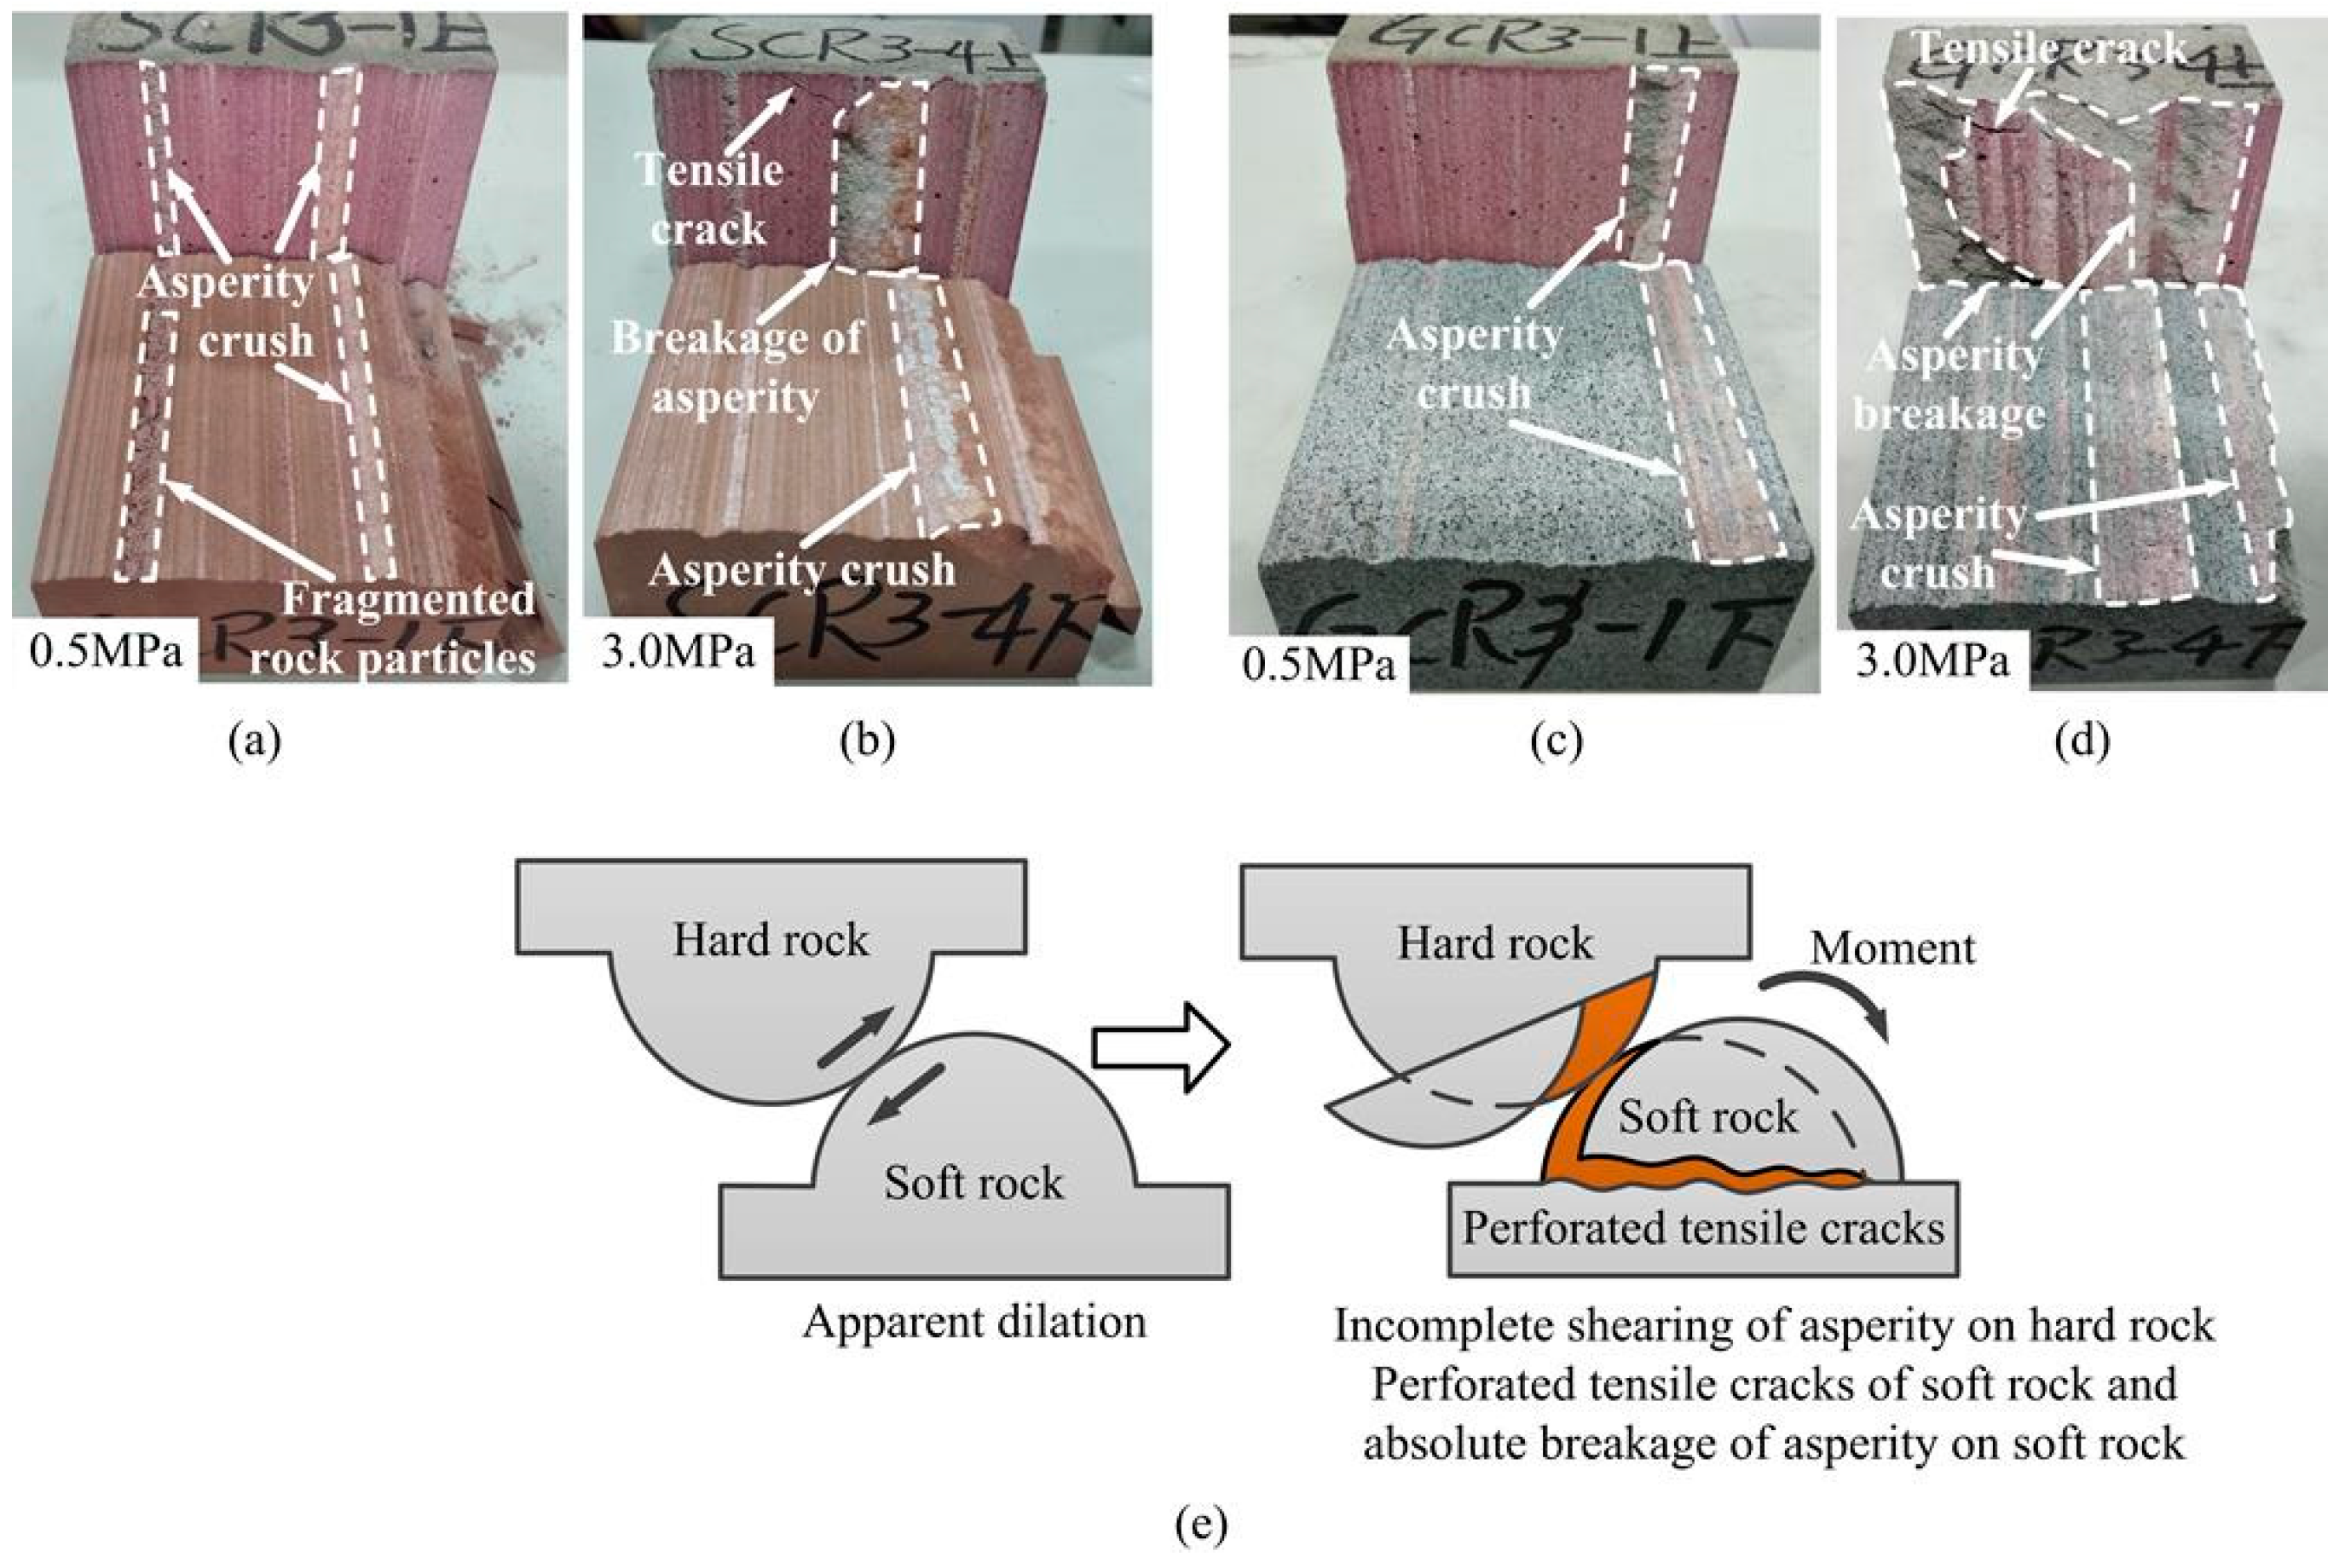
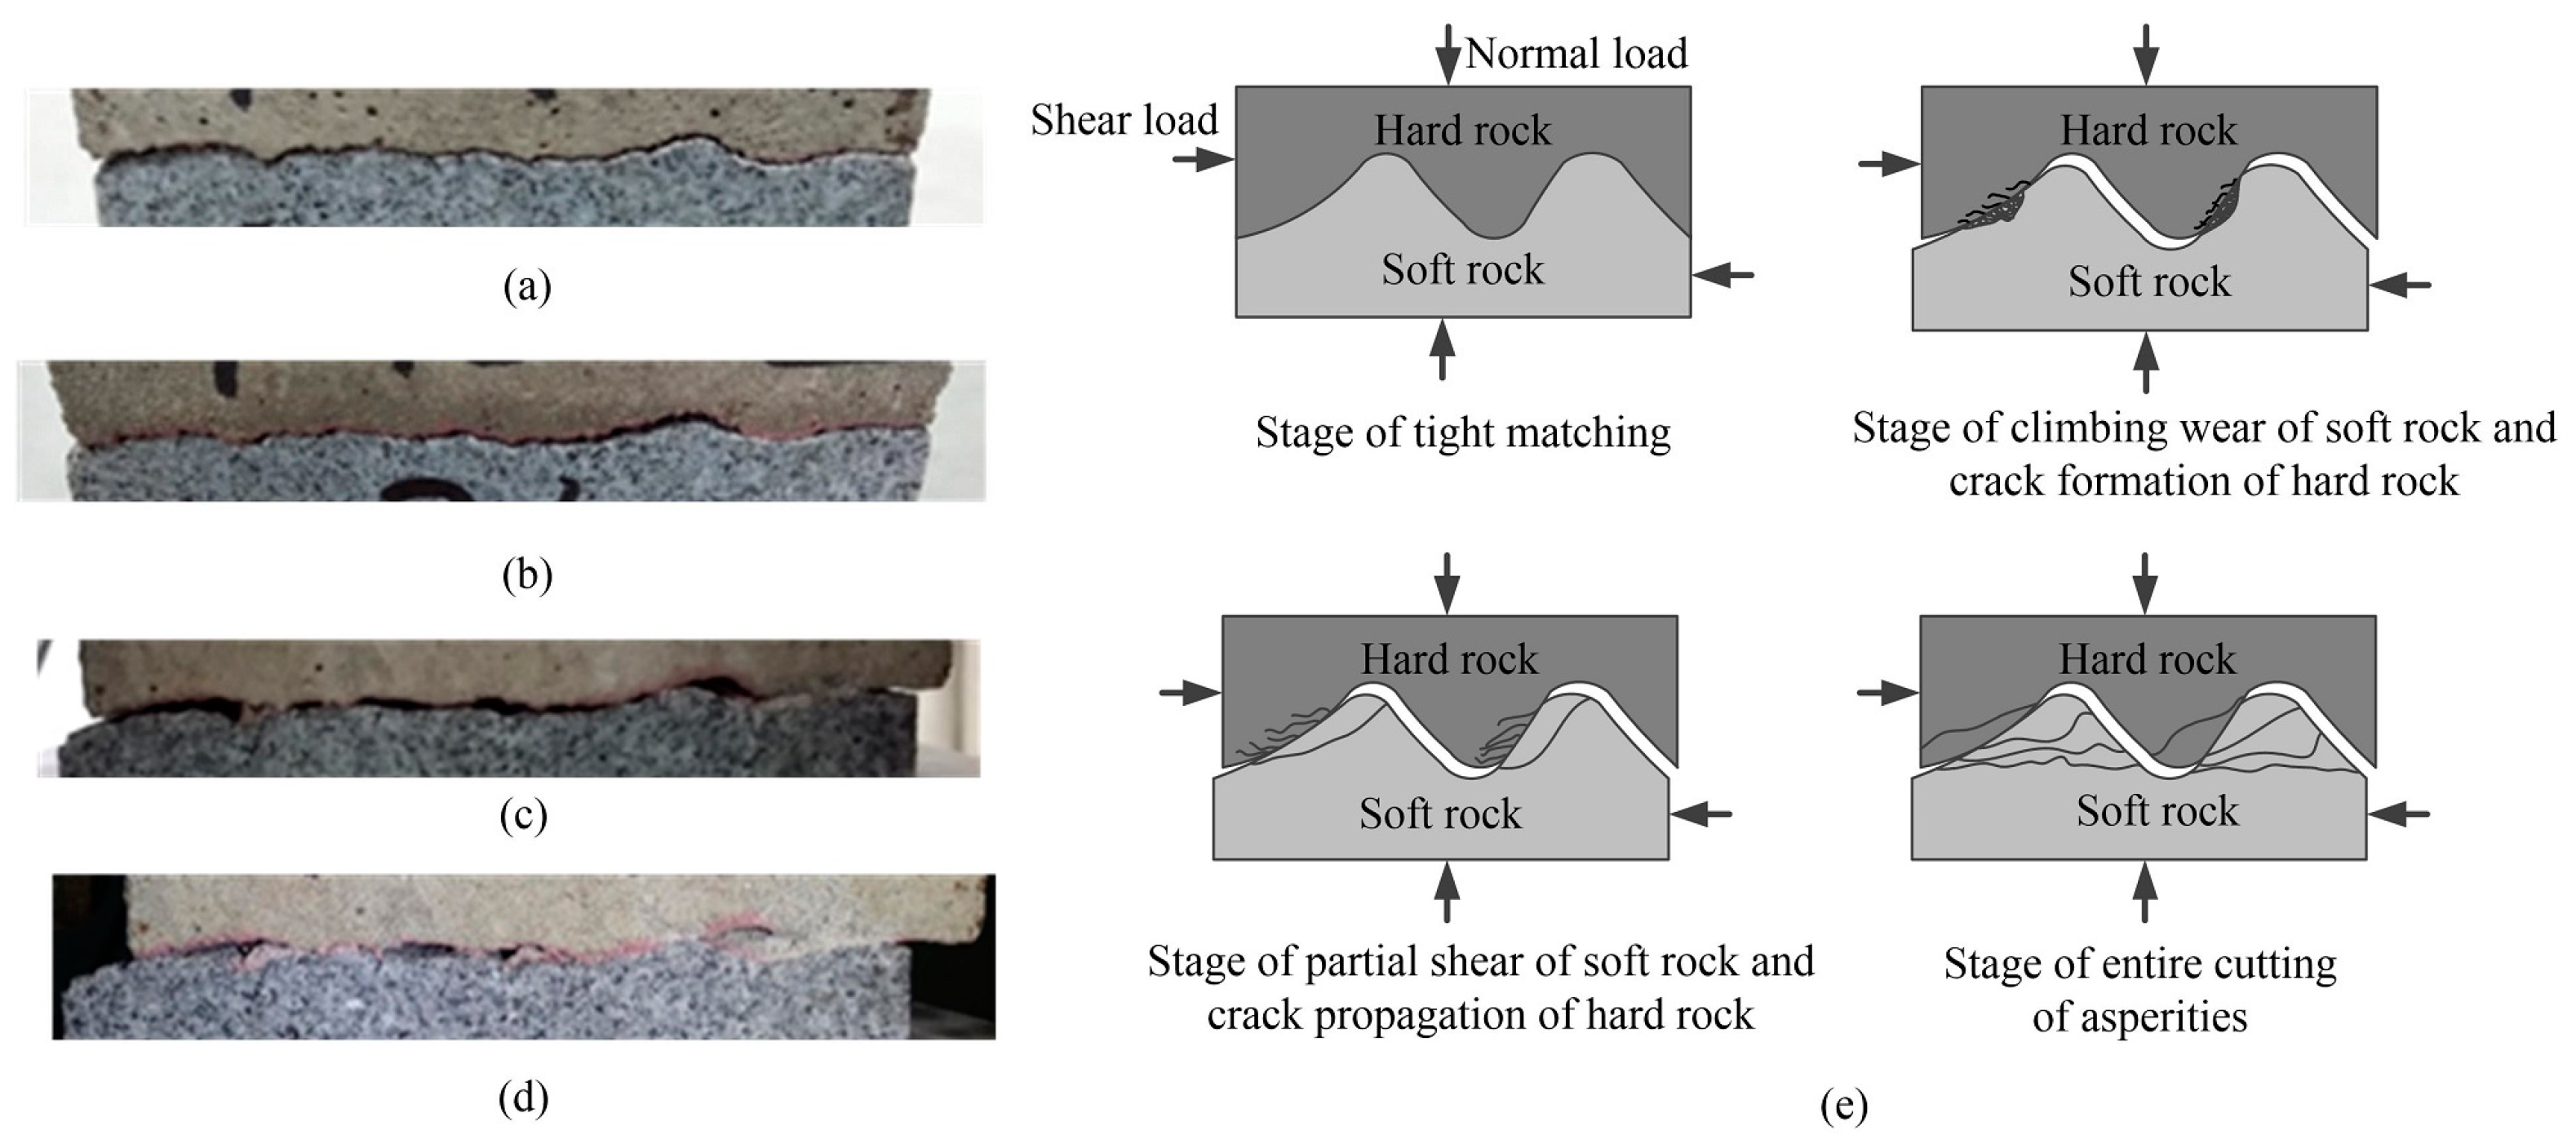
4.2. Failure Mechanism of Rough Discontinuities Possessing Different Joint Wall Strengths

Figure 7 presents the failure characteristics of discontinuities possessing different joint wall strengths with JRC of 2.8. It can be seen from Figure 7 that the failure of joint specimens with JRC of 2.8 mainly showed up as friction failure. For sandstone–mortar discontinuities, there were different degrees of wear on the surface of both sandstone and cement mortar, and the damage of cement mortar was more obvious. The damage area and damage depth of the joint surface increased with the increase in normal stress. For granite–mortar discontinuities, the damage was mainly concentrated on the side of the cement mortar. The asperity slightly climbed during the shear process. Due to the slip friction between the upper and lower joint blocks, the asperity on the surface of the mortar was ground and microcracks appeared on the asperity of granite. With the migration of ground mortar particles, the mortar particles were crushed and bonded on the surface of the granite. With the increase in normal stress, the degree of friction damage on the surface of mortar was strengthened and the number of ground mortar particles increased. Figure 7e presents the microscopic failure mechanism of the joint specimen with JRC of 2.8. Based on the strength of rock and mortar, granite and sandstone are named as hard rock, while mortar is named as soft rock. Slight dilation accompanied with the sliding friction between asperities appeared in the joint during the shearing process. Due to the strength difference of hard rock and soft rock, the asperity of soft rock was ground and the asperity of hard rock produced microcracks.
Figure 8 shows the failure characteristics of joints with JRC of 10.8. Both types of discontinuities possessing different joint wall strengths exhibited shear failure after dilation. For sandstone–mortar discontinuities, sandstone and mortar only exhibited relative friction and wear between asperities after dilation under low normal stress, and slight scratches appeared on the surface of sandstone and mortar. Meanwhile, the edge of the sandstone surface was fractured due to stress concentration. With the increase in normal stress, the size of the damaged area increased gradually. Under high normal stress, both the asperities of sandstone and mortar exhibited climbing shear failure, and stress concentration occurred at the edge of mortar. For granite–mortar discontinuities, some asperities on the mortar surface were crushed and cut off under low normal stress, and only a small amount of friction damage appeared on the granite surface. In contrast, under high normal stress, the damage area of granite asperities increased significantly and some asperities were cut off. Meanwhile, the edge of the granite broke due to stress concentration. A great deal of asperities on the surface of cement mortar were cut off. Under the interaction of normal stress and shear stress, the generated moment led to tensile cracks in cement mortar. Figure 8e presents the microscopic failure mechanism of the joint specimen with JRC of 10.8. Discontinuities exhibited obvious dilation during the shearing process and the torque generated during the climbing process led to tensile cracks in both hard rock and soft rock. The shear damage of asperities was deeper due to the lower strength of soft rock.
Figure 9 presents the failure characteristics of discontinuities possessing different joint strengths with JRC of 18.7. The damage depth and damage area of discontinuities with JRC of 18.7 were greater. Plenty of asperities were cut off on the surface of hard rock and soft rock, and massive fragmented rock particles were produced by extrusion and crushing of asperities on the discontinuity. Under high normal stress, multiple tensile cracks appeared in the mortar, and asperities of mortar were completely chewed off due to the interpenetration of tensile cracks. Figure 9e presents the microscopic failure mechanism of the joint specimen with JRC of 18.7. Under the effect of the torque generated during the shear process, asperities of hard rock were partially sheared due to the higher strength of the hard rock. Meanwhile, tensile cracks inside the soft rock were interpenetrated and asperities of soft rock were completely chewed off.
It can be realized from the above analysis that discontinuities possessing different joint wall strengths needed to overcome the dilation and friction resistance of the surface asperity under low normal stress, and the damage was mainly manifested as the wear and shear of asperities on the soft rock. The shear strength of discontinuities was mainly influenced by the strength of the soft rock. The upper and lower blocks of the discontinuities came into close contact with the increase in normal stress. Plenty of asperities on the soft rock were sheared and crushed, while asperities of hard rock were partially embedded in the soft rock and tightly engaged with the soft rock subjected to higher normal stress. Moreover, asperities of the hard rock also successively experienced dilation and shear failure under sustained shear effect, which greatly improved the peak shear strength and shear stiffness of the discontinuities. The shear strength of discontinuities possessing different joint wall strengths was mainly governed by the shear strength of the hard rock.
On the basis of the above analysis, the shear process of discontinuities possessing different joint wall strengths can be divided into four stages combined with the shear process of the GCR3 specimen, as illustrated in Figure 10. (a) Stage of tight matching: The upper and lower blocks of the discontinuities possessing different joint wall strengths came into light contact and coupled compaction under the effect of normal stress. (b) Stage of climbing wear of soft rock and crack formation of hard rock: As the shear proceeds, the joint walls of discontinuities dislocate relatively accompanied by dilation. Meanwhile, part of the asperities of the soft rock is worn down and cracks appears in the asperity of the hard rock. (c) Stage of partial shear of soft rock and crack propagation of hard rock: Asperities of the soft rock are partially cut off when the shear stress endured by the soft rock reaches its shear strength. Asperities of the soft rock are completely cut off and cracks in asperities of the hard rock further expands under high normal stress. (d) Stage of entire cutting of asperities: As the shear stress of discontinuities increases continually, asperities of the hard rock are partially cut off. Meanwhile, obvious tensile cracks occurred due to the tensile stress in the soft rock exceeding the tensile strength. Interpenetration of tension cracks causes the soft rock to be completely chewed and crushed; hence, the discontinuity was completely broken. The summary of these four stages is shown in Figure 10e.

5. Numerical Simulation of Shear Test of Discontinuities Possessing Different Joint Wall Strengths

5.1. Fundamental Introduction of UDEC

The Universal Distinct Element Code (UDEC) is a two-dimensional block discrete element software for solving discontinuous medium problems, which adopts continuum mechanics theory to analyze rock mechanics problems. Moreover, the UDEC is a calculation program guided by discrete element theory, which satisfies the basic requirements of dealing with engineering problems of a discontinuous medium. For discontinuities of structures (such as structural planes in rock mass, cracks and joints), the UDEC handles them as an internal boundary interface between divided blocks and assigns values to the mechanical parameters of rock joints. The new contact between the joint walls during shearing can also be automatically identified according to the calculation process. As for the divided discrete blocks, the UDEC can handle them as rigid blocks or deformed blocks. The deformed block is covered by the grid element, and the mechanical effect inside the rock block is simulated by the given constitutive criterion between the grids. The deformed block can also generate certain displacement, rotation and deformation along the rock joint. Compared with the traditional numerical software of geotechnical engineering which sets the grid unit as the rigid block, the UDEC is more appropriate for the simulation of mechanical properties of real rock materials.

5.2. Determination of Constitutive Model and Its Parameters

In this study, the Mohr–Coulomb model is adopted to simulate the material of joint blocks. The parameters used for numerical simulation include material density (ρ), bulk modulus (K), shear modulus (G), cohesion (c), internal friction angle (Ø) and tensile strength (T). The bulk modulus (K) and shear modulus (G) are calculated from the following equation,
K = E 3 ( 1 2 V ) ,   G = E 2 ( 1 + V )
where V is the Poisson’s ratio, E is the Young’s modulus.
The constitutive model of discontinuities possessing different joint wall strengths was a continuously yielding model (CY model). The required parameters for this model include shear stiffness (Ks), normal stiffness (Kn), roughness (R), initial peak friction angle (Øim) and basic friction angle (Øb). The shear stiffness (Ks) and normal stiffness (Kn) of the discontinuities were calculated according to the following equation.
K n = a n σ n e n ,   K s = a s σ n e s
where an and en are the parametric factors of the normal stiffness, as and es are the parametric factors of the shear stiffness, σ n is the normal stress. Based on the laboratory test results, the normal and shear stiffness parameter factors were calibrated by the trial and error method. The parameters used in numerical simulation are listed in Table 2.

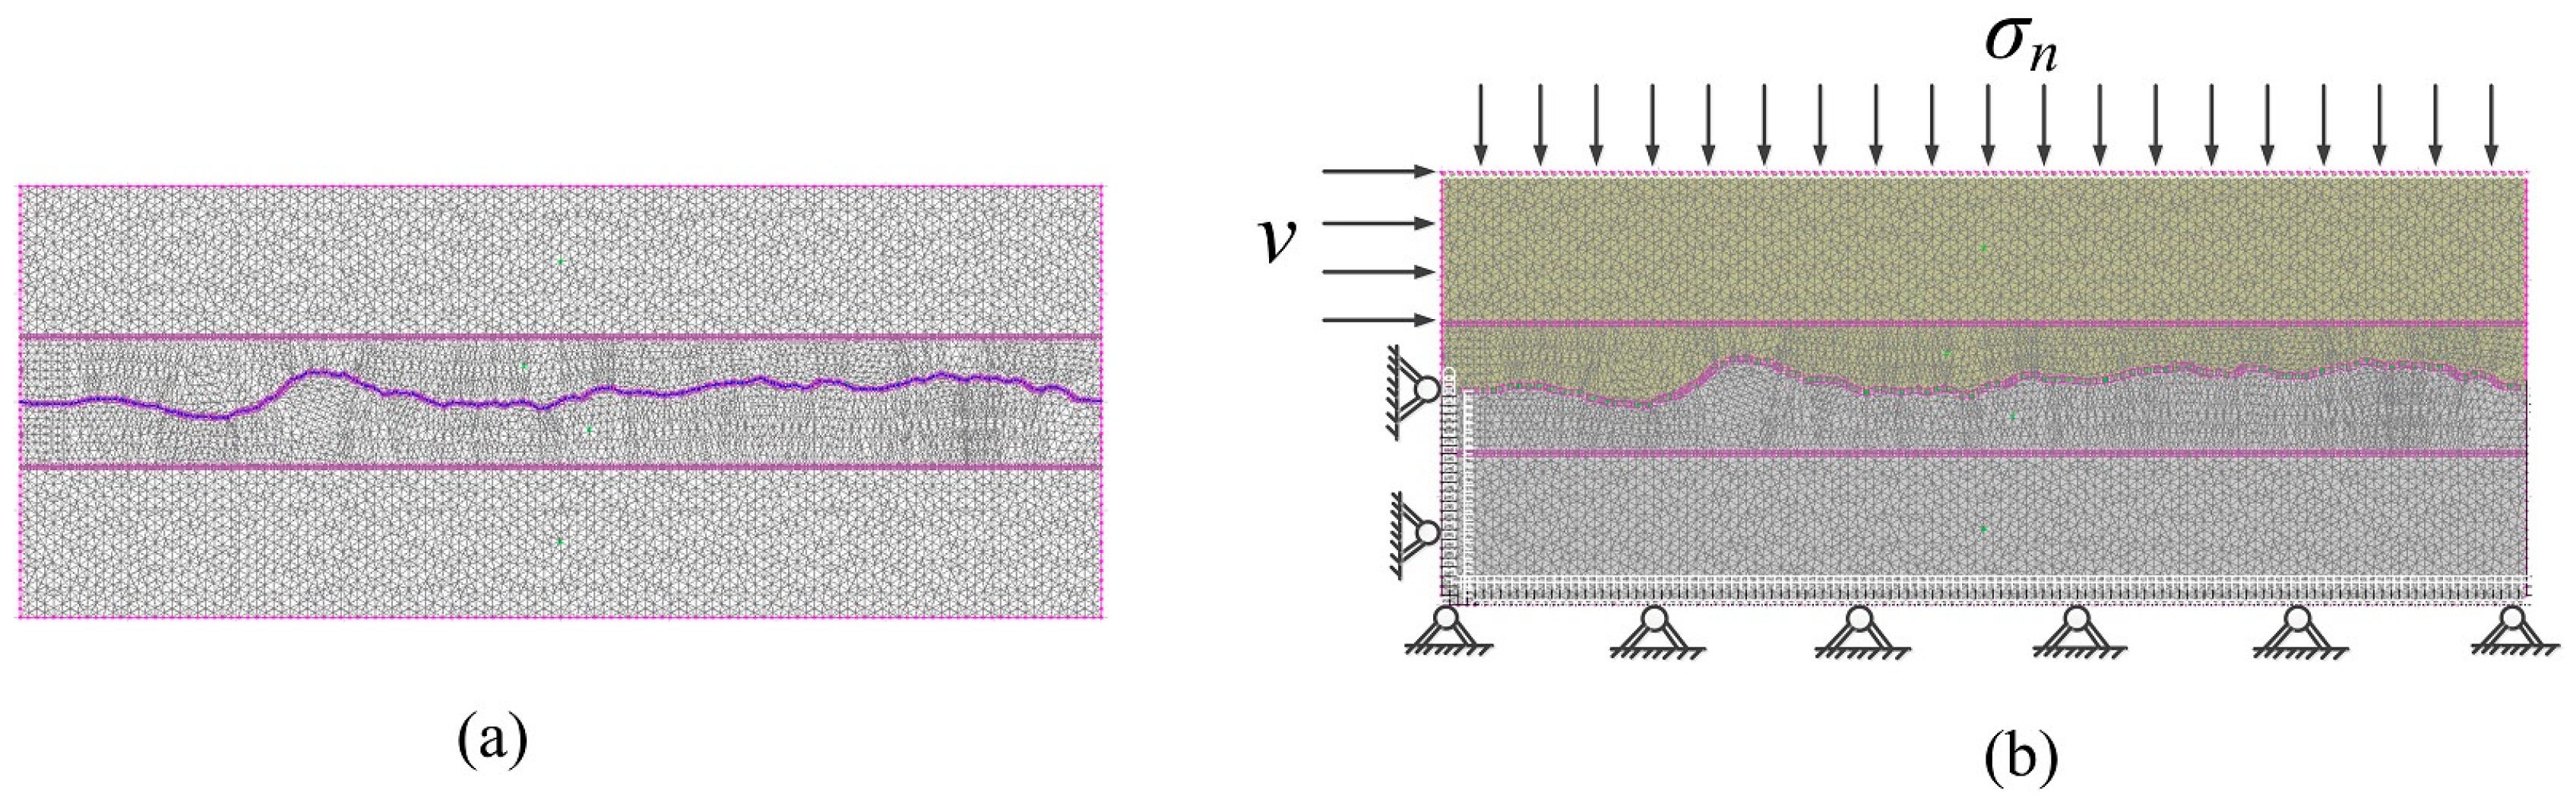
5.3. Establishment of Numerical Model of Shear Tests

A rectangular block with a size of 100 mm × 40 mm was established, and discontinuities possessing different joint wall strengths with three types of morphology were imported into the middle of the rectangle to construct numerical models corresponding to the joint specimens tested in the laboratory. The initial rectangular block was divided into the triangular mesh element. The smaller the size of the mesh element, the more realistic the shear mechanics regularity of discontinuities. However, the computational load of the computer will also increase, which reduces the computational efficiency of the numerical model. Therefore, in order to elaborately investigate the shear mechanical properties of discontinuities with inclusion of the computational efficiency, the block region within 6 mm from the discontinuity was finely divided into grids with size 1 mm. In contrast, the grid size of the remaining block region was 1.5 mm. With reference to the laboratory shear test, the upper block of the model was set as sandstone or granite, while the lower block of the model was set as mortar. The numerical model of discontinuities possessing different joint wall strengths is shown in Figure 11. The loading scheme in numerical simulation was consistent with laboratory tests. The numerical analysis program of discontinuities was compiled with Fish, which monitored the shear stress, shear displacement and normal displacement.

6. Results and Analysis of Numerical Simulation

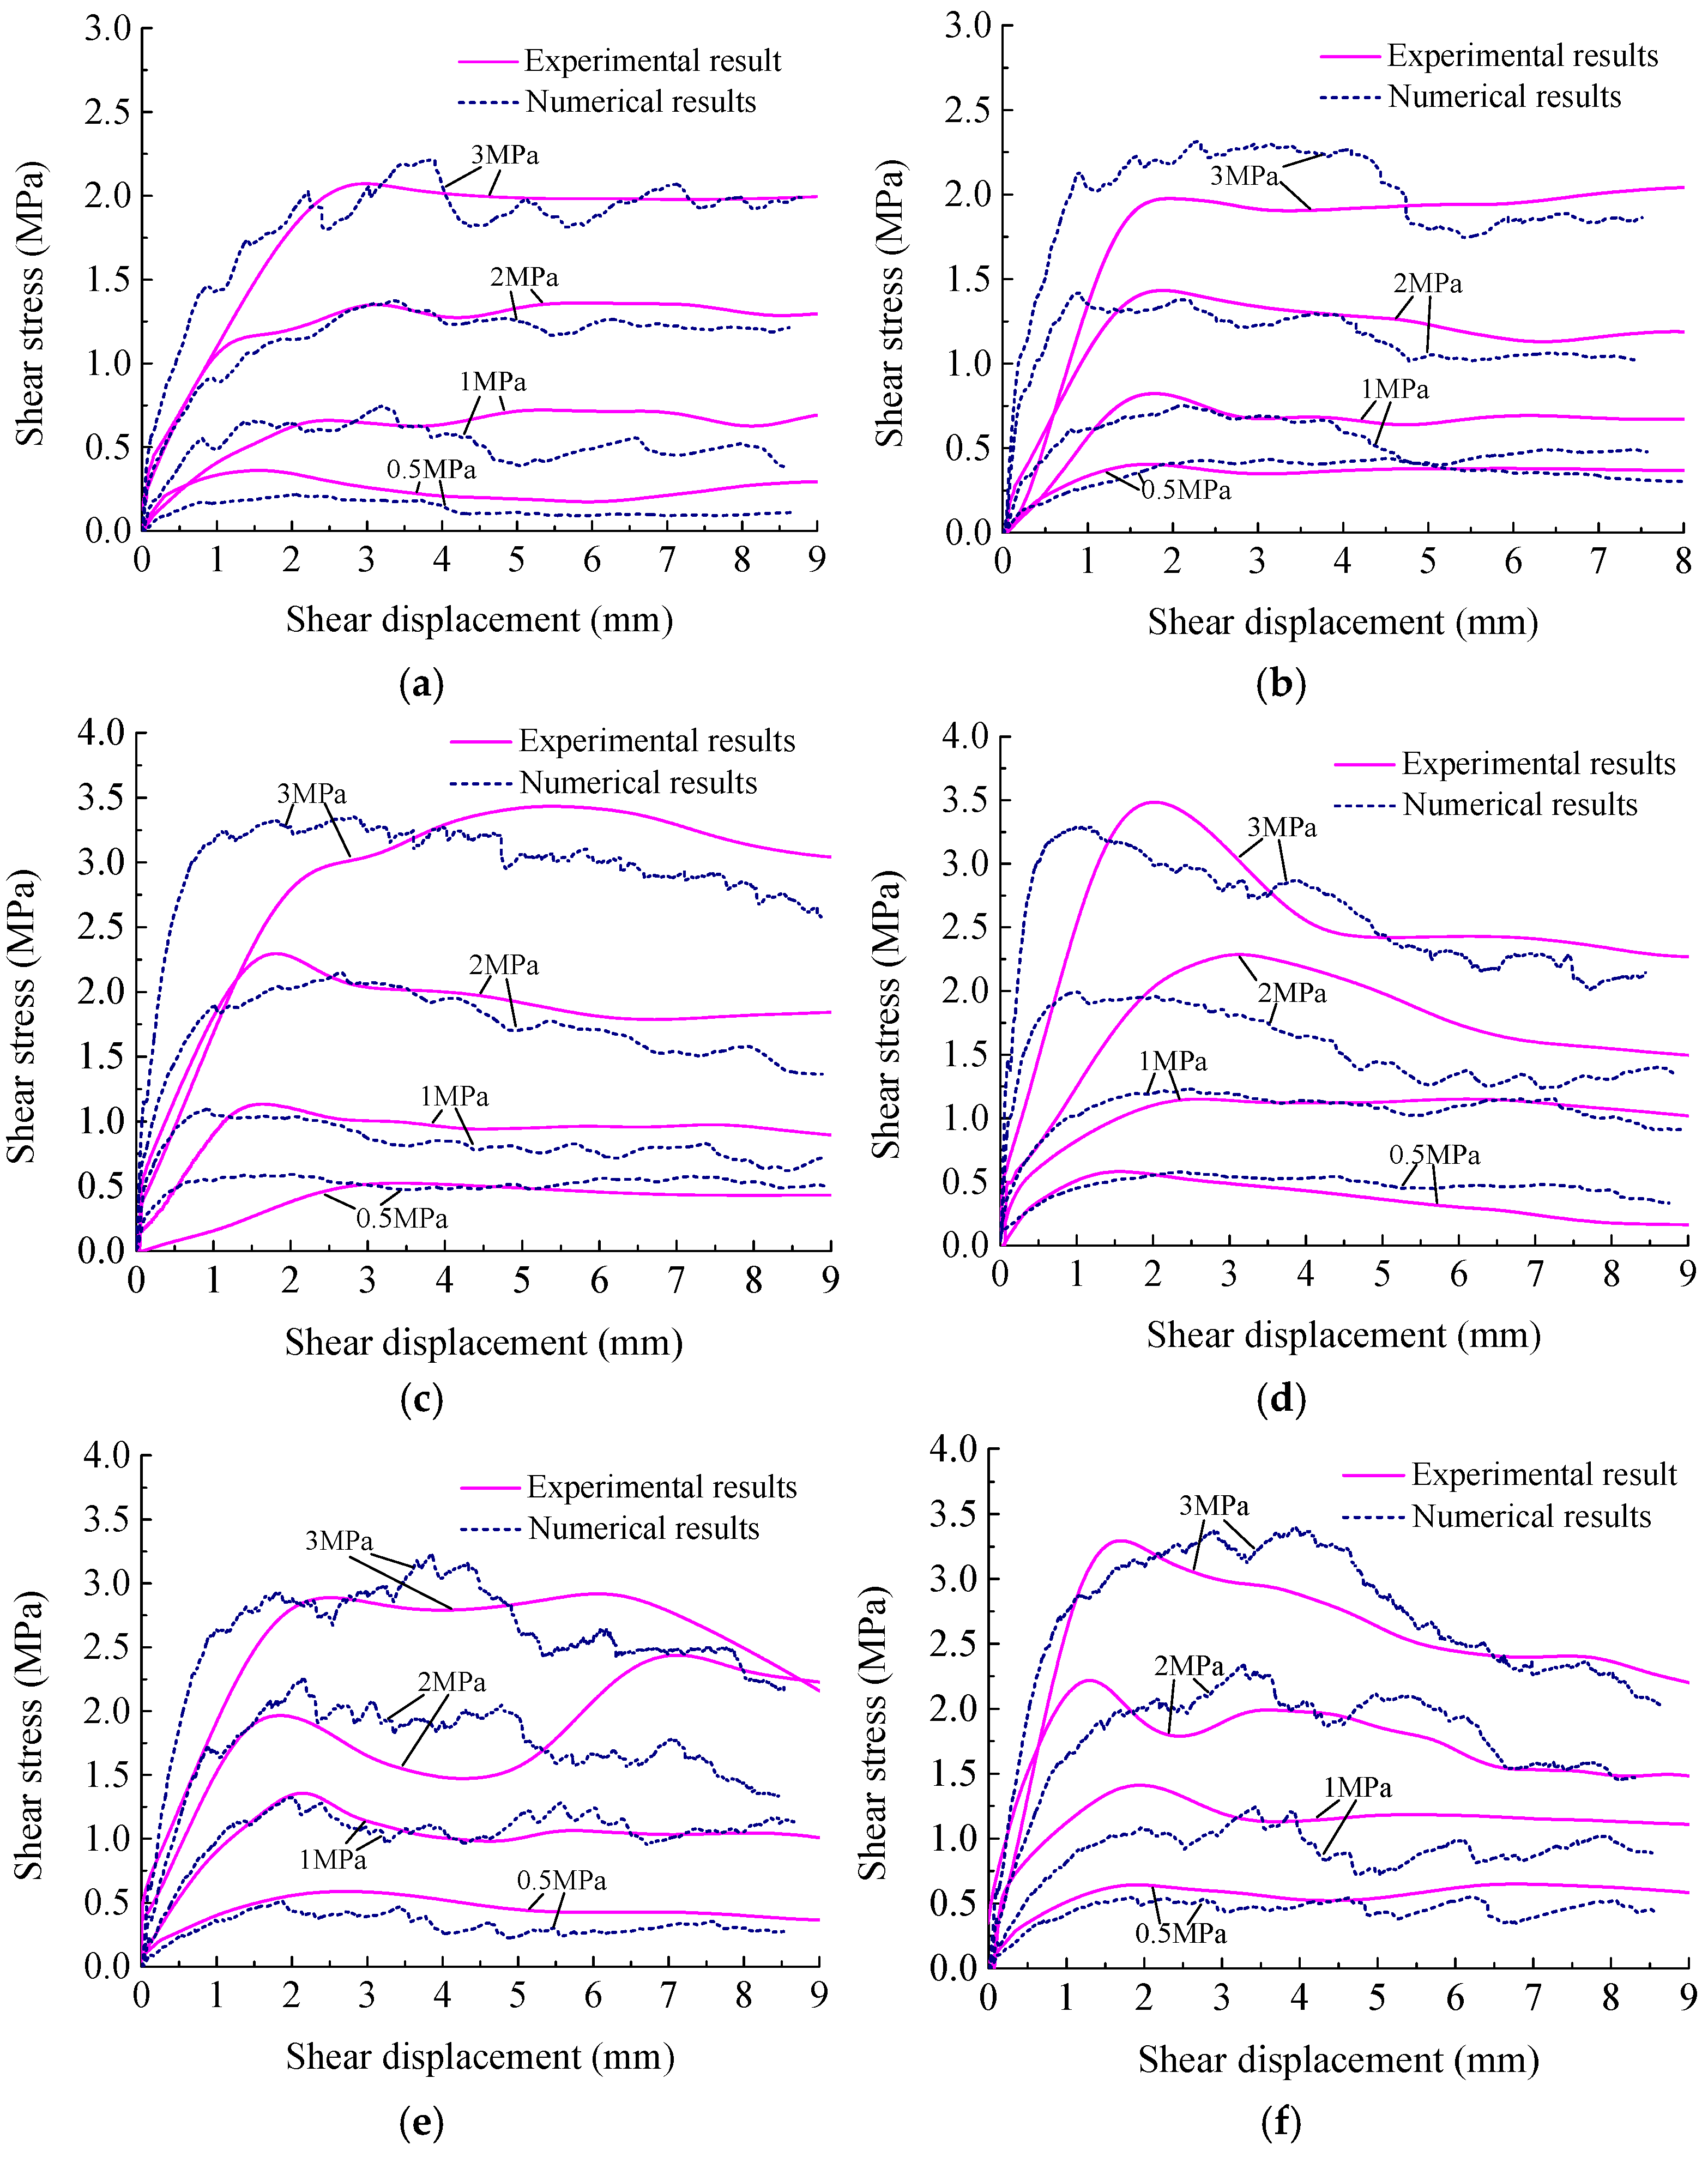
6.1. Numerical Shear Characteristic of Discontinuities Possessing Different Joint Wall Strengths

After each shear simulation was completed, the numerical test data were derived. Figure 12 presents the comparison between the experimental and numerical results of the shear curves of joint specimens.
It is visible from Figure 12 that the numerical results are basically consistent with the experimental results. Both the test curve and the numerical curve had obvious peak values and showed a progressive failure process. The peak shear strength, residual shear strength and shear stiffness in numerical results increased significantly with the gradual increase in normal stress. Under high normal stress, the shear stress of discontinuities with JRC of 18.7 decreased steeply after reaching the peak value, which means the brittle failure was caused by the great difference in strength between the hard rock and the soft rock. That is to say, for discontinuities possessing different joint wall strengths with JRC of 18.7, the convex structure of the discontinuity would suddenly break under the effect of high normal stress. Therefore, the overall failure mode of discontinuity was manifested as brittle shear failure, which was consistent with the test results. It can be seen that the numerical results fully verified the accuracy of the test results, and further that the CY model in UDEC is completely applicable to the shear numerical simulation of discontinuities possessing different joint wall strengths. Figure 13 presents the shear stress contours of the discontinuities possessing different joint wall strengths when the shear displacement reached 5 mm.
It is visible from Figure 13 that in the case of equal roughness, the shear stress of discontinuities increased with the increase in normal stress. In the case of the same normal stress, the shear stress endured by discontinuities with large roughness was significantly greater than that of discontinuities with small roughness. Simultaneously, the shear stress endured by discontinuities was mostly concentrated on the asperity facing the shear direction. Comparing with the test results, the friction damage and cutting phenomena of asperities mostly occurred in the morphology facing the shear direction. Meanwhile, it can be realized from the shear stress contour that the shear stress endured by granite–mortar discontinuities was greater than shear stress endured by sandstone–mortar discontinuities under the same normal stress. This is owing to the strength difference between granite and mortar being greater, and the embedding effect and furrow effect of asperity being more significant in the shear process. Therefore, the shear stress endured by granite–mortar discontinuities increased obviously.

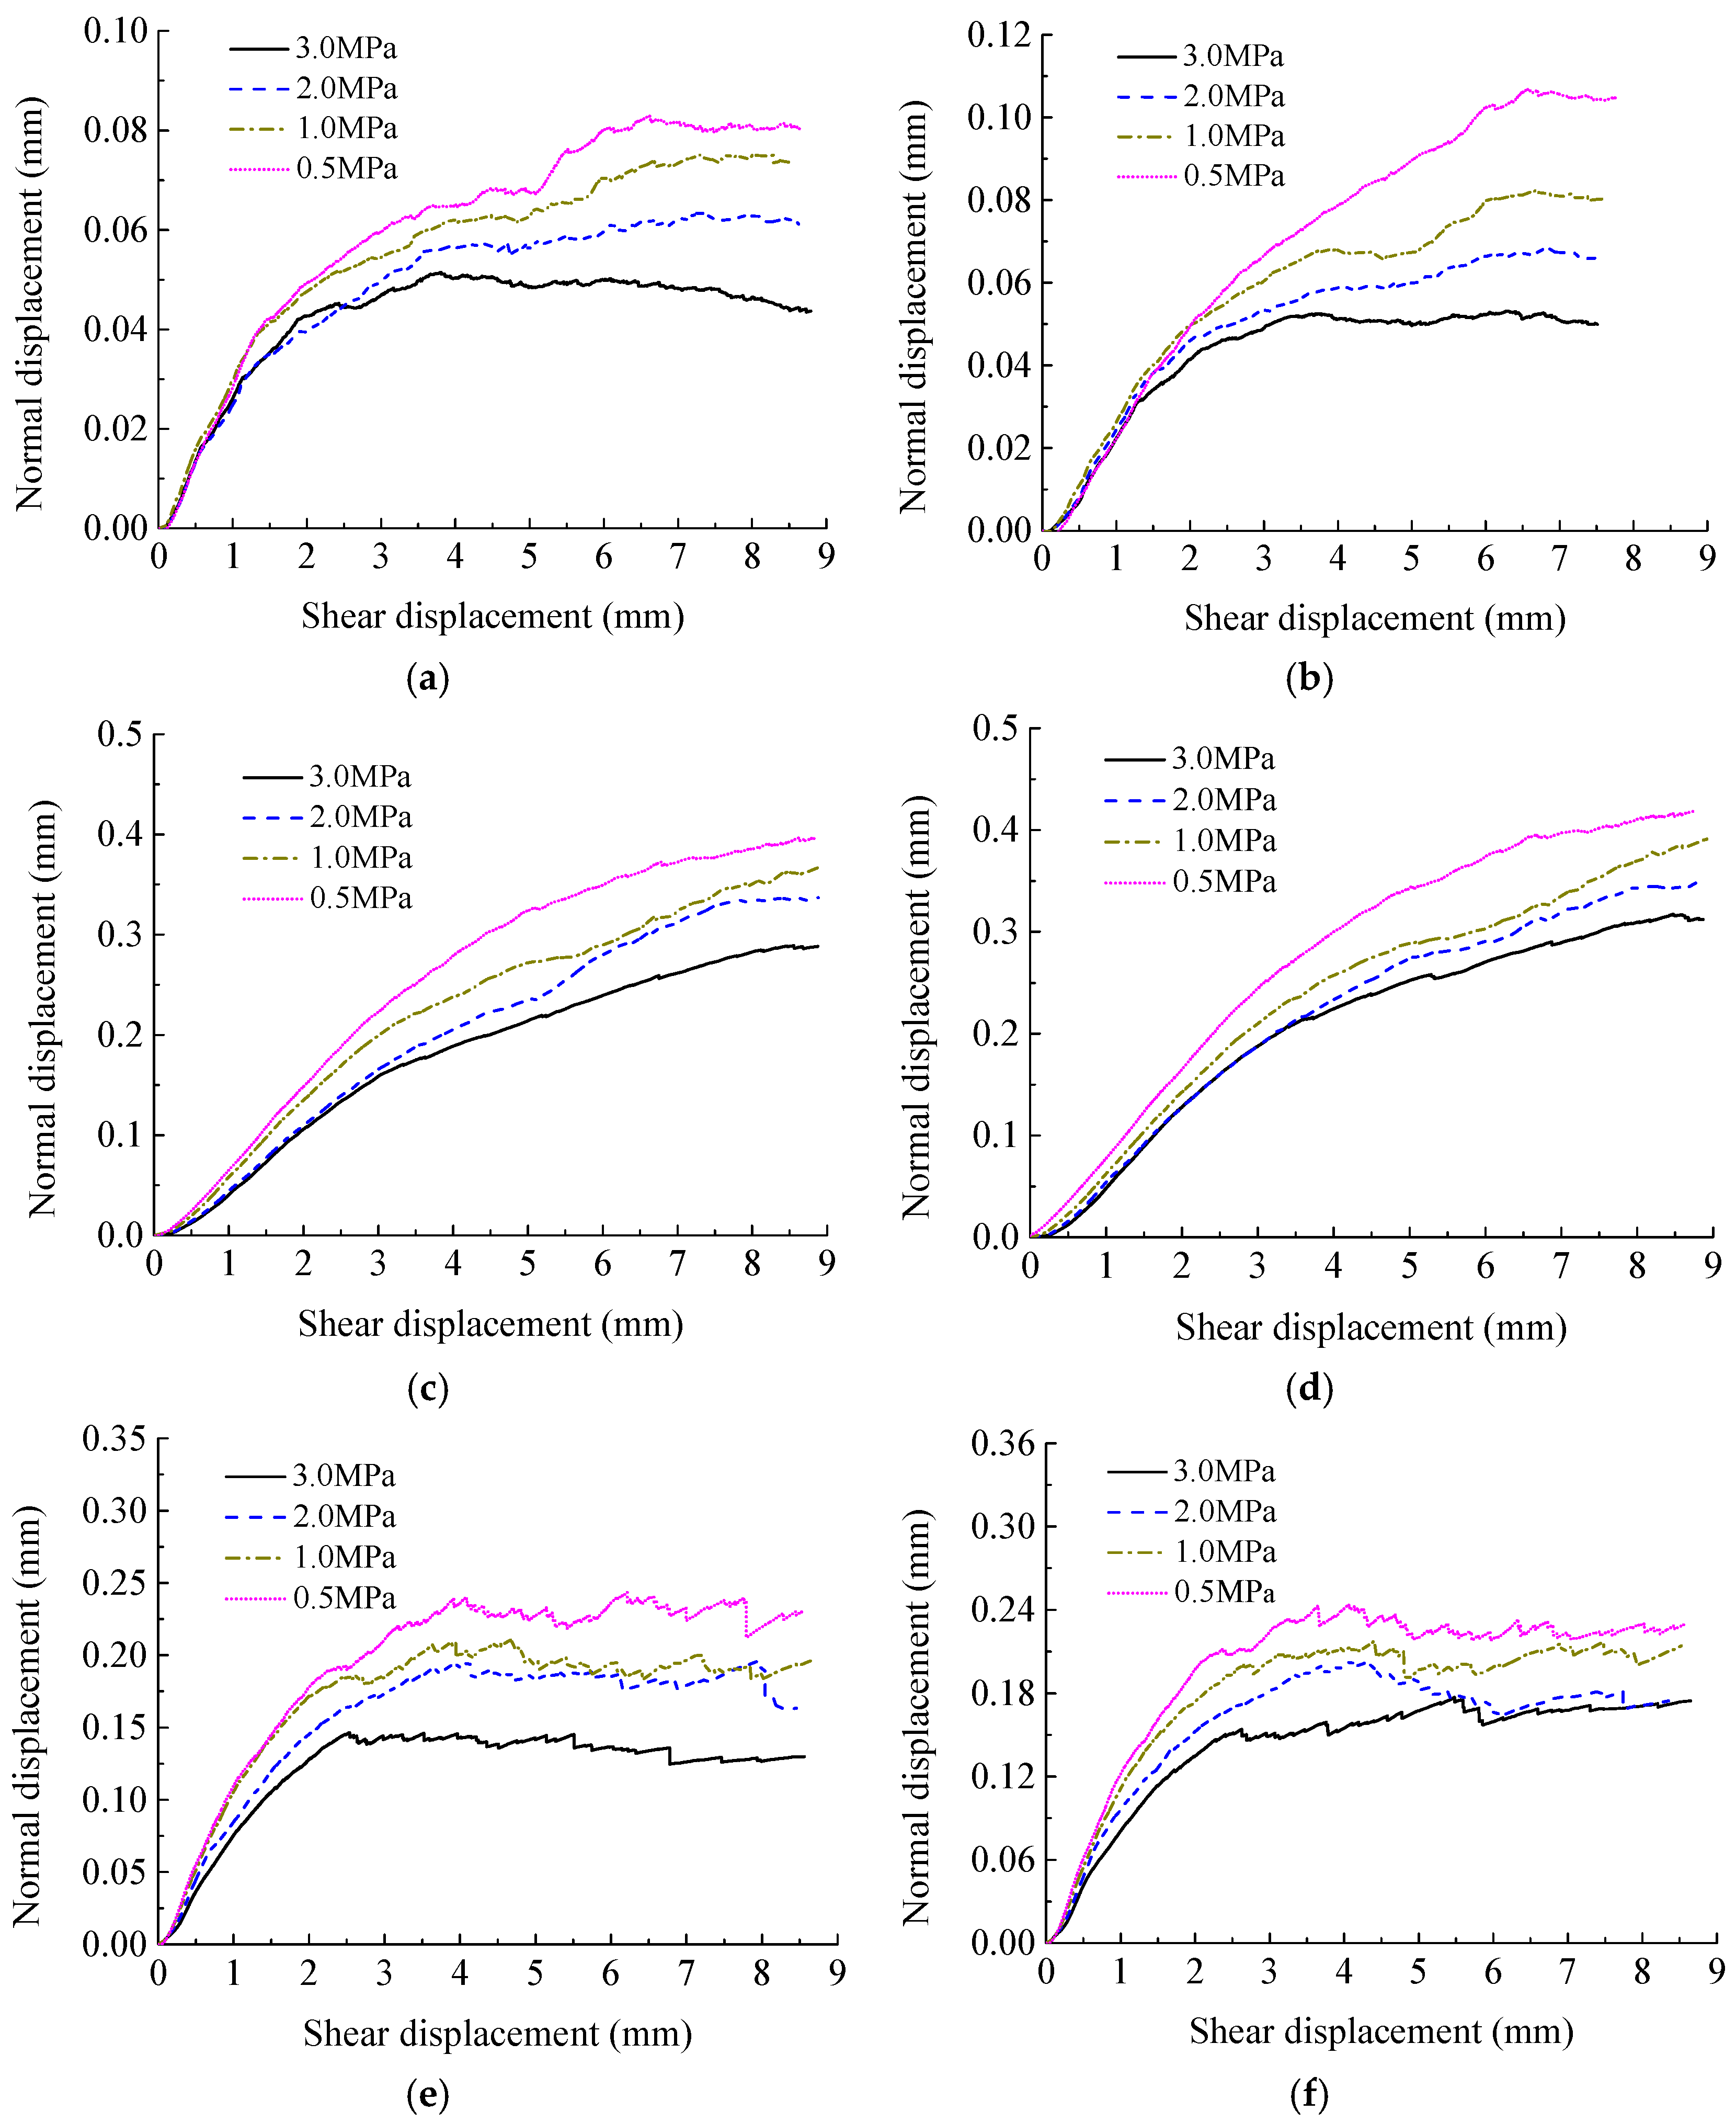
6.2. Dilation Law of Discontinuities Possessing Different Joint Wall Strengths

The numerical dilation data of discontinuities possessing different joint wall compressive strengths were derived, and curves of normal displacement vs. shear displacement were plotted, as shown in Figure 14.
The dilation displacement of discontinuities increased with the increase in shear displacement. In the initial stage of the numerical test, the dilation displacement increased rapidly. However, there was a turning point of increasing rate when the peak shear displacement was reached, the increasing rate of dilation displacement decreased and the dilation curve tended to be gentle. Dilation displacement eventually reached a stable value with the continuous increasing of shear displacement. This was because asperities of discontinuities were cut off in quantities after the shear stress reached the peak value. The dilation effect was significantly weakened until asperities entered the grinding and migration stage, and the dilation displacement then tended to be stable. In conclusion, the dilation displacement of discontinuities was concerned with normal stress. With the gradual increase in normal stress, the cutting effect between asperities of discontinuities was significantly enhanced, thus weakening the climbing dilation effect between asperities and decreasing the dilation displacement gradually. In addition, the increasing rate of dilation displacement also gradually decreased. Dilation values (mm) of discontinuities possessing different joint wall strengths with different morphologies are listed in Table 3.
It is visible from Table 3 that under the effect of the same normal stress, the dilation displacement of discontinuities with JRC of 10.8 was the maximum, the dilation displacement of discontinuities with JRC of 18.7 was second, while the dilation displacement of discontinuities with JRC of 2.8 was the minimum. The reason is that the undulation of discontinuities with JRC of 10.8 was the largest; thus, the climbing effect was the most significant correspondingly. As for discontinuities with JRC of 2.8, the number of rough construction was the least, which is why the dilation effect was basically weakened and the dilation displacement was the minimum. Comparing two types of discontinuities possessing different joint wall compressive strengths with the same roughness, asperities of granite had more obvious embedding effects on mortar due to the compressive strength of granite being approximately three times that of sandstone. Therefore, the damage degree of granite–mortar discontinuities during the shearing process was more severe as a result of the meshing and shearing effects of asperities being greatly enhanced, which weakened the climbing dilation effect correspondingly. Eventually, the dilation value of granite–mortar discontinuities was smaller than that of sandstone–mortar discontinuities.

6.3. Shear and Dilation Properties of Rock–Mortar Discontinuities and Rock–Rock Discontinuities

In order to further investigate the difference of shear properties between discontinuities possessing identical joint wall strengths and discontinuities possessing different joint wall strengths, numerical shear tests of granite discontinuities, sandstone discontinuities and mortar discontinuities with JRC of 10.8 were performed. The identifier of granite discontinuities was set as GGR2, the identifier of sandstone discontinuities was set as SSR2 and the identifier of mortar discontinuities was set as CCR2. Shear curves of discontinuities possessing identical joint wall strengths and discontinuities possessing different joint wall strengths under different normal stresses are shown in Figure 15 and Figure 16.
After comparing the numerical results of discontinuities possessing identical joint wall strengths and discontinuities possessing different joint wall strengths, it can be realized that the peak shear strength and residual shear strength of granite–mortar discontinuities were between those of granite discontinuities and mortar discontinuities. Meanwhile, the peak shear strength and residual shear strength of sandstone–mortar discontinuities were also between those of sandstone discontinuities and mortar discontinuities. Therefore, it can be concluded that the peak shear strength and residual shear strength of discontinuities possessing different joint wall strengths are between those of discontinuities possessing identical joint wall compressive strengths composed of hard rock and discontinuities possessing identical joint wall compressive strengths composed of soft rock. Comparing the numerical results of three types of discontinuities possessing identical joint wall compressive strengths, the results showed that the peak shear strength of granite discontinuities was greater than that of sandstone discontinuities, and the peak shear strength of mortar discontinuities was the smallest. Moreover, the residual shear strength of the three types of discontinuities possessing identical joint wall strengths had identical regularity. Figure 17 and Figure 18 present the dilation curves of the discontinuities possessing identical joint wall strengths and discontinuities possessing different joint wall strengths.
Figure 17 shows that the dilation displacement of granite–mortar discontinuities was between that of granite discontinuities and mortar discontinuities. Figure 18 shows that the dilation displacement of sandstone–cement mortar discontinuities was between sandstone discontinuities and mortar discontinuities. Simultaneously, the climbing dilation effect was strengthened due to the increase in joint wall strength on both sides of discontinuities possessing identical joint wall compressive strengths. Therefore, the dilation displacement of granite discontinuities was the largest, the dilation displacement of sandstone discontinuities was second and the dilation displacement of mortar discontinuities was the smallest. The specific dilation values of rock–rock discontinuities and rock–mortar discontinuities are listed in Table 4.

7. Conclusions

(1)
Three-dimensional engraving technology can effectively fabricate joint specimens that are applicable to laboratory tests. The joint specimen fabricated by this method has the morphological characteristics of being highly consistent with the prototype, which is available to analyze the shear properties and morphological characteristics of the rock joint with different joint wall strengths made by various rock and rock-like materials.
(2)
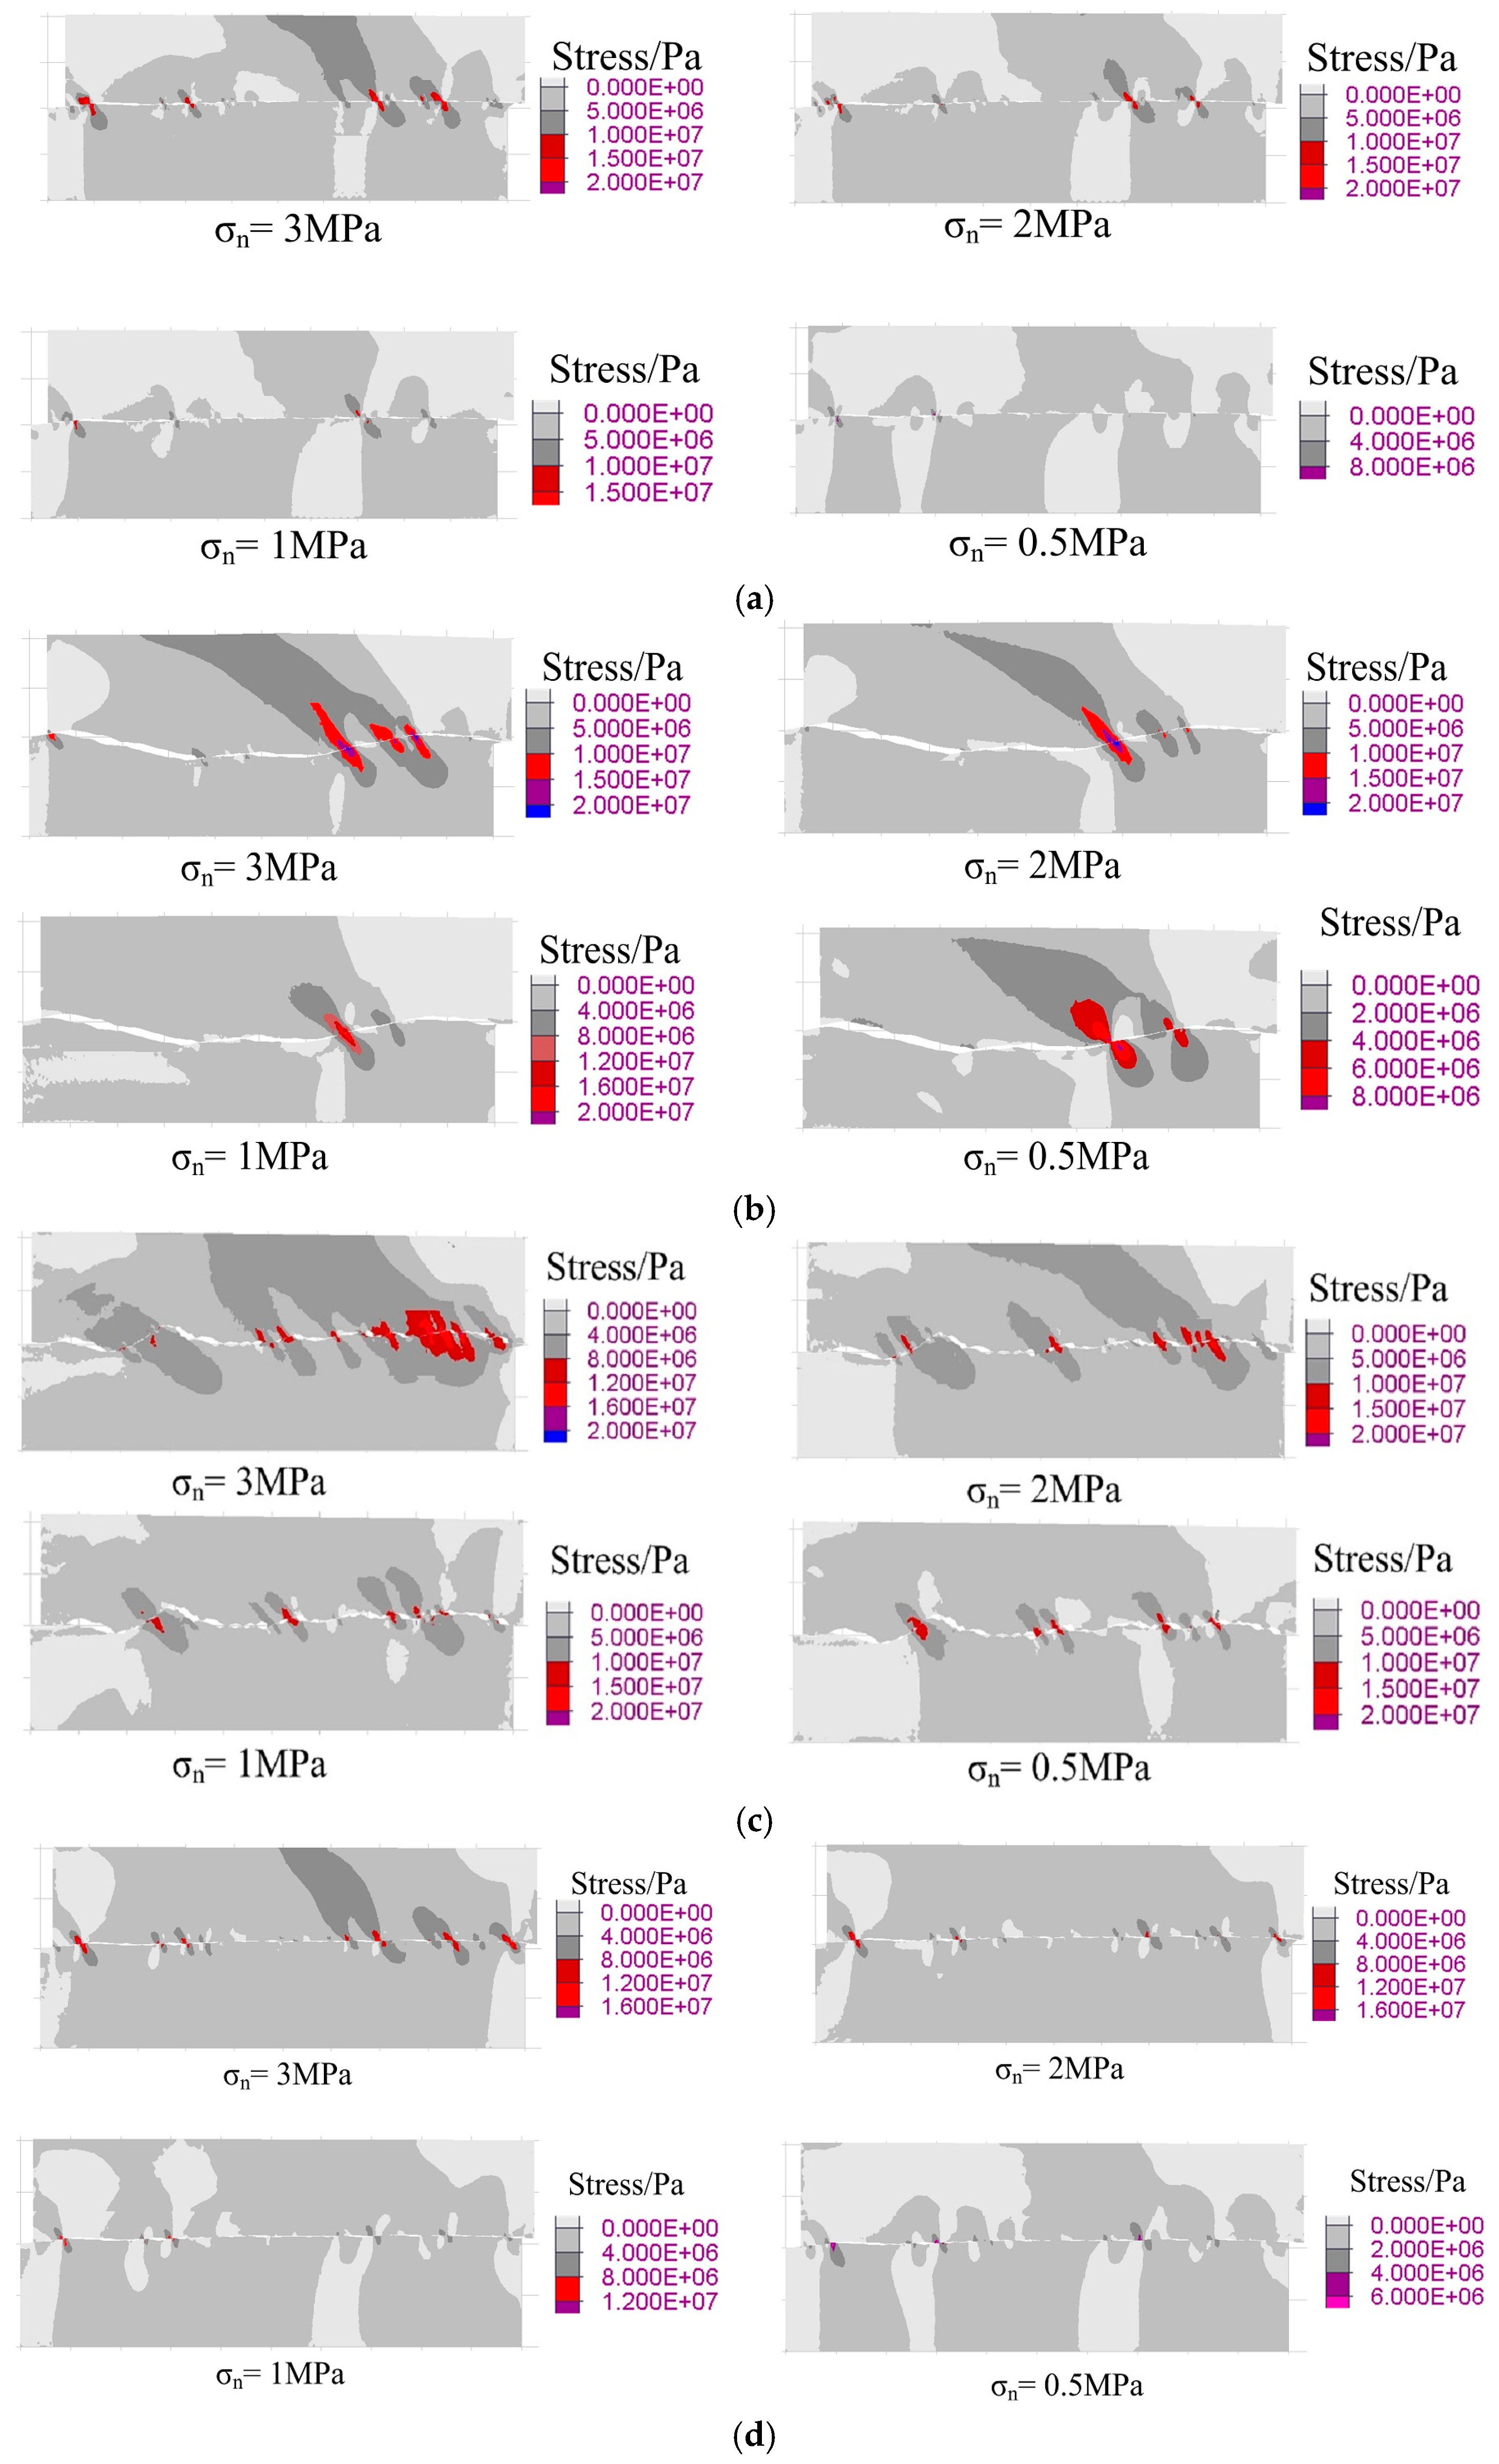
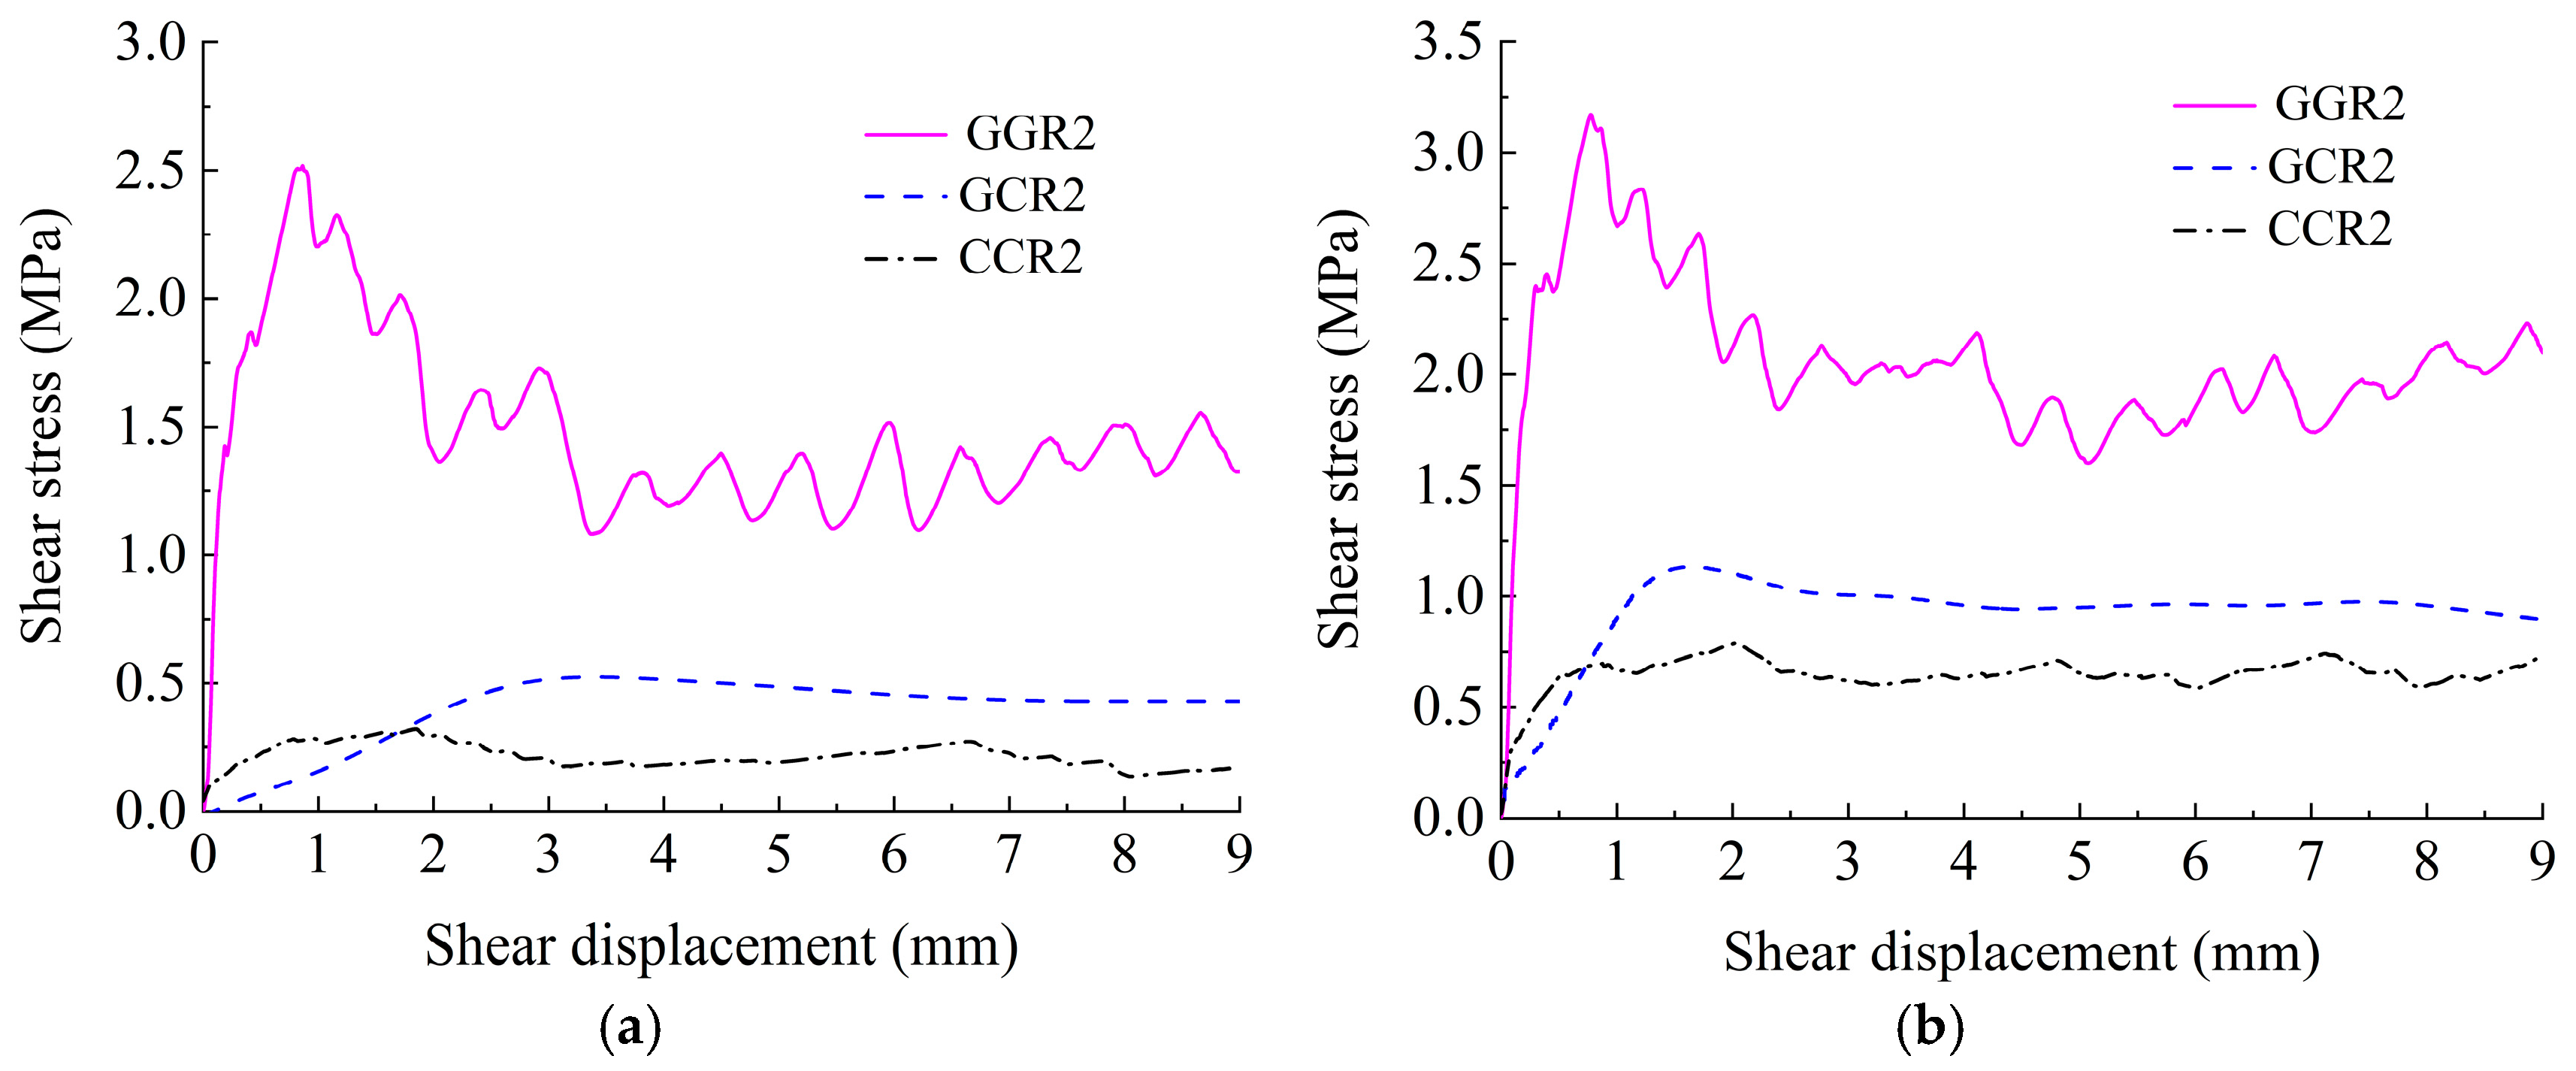
The shear curve of the numerical simulation is basically consistent with the test curve, which verifies the accuracy of the CY constitutive model in simulating progressive failure of discontinuities possessing different joint wall strengths. Integrating the shear stress contour of the numerical simulation and the test results to analyze, the damage area in the shearing process of discontinuities possessing different joint wall strengths is mainly concentrated on the asperity facing the shear direction. The shear wear and cutting destruction of discontinuities possessing different joint wall strengths are mainly distributed in the soft rock.
(3)
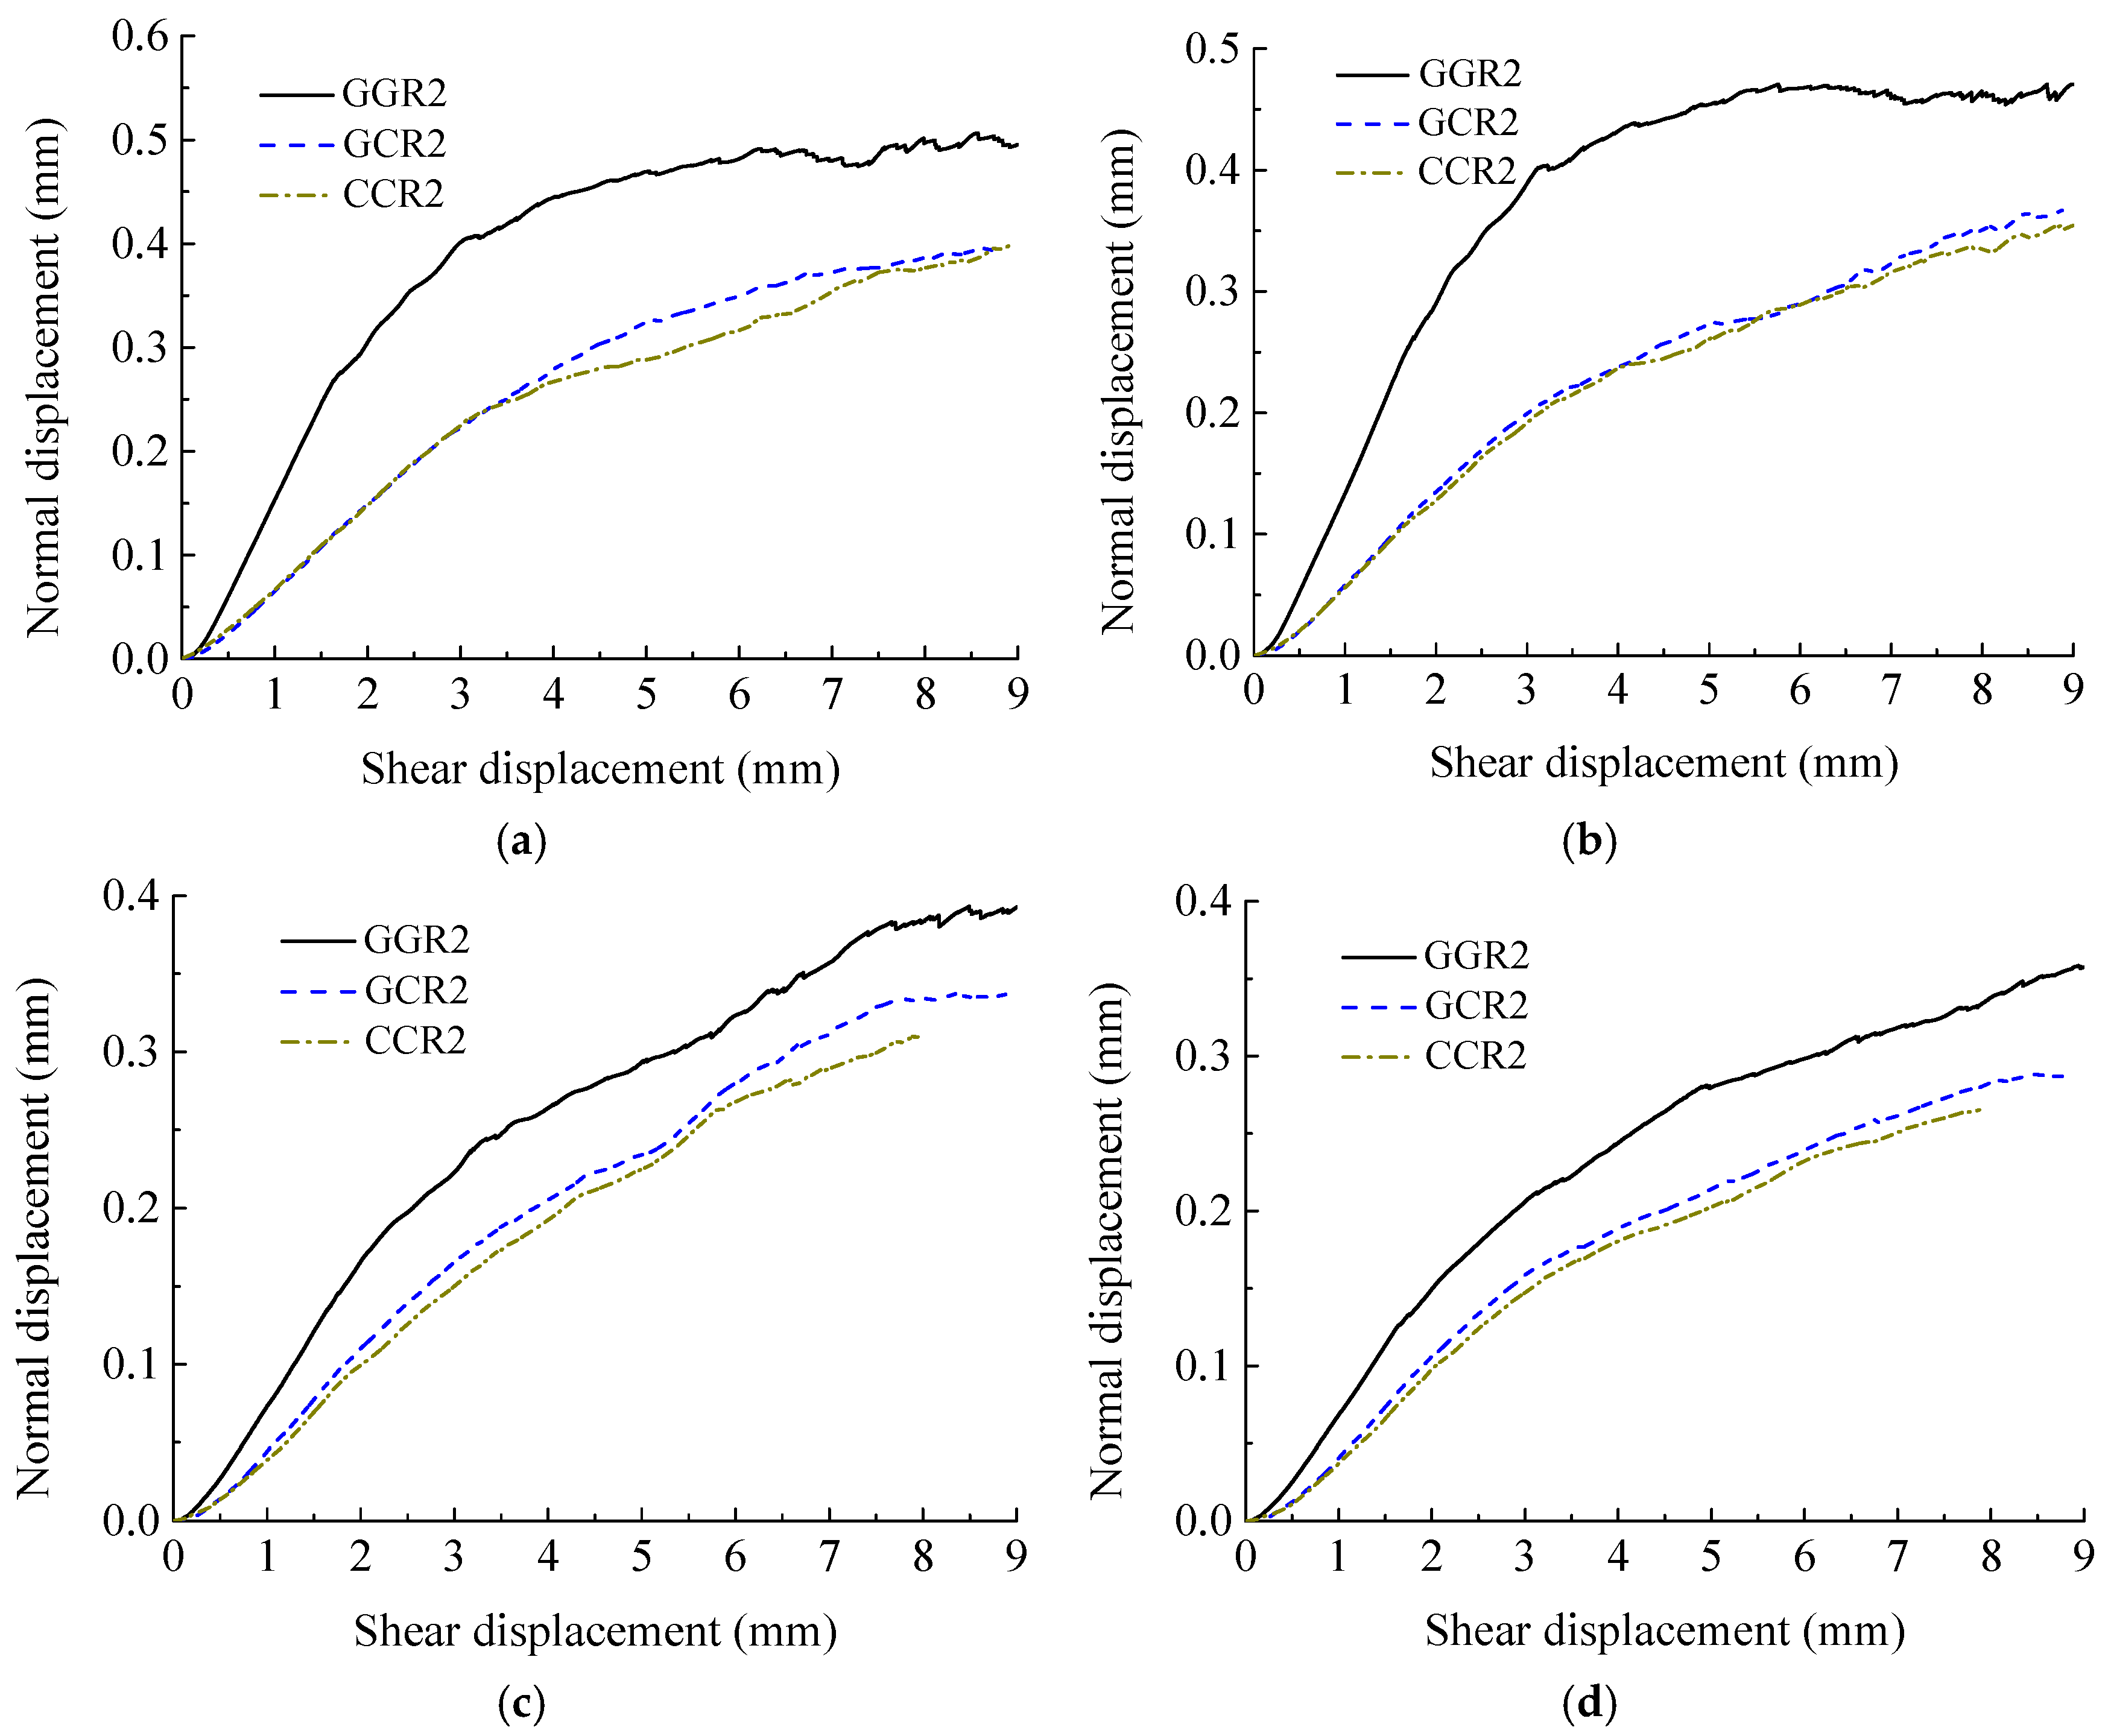
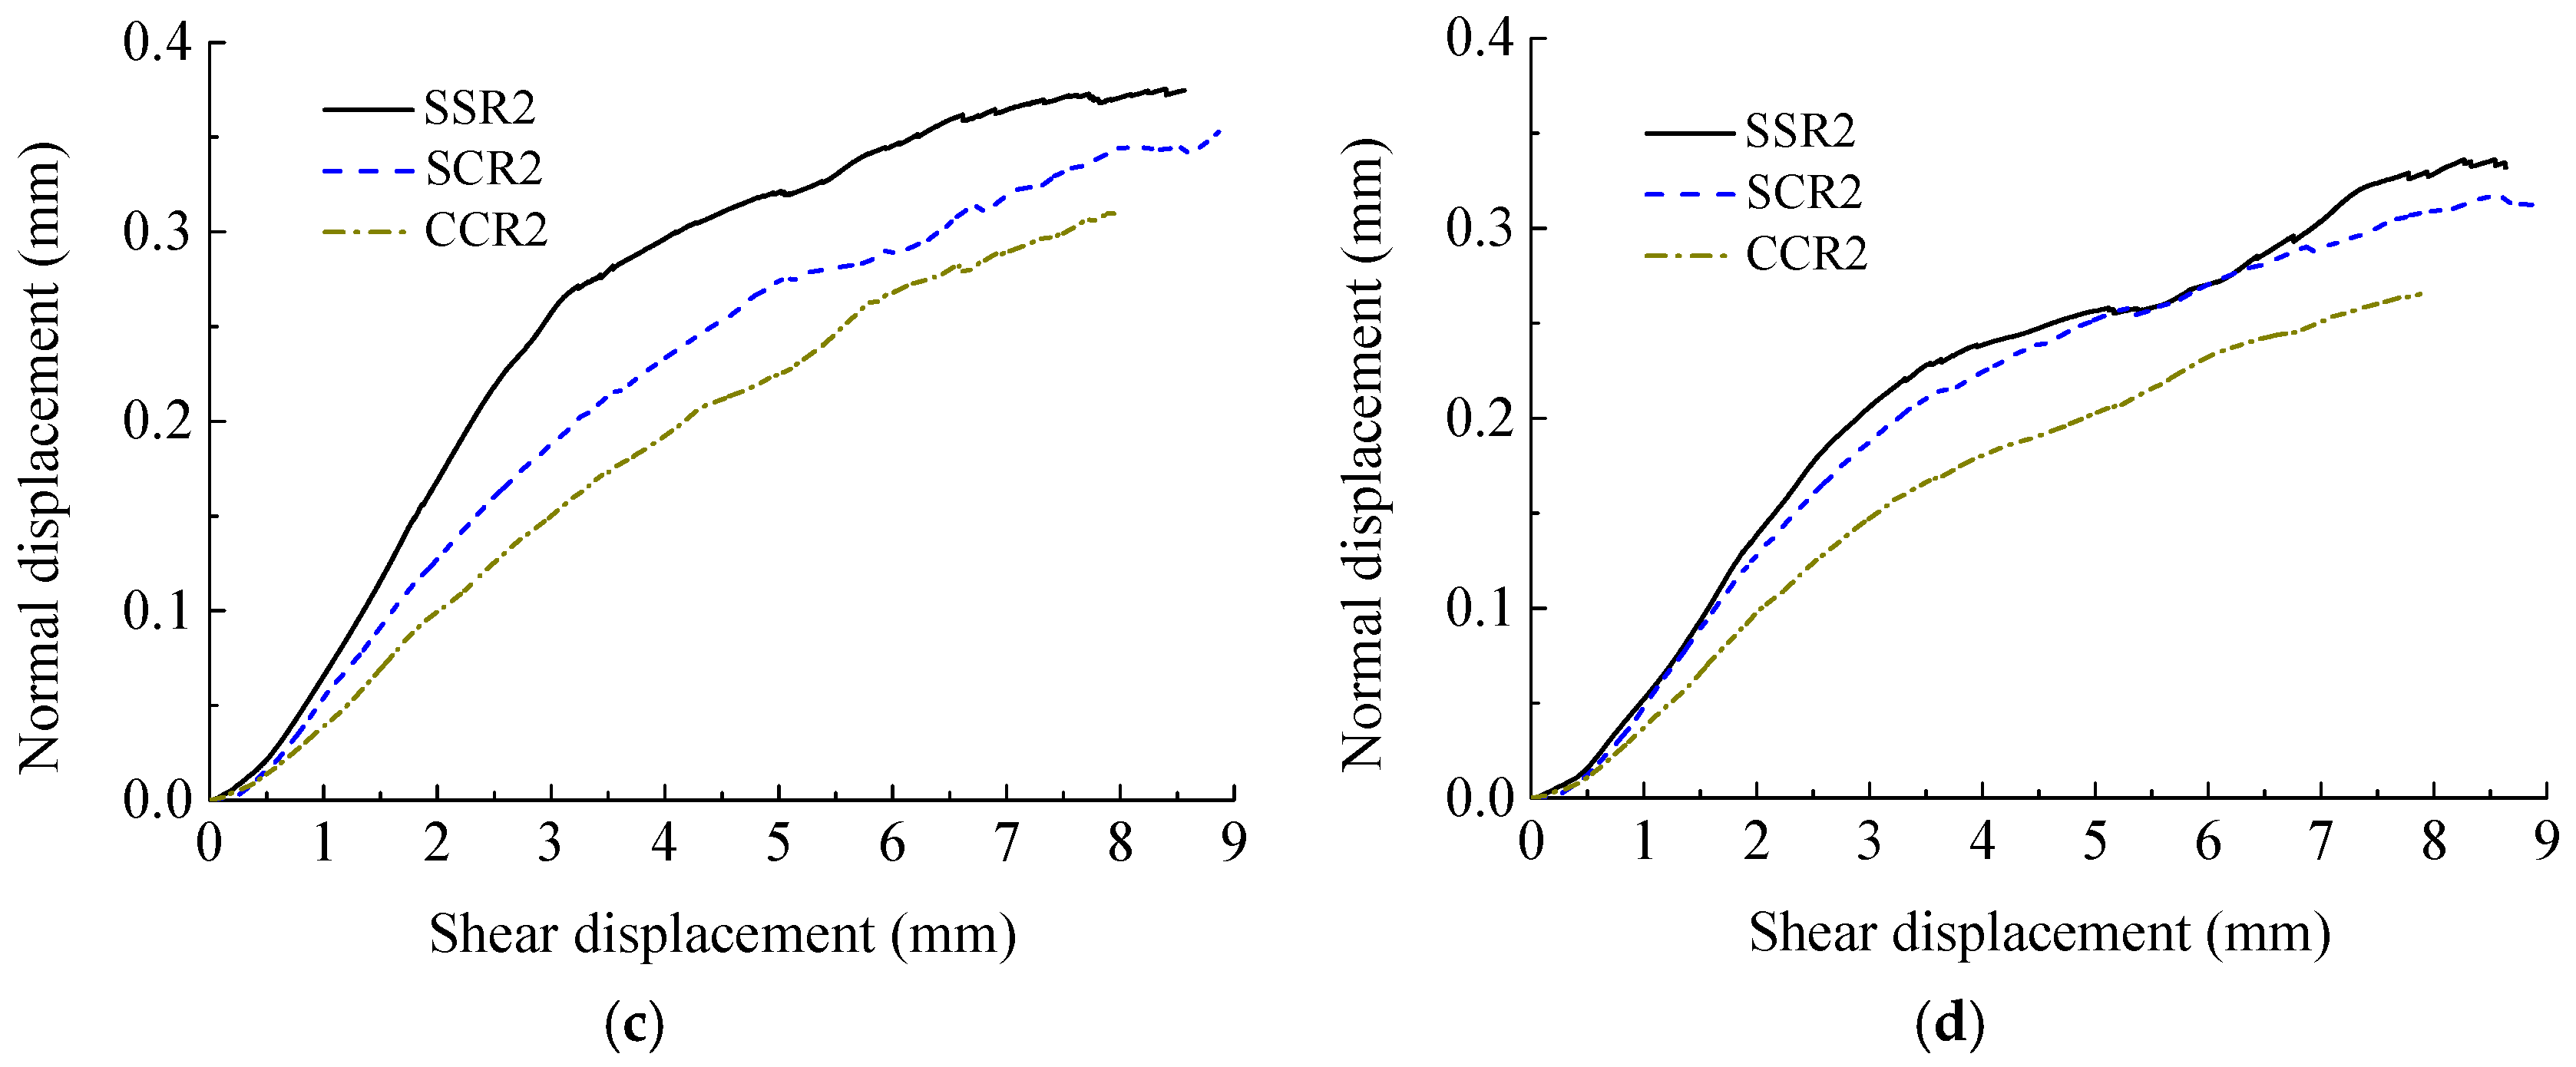
The dilation displacement of discontinuities possessing different joint wall compressive strengths decreases with the increase in normal stress. Due to the cooperative effect of roughness and undulation, the dilation displacement of discontinuities possessing different joint wall strengths with JRC of 10.8 is the largest, discontinuities possessing different joint wall strengths with JRC of 18.7 is second and discontinuities possessing different joint wall strengths with JRC of 2.8 is the smallest. The embedding effect of asperities is enhanced and the climbing dilation effect is weakened as a result of the great difference in joint wall strength on both sides of granite–mortar discontinuities. Therefore, the dilation displacement of granite–mortar discontinuities is smaller compared with sandstone–mortar discontinuities.
(4)
On basis of the numerical results, the peak shear strength and residual shear strength of discontinuities possessing different joint wall strengths are between those of discontinuities possessing identical joint wall strengths composed of hard rock and discontinuities possessing identical joint wall strengths composed of soft rock. Meanwhile, the dilation displacement of discontinuities possessing different joint wall strengths is also between discontinuities possessing identical joint wall strengths composed of hard rock and discontinuities possessing identical joint wall strengths composed of soft rock.

Author Contributions

All authors made substantial contributions to the conception and design of the study. X.Z.: conceptualization, methodology, funding acquisition and writing—review & editing. S.O.: investigation, data curation and writing original draft. C.F.: methodology and writing—review & editing. L.Y.: data curation and writing—review & editing. D.L.: supervision, methodology and writing—review & editing. All authors have read and agreed to the published version of the manuscript.

Funding

Open Foundation of Jiangxi Hydraulic Safety Engineering Technology Research Center, Jiangxi Academy of Water Science and Engineering (Grant No. 2022SKSG06), Young Elite Scientists Sponsorship Program by JXAST (Grant No. 2023QT06), Jiangxi Provincial Natural Science Foundation for Distinguished Young Scholars (Grant No. 20242BAB23047), National Natural Science Foundation of China (Grant Nos. 52369019).

Institutional Review Board Statement

Not applicable.

Informed Consent Statement

Not applicable.

Data Availability Statement

The data presented in this study are available on request from the corresponding author. The data is not publicly available due to privacy.

Conflicts of Interest

The authors declare no conflicts of interest.

References

  1. Liu, G.; Yang, Y. Deep Soft Rock Tunnel Perimeter Rock Control Technology and Research. Appl. Sci. 2025, 15, 278. [Google Scholar] [CrossRef]
  2. Liu, D.; Yan, W.; Yan, S.; Kang, Q. Study on the effect of axial and hydraulic pressure coupling on the creep behaviors of sandstone under multi-loading. Bull. Eng. Geol. Environ. 2021, 80, 6107–6120. [Google Scholar] [CrossRef]
  3. Dang, W.; Tao, K.; Fu, J.; Wu, B. Experimental investigation on unloading-induced sliding behavior of dry sands subjected to constant shear force. Appl. Sci. 2025, 15, 401. [Google Scholar] [CrossRef]
  4. Xie, S.; Jiang, Z.; Lin, H.; Ma, T.; Peng, K.; Liu, H.; Liu, B. A new integrated intelligent computing paradigm for predicting joints shear strength. Geosci. Front. 2024, 15, 40111884. [Google Scholar] [CrossRef]
  5. Zhang, X.; Cao, Z.; Yao, C.; Yang, J.; Ma, Y.; Ye, Z.; Zhou, C. Effect of nonstationarity on shear properties of rock joints and a new peak shear strength criterion. Int. J. Geomech. 2023, 23, 04023213. [Google Scholar] [CrossRef]
  6. Tang, Z.C.; Zhang, Z.F.; Zuo, C.Q.; Jiao, Y.Y. Peak shear strength criterion for mismatched rock joints: Revisiting JRC-JMC criterion. Int. J. Rock Mech. Min. 2021, 147, 104894. [Google Scholar] [CrossRef]
  7. Jiang, F.; Wang, G.; He, P.; Hou, B.; Zhang, S.B.; Sun, S.Q.; Zheng, C.C.; Wu, Y. Mechanical failure analysis during direct shear of double-joint rock mass. Bull. Eng. Geol. Environ. 2022, 81, 410. [Google Scholar] [CrossRef]
  8. Pirzada, M.A.; Bahaaddini, M.; Moradian, O.; Roshan, H. Evolution of contact area and aperture during the shearing process of natural rock fractures. Eng. Geol. 2021, 291, 106236. [Google Scholar] [CrossRef]
  9. Zhang, X.B.; Yi, L.; Yao, C.; Ma, Y.L.; Yang, J.H.; Jiang, Q.H.; Zhou, C.B. Comparative study on shear mechanical properties and failure mechanisms of rough joints under CNL and DNL boundary conditions. Chin. J. Rock Mech. Eng. 2025, 44, 865–880. (In Chinese) [Google Scholar]
  10. Pratomo, F.Y.; Wei, X.; Zou, C.; Zhao, G.F. Investigation of the shear failure of rock joints using the four-dimensional lattice spring model. Int. J. Rock Mech. Min. 2022, 152, 105070. [Google Scholar] [CrossRef]
  11. Barton, N.; Choubey, V. The shear strength of rock joints in theory and practice. Rock Mech. Rock Eng. 1977, 10, 1–54. [Google Scholar] [CrossRef]
  12. Grasselli, G.; Egger, P. Constitutive law for the shear strength of rock joints based on three-dimensional surface parameters. Int. J. Rock Mech. Min. 2003, 40, 25–40. [Google Scholar] [CrossRef]
  13. Moradian, Z.A.; Ballivy, G.; Rivard, P.; Gravel, C.; Rousseau, B. Evaluating damage during shear tests of rock joints using acoustic emissions. Int. J. Rock Mech. Min. 2010, 47, 590–598. [Google Scholar] [CrossRef]
  14. Asadi, M.S.; Rasouli, V.; Barla, G. A laboratory shear cell used for simulation of shear strength and asperity degradation of rough rock fractures. Rock Mech. Rock Eng. 2013, 46, 683–699. [Google Scholar] [CrossRef]
  15. Oliveira, D.; Indraratna, B. Comparison between models of rock discontinuity strength and deformation. J. Geotech. Geoenviron. 2010, 136, 864–874. [Google Scholar] [CrossRef]
  16. Hossaini, K.A.; Babanouri, N.; Nasab, S.K. The influence of asperity deformability on the mechanical behavior of rock joints. Int. J. Rock Mech. Min. 2014, 70, 154–161. [Google Scholar] [CrossRef]
  17. Atapour, H.; Moosavi, M. The influence of shearing velocity on shear behavior of artificial joints. Rock Mech. Rock Eng. 2014, 47, 1745–1761. [Google Scholar] [CrossRef]
  18. Rullière, A.; Rivard, P.; Peyras, L.; Breul, P. Influence of roughness on the apparent cohesion of rock joints at low normal stresses. J. Geotech. Geoenviron. 2020, 146, 04020003.1–04020003.15. [Google Scholar] [CrossRef]
  19. Rullière, A.; Rivard, P.; Peyras, L.; Breul, P. Influence of material strength on the apparent cohesion of unbounded gravity dam joints under low normal stress. J. Geotech. Geoenviron. 2021, 147, 06021012.1–06021012.8. [Google Scholar] [CrossRef]
  20. Tang, Z.C.; Wong, L.N.Y. New criterion for evaluating the peak shear strength of rock joints under different contact states. Rock Mech. Rock Eng. 2016, 49, 1191–1199. [Google Scholar] [CrossRef]
  21. Zhang, X.; Jiang, Q.; Chen, N.; Wei, W.; Feng, X. Laboratory investigation on shear behavior of rock joints and a new peak shear strength criterion. Rock Mech. Rock Eng. 2016, 49, 3495–3512. [Google Scholar] [CrossRef]
  22. Ban, L.; Qi, C.; Chen, H.; Yan, F.; Ji, C. A new criterion for peak shear strength of rock joints with a 3D roughness parameter. Rock Mech. Rock Eng. 2023, 53, 1755–1775. [Google Scholar] [CrossRef]
  23. Yang, J.; Xia, Y.; Chen, W.; Zhang, L.; Li, L. Shear behavior of silty clay–concrete interface based on large-scale direct shear test. Int. J. Geomech. 2023, 23, 04023084. [Google Scholar] [CrossRef]
  24. Lin, H.; Wang, M.; Xu, W.Z. Shear behaviors of the binary structural plane. Geotech. Geol. Eng. 2018, 36, 939–948. [Google Scholar] [CrossRef]
  25. Jiang, Y.; Wang, Y.; Yan, P.; Luan, H.; Chen, Y. Experimental investigation on the shear properties of heterogeneous discontinuities. Geotech. Geol. Eng. 2019, 37, 4959–4968. [Google Scholar] [CrossRef]
  26. Lin, H.; Han, L.; Wang, Y.; Cao, R.; Zhao, Y.; Jiang, C. Influence of the micro-deformation characteristics of binary media on the shear behavior of structural plane. Geotech. Geol. Eng. 2020, 39, 347–358. [Google Scholar] [CrossRef]
  27. Wu, Q.; Jiang, Y.; Tang, H.; Luo, H.; Wang, X.; Kang, J.; Zhang, S.; Yi, X.; Fan, L. Experimental and numerical studies on the evolution of shear behaviour and damage of natural discontinuities at the interface between different rock types. Rock Mech. Rock Eng. 2020, 53, 3721–3744. [Google Scholar] [CrossRef]
  28. Ghazvinian, A.H.; Taghichian, A.; Hashemi, M.; Mar’Ashi, S.A. The shear behavior of bedding planes of weakness between two different rock types with high strength difference. Rock Mech. Rock Eng. 2010, 43, 69–87. [Google Scholar] [CrossRef]
  29. Wu, Q.; Xu, Y.; Tang, H.; Fang, K.; Jiang, Y.; Liu, C.; Wang, X. Peak shear strength prediction for discontinuities between two different rock types using neural network approach. Bull. Eng. Geol. Environ. 2019, 78, 2315–2329. [Google Scholar] [CrossRef]
  30. Tang, Z.C.; Zhang, Z.F.; Jiao, Y.Y. Three-dimensional criterion for predicting peak shear strength of matched discontinuities with different joint wall strengths. Rock Mech. Rock Eng. 2021, 54, 3291–3307. [Google Scholar] [CrossRef]
  31. Zhang, X.; Zhu, X.; Yao, C.; Ouyang, S.; Yang, J.; Jiang, Q. Investigation on the shear behavior of rough rock joints prepared by three- dimensional engraving technique. J. Test. Eval. 2022, 50, 1425–1440. [Google Scholar] [CrossRef]
  32. Jiang, Q.; Feng, X.; Gong, Y.; Song, L.; Ran, S.; Cui, J. Reverse modelling of natural rock joints using 3D scanning and 3D printing. Comput. Geotech. 2016, 73, 210–220. [Google Scholar] [CrossRef]
  33. Jaber, J.; Conin, M.; Deck, O.; Moumni, M.; Godard, O.; Kenzari, S. Investigation of the mechanical behavior of 3D printed polyamide-12 joints for reduced scale models of rock mass. Rock Mech. Rock Eng. 2020, 53, 2687–2705. [Google Scholar] [CrossRef]
  34. Li, Y.; Zhang, Y. Quantitative estimation of joint roughness coefficient using statistical parameters. Int. J. Rock Mech. Min. 2015, 77, 27–35. [Google Scholar] [CrossRef]
Figure 1. Apparatus for mortar specimen fabrication. (a) Concrete mixer; (b) triple cast iron mold; and (c) vibration table.
Applsci 15 05289 g001
Figure 2. HY-6060 stone mold engraving machine.
Applsci 15 05289 g002
Figure 3. Comparison of sampling image, carving morphology and Barton joint profiles with JRC of (a) 2.8, (b) 10.8 and (c) 18.7.
Applsci 15 05289 g003
Figure 4. Joint specimens before shear tests.
Applsci 15 05289 g004
Figure 5. YZW50 electro-hydraulic servo shear test system. (a) Overall view of the apparatus; (b) the local view of shear box.
Applsci 15 05289 g005
Figure 6. Shear curves of rough discontinuities. (a) GCR1; (b) SCR1; (c) GCR2; (d) SCR2; (e) GCR3; and (f) SCR3.
Applsci 15 05289 g006
Figure 7. Failure characteristics of specimen SCR1 under normal stress of (a) 0.5MPa, (b) 3MPa, and specimen GCR1 under normal stress of (c) 0.5MPa, (d) 3MPa, and (e) sketch map for illustrating the failure mechanism of discontinuities possessing different joint wall strengths with JRC of 2.8.
Applsci 15 05289 g007
Figure 8. Failure characteristics of specimen SCR2 under normal stress of (a) 0.5 MPa, (b) 3.0 MPa, and specimen GCR2 under normal stress of (c) 0.5 MPa, (d) 3.0 MPa, and (e) sketch map for illustrating the failure mechanism of discontinuities possessing different joint wall compressive strengths with JRC of 10.8.
Applsci 15 05289 g008
Figure 9. Failure characteristics of specimen SCR3 under normal stress of (a) 0.5 MPa, (b) 3.0 MPa, and specimen GCR3 under normal stress of (c) 0.5 MPa, (d) 3.0 MPa, and (e) sketch map for illustrating the failure mechanism of discontinuities possessing different joint wall compressive strengths with JRC of 18.7.
Applsci 15 05289 g009
Figure 10. Shear failure process of rough discontinuities possessing different joint wall strengths. (a) Stage of tight matching; (b) stage of climbing wear of soft rock and crack formation of hard rock; (c) stage of partial shear of soft rock and crack propagation of hard rock; (d) stage of entire cutting of asperities; (e) sketch map of the shearing process.
Applsci 15 05289 g010
Figure 11. Numerical model of discontinuities possessing different joint wall strengths. (a) Two-dimensional grid model, and (b) numerical model with boundary conditions.
Applsci 15 05289 g011
Figure 12. Comparison results of numerical curve and test curve of discontinuities possessing different joint wall strengths. (a) GCR1; (b) SCR1; (c) GCR2; (d) SCR2; (e) GCR3; and (f) SCR3.
Applsci 15 05289 g012
Figure 13. Shear stress contours of discontinuities possessing different joint wall strengths with shear displacement of 5 mm. (a) GCR1; (b) GCR2; (c) GCR3; (d) SCR1; (e) SCR2; and (f) SCR3.
Applsci 15 05289 g013aApplsci 15 05289 g013b
Figure 14. Shear dilation curves of discontinuities possessing different joint wall strengths. (a) GCR1; (b) SCR1; (c) GCR2; (d) SCR2; (e) GCR3; and (f) SCR3.
Applsci 15 05289 g014
Figure 15. Shear curves of GGR2, GCR2 and CCR2 under normal stresses are (a) 0.5 MPa, (b) 1.0 MPa, (c) 2.0 MPa and (d) 3.0 MPa.
Applsci 15 05289 g015aApplsci 15 05289 g015b
Figure 16. Shear curves of SSR2, SCR2 and CCR2 under normal stresses are (a) 0.5 MPa, (b) 1.0 MPa, (c) 2.0 MPa and (d) 3.0 MPa.
Applsci 15 05289 g016
Figure 17. Dilation curves of GGR2, GCR2 and CCR2 under normal stresses are (a) 0.5 MPa, (b) 1.0 MPa (c) 2.0 MPa and (d) 3.0 MPa.
Applsci 15 05289 g017
Figure 18. Dilation curves of SSR2, SCR2 and CCR2 under normal stresses are (a) 0.5 MPa, (b) 1.0 MPa, (c) 2.0 MPa and (d) 3.0 MPa.
Applsci 15 05289 g018aApplsci 15 05289 g018b
Table 1. Physical and mechanical properties of materials used for making joint specimens.
PropertyCement MortarSandstoneGranite
Density ρ (g/cm3)2.102.432.80
Uniaxial compression strength UCS (MPa)32.6095.56261.55
Tensile strength σt (MPa)1.802.136.48
Cohesion c (MPa)7.0012.0023.00
Basic friction angle Φb (°)31.5029.5035.00
Young’s module E (GPa)22.3218.8457.91
Poisson’s ratio ν0.300.280.22
Table 2. Mechanical properties of joints.
Numerical
Parameters
a n e n a s e s RØim (°)Ø (°)
SCR10.8150.7380.5740.8320.000832.53030.270
SCR20.9320.7960.8650.8940.002345.28030.270
SCR31.3480.9511.0970.8750.004746.84030.270
GCR10.9460.8030.6811.0730.000833.19033.490
GCR21.2450.9921.1570.9260.002343.45033.490
GCR31.5781.1791.4370.8410.004744.62033.490
Table 3. Dilation displacement of discontinuities possessing different joint wall strengths (mm).
σn (MPa)SCR1SCR2SCR3GCR1GCR2GCR3
0.50.1070.4190.2440.0830.3970.243
10.0820.3910.2170.0600.3670.211
20.0680.3530.2040.0560.3380.196
30.0530.3170.1770.0510.2890.147
Table 4. Dilation values of rock–rock discontinuities and rock–mortar discontinuities (mm).
Normal Stress (MPa)The Identifier of Specimens
SSR2SCR2CCR2GCR2GGR2
0.50.4680.4190.3980.3970.506
10.4180.3910.3550.3670.471
20.3760.3530.3110.3380.398
30.3370.3170.2650.2890.362
Disclaimer/Publisher’s Note: The statements, opinions and data contained in all publications are solely those of the individual author(s) and contributor(s) and not of MDPI and/or the editor(s). MDPI and/or the editor(s) disclaim responsibility for any injury to people or property resulting from any ideas, methods, instructions or products referred to in the content.

