Article

Statistical Analysis of Soil Parameters Affecting the Bearing Capacity and Settlement Behaviour of Gravel Soils

by
Ayşe Bengü Sünbül Güner
1,* and
Ercan Özgan
2
1
Civil Engineering Department, Engineering Faculty, Düzce University, 81620 Düzce, Türkiye
2
Architecture Department, Art, Design and Architecture Faculty, Düzce University, 81620 Düzce, Türkiye
*
Author to whom correspondence should be addressed.
Appl. Sci. 2025, 15(10), 5271; https://doi.org/10.3390/app15105271
Submission received: 26 March 2025 / Revised: 23 April 2025 / Accepted: 29 April 2025 / Published: 9 May 2025
(This article belongs to the Section Civil Engineering)

Abstract

:
Understanding the geotechnical behavior of soils is fundamental for the safe design and performance of engineering structures. This study investigates the bearing capacity and settlement behavior of gravel soils using extensive field and laboratory data collected from 27 boreholes in Düzce, northwest Türkiye. Key soil parameters, including excavation depth, groundwater levels, unit weight, water content, particle size distribution, internal friction angles, and cohesion coefficients, were analyzed. Correlation analysis revealed a significant relationship between bearing capacity and the No. 200 sieve value, while relationships with other parameters were less pronounced. Predictive models for bearing capacity and settlement were developed using multiple linear regression, quadratic, and cubic models. The cubic model demonstrated the highest accuracy, predicting bearing capacity with an R2 of 0.79 and settlement with an R2 of 0.904. These results underscore the potential of advanced statistical models to reliably estimate geotechnical properties based on measurable soil parameters. The findings emphasize the importance of combining field and laboratory analyses with robust statistical approaches to accurately predict soil behavior. This methodology provides a foundation for improving geotechnical design practices and may be extended to other soil types and regions, thereby enhancing the reliability and efficiency of soil parameter estimation for engineering applications.

1. Introduction

Geotechnical design begins with a thorough understanding of the soil properties and characteristic profiles of the project site, as these parameters are critical for ensuring the stability and safety of engineering structures [1]. These soil properties are identified through a combination of on-site testing and laboratory analyses conducted in soil mechanics laboratories [2,3,4]. Based on the derived results, the foundation model and its dimensions are rigorously designed to ensure alignment with the soil’s mechanical properties and load-bearing capacity, thereby optimizing structural stability and performance under anticipated loading conditions [5]. The foundation, as the interface between the structure and the ground, bears the responsibility of transferring all structural loads, including the weight of the structure itself, to the underlying soil [6]. For safe and effective performance, the ground must possess adequate capacity to sustain these loads without failure [7]. Additionally, the resulting settlements must remain within permissible limits to prevent structural damage [8]. When loads are applied, the soil layers experience compression, settlement, and stress distribution [9]. The soil’s resistance to these forces is governed by its bearing capacity and shear strength parameters [10]. If the shear stresses induced by foundation loads exceed the soil’s shear strength, a bearing capacity failure occurs [11]. Thus, understanding and evaluating the soil’s pressure and shear strength properties are fundamental to ensuring the stability and safety of the foundation and the entire structure it supports [12,13]. The shear strength of soil represents the maximum shear stress that a soil mass can withstand before failure. In cohesionless soils, shear strength primarily depends on the internal friction angle or interparticle locking, as cohesion is negligible (c = 0) and does not influence the bearing capacity calculations [14]. Under applied loads, soil layers undergo both instantaneous deformation and time-dependent consolidation, resulting in progressive settlement and structural adjustments [15]. While soil grains, composed of hard minerals, exhibit minimal compressibility, the compressibility of water in saturated soils is also negligible [16]. Consequently, settlements in water-saturated soils are predominantly driven by the dissipation of pore water under applied loads. For robust foundation design, it is critical to accurately quantify and model the settlement response of the supporting soil layers [17]. In cohesionless soils, the extraction of undisturbed samples is practically infeasible; hence, their geotechnical properties are predominantly assessed through in situ testing methodologies [18]. The stratigraphic profile of the soil is characterized through site-specific borehole investigations, during which both disturbed and undisturbed samples are retrieved for comprehensive laboratory analyses [19]. The Standard Penetration Test (SPT) is the most widely utilized and cost-effective field test in many regions. Meyerhof proposed equations for estimating safe bearing capacities based on SPT results, corresponding to a maximum settlement of 25 mm (2.5 cm) [20,21]. Parameters derived from SPT analysis are used to calculate an experimental–numerical framework for assessing the load-bearing capacities in scientific research [22,23]. Some researchers established methodologies for estimating bearing capacity based on SPT data for sandy soil foundations [24,25,26,27,28]. The engineering classification of soil enables engineers to generally estimate the type of soil and the range of its mechanical properties [29,30,31]. Groups of various soil types with comparable mechanical characteristics and load behaviour can be created by classifying them based on predetermined rules [32]. These classifications also facilitate the development of empirical relationships for quick and practical settlement estimations during preliminary design phases [33,34]. The mechanisms governing collapse and consolidation differ significantly depending on soil type. For sandy and gravel soils, the collection of undisturbed samples poses substantial challenges, as their granular structure is easily disturbed during sampling [35]. Moreover, gravel soils present additional difficulties due to their large particle sizes, which necessitate the use of specialized equipment, such as oversized consolidometers, to ensure accurate testing [36]. As a result, the consolidation properties of sandy and gravel soils are often estimated using empirical correlations or in situ testing methods, such as the Standard Penetration Test (SPT) or Cone Penetration Test (CPT) [37,38,39]. Foundational work in this field, such as by Burmister, has provided critical empirical data for these estimations [40,41]. Sandy and gravelly soils, characterized by low compressibility and high hydraulic conductivity, drain excess pore water rapidly, resulting in fast consolidation [42]. However, in specific cases, significant and irregular settlements in coarse-grained soils can occur, warranting meticulous evaluation [43]. In contrast, the largest consolidation settlements are typically observed in soft clay soils. For coarse-grained soils, empirical methods or in situ testing are preferred for estimating compressibility [44].
Gravel soils are commonly found in various regions of Türkiye, particularly in the Aegean and Mediterranean regions. These soils are characterized by their high proportion of coarse particles, typically ranging from 2 mm to 60 mm in size. Gravel soils are known for their permeability, which allows for rapid drainage and can make them suitable for various construction applications. However, the strength and deformation characteristics of gravel soils can vary significantly depending on factors such as particle size distribution, compaction, moisture content, and the presence of fines. Researchers have used a variety of methods to assess the bearing capacity of gravel soils, including field tests such as Standard Penetration Tests (SPTs) and Cone Penetration Tests (CPTs), as well as laboratory tests such as triaxial testing and direct shear testing. These tests have provided valuable data on the strength properties of gravel soils and have helped engineers better understand how these soils behave under different loading conditions. In addition to strength characteristics, the deformation capacity of gravel soils is also an important factor to consider in geotechnical engineering. Deformation capacity refers to the ability of the soil to deform and consolidate under applied loads without undergoing excessive settlement or deformation. Cetin et al. focused on the geotechnical properties of gravel soils in the Çankırı region of Türkiye. They conducted laboratory tests to determine the shear strength parameters of the gravel soils, including the cohesion and angle of internal friction. They found that the gravel soils exhibited moderate to high shear strength values, making them suitable for use in construction projects [45]. Kesimal et al. investigated the bearing capacity of gravel soils in the Mediterranean region of Türkiye. They conducted plate load tests to determine the ultimate bearing capacity of the gravel soils under different loading conditions. They found that the gravel soils exhibited good bearing capacity values, indicating their suitability for supporting heavy structures [46]. Dündar et al. focused on the deformation characteristics of gravel soils in the Black Sea region of Türkiye. They conducted oedometer tests to determine the compression and consolidation behaviour of the gravel soils under different stress levels. They found that the gravel soils exhibited good deformation capacity, with low compressibility and settlement values [47].
The bearing capacity of gravel soils in Türkiye was investigated through laboratory testing and numerical simulations. The results indicated that the bearing capacity of gravel soils could be significantly affected by factors such as particle size distribution, density, and the presence of fines. It was found that increasing the proportion of fines in the soil could lead to a reduction in bearing capacity, while proper compaction and moisture content can improve the strength of the soil [48]. Another study focused on the deformation capacity of gravel soils in Türkiye. They conducted laboratory experiments to investigate the deformation behaviour of gravel soils under different loading conditions. The results showed that gravel soils have a relatively high deformation capacity, which can be attributed to the interlocking of coarse particles and the presence of void spaces within the soil matrix. The researchers also found that the deformation behaviour of gravel soils is influenced by factors such as particle size distribution, moisture content, and compaction. Overall, the strength and deformation capacity of gravel soils in Türkiye can vary depending on various factors. Proper characterization and testing of these soils are essential for ensuring the stability and safety of structures built on them. However, further research is needed to fully understand the behaviour of these soils under different loading conditions and to develop appropriate design guidelines for their use in geotechnical projects [49].
This study focuses on investigating the engineering parameters of soils through extensive field and laboratory tests conducted in Düzce Province, located in the northwestern part of Türkiye. Data obtained from 27 boreholes drilled to various depths were used to analyse the bearing capacity and settlement properties of soils. In the laboratory tests, excavation depth, groundwater levels, unit weight, water content, particle size distribution (No. 10 and No. 200 sieves), internal friction angles, and cohesion coefficients were evaluated. Statistical methods were used to develop predictive models for bearing capacity and settlement, and high accuracy was demonstrated based on soil parameters. The results of this study show that there were strong correlations between soil parameters and geotechnical properties. Using Regression methods, a cubic predictive model predicted bearing capacity with R2 = 0.79, while a quadratic model predicted settlement with R2 = 0.90. Validation at 95% confidence interval confirmed the reliability of these models. These findings highlight the potential of statistically validated models as robust tools for predicting soil behaviour based on field and laboratory test results.

2. Materials and Methods

The study area, Düzce Basin, is an intermountain basin located in the Western Black Sea Region. Düzce Province is located between 40°37′ and 41°07′ north latitudes and 30°49′ and 31°50′ east longitudes, as seen in Figure 1, and covers an area of approximately 2593 km2.
The southern border of the basin is determined by the Düzce Fault, with Efteni Lake in the west and Bolu Mountain in the east. While the northern part of the study area is characterized by a sloping terrain structure, the plain has a generally flat topography. Geological studies including drilling studies, geophysical data and field observations show that the plain is mainly composed of Pliocene–Quaternary alluvial fan deposits (Qal). The oldest geological unit in the region is the Precambrian Meta granitoids (PEy) located in the southwest of the Düzce plain [51]. The Düzce Fault forms the boundary between these old units and the Quaternary sediments consisting of clastic materials such as gravel, sand, silt, and clay [49,52]. The thickness of these sediments, which mostly accumulate in alluvial and lacustrine environments, was determined by drilling and geophysical data [53,54]. The sedimentary sequence varies between clay, silt, sand, and gravel, reflecting the presence of ancient river beds or lake beds. The northern and north-western parts of the study area, where the slopes are steeper, belong to the Çaycuma Formation (Teç), which consists of limestone, agglomerate, tuffite, marl-level sandstone, siltstone, and claystone alternations [55].
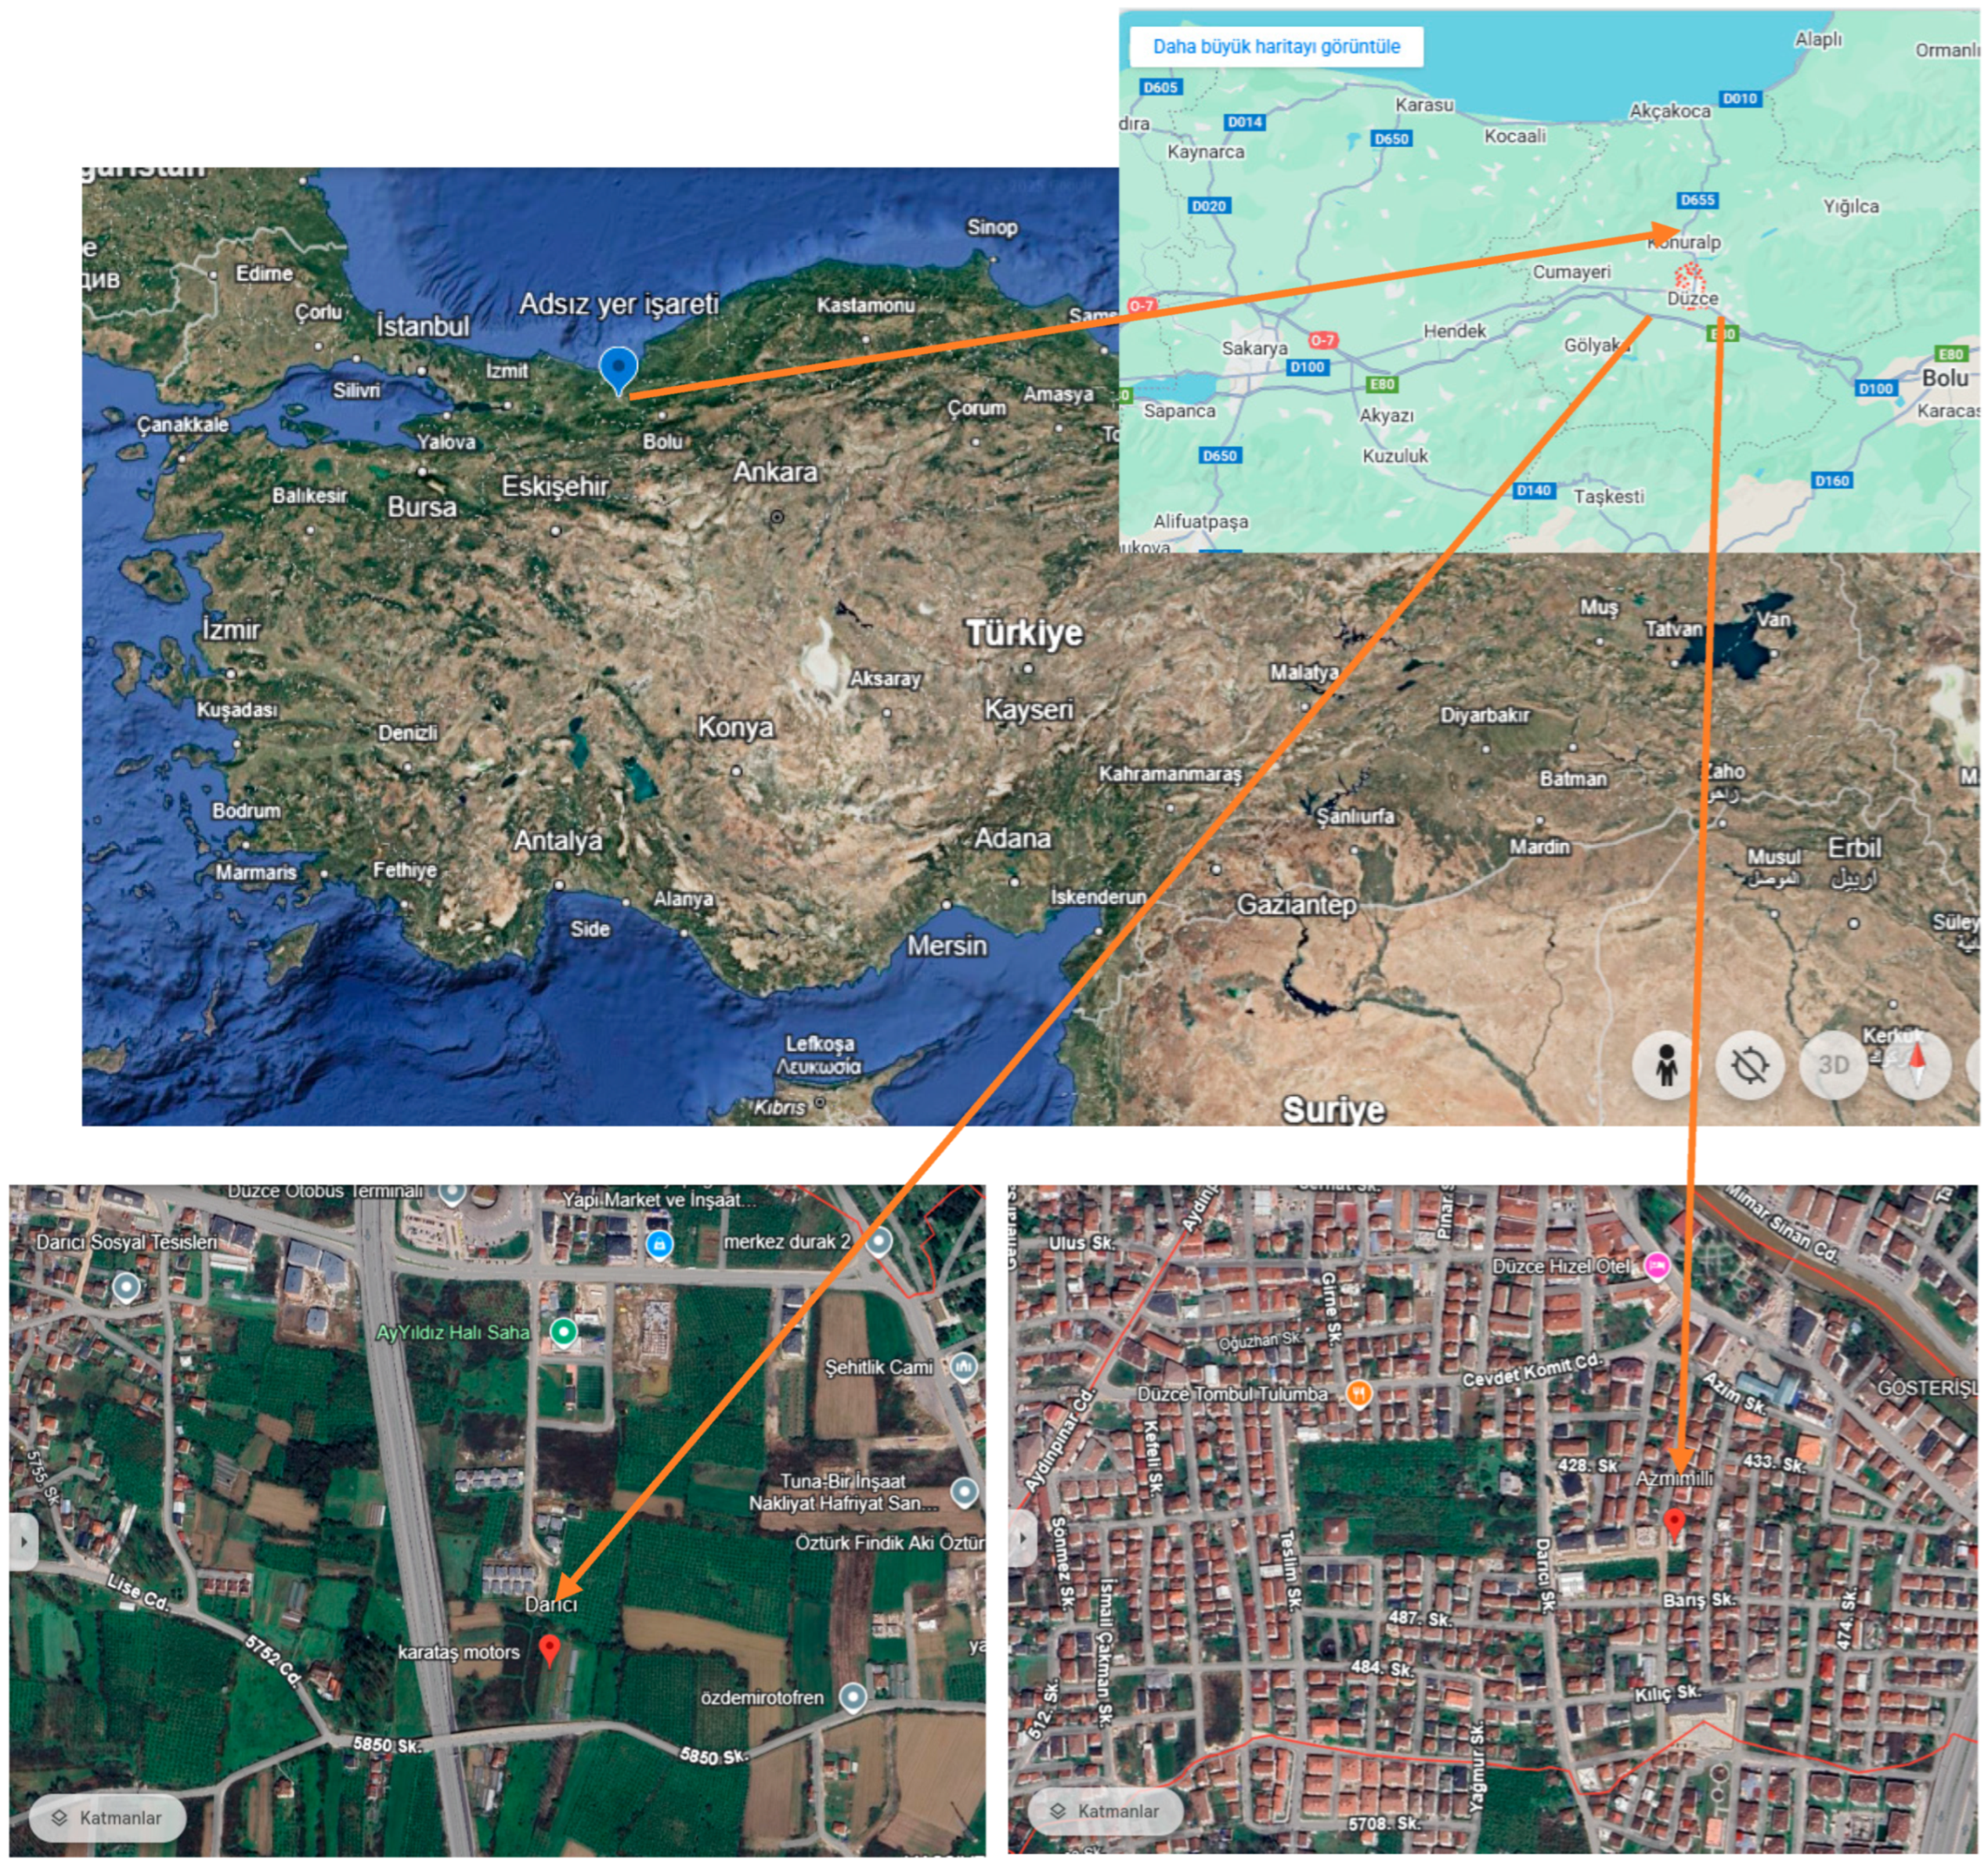
The alluvial structure of the plain, shallow groundwater levels (ranging between 0.10–2.6 m), and associated geotechnical challenges such as liquefaction, subsidence, and limited bearing capacity highlight significant constraints for construction. The Düzce and Bolu regions are seismically highly active because they are located within the North Anatolian Fault Zone (NAFZ), a major strike–slip fault system separating the Eurasian and Anatolian plates [56]. Extending approximately 1200 km, the NAFZ is one of the most critical tectonic structures in Türkiye [57,58]. Numerous historical and instrumental earthquakes have occurred 100 km east and west of Düzce city centre [59]. The closest faults to the Düzce basin are the Düzce Fault, the Hendek Fault, and the Çilimli Fault, and the Düzce and Hendek faults are classified as active, while the Çilimli Fault is considered potentially active [60]. For this study, data obtained from 27 boreholes opened in the Darıca and Azmimilli neighbourhoods of the Düzce city centre were analysed. A map of Türkiye is presented in Figure 2, showing the location of Düzce province and the locations of Darıca and Azmimilli neighbourhoods where the drillings were opened. The drillings are located in two separate neighbourhoods, in different locations. The neighbourhoods where the drillings were opened and the approximate drilling areas are shown in Figure 2. However, for more detailed information, the link is provided “https://www.harita.gen.tr/81-duzce-haritasi/ (accessed on 23 April 2025)” [61].
In this study, soil samples obtained from 27 boreholes opened in Darıca and Azmimilli neighbourhoods in Düzce city centre were analysed. The stratigraphy generally shows light sandy silty clay, silty clayey sand, silty coarse sandy clay, gravel and coarse sand–gravel sequences from top to bottom. A cross-sectional representation of the study area is given in Figure 3.
In cohesive soils, the settlement is largely time-dependent. Since the permeability of fine-grained soils is very low, water is released from the loaded soil very slowly and a time-dependent settlement occurs. A small amount of sudden settlement occurs due to loading. In cohesive soils saturated with water (especially clayey soils), the main settlement is consolidation settlement. Consolidation settlement occurs in two forms, primary and secondary consolidation settlement. In cohesionless (granular) soils, the subsidence consists of sudden subsidence. The subsidence is short-lived. In other words, the subsidence occurs as soon as the load is applied. In such soils, the water in the voids is transferred out in a short time due to the high permeability. Some physical and mechanical properties of the soil affect the bearing capacity and settlement behaviour of gravel soils.
The size and distribution of particles in gravel soils affect the soil’s compressibility and void ratio. Larger particles generally have better bearing capacity, while smaller particles can create more void space for the soil. The water content of gravel soil is an important factor affecting its carrying capacity. Soils in saturated conditions may lose their carrying capacity as water passes through the voids. The shape (regular or irregular) and surface characteristics of gravel grains affect the friction and interlocking between particles in the soil. Grains with smooth and even surfaces may provide less friction. The specific gravity of the particles in the soil also directly affects the soil’s load-carrying capacity. Dense soils generally have higher bearing capacities. The modulus of elasticity of gravel soils is an important parameter in determining soil behaviour and the extent of subsidence. A high modulus of elasticity can mean less subsidence. When gravel soils are compacted, the void ratio decreases and the carrying capacity increases.
Insufficiently compacted soils tend to show more settlement under load. For these reasons, the physical and mechanical properties of gravel soils are critical elements that must be considered for the safe and durable construction of the structure. The correct evaluation of these elements is of great importance during ground survey and design. The bearing capacity of the soil and the amount of settlement that occurs in the soil have been studied by many researchers and various approaches have been presented.
This study was conducted only on gravel soils. Experimental data obtained from 27 boreholes were used in the study. The bearing capacity and settlement amounts of the soil were calculated according to Terzaghi calculation methods according to SPTN30 test results. It was examined with statistical methods whether there was a relationship between the bearing capacity and settlement amounts of this gravel soil obtained with real test results and calculated according to Terzaghi bearing capacity calculation methods and other parameters of the soil, and if there was a relationship, whether it was a positive or a negative relationship. According to the test results of the gravel soil, the bearing capacity and settlement amounts of the soil were estimated depending on other parameters of the soil, and statistical model equations were created for the experimental data obtained as a result of experimental studies in the field. These results are real drilling results and the results obtained from the field were used as they were. The data in this study are not data prepared within the scope of a previously planned and prepared experimental set. They are data belonging to the soil survey reports of newly constructed buildings in Düzce city. All of these results were determined by on-site and laboratory tests.
As a result of the analysis, the physical and engineering properties of the soil, identified as gravel, along with the bearing capacity and settlement parameters, were examined. For this purpose, various soil characteristics were determined, including the depths at which the soil samples were collected, groundwater level depths relative to the ground surface, unit volume weights, water contents, sieve analysis results for sieve No. 10 (2.0 mm) and No. 200 (0.074 mm), internal friction angles, cohesion coefficients, and bearing capacity values. The mechanical and physical properties of the soil in the table are the test results of soil samples taken from 27 boreholes and were taken from the officially prepared Soil Investigation Reports. Descriptive statistical values of the mechanical and physical properties of the soil samples are given in Table 1.
Statistical analyses were performed using IBM-SPSS-Statistics-Version 22 software to evaluate the effects of the investigated soil parameters on the bearing capacity and settlement of the soil [62]. Correlation analyses were performed to determine the parameters that significantly affect the bearing capacity and settlement. Correlation analysis is a statistical method used to measure the strength and direction of the relationship between variables. The correlation coefficient, which varies between −1 and +1, measures the linear relationship between two variables regardless of the measurement units. A coefficient close to 0 indicates a weak relationship, while values approaching +1 or −1 indicate strong positive or negative relationships, respectively. The correlation levels between the parameters are summarized in Table 2.
Multiple linear regression analysis with 95% confidence interval was conducted to estimate the bearing capacity and consolidation behaviour of soil based on the effective parameters identified in the correlation analysis. Multiple linear regression is a statistical technique used to develop a mathematical model that quantifies the effect of multiple independent variables on a single dependent variable, thus allowing the dependent variable to be estimated as a function of the independent variables. Let us assume that y represents the dependent variable and x 1 ,   x 2 ,   x 3 , ,   x n represent the independent variables. The relationship between the dependent and independent variables can be expressed as follows:
Υ = a 0 + a 1 x 1 + a 2 x 2 + + a n x n + e i
where Υ is the dependent variable; a 0 is the constant term of the equation; a 0 , a 1 , …, a n are the coefficients of the independent variables x 1 , x 2 , …, x n ; x 1 , x 2 , …, x n are the independent variables; and e i is the error term, which represents the difference between the observed value and the predicted value ( Υ Υ ^ ). This model allows the dependent variable to be estimated by considering the effect of each independent variable on the bearing capacity and consolidation of the soil [4,63].
This research is a study in which only the test results of gravel soils belonging to 27 drilling data are examined; these test results are statistically analysed, the relationships of bearing capacity and settlement with other parameters of the soil are examined, and mathematical models are created. Estimation of the allowable bearing capacity of granular soil requires an intensive field research program. This research proposes empirical correlations to estimate the allowable bearing capacity and elastic settlement of shallow foundations on granular soils. The existing correlation and estimation of bearing capacity can be obtained by using only standard penetration blow number and soil unit weight. Such correlations can be used in the preliminary stage of estimating the allowable bearing capacity and elastic settlement of shallow foundations on granular soils, and can help field engineers make immediate decisions in case of field changes given in soil reports. Some researchers have studied this issue and adopted various approaches [64,65,66,67,68,69].
For the foundation design of any structure, two important criteria need to be met: one is bearing capacity and other is settlements. Many authors have conducted research on the bearing capacity of soil considering various parameters like cohesion, Maximum Dry Density (MDD), Optimum Moisture Content (OMC), depth and width of foundation, and shear resistance angle by conducting various tests like the Direct Shear Test and standard proctor test. Safe bearing capacity of soil has been calculated using various methods like Terzaghi and IS Code. The effect of foundation shape and size and water table location on ultimate bearing capacity in the case of local shear failure has been studied [70]. Some studies were conducted on various aspects related to displacements. Poisson-final ratio, foundation stiffness, and foundation geometry, etc. have been developed graphically in the case of shallow foundations [71,72,73,74]. Moreover, some studies were made on finite and infinite soil modulus, which increase with soil depth [75,76,77].
Allowable bearing capacity and settlement are the two main criteria that control the design practices of shallow foundations to meet safety and usability requirements. Geotechnical engineers face significant uncertainties in terms of soil variability, time effects, construction effects, human error, and sampling and laboratory test inaccuracies while evaluating the soil. All these factors make the use of experimental correlations preferable to traditional methods because they are practical and less costly than traditional methods. Literature review revealed that experimental correlations are widely used in many applications of geotechnical engineering such as pile capacity estimation, site characterization, modelling of soil behaviour, liquefaction, soil retaining structures, soil penetration resistance, slope stability, design of tunnels and underground openings, collapse of structures, soil compaction, soil permeability and hydraulic conductivity, soil swelling, and others [64,78,79].
Some researchers have presented various theories and studies to estimate the ultimate bearing capacity. Das and Sivakugan [80] reported that the most popular methods for settlement estimation, which are frequently discussed in textbooks, are those proposed by Terzaghi and Peck [24], Schmertmann [81], Schmertmann et al. [82], and Burland and Burbidge [83]. Sivakugan and Johnson [84] proposed a probabilistic approach that quantifies the uncertainties associated with settlement estimation methods. In recent years, some authors such as Shahin et al. [65,85] and Erzin and Gul [86] have used ANN modelling of soil settlement and have shown high success in this field. The aim of this paper is to develop locally calibrated empirical correlations to estimate both the allowable bearing capacity and the elastic settlement of shallow foundations on granular soils.

3. Results

The relationships between the soil parameters obtained from the Official Soil Survey Reports, the bearing capacity of the soil, the settlement values formed in the soil, and the other physical properties of the soil and the importance levels of these relationships were examined. Statistical analyses were performed in order to examine the relationships between the bearing capacity and settlement values of the soil with other parameters and to model them depending on these parameters. The analysis results are given separately for the bearing capacity of the soil and the settlement values formed in the soil.

3.1. Bearing Capacity Analysis Results

The relationship levels and significance between engineering parameters and bearing capacity of soil were analysed using correlation analysis. The results in Table 3 show that there are varying levels of correlation between engineering parameters and the bearing capacity of soil. Notable findings include a moderate positive correlation (ρ = 0.356) between sieve No. 200 and bearing capacity, indicating a potential link between finer soil particles and improved load carrying properties. In addition, a weak negative correlation (ρ = −0.146) was observed between unit weight and bearing capacity, implying that denser soils may not always exhibit higher bearing capacity. Significant correlations were also observed at the 0.05 level for groundwater level and unit weight with sieve No. 10 (ρ = −0.457; ρ = 0.632, respectively), highlighting their influence on soil properties. These findings underline the complex interaction of engineering parameters in determining soil bearing capacity.
Multiple linear regression analysis was performed to develop a prediction model for bearing capacity based on soil parameters. The results including model summary, ANOVA table, and regression coefficients are detailed below. The model yielded a value of 0.460, indicating that about 46% of the variance in bearing capacity was explained by the predictors. However, the adjusted value was negative (−0.979), reflecting overfitting or inclusion of non-contributing variables (Table 4).
The ANOVA analysis reveals a non-significant model 1 (Table 5), indicating that the predictors together do not significantly explain the variability in carrying capacity. This result suggests that the selected predictors may not be robust enough to predict carrying capacity within the current dataset.
The regression coefficients show the relative contributions of individual parameters to the model. Key observations include sieve No. 200 (β = 0.937) showing the highest positive standard beta coefficient, implying a potentially strong relationship with bearing capacity, but which was not statistically significant. The angle of internal friction (β = −3.138) exhibited a negative relationship, which may suggest a complex interaction with other variables affecting soil strength. Cohesion (β = 2.160) showed a positive but insignificant contribution to bearing capacity. These results suggest that further refinement of the regression model is needed, perhaps through feature selection or transformation, to improve the predictive power (Table 6).
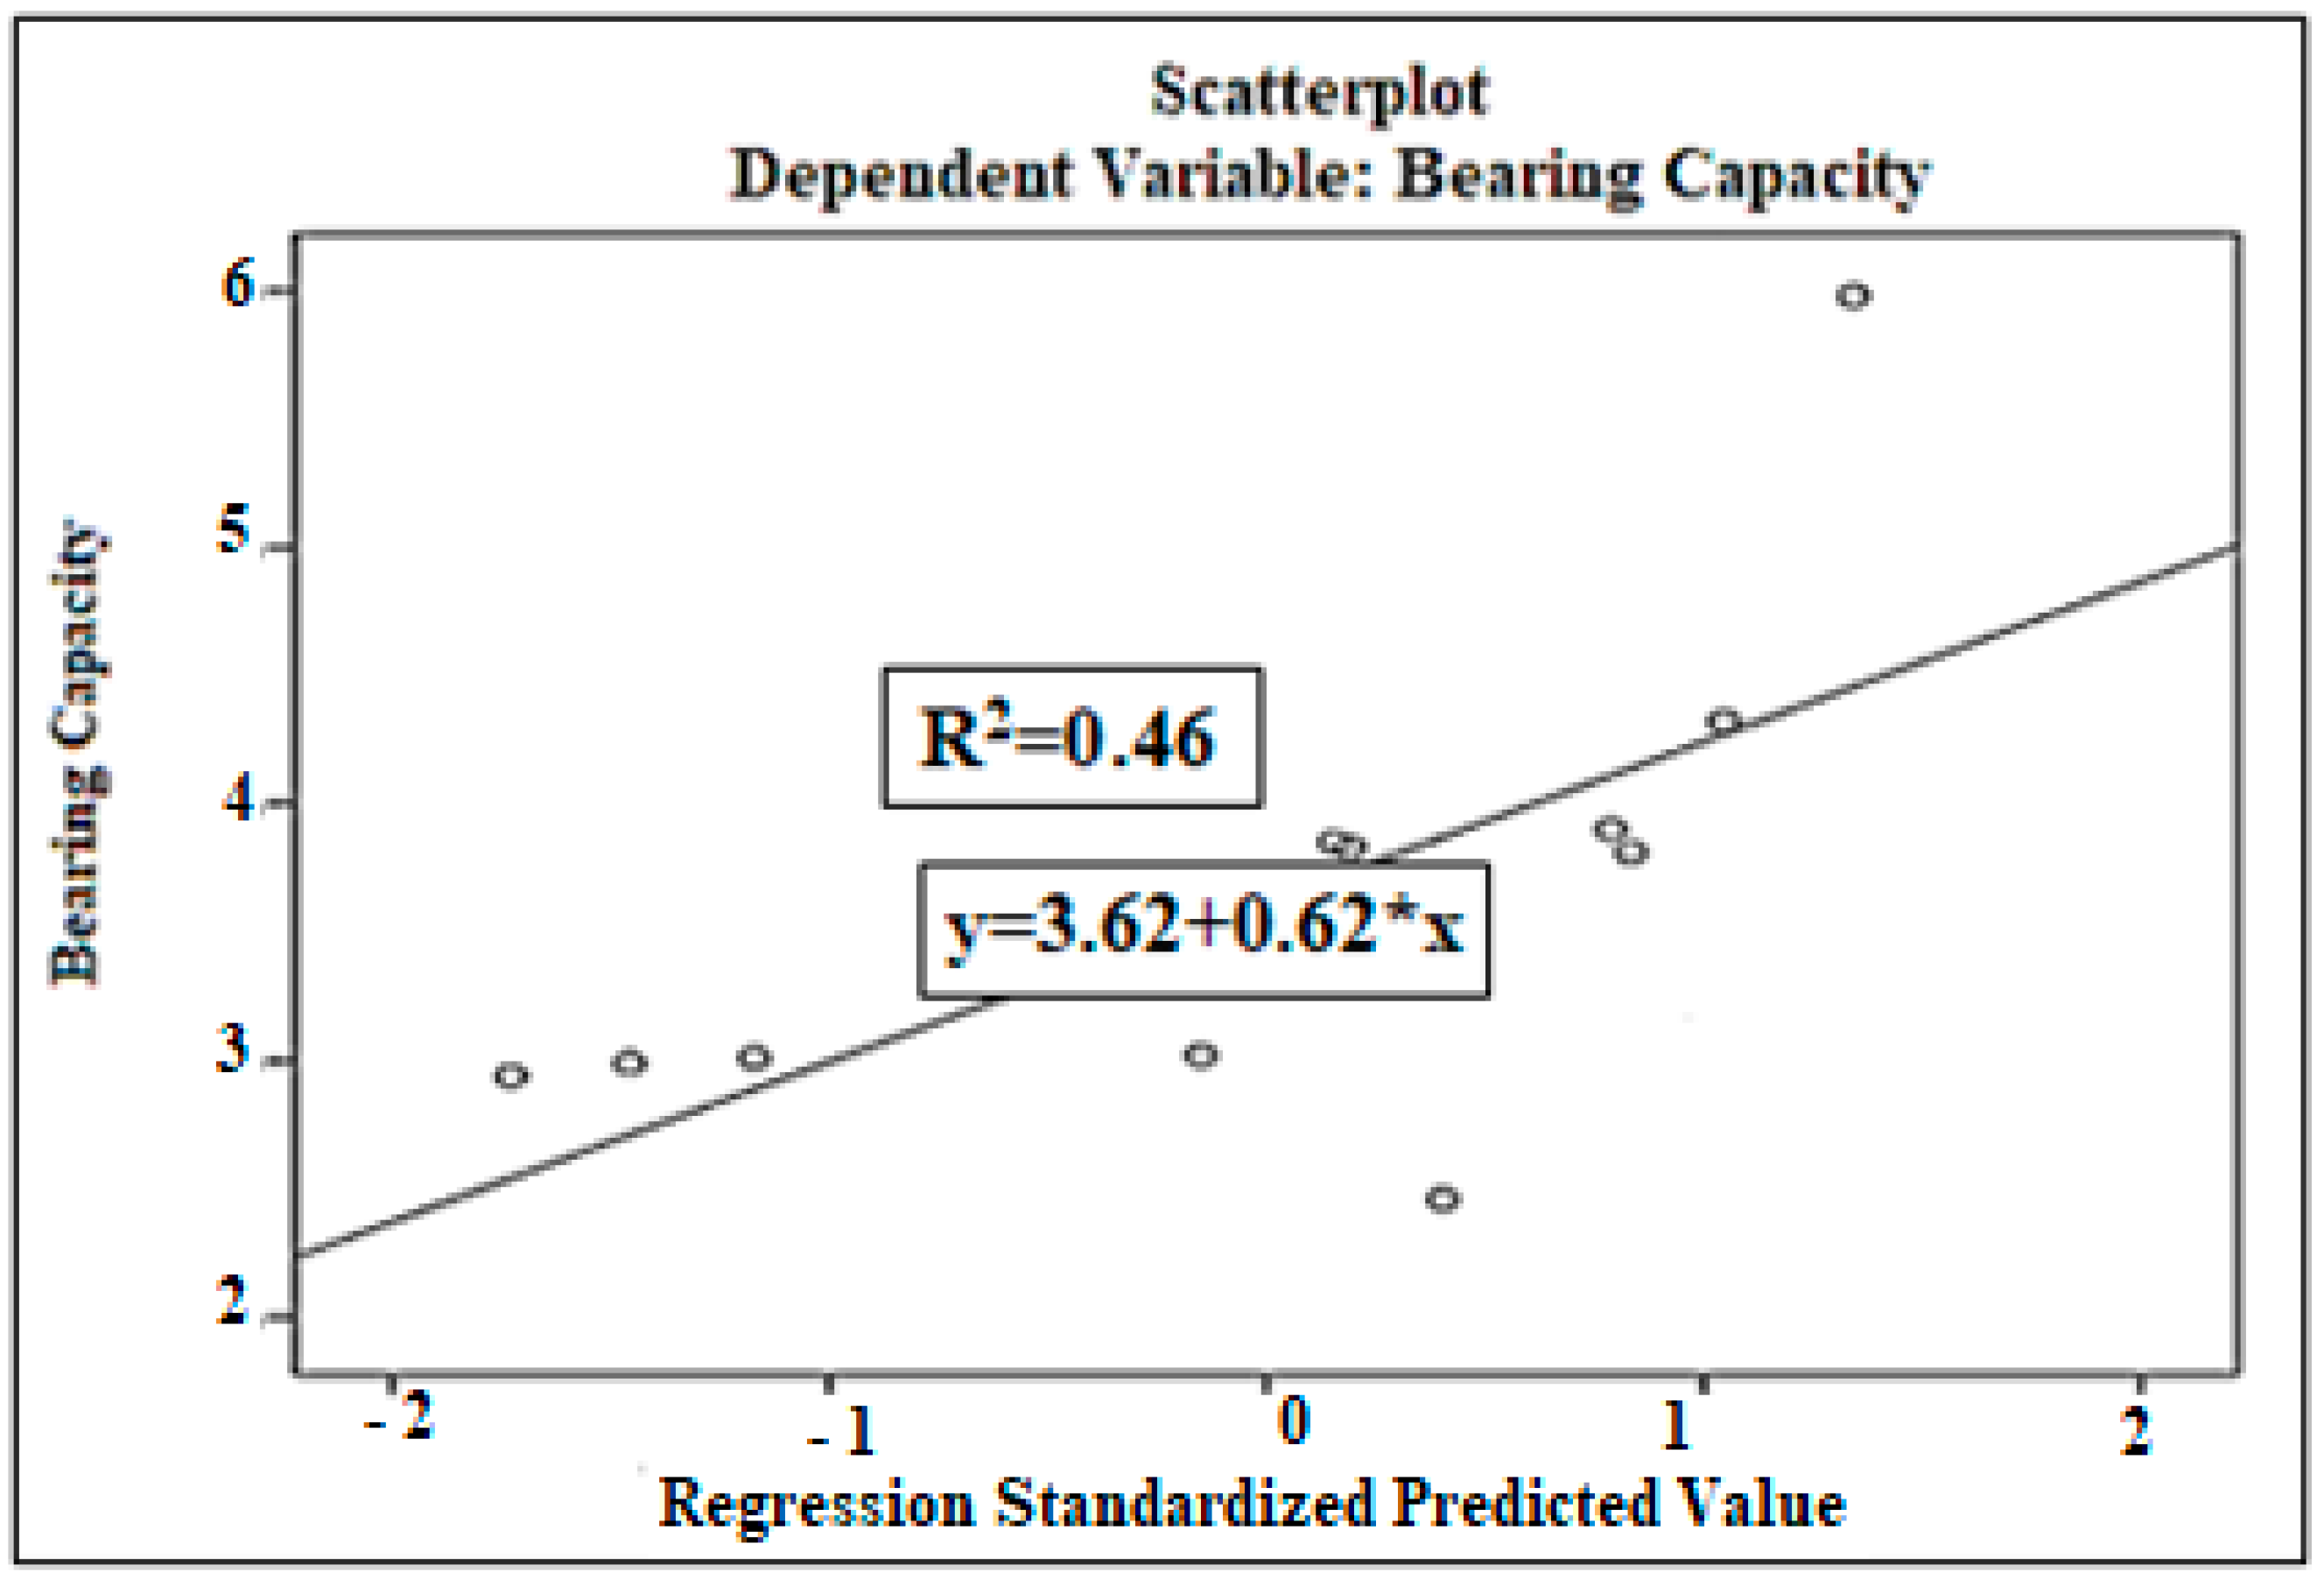
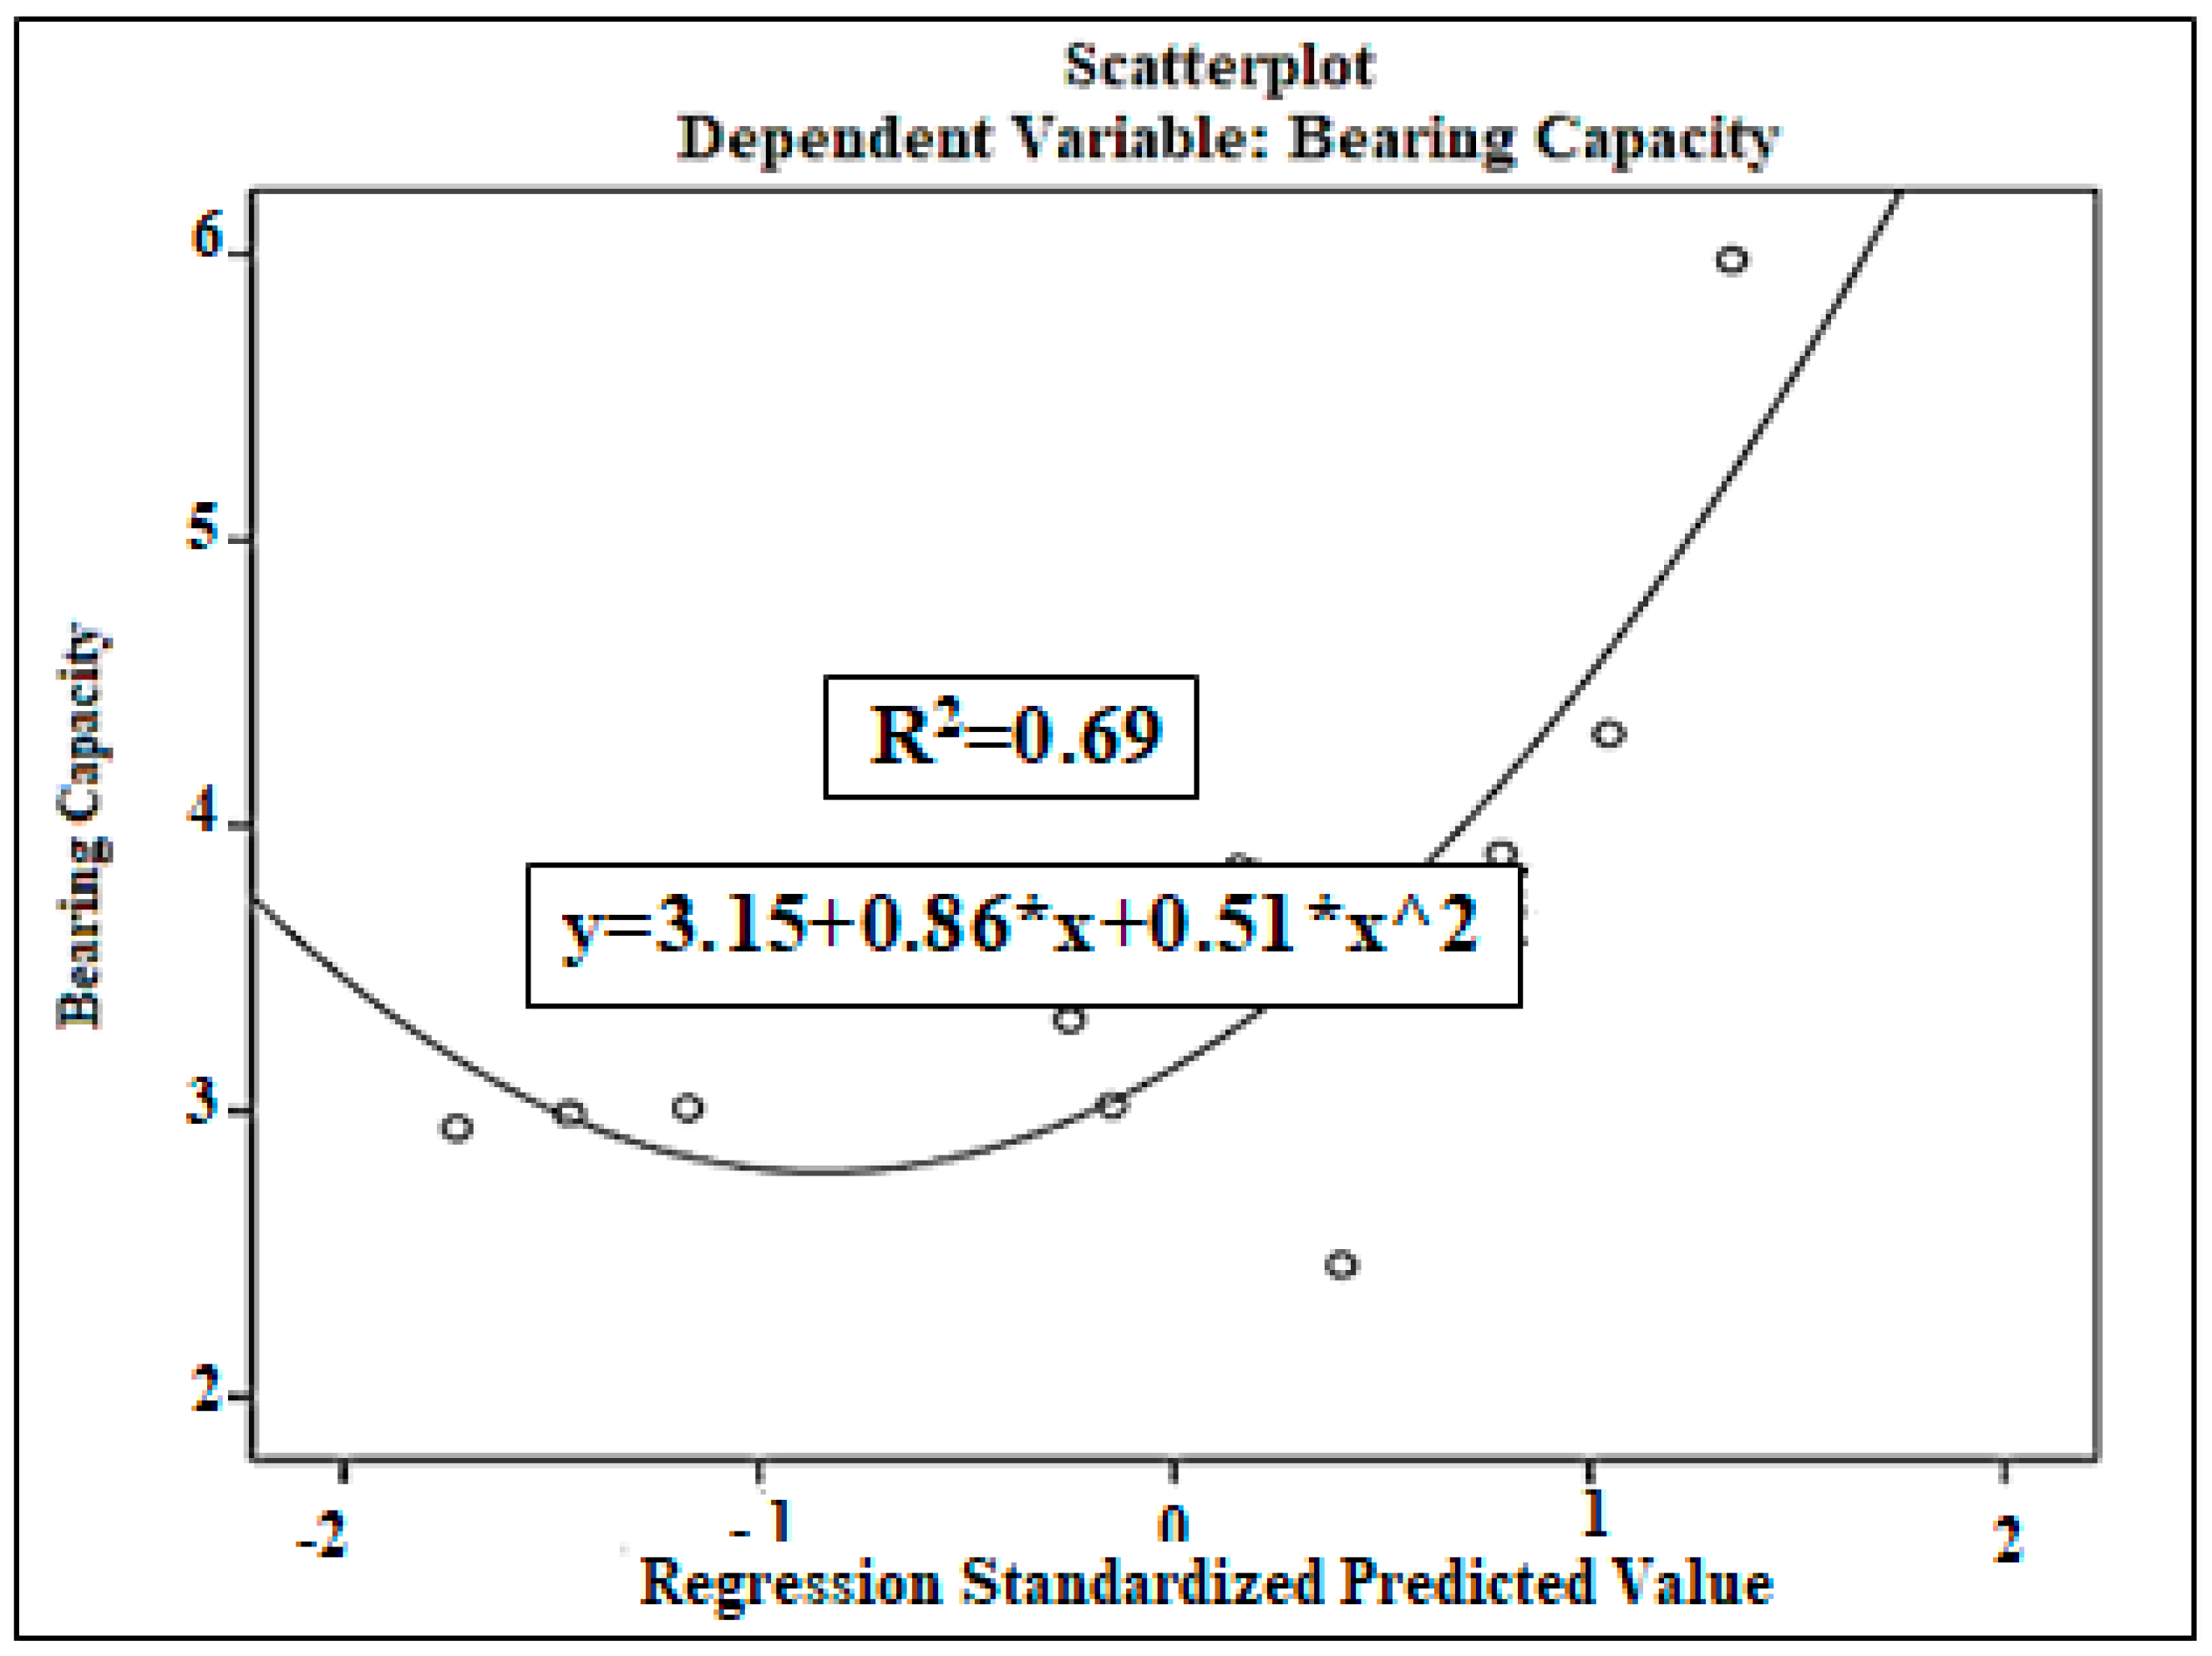
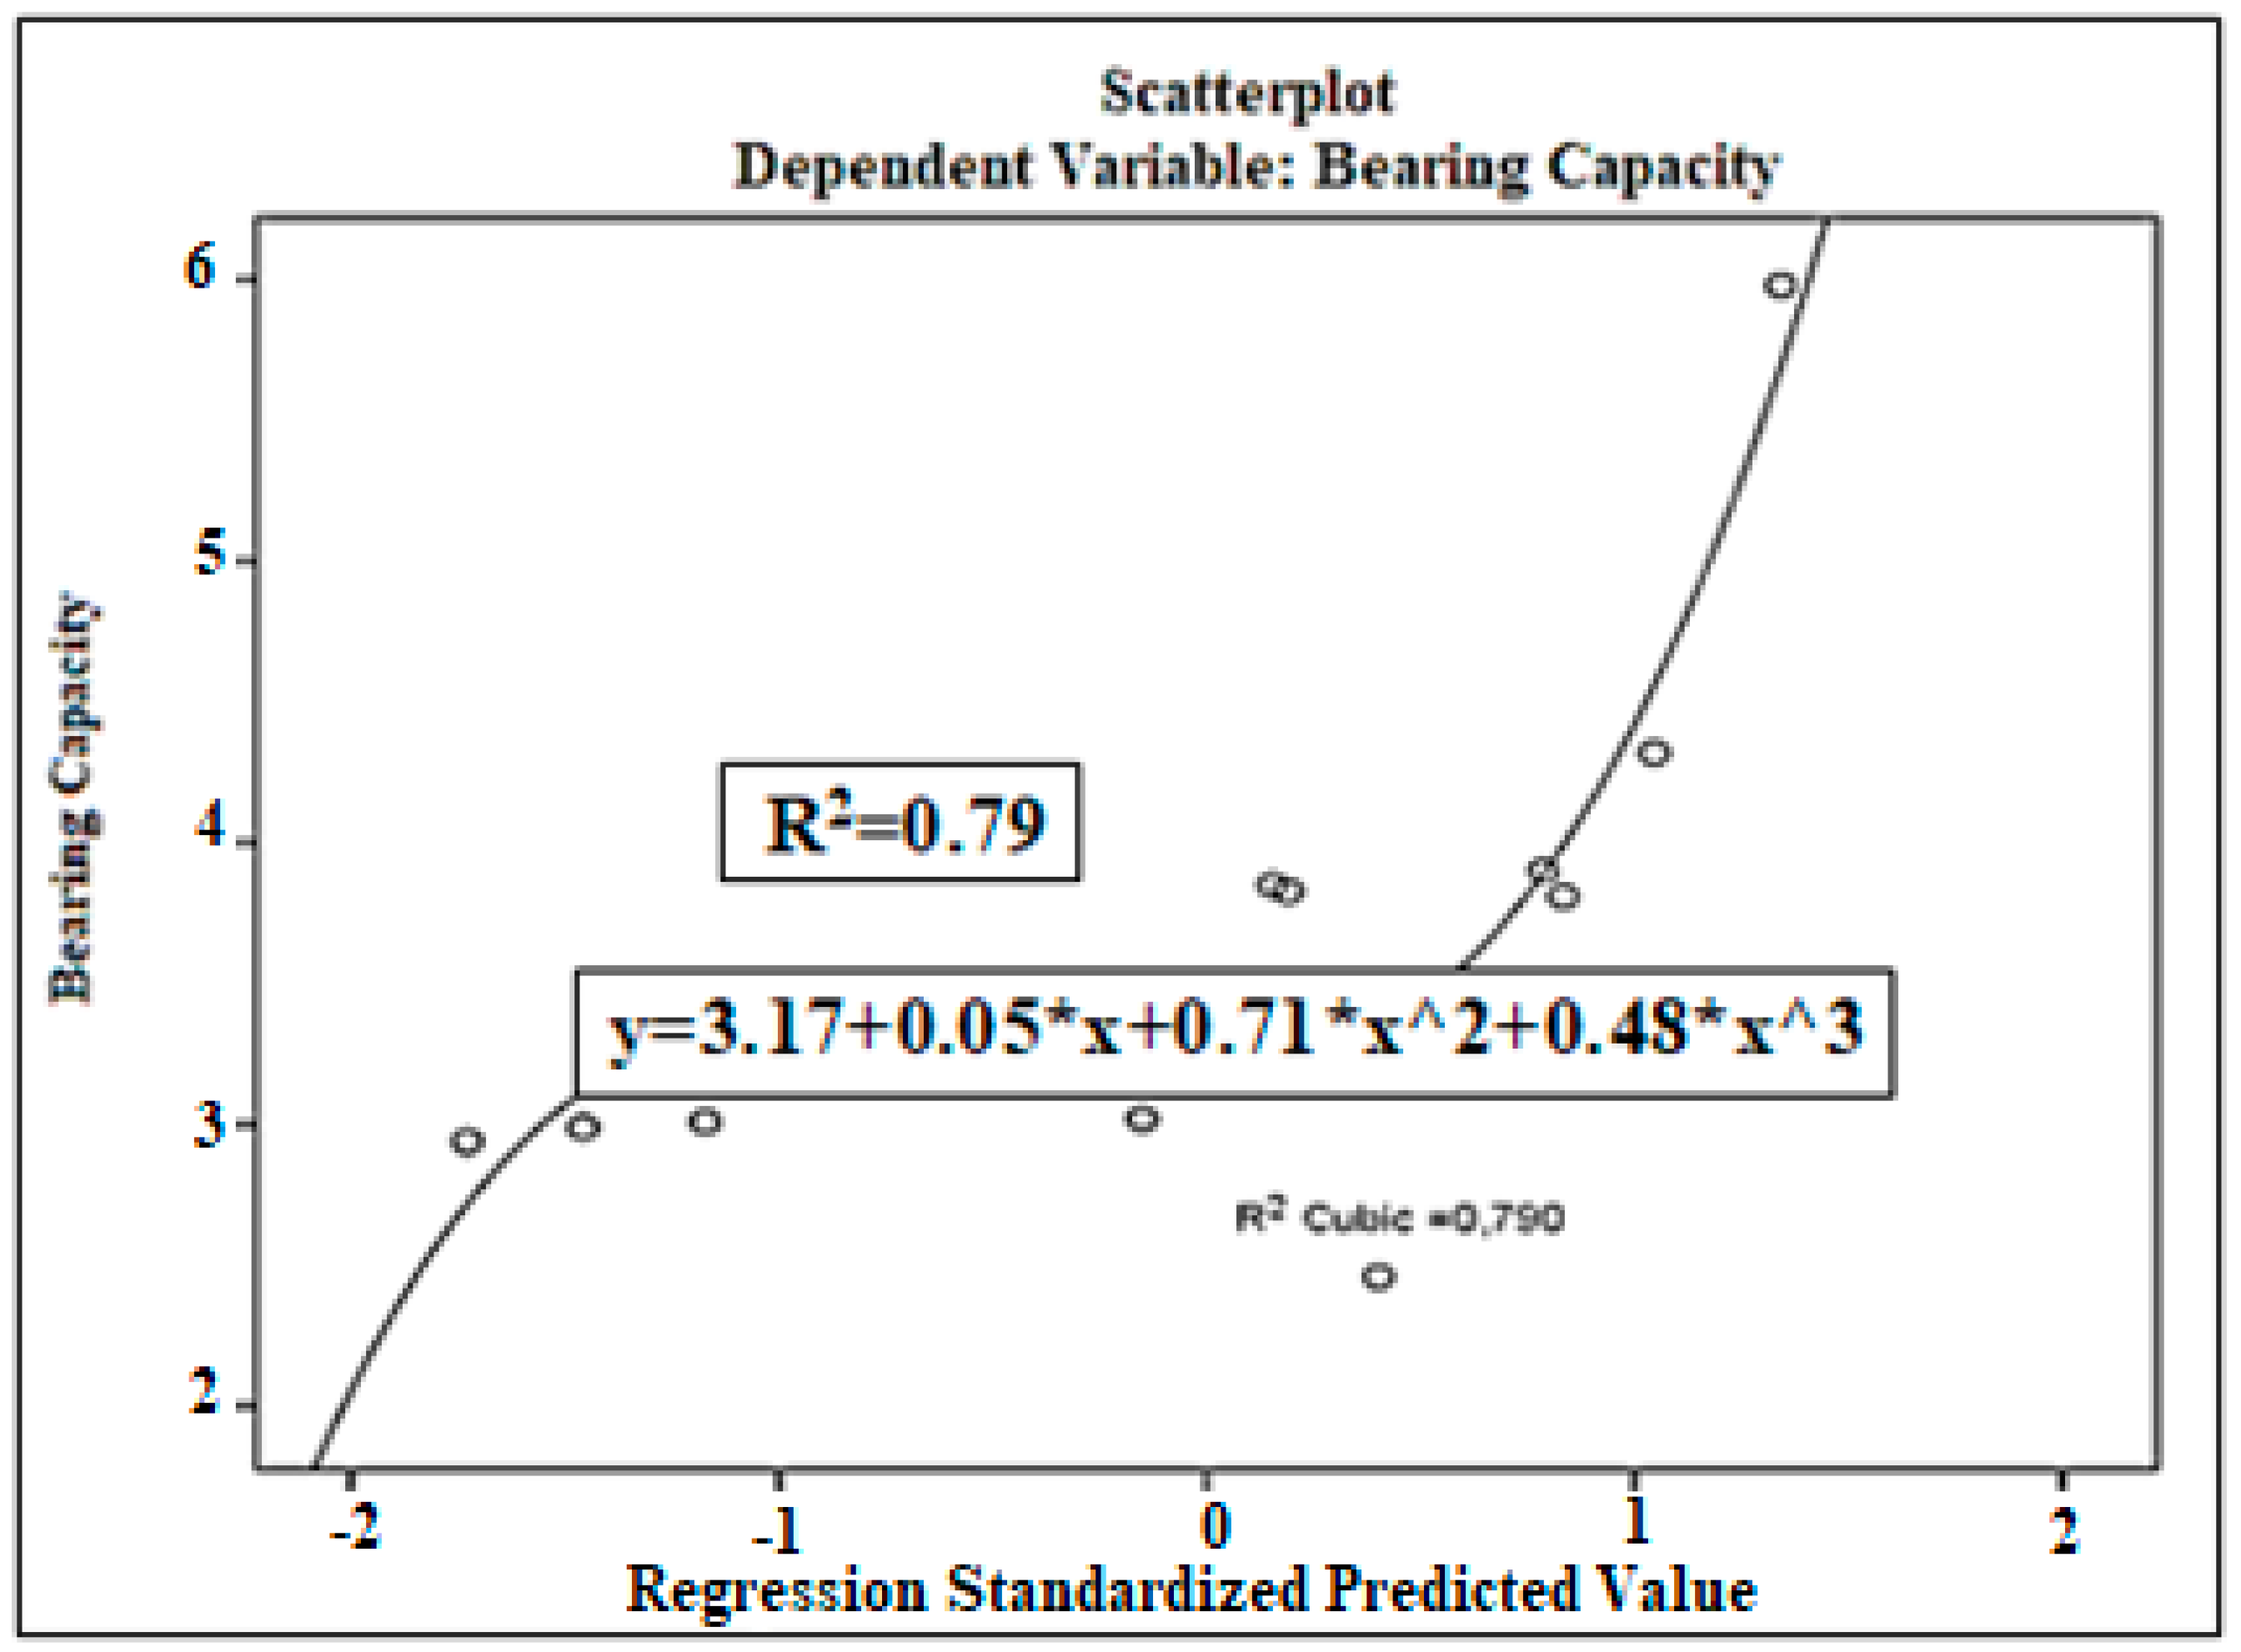
Mathematical prediction models (linear, quadratic, and third order) were applied to evaluate the bearing capacity estimation more comprehensively. Figure 4, Figure 5 and Figure 6 show the actual and estimated bearing capacity values with their respective values. The linear model showed limited accuracy with a value indicating a weak correlation between the estimated and actual bearing capacities. This indicates that a linear approach does not adequately capture the complexity of the data. The quadratic model showed a higher value, showing a better value than the linear model. This improvement highlights the possible non-linear relationships between soil parameters and bearing capacity. The third-order model, which provided the best fit among the three, achieved the highest value. The performance of this model highlights the importance of higher-order relationships in accurately modeling soil bearing capacity. Comparison of these models reveals that the third-order estimation is the most suitable model to capture the interactions between soil parameters. Further investigation with a larger dataset and additional parameters may increase the robustness of these predictive models.

3.2. Consolidation Analysis Results

The relationship between soil parameters and settlement value was evaluated using correlation analysis, and the results presented in Table 7 show that there is a significant negative correlation (ρ = −0.402, p < 0.05) between excavation level and slump, indicating that deeper excavation levels may cause a decrease in slump. In contrast, other parameters such as unit weight, water content and cohesion show weak and insignificant correlations with slump, suggesting that they have limited direct effect under the analysed conditions. Significant correlations at the 0.05 level were determined between groundwater level and sieve No. 10 (ρ = −0.642, p < 0.05) and unit weight and sieve No. 10 (ρ = 0.632, p < 0.05), reflecting their interaction in indirectly affecting soil behaviour. These results reveal the complexity of the consolidation process, where individual parameters may not have a direct effect on settlement but may act together with other factors.
Multiple linear regression analysis was conducted to predict settlement based on soil parameters. The results including model summary, ANOVA results, and regression coefficients are presented in Table 8, Table 9 and Table 10. The regression model showed a high value of 0.846, indicating that 84.6% of the variance in settlement was explained by the predictors. However, the adjusted value of 0.435 indicates possible model overfitting or inclusion of variables with minimal contribution to the settlement prediction.
The ANOVA table shows that the model is not statistically significant (p = 0.299), implying that the combined predictors do not significantly explain the settlement variation in the current dataset. This observation suggests a possible mismatch between the selected parameters and the observed settlement values (Table 9).
The regression coefficients provide insights into the contribution of individual predictors. Notable findings include groundwater level (β = −2.739) and unit weight (β = −2.536), which showed negative standardized beta coefficients and were inversely related to settlement. However, these relationships were not statistically significant. Sieve No. 10 (β = −1.114) also showed a negative effect, consistent with its role in soil structure and compaction. Internal friction angle (β = 19.366) showed the highest positive beta coefficient, but was low in significance (p > 0.05). These results indicate the need for further model refinement, including potential exclusion of non-significant predictors.
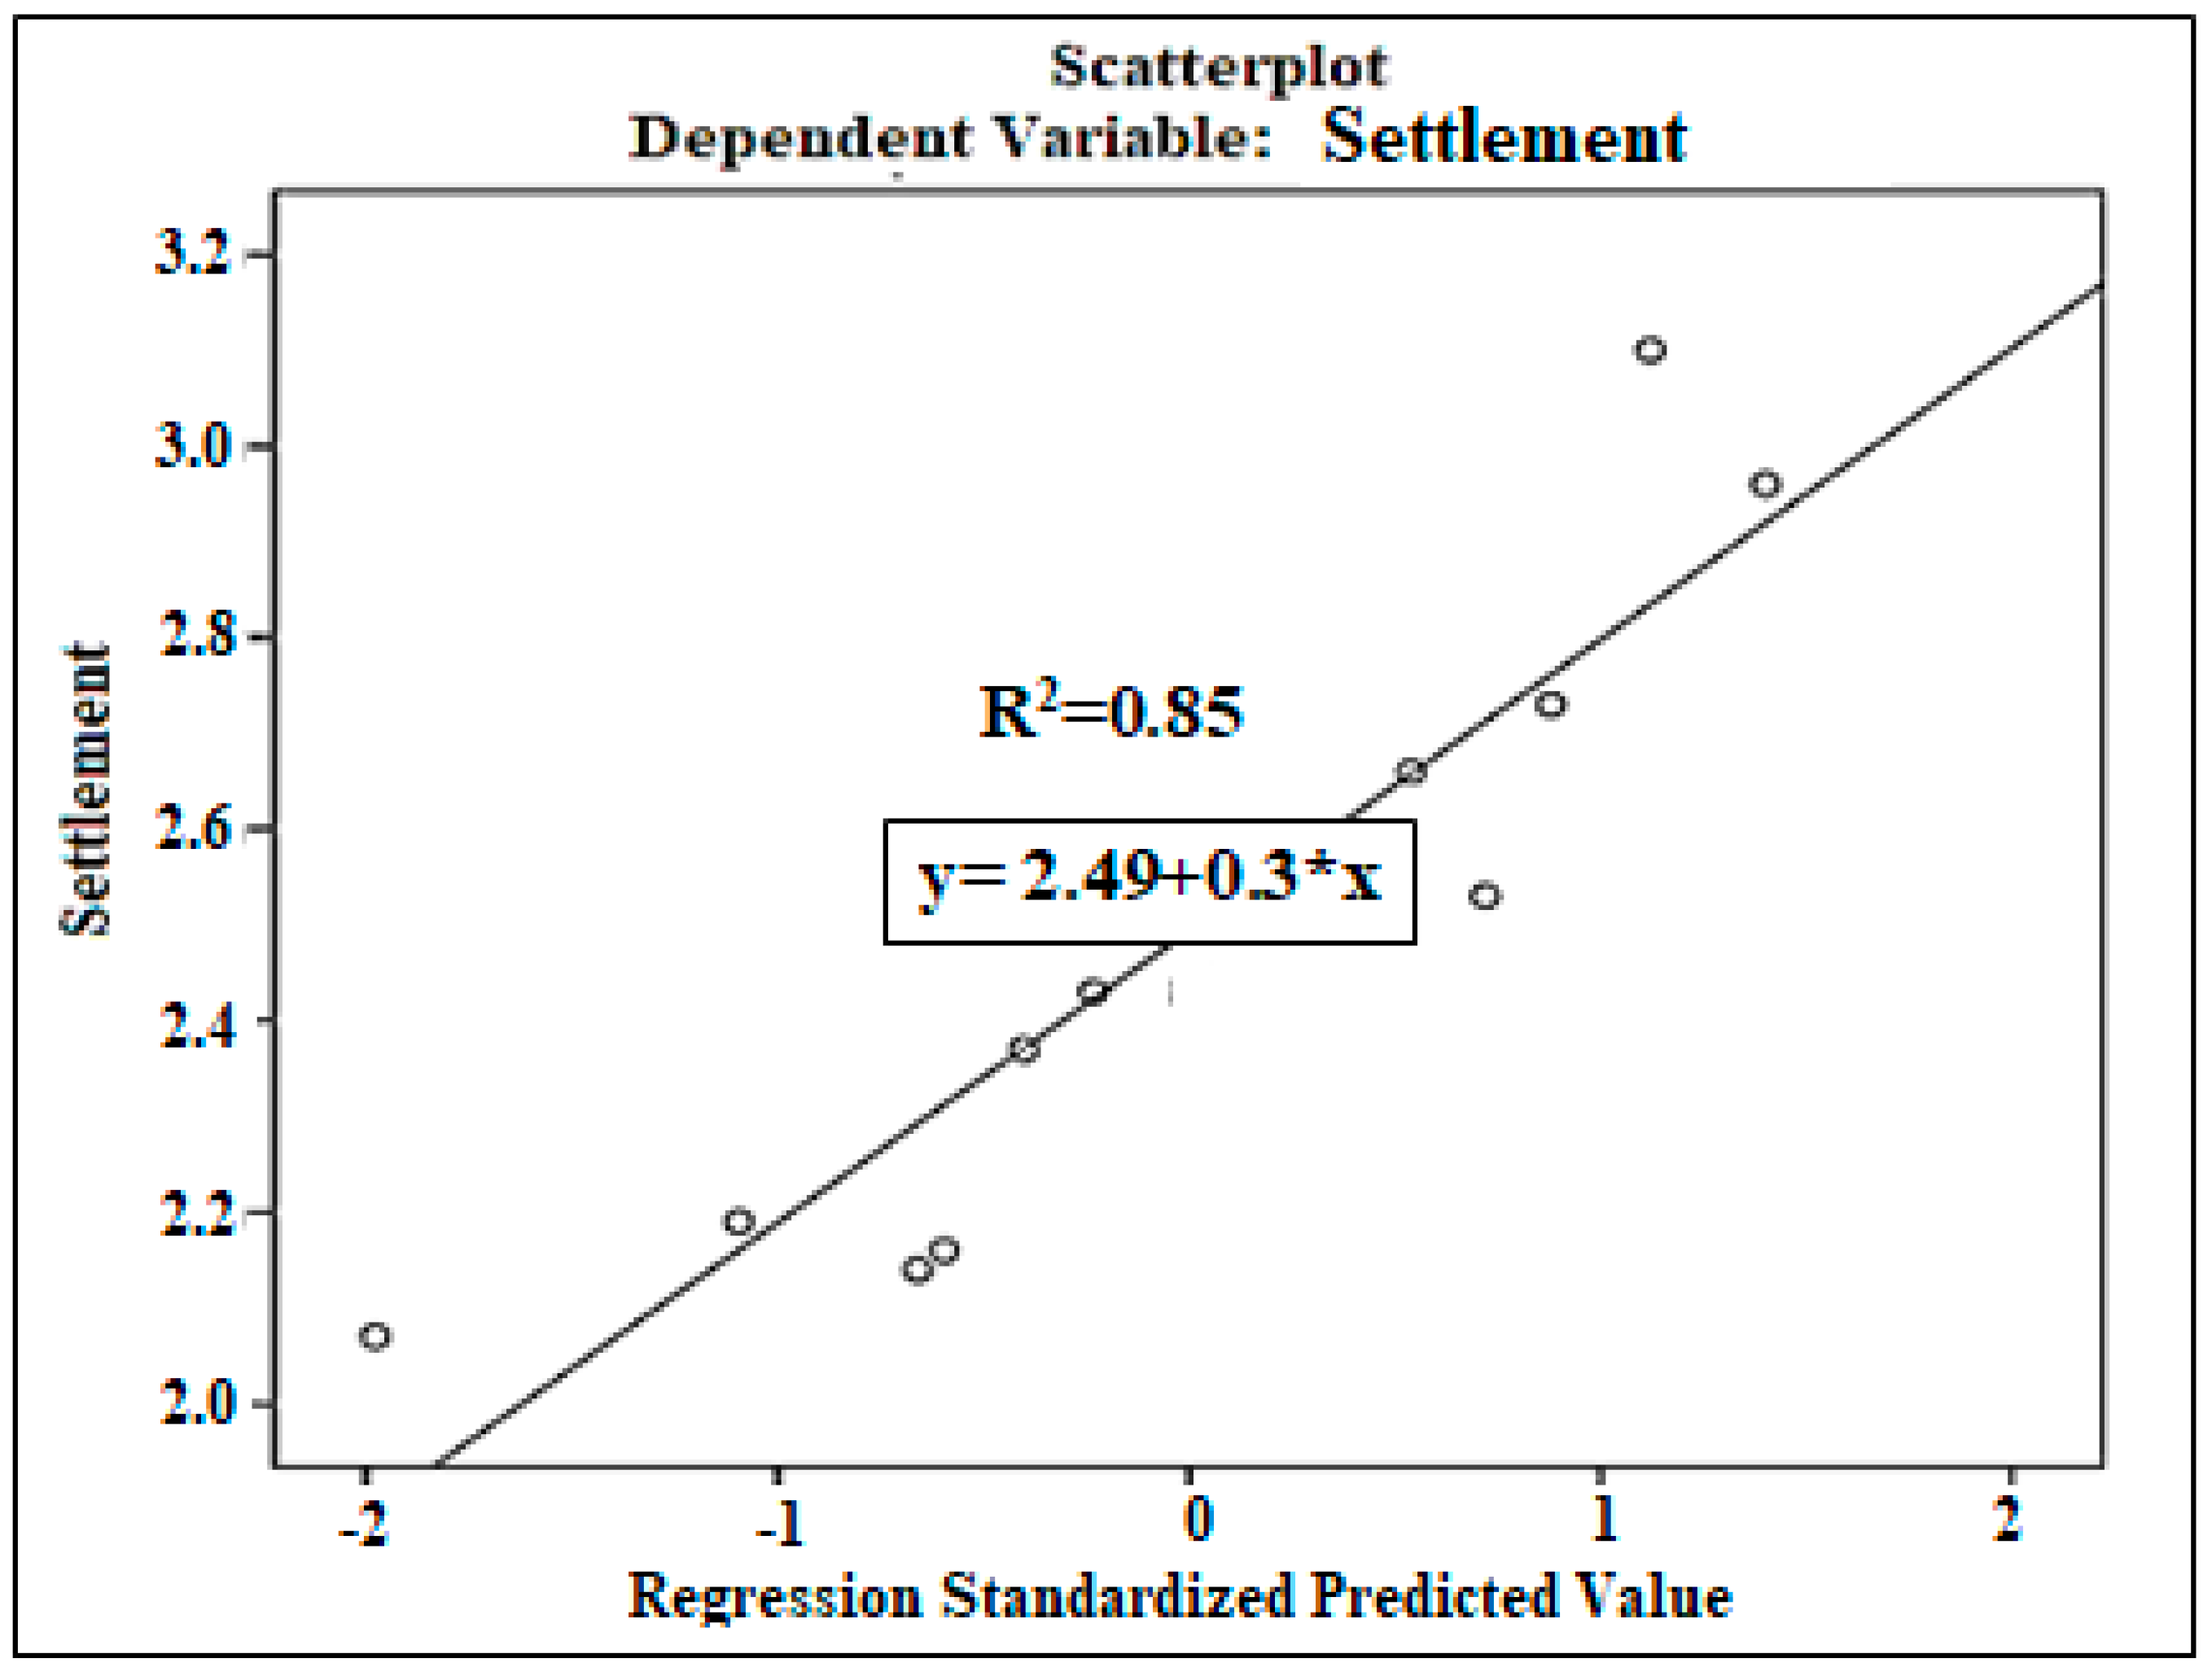
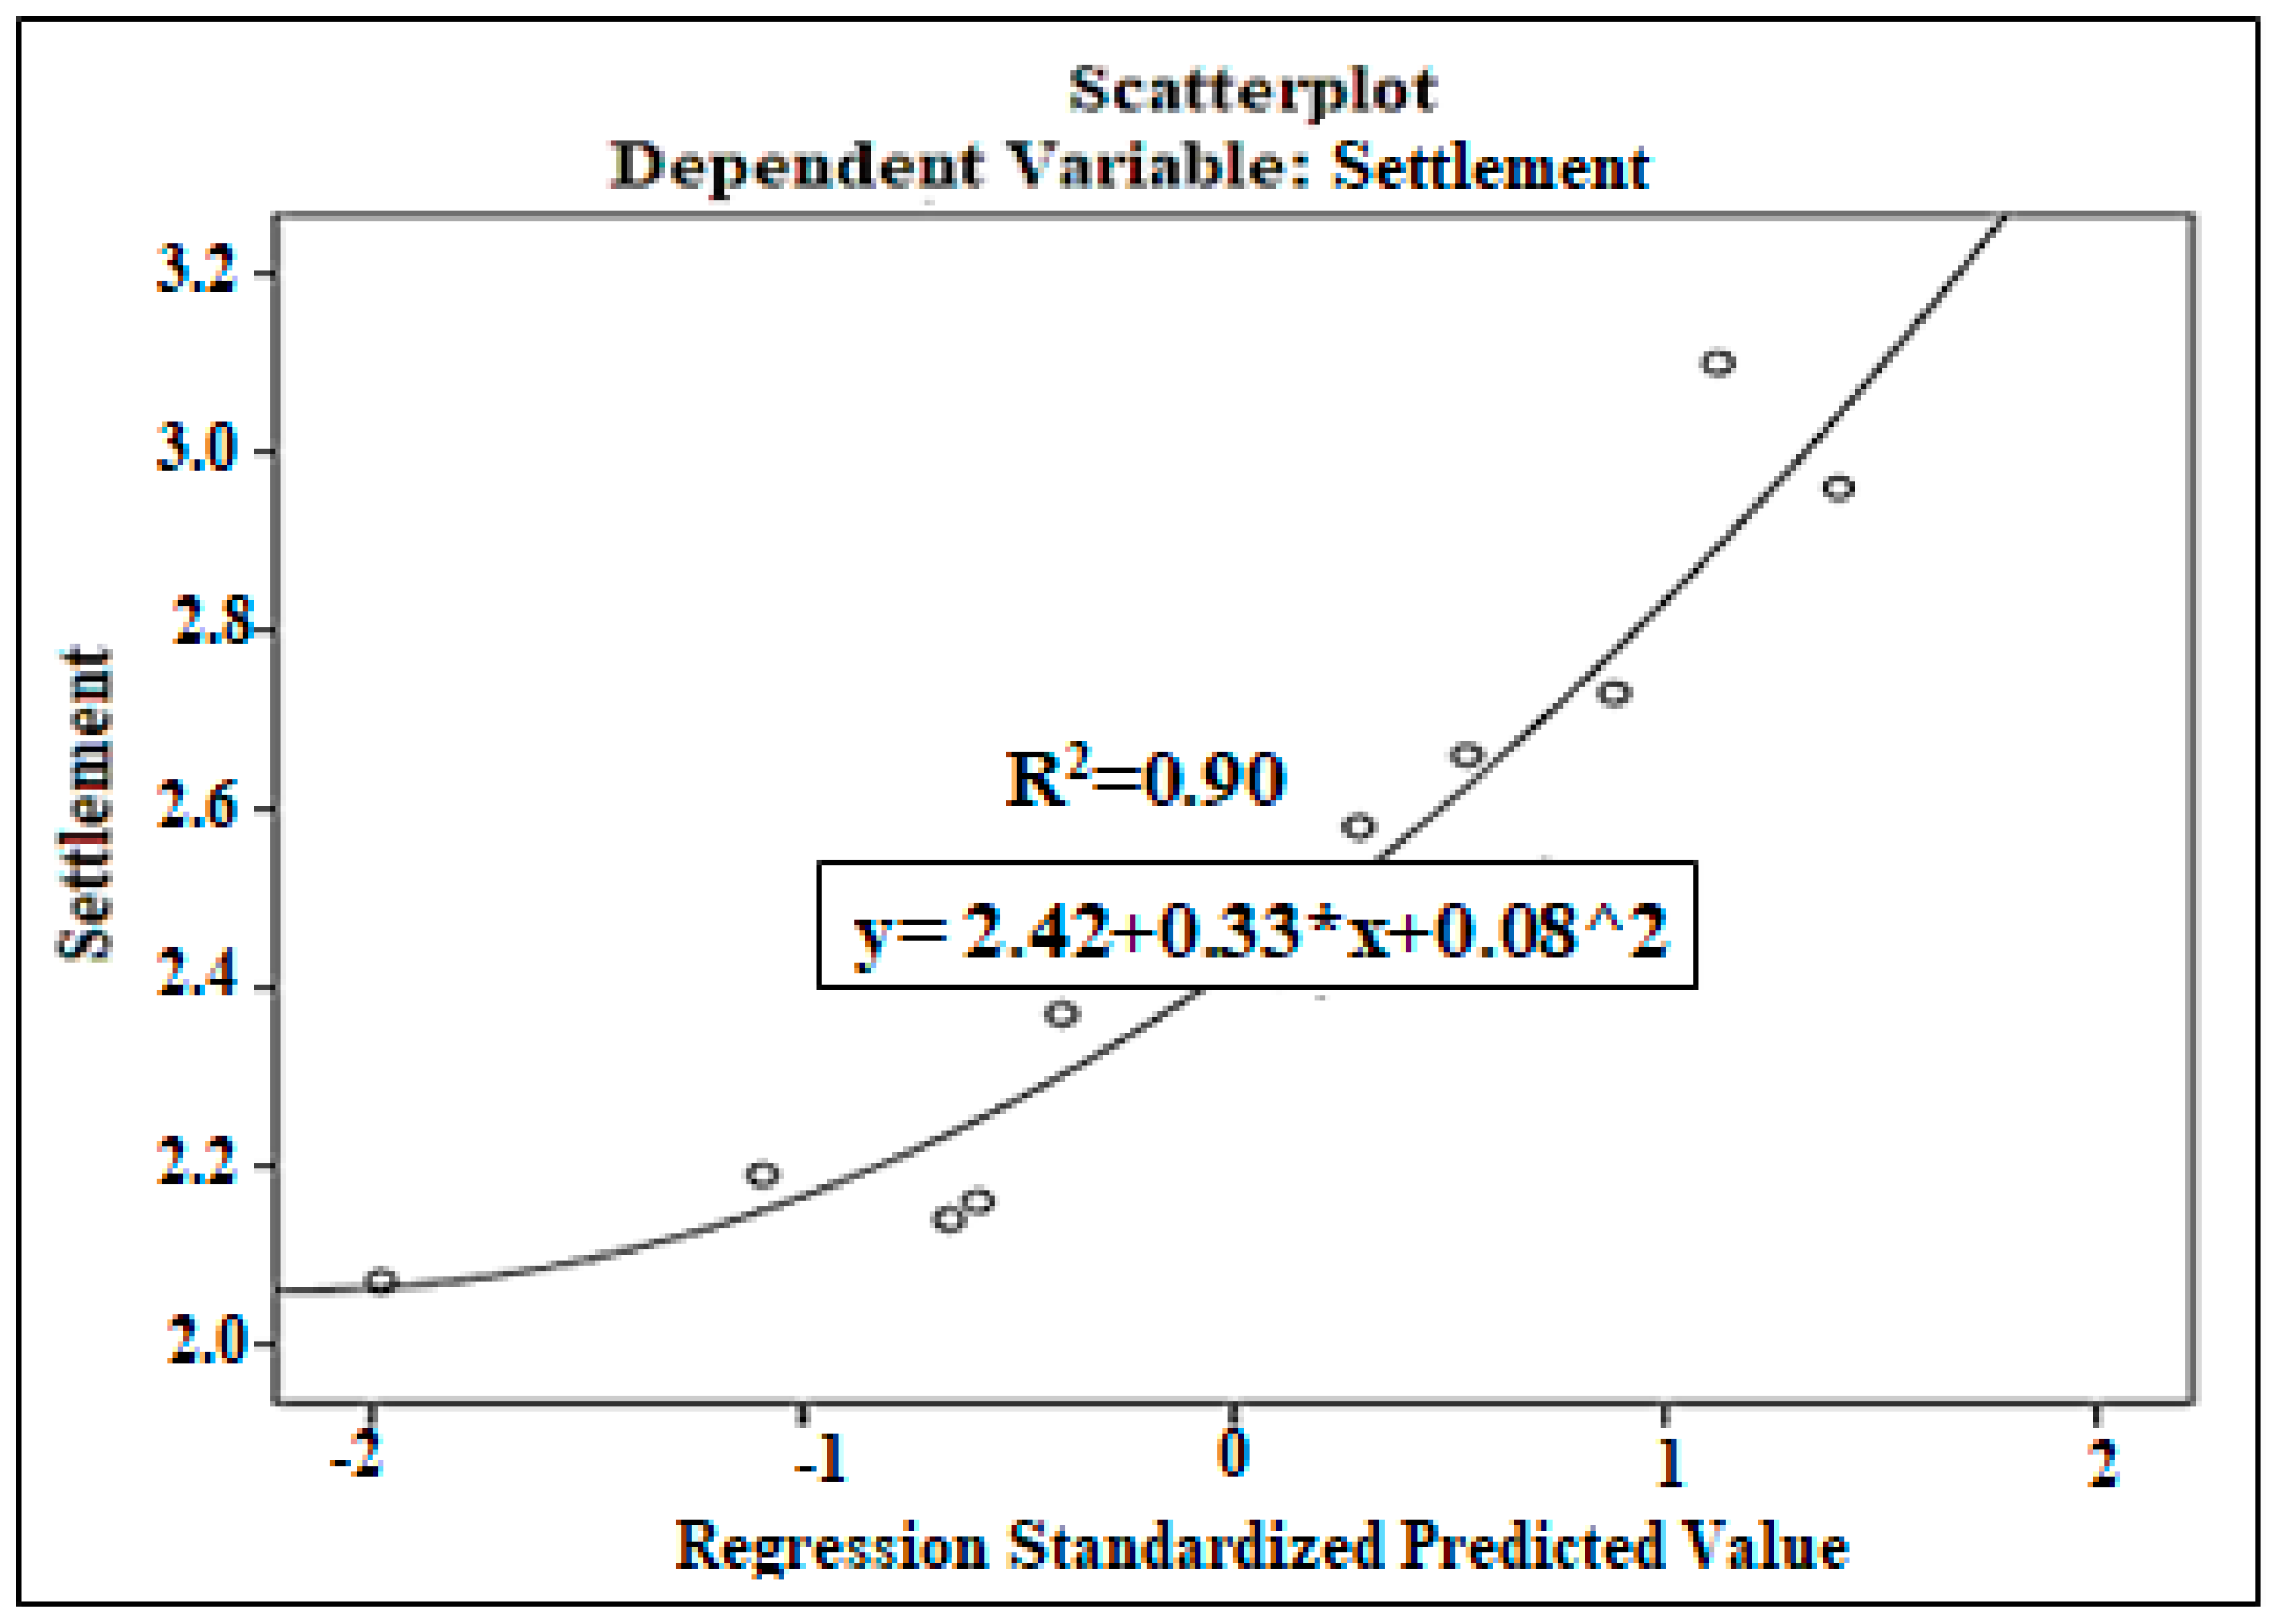
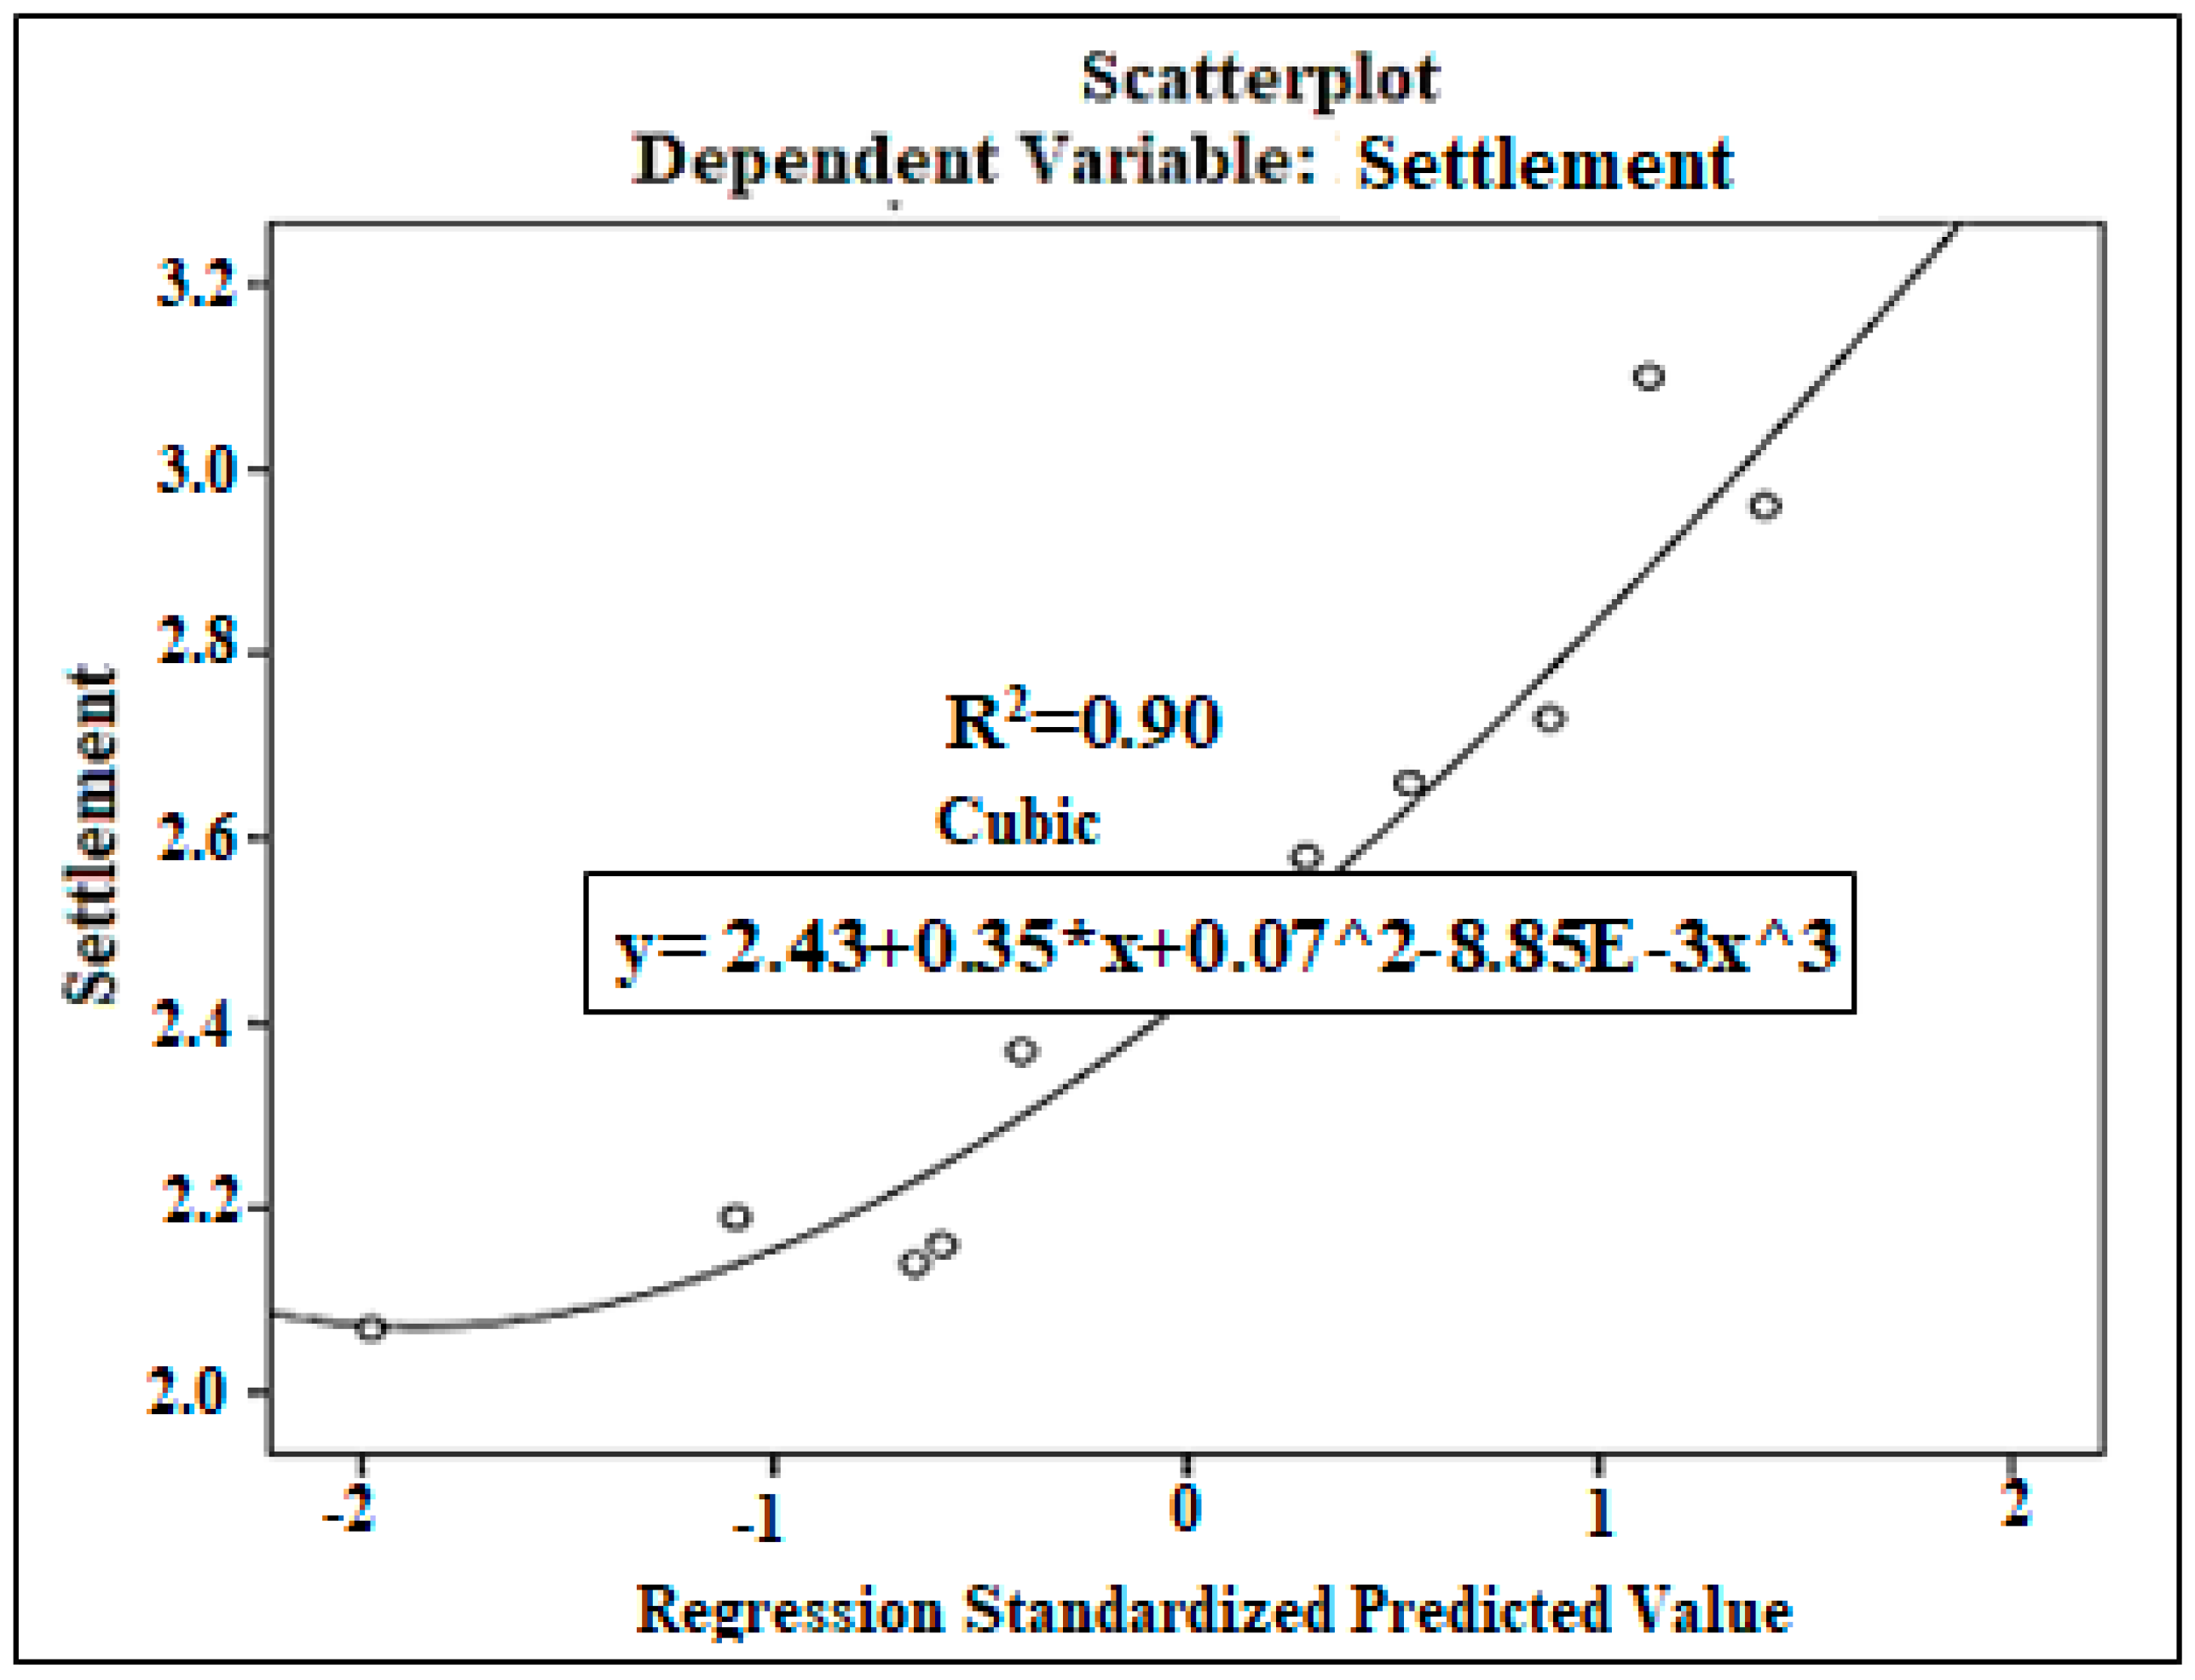
The settlement prediction was analyzed using linear, quadratic, and cubic prediction models to evaluate the performance of different mathematical approaches. The actual and predicted settlement values along with the corresponding R2 values are shown in Figure 7, Figure 8 and Figure 9.
The linear model produced a moderate R2 value, indicating limited predictive accuracy due to its inability to capture possible nonlinear relationships.
In contrast, the quadratic model showed improved fit, reflecting its capacity to incorporate curvature in the relationship between soil parameters and settlement. Among the models, the cubic predictive model provided the highest R2 value, indicating its superior ability to represent the complex interactions between parameters affecting settlement.
These findings highlight the importance of selecting an appropriate prediction model for accurate settlement predictions, especially in scenarios involving nonlinear behavior. Further validation with a larger dataset and inclusion of additional parameters could increase the reliability of these models.

4. Discussion

This study investigated the bearing capacity and settlement behaviour of gravel soils using a combination of laboratory tests, statistical correlation, and predictive modelling. The results provide valuable information about the complex interactions among soil parameters and their effects on geotechnical properties. The bearing capacity analysis highlighted the varying predictive accuracies of different regression models. The linear regression model explained 46% of the variance in bearing capacity (R2 = 0.46), indicating moderate accuracy. This indicates that although linear relationships can describe the underlying trends, they fail to capture the full complexity of interactions among soil properties. By including nonlinear terms, the quadratic model improved the predictive capacity, explaining 69% of the variance (R2 = 0.688). The cubic model achieved the highest accuracy, explaining 79% of the variance (R2 = 0.79), demonstrating its ability to effectively model complex and higher-order interactions.
These results highlight the importance of nonlinear modelling in geotechnical studies, especially for granular soils such as gravel, which are affected by parameters such as cohesion, internal friction angle, and grain size distribution. Similar trends were observed in previous studies emphasizing the influence of matric suction, overburden tension, and soil expansion on bearing capacity [87,88]. The settlement behaviour of gravel soils exhibited stronger predictive relationships with soil parameters. The linear regression model explained 85% of the variance (R2 = 0.846), indicating almost very good predictive ability. The quadratic and cubic models further increased the prediction accuracy, each explaining 90.4% of the variance (R2 = 0.904). These findings indicate that the slump behaviour in gravel soils is less dependent on higher-order interactions than on bearing capacity, probably due to the dominant influence of certain parameters such as excavation depth, unit weight, and grain size distribution (e.g., No. 10 and No. 200 values).
These findings are consistent with previous studies showing that settlement behaviour in granular soils is more directly affected by fundamental soil properties [82]. The ability of regression models to predict settlement with high accuracy further supports the suitability of empirical approaches for engineering applications. The differences in the accuracy of predictions between bearing capacity and settlement models highlight the different nature of these two parameters. While bearing capacity is affected by a wider range of interactions, settlement behaviour appears to be governed by more direct relationships. These insights highlight the need for specialized approaches when evaluating geotechnical parameters, particularly in the design and analysis of foundations in gravel soils.
The results also demonstrate that advanced regression models, especially cubic models, can be effectively used in engineering practice to predict soil parameters with high accuracy. This has important implications for the design of foundations, as accurate estimates of bearing capacity and settlement are critical to ensure stability and minimize deformation. Future work can extend this approach to other soil types, such as sandy, clayey, and mixed soils, to develop comprehensive predictive models applicable to a wider range of geotechnical scenarios.

5. Conclusions

This study investigated the bearing capacity and settlement behaviour of gravel soils and focused on determining their relationships with various soil parameters through correlation analysis. The results revealed a significant relationship between the bearing capacity of gravel soil (ranging from 2.22 to 5.98 g/cm2) and No. 200 value, while other soil parameters showed weaker correlations. The predictive modelling of bearing capacity using multiple regression techniques provided different levels of accuracy. The linear regression model reflected moderate predictive accuracy, explaining 46% of the variance (R2 = 0.46). The quadratic model provided improved predictions by explaining 69% of the variance (R2 = 0.688), while the cubic model showed the highest accuracy, explaining 79% of the variance (R2 = 0.79), capturing complex relationships more effectively.
The settlement analysis did not reveal any significant correlation between the settlement values (between 0.0 and 3.55 cm) and individual soil parameters. However, predictive modelling using regression techniques showed strong predictive capabilities. The linear regression model explained 85% of the variance in settlement (R2 = 0.846), while both the second-order and third-order models achieved very high accuracy (R2 = 0.904). These findings indicate that the settlement behaviour is more directly affected by soil properties such as excavation level, unit weight, and grain size distribution than the bearing capacity. This study highlights the effectiveness of nonlinear regression models, especially the second-order and third-order models, in predicting the geotechnical properties of gravel soils. These models provide valuable information for foundation design by providing accurate predictions of bearing capacity and settlement behaviour. The findings also highlight the need for further research on other soil types such as sandy, clayey, and silty soils and their mixed compositions. Examining these relationships across different soil types can improve predictive modelling and contribute to the development of generalized prediction techniques for geotechnical engineering applications.
The settlements that occur in soils consist of two components: elastic settlement and consolidation settlement. Elastic settlement is also defined as sudden settlement and occurs during the construction period when the structure load is transferred to the soil. Consolidation settlement is a process that takes a long time to complete. The settlements that cause damage to structures consist of the sum of these two elements. Especially in soils subjected to preloading, elastic collapse covers a significant part of the total collapse. Since the soil is heterogeneous, it is not expected to show the same behaviour on every side of the structure. In this case, there may be settlements exceeding the limit values in the structure in the soil section that is weaker in terms of settlement. Due to these settlements, additional stresses, cracks, and settlements may occur in the load-bearing elements of rigid structures. Therefore, it is important to determine the magnitude of both settlement components as well as the rigidity of the structure. The settlements in the ground and the bearing capacity of the ground generally depend on important parameters such as the load acting on the ground, the unit weight of the ground, the cohesion coefficient of the ground, the internal friction angle, the Poisson ratio, the modulus of elasticity, the void ratio, the degree of saturation, the groundwater level, the rigidity coefficient of the ground, and the narrow side width of the foundation resting on the ground.
However, which of these affect the bearing capacity and consolidation properties of the soil and whether the levels of effect are the same for all or different from each other are important issues. The importance levels of the relationships between the bearing capacity and consolidation properties of the soil and other parameters should be known. While making these determinations, showing which of the physical properties of the examined soil affect the bearing capacity and settlement values with numerical values will contribute to the evaluation of the soil and the design of foundation models.
As a result of the analysis of the data belonging to the gravel soil obtained from 27 boreholes, it was seen that some parameters increased the bearing capacity of the soil while some parameters decreased it. In the correlation analyses, it was seen that the amount of soil passing through the no. 200 sieve, water content, the amount of soil passing through the no. 10 sieve, and the cohesion coefficient increased the bearing capacity of the soil. It was seen that the effect rates of these parameters on the bearing capacity of the soil were 29.2% of the soil passing through the no. 200 sieve, 22.31% of the water content, 13.37% of the cohesion coefficient, 10.83% of the soil passing through the no. 10 sieve, and 2.71% of the excavation depth. However, it was seen that the groundwater level, unit volume weight, and internal friction angle decreased the bearing capacity of the soil in the examined gravel soils. It was observed that the groundwater level had an effect of 11.98%, the unit weight for gravel soil alone had an effect of 6.40%, and the internal friction angle had an effect of 3.20%.
When the settlement analyses of the examined gravel soils are taken into consideration, it is seen that excavation depth, unit volume weight, water content, amount of soil passing through sieve no. 10, amount of soil passing through sieve no. 200, and internal friction angle reduce the settlement amount of gravel soil, while cohesion coefficient and groundwater level increase the settlement amount. Among the parameters that reduce the settlement amount, it is seen that excavation depth is 24.4%, soil passing through sieve no. 200 is 18.82%, soil passing through sieve no. 10 is 18.39%, unit volume weight is 14.57%, water content is 3.15%, and internal friction angle is 0.12% effective. It is also seen that cohesion coefficient is 20.27% and groundwater level is 0.24% effective. The parameters that increase and decrease the settlement amount of gravel soils are given proportionally according to their importance.
According to these results, the soil parameters affecting the bearing capacity and settlement amount of the soil in terms of current engineering practices were expressed proportionally, and preliminary evaluations were made on how the bearing capacity and settlement amounts would be affected according to the soil parameters examined by the engineers. Moreover, it was shown which parameters have significant effects in which direction in gravel soils.

Author Contributions

A.B.S.G.: Conceptualization, Investigation, Research, Data Curation, Editing; E.Ö.: Methodology, Validations, Software, Data Curation, Writing, Review—Editing. All authors have read and agreed to the published version of the manuscript.

Funding

This research received no external funding.

Institutional Review Board Statement

Not applicable.

Informed Consent Statement

Not applicable.

Data Availability Statement

The raw data supporting the conclusions of this article will be made available by the authors on request.

Conflicts of Interest

The authors declare no conflicts of interest.

References

  1. Sigdel, L.D.; Al-Qarawi, A.; Leo, C.J.; Liyanapathirana, S.; Hu, P. Geotechnical design practices and soil–structure interaction effects of an integral bridge system: A review. Appl. Sci. 2021, 11, 7131. [Google Scholar] [CrossRef]
  2. Seed, H.B.; Peacock, W.H. Test procedures for measuring soil liquefaction characteristics. J. Soil. Mech. Found. Div. 1971, 97, 1099–1119. [Google Scholar] [CrossRef]
  3. Vickers, B. Laboratory Work in Soil Mechanics (No. Monograph). 1983. Available online: https://trid.trb.org/View/205995 (accessed on 23 April 2025).
  4. Terzaghi, K.; Peck, R.B.; Mesri, G. Soil Mechanics in Engineering Practice; John Wiley & Sons: Hoboken, NJ, USA, 1996. [Google Scholar]
  5. Kaliakin, V. Soil Mechanics: Calculations, Principles, and Methods; Butterworth-Heinemann: Oxford, UK, 2017. [Google Scholar]
  6. Scarfone, R.; Morigi, M.; Conti, R. Assessment of dynamic soil-structure interaction effects for tall buildings: A 3D numerical approach. Soil Dyn. Earthq. Eng. 2020, 128, 105864. [Google Scholar] [CrossRef]
  7. Kiakojouri, F.; De Biagi, V.; Chiaia, B.; Sheidaii, M.R. Progressive collapse of framed building structures: Current knowledge and future prospects. Eng. Struct. 2020, 206, 110061. [Google Scholar] [CrossRef]
  8. Avğın, S.; Köse, M.M.; Özbek, A. Damage assessment of structural and geotechnical damages in Kahramanmaraş during the February 6, 2023 earthquakes. Eng. Sci. Technol. Int. J. 2024, 57, 101811. [Google Scholar] [CrossRef]
  9. Rodrigues, R.A.; Prado Soares, F.V.; Sanchez, M. Settlement of footings on compacted and natural collapsible soils upon loading and soaking. J. Geotech. Geoenviron. Eng. 2021, 147, 04021010. [Google Scholar] [CrossRef]
  10. Yang, S.; Leshchinsky, B.; Cui, K.; Zhang, F.; Gao, Y. Influence of failure mechanism on seismic bearing capacity factors for shallow foundations near slopes. Géotechnique 2021, 71, 594–607. [Google Scholar] [CrossRef]
  11. Dey, A.; Acharyya, R.; Alammyan, A. Bearing capacity and failure mechanism of shallow footings on unreinforced slopes: A state-of-the-art review. J. Geotech. Eng. 2021, 15, 1284–1297. [Google Scholar] [CrossRef]
  12. Abd, I.A.; Fattah, M.Y.; Mekkiyah, H. Relationship between the matric suction and the shear strength in unsaturated soil. Case Stud. Constr. Mater. 2020, 13, e00441. [Google Scholar] [CrossRef]
  13. Zhai, Q.; Rahardjo, H.; Satyanaga, A.; Dai, G.L.; Du, Y.J. Effect of the uncertainty in soil-water characteristic curve on the estimated shear strength of unsaturated soil. J. Zhejiang Univ. Sci. A 2020, 21, 317–330. [Google Scholar] [CrossRef]
  14. Briaud, J.L. Geotechnical Engineering: Unsaturated and Saturated Soils; John Wiley & Sons: Hoboken, NJ, USA, 2023. [Google Scholar]
  15. Li, Y.; Nie, R.; Yue, Z.; Leng, W.; Guo, Y. Dynamic behaviors of fine-grained subgrade soil under single-stage and multi-stage intermittent cyclic loading: Permanent deformation and its prediction model. Soil. Dyn. Earthq. Eng. 2021, 142, 106548. [Google Scholar] [CrossRef]
  16. Huang, Z.; Zhang, H.; Fu, H.; Ma, S.; Liu, Y. Deformation response induced by surcharge loading above shallow shield tunnels in soft soil. KSCE J. Civ. Eng. 2020, 24, 2533–2545. [Google Scholar] [CrossRef]
  17. Roy, M. Practice in Geotechnical and Foundation Engineering. In Geotechnical and Foundation Engineering Practice in Industrial Projects; Springer Nature: Singapore, 2024; pp. 295–303. [Google Scholar]
  18. Alowaisy, A.; Yasufuku, N.; Ishikura, R.; Hatakeyama, M.; Kyono, S. Continuous pressurization method for a rapid determination of the soil water characteristics curve for remolded and undisturbed cohesionless soils. Soils Found. 2020, 60, 634–647. [Google Scholar] [CrossRef]
  19. Mısır, G. Granüler Stabilize Dolgu İle İyileştirilen Yumuşak Kil Zeminlere Oturan Temellerin Analizi. Master’s Thesis, Çukurova Üniversitesi, Fen Bilimleri Enstitüsü, Adana, Türkiye, 2008. [Google Scholar]
  20. Meyerhof, G.G. Ultimate Bearing Capacity of Footings on Sand Layer Overlying Clay. Can. Geotech. J. 1974, 11, 223–229. [Google Scholar] [CrossRef]
  21. Çinicioğlu, F. Zeminlerde Statik ve Dinamik Yükler Altında Taşıma Gücü Anlayışı ve Hesabı. 2005. Available online: https://www.scribd.com/document/340506023/ZEM%C4%B0NLERDE-STAT%C4%B0K-VE-D%C4%B0NAM%C4%B0K-YUKLER-ALTINDA-TA%C5%9EIMA-GUCU-HESABI-F-C%C4%B0N%C4%B0C%C4%B0O%C4%9ELU-pdf (accessed on 23 April 2025).
  22. Alkaya, D.; Çobanoğlu, İ. Toprakarme (donatılı zemin) yapılar. Denizli İMO Bülten-İnceleme Araştırma 2007, 54, 29–37. [Google Scholar]
  23. Uzundurukan, S. İnce daneli zeminlerin bazı geoteknik özelliklerinin SPT ve DPT verilerine bağlı ampirik ifadeler ile tespitine yönelik bir çalışma. Master’s Thesis, Süleyman Demirel Üniversitesi, Fen Bilimleri Enstitüsü, İnşaat Mühendisliği Ana Bilim Dalı, Isparta, Türkiye, 2001. [Google Scholar]
  24. Terzaghi, K.; Peck, R.B. Soil Mechanics in Engineering Practice, 1st ed.; John Wiley & Sons: New York, NY, USA, 1948. [Google Scholar]
  25. Terzaghi, K.; Peck, R.B. Soil Mechanics in Engineering Practice, 2nd ed.; John Wiley & Sons: New York, NY, USA, 1967. [Google Scholar]
  26. Peck, R.B.; Hanson, W.E.; Thornburn, T.H. Foundation Engineering, 2nd ed.; John Wiley & Sons: New York, NY, USA, 1974. [Google Scholar]
  27. Coduto, D.P. Foundation Design: Principles and Practices, 2nd ed.; Prentice Hall: Hoboken, NJ, USA, 2000. [Google Scholar]
  28. Kulhawy, F.H.; Mayne, P.W. Manual on Estimating Soil Properties for Foundation Design; EL-6800; Project 1493-6; Electric Power Research Institute (EPRI): Palo Alto, CA, USA, 1990. [Google Scholar]
  29. TS 1900; İnşaat Mühendisliğinde Zemin Laboratuvar Deneyleri-Bölüm 2-Mekanik Özelliklerin Tayini. Türk Standartları Enstitüsü: Ankara, Turkey, 2006.
  30. TS 1500:2000; İnşaat mühendisliğinde zeminlerin sınıflandırılması. Türk Standartları Enstitüsü: Ankara, Turkey, 2000.
  31. Kovačević, M.S.; Jurić-Kaćunić, D.; Librić, L.; Ivoš, G. Engineering soil classification according to EN ISO 14688-2:2018. Gradevinar 2018, 70, 873–879. [Google Scholar] [CrossRef]
  32. Das, B.M.; Sobhan, K. Principles of Geotechnical Engineering; Cengage Learning: Boston, MA, USA, 1990. [Google Scholar]
  33. Boumpoulis, V.; Depountis, N.; Pelekis, P.; Sabatakakis, N. SPT and CPT application for liquefaction evaluation in Greece. Arab. J. Geosci. 2021, 14, 1–15. [Google Scholar] [CrossRef]
  34. Khan, Z.; Yamin, M.; Attom, M.; Al Hai, N. Correlations between SPT, CPT, and Vs for reclaimed lands near Dubai. Geotech. Geol. Eng. 2022, 40, 4109–4120. [Google Scholar] [CrossRef]
  35. Fragaszy, R.J.; Su, J.; Siddiqi, F.H.; Ho, C.L. Modeling strength of sandy gravel. J. Geotech. Eng. 1992, 118, 920–935. [Google Scholar] [CrossRef]
  36. Smith, T.D.; Rollins, K.M. Pressuremeter testing in arid collapsible soils. Geotech. Test. J. 1997, 20, 12–16. [Google Scholar] [CrossRef]
  37. Robertson, P.K.; Campanella, R.G.; Wightman, A. Spt-Cpt Correlations. J. Geotech. Eng. 1983, 109, 1449–1459. [Google Scholar] [CrossRef]
  38. Dos Santos, M.D.; Bicalho, K.V. Proposals of SPT-CPT and DPL-CPT correlations for sandy soils in Brazil. J. Rock. Mech. Geotech. Eng. 2017, 9, 1152–1158. [Google Scholar] [CrossRef]
  39. Baez, J.I.; Martin, G.R.; Youd, T.L. Comparison of SPT-CPT liquefaction evaluations and CPT interpretations. Geotech. Spec. Publ. 2000, 285, 17–32. [Google Scholar]
  40. Burmister, D.M. Identification and Classification of Soil: An Apprasial and Statement of Principles; ASTM STP 113; American Society for Testing and Materials: Philadelpia, PA, USA, 1951. [Google Scholar]
  41. Burmister, D. Physical, stress-strain, and strength responses of granular soils. In Field Testing of Soils; ASTM International: West Conshohocken, PA, USA, 1962. [Google Scholar]
  42. Casey, B.B.A. The Consolidation and Strength Behavior of Mechanically Compressed Fine-Grained Sediments. Ph.D. Thesis, Massachusetts Institute of Technology, Cambridge, MA, USA, 2014. [Google Scholar]
  43. Kramer, S.L. Geotechnical Earthquake Engineering; Prentice Hall: Hoboken, NJ, USA, 1996; p. 653. [Google Scholar]
  44. Önalp, A. Geoteknik Bilgisi 1, Zeminler ve Mekaniği; No. 27; Sakarya Üniversitesi Yayin: Adapazarı, Turkey, 1997. [Google Scholar]
  45. Cetin, B.; Akgün, H.; Kelam, A.A. Geotechnical properties of gravelly soils in Çankırı, Turkey. Eng. Geol. 2008, 96, 86–95. [Google Scholar]
  46. Kesimal, A.; Yılmaz, E.; Alp, I. Bearing capacity of gravel soils in the Mediterranean region of Turkey. Arab. J. Geosci. 2014, 7, 3635–3642. [Google Scholar]
  47. Dündar, C. Deformation behavior of gravelly soils in the Black Sea region of Turkey. Geomech. Eng. 2016, 11, 621–630. [Google Scholar]
  48. Karabulut, H.; Schmittbuhl, J.; Lengline, O.; Bouchen, M. Seismicity distribution and locking depth along the Main Marmara Fault, Turkey. Geochem. Geophys. Geosyst. 2016, 17, 954–965. [Google Scholar]
  49. Ylmaz, Ö.; Özyalvaç, M.; Duman, F.; Çataklı, M.; Polat, Z. Offshore high-resolution seismic survey for a subsea tunnel across the Bosphorus Waterway, Istanbul, Turkey. Lead. Edge 2018, 37, 732–738. [Google Scholar] [CrossRef]
  50. Lettis, W.; Barka, A. Geologic characterization of fault rupture hazard, Gumusova—Gerede Motorway. In Report Prepared for the Astaldi-Bayindir Joint Venture Turkey; Astaldi: Bolu, Turkey, 2000. [Google Scholar]
  51. Şengör, A.M.C.; ve Yılmaz, Y. Tethyan evolution of Turkey: A plate tectonic approach. Tectonophysics 1981, 75, 181–241. [Google Scholar] [CrossRef]
  52. Yılmaz, Y.; Tüysüz, O.; Yiğitbaş, E.; Genç, C.; Şengör, C. Geology and tectonic evolution of the pontides. AAPG Mem. 1997, 68, 183–226. [Google Scholar]
  53. Özmen, B. Düzce-Bolu Bölgesi’nin Jeolojisi, Diri Fayları ve Hasar Yapan Depremleri s:1-14, 12 Kasım 1999 Düzce Depremi Raporu; Özmen, B., Bağcı, G., Eds.; Bayındırlık ve İskan Bakanlığı Afet İşleri Genel Müdürlüğü, Deprem Araştırma Dairesi: Ankara, Turkey, 2000. [Google Scholar]
  54. Erdik, M. Report on 1999 Kocaeli And Düzce (Turkey) Earthquakes. Structural Control for Civil and Infrastructure Engineering: 2001. pp. 149–186. Available online: https://www.worldscientific.com/doi/abs/10.1142/9789812811707_0018?srsltid=AfmBOoqvCLTUCzQ77HbV2HToePiUDf4dFcc7l1ZTj95GlxGmdXmxhGKj (accessed on 23 April 2025).
  55. Bozkurt, E.; Mittwede, S.K. Introduction to the geology of Turkey—A synthesis. Int. Geol. Rev. 2001, 43, 578–594. [Google Scholar] [CrossRef]
  56. Şengör, A.M.C.; Tüysüz, O.; Imren, C.; Sakınç, M.; Eyidoğan, H.; Görür, N.; Rangin, C. The North Anatolian fault: A new look. Annu. Rev. Earth Planet. Sci. 2005, 33, 37–112. [Google Scholar] [CrossRef]
  57. Karadeniz, M.; Utkan, M. A New Approach to Standart Penetration Test Correlation For Kocaeli/Turkey. In Proceedings of the International Conference on Civil, Environmental and Medical Engineering (ICEME), New York, NY, USA, 4 June 2015. [Google Scholar]
  58. Karadeniz, E.; Sunbul, F. Land Use and Land Cover Change in Duzce Region Following the Major Earthquake: Implications for ANN and Markov Chain Analysis. Environ. Earth Sci. 2023, 82, 243. [Google Scholar] [CrossRef]
  59. MTA Genel Müdürlüğü ve Ankara Üniversitesi. 17 Ağustos 1999 Depremi Sonrası Düzce (Bolu) İlçesi Alternatif Yerleşim Alanlarının Jeolojik İncelenmesi, TÜBİTAK Yer Deniz Atmosfer Bilimleri ve Çevre Araştırma Grubu Raporu, 59s. 1999. Available online: https://eticaret.mta.gov.tr/index.php?route=product/product&product_id=10272 (accessed on 23 April 2025).
  60. Emre, Ö. vd. (MTA), Varol, B. vd. (A.Ü.), 1999. 17 Ağustos 1999 Depremi Sonrası Düzce (Bolu) İlçesi Alternatif Yerleşim Alanlarının Jeolojik İncelemesi. TÜBİTAK (MTA Genel Müdürlüğü ve A.Ü. Ortak Araştırma Projesi). Available online: https://www.jmo.org.tr/resimler/ekler/c81efed973425e1_ek.pdf (accessed on 23 April 2025).
  61. Available online: https://www.harita.gen.tr/81-duzce-haritasi/ (accessed on 23 April 2025).
  62. SPSS Statistics Version 22; IBM: Armonk, NY, USA, 2020.
  63. Das, M.B. Principle of Geotechnical Engineering, 7th ed.; Cengage Learning: Stamford, CT, USA, 2010. [Google Scholar]
  64. Omar, M.; Shanableh, A.; Hamad, K.; Tahmaz, A.; Arab, M.G.; Al-Sadoon, Z. Nomographs for predicting allowable bearing capacity and elastic settlement of shallow foundation on granular soil. Arab. J. Geosci. 2019, 12, 485. [Google Scholar] [CrossRef]
  65. Nazir, R.; Momeni, E.; Hajihassani, M. Prediction of spread foundations’ settlement in cohesionless soils using a hybrid particle swarm optimization-based ANN approach. In Proceedings of the International Conference on Advances in Civil, Structural and Mechanical Engineering—CSM 2014, London, UK, 1–2 June 2014; pp. 20–24. [Google Scholar]
  66. Reza, D.; Sadeghian, M. Prediction of ultimate bearing capacity of shallow foundation on granular soils using Imperialist Competitive Algorithm based ANN. Soil Struct. Interact. J. 2019, 4, 1–11. [Google Scholar]
  67. Nazir, R.; Momeni, E.; Marsono, K.; Maizir, H. An artificial neural network approach for prediction of bearing capacity of spread foundations. Sand J. Teknol. (Sci. Eng.) 2015, 72, 9–14. [Google Scholar] [CrossRef]
  68. Örnek, M.; Laman, M.; Demir, A.; Yildiz, A. Prediction of bearing capacity of circular footings on soft clay stabilized with granular soil. Soils Found. 2012, 52, 69–80. [Google Scholar] [CrossRef]
  69. Padmini, D.; Ilamparuthi, K.; Sudheer, K.P. Ultimate bearing capacity prediction of shallow foundations on cohesionless soils using neurofuzzy models. Comput. Geotech. 2008, 35, 33–46. [Google Scholar] [CrossRef]
  70. Rahul, T.; Krishna, V.R.; Singh, P.N. Evaluation of soil bearing capacity and settlements of soil for various hard rock depths for a 128 m high commercial building with raft foundation Temura Rahul. Mater. Today Proc. 2022, 51, 2604–2607. [Google Scholar] [CrossRef]
  71. IS Code 640; Indian Standard Code of Practice for Determination of Bearing Capacity of Shallow Foundations. 1981. Available online: https://law.resource.org/pub/in/bis/S03/is.6403.1981.pdf (accessed on 23 April 2025).
  72. IS 8009 Part-II; Indian Standard Code of Practice for Calculation of Settlement of Foundations. 1980. (Reaffirmed 2006). Available online: https://archive.org/details/gov.in.is.8009.2.1980 (accessed on 23 April 2025).
  73. Kaniraj, S.R. Design Aids in Soil Mechanics and Foundation Engineering; Tata McGraw-Hill: New York, NY, USA, 1988. [Google Scholar]
  74. Mayne, P.W.; Poulos, H.G. Approximate displacement influence factors for elastic shallow foundations. J. Geotech. Geoenviron. Eng. 1999, 125, 453–460. [Google Scholar] [CrossRef]
  75. Qasim, O.A. Full Hand Calculation, Analysis and Design of Multi-Story Building; 2016. Available online: https://www.academia.edu/37776849/FULL_HAND_CALCULATION_ANALYSIS_AND_DESIGN_OF_MULTI_STORY_BUILDING (accessed on 23 April 2025).
  76. Rahul, T.; Krishna, V.R.; Singh, P.N. Modelling of Foundation for a 128-metre-High Commercial Building in the Vicinity of River Krishna Subjected to Severe Wind. Indian Geotech. J. 2021, 51, 1107–1120. [Google Scholar] [CrossRef]
  77. Panwar, V.; Sharma, D.K.; Kumar, K.V.P.; Jain, A.; Thakar, C. Experimental investigations and optimization of surface roughness in turning of en 36 alloy steel using response surface methodology and genetic algorithm. Mater. Today Proc. 2021, 46, 6474–6481. [Google Scholar] [CrossRef]
  78. Kahraman, E. Konsolidasyon Özelliklerinin Arttırılmış Veri Seti İle İstatistiksel Analizi. Master’s Thesis, İstanbul Teknik Üniversitesi, Fen Bilimleri Enstitüsü, İstanbul, Turkey, 2012. [Google Scholar]
  79. Kılıç, E. Konsolidasyon Özelliklerinin İstatistiksel Analizi. Master’s Thesis, İstanbul Teknik Üniversitesi, Fen Bilimleri Enstitüsü, İstanbul, Turkey, 2007. [Google Scholar]
  80. Das, B.M.; Sivakugan, N. Settlement of shallow foundations on granular soil—An overview. Int. J. Geotech. Eng. 2007, 1, 19–29. [Google Scholar] [CrossRef]
  81. Schmertmann, J.H. Static cone to compute static settlement over sand. J. Soil. Mech. Found. Div. ASCE 1970, 96, 1011–1043. [Google Scholar] [CrossRef]
  82. Schmertmann, J.H.; Hartman, J.P.; Brown, P.R. Improved strain influence factor diagrams. J. Geotech. Eng. Div. ASCE 1978, 104, 1131–1135. [Google Scholar] [CrossRef]
  83. Burland, J.B.; Burbidge, M.C.; Wilson, E.J.; Terzaghi. Settlement of foundations on sand and gravel. Proc. Inst. Civ. Eng. 1985, 78, 1325–1381. [Google Scholar] [CrossRef]
  84. Sivakugan, N.; Johnson, K. Settlement predictions in granular soils: A probabilistic approach. Geotechnique 2004, 54, 499–502. [Google Scholar] [CrossRef]
  85. Shahin, M.A.; Maier, H.R.; Jaksa, M.B. Predicting settlement of shallow foundations using neural networks. J. Geotech. Geoenviron. 2002, 128, 785–793. [Google Scholar] [CrossRef]
  86. Erzin, Y.; Gul, T.O. The use of neural networks for the prediction of the settlement of one-way footings on cohesionless soils based on standard penetration test. Neural Comput. Appl. 2014, 24, 891–900. [Google Scholar] [CrossRef]
  87. Mohamed, F.M.; Vanapalli, S.K.; Saatcioglu, M. Bearing capacity and settlement behaviour of footings in an unsaturated sand. In Proceedings of the 14th Pan-American Conference on Soil Mechanics and Geotechnical Engineering, Toronto, ON, USA, 2–6 October 2011; Volume 2. [Google Scholar]
  88. Vanapalli, S.K.; Mohamed, F.M. Bearing capacity and settlement of footings in unsaturated sands. Geomate J. 2013, 5, 595–604. [Google Scholar] [CrossRef]
Figure 1. Geology of the Düzce–Bolu Region, Active Faults and Destructive Earthquakes. [50]).
Applsci 15 05271 g001
Figure 2. Location of the work area.
Applsci 15 05271 g002
Figure 3. A cross-sectional representation of the borehole and seismic survey locations across the study area.
Applsci 15 05271 g003
Figure 4. Linear prediction model and R2 value for Bearing Capacities.
Applsci 15 05271 g004
Figure 5. Quadratic prediction model and R2 value for Bearing Capacities.
Applsci 15 05271 g005
Figure 6. Cubic estimation model and R2 value for Bearing Capacities.
Applsci 15 05271 g006
Figure 7. Linear prediction model and R2 value for Settlement.
Applsci 15 05271 g007
Figure 8. Quadratic prediction model and R2 value for Settlement.
Applsci 15 05271 g008
Figure 9. Cubic estimation model and R2 value for Settlement.
Applsci 15 05271 g009
Table 1. Descriptive statistics of soil test results.
NRangeMin.Max.Mean Std.
Error
Std.
Deviation
Variance
Soil Bearing Capacity (MPa)273.762.225.983.50520.197521.026351.053
Settlement (cm)273.550.003.552.29640.149570.747830.559
Excavation Level (m)271.501.503.002.00000.138680.720580.519
Groundwater Level (m)275.002.007.003.94440.230101.195611.429
Unit Volume Weight (g/cm3)270.401.732.131.89000.019630.101980.010
Water Content (%)2717.910.0017.919.14520.806884.1926617.578
Sieve No. 10 (2.0 mm)2718.7043.8062.5051.30831.865626.4627141.767
Sieve No. 200 (0.074 mm)2788.700.0088.7017.60813.6049018.73159350.872
Internal Friction Angle (ø)2720.000.0020.0012.93841.280656.4032641.002
Cohesion Coefficient (MPa)27108711540.876.37029.877892.620
“N” shown in the table represents the number of samples taken from 27 boreholes. Range shows the ranges of “Range = maximum-minimum” values, “Mean” shows the average values of the data, “Std-error” shows the standard error of the mean, Std-Deviation shows the standard deviation, and Variance shows the variance value.
Table 2. Correlation ranges and relationship levels.
Correlation Range
(Can Be + and – Values)
Level of Relationship
0.00–0.25Very weak relationship
0.26–0.49Weak relationship
0.50–0.69Moderate relationship
0.70–0.89High relationship
0.90–1.00Very high relationship
Table 3. Correlation analysis results for Bearing Capacity.
Bearing
Capacity
(MPa)
Excavation Level (m)Ground
Water
Level
(m)
Unit
Volume
Weight
(g/cm3)
Water
Content
(%)
Sieve
No. 10
(2 mm)
Sieve No.
200
(0.074 mm)
Internal
Friction
Angle
Cohesion
Coefficient
Bearing
Capacity
(MPa)
Correlation10.033−0.146−0.0780.2720.1320.356−0.0390.163
Sig. 0.8710.4680.6990.1700.6820.0690.8530.468
N272727272727272727
Excavation
Level
(m)
Correlation0.03310.0670.047−0.121−0.3470.1450.036−0.094
Sig. 0.871 0.7400.8160.5470.2700.4710.8640.676
N272727272727272727
Ground
water
level (m)
Correlation−0.1460.0671−0.457 *−0.094−0.642 *0.323−0.2250.190
Sig0.4680.740 0.0160.6390.0240.1010.2790.397
N272727272727272727
Unit Vol.
Weight
(g/cm3)
Correlation−0.0780.047−0.457 *10.0510.632 *−0.2970.402 *−0.210
Sig.0.6990.8160.016 0.8020.0280.1320.0460.347
N272727272727272727
Water
Content
(%)
Correlation0.272−0.121−0.0940.05110.297−0.1580.2690.028
Sig.0.1700.5470.6390.802 0.3480.4310.1930.903
N272727272727272727
Sieve
No. 10
(2 mm)
Correlation0.132−0.347−0.642 *0.632 *0.2971−0.687 *−0.588 *−0.596 *
Sig. 0.6820.2700.0240.0280.348 0.0140.0440.041
N272727272727272727
Sieve
No. 200
(0.074 mm)
Correlation0.3560.1450.323−0.297−0.158−0.687 *1−0.567 **−0.010
Sig.0.0690.4710.1010.1320.4310.014 0.0030.963
N272727272727272727
Internal
Friction
Angle (ø)
Correlation−0.0390.036−0.2250.402 *0.269−0.588 *−0.567 **10.322
Sig.)0.8530.8640.2790.0460.1930.0440.003 0.144
N272727272727272727
Cohesion
Coefficient
(MPa)
Correlation0.163−0.0940.190−0.2100.028−0.596 *−0.0100.3221
Sig.0.4680.6760.3970.3470.9030.0410.9630.144
N272727272727272727
*: Correlation is significant at the 0.05 level (2-tailed); **: Correlation is significant at the 0.01 level (2-tailed).
Table 4. Multiple linear regression analysis results for Bearing Capacity.
Model Summary b
ModelRR
Square
Adjusted
R Square
Std. Error of
the Estimate
Change Statistics
R Square
Change
F
Change
df1df2Sig. F
Change
10.678 a0.460−0.9791.293450.4600.320830.912
a: Predictors: (Constant), cohesion, sieve no. 200, water content, excavation level, sieve no. 10, unit volume weight, groundwater level, internal friction angle; b: Dependent Variable: Bearing Capacity.
Table 5. ANOVA results for Bearing Capacity.
ANOVA a
ModelSum of SquaresdfMean SquareFSig.
1Regression4.27980.5350.3200.912 b
Residual5.01931.673
Total9.29811
a: Dependent Variable: Bearing Capacity; b: Predictors: (Constant), cohesion, sieve no. 200, water content, excavation level, sieve no. 10, unit volume weight, groundwater level, internal friction angle.
Table 6. Multiple regression analysis results to predict Bearing Capacities.
Coefficients a
ModelUnstandardized
Coefficients
Standardized
Coefficients
tSig.95% Confidence
Interval for B
BStd. ErrorBeta Lower BoundUpper Bound
1(Constant)−16.430124.229 −0.1320.903−411.784378.923
Excavation level0.4711.9860.3790.2370.828−5.8496.792
Groundwater level2.2026.5191.2980.3380.758−18.54522.950
Unit weight10.09435.0700.6830.2880.792−101.514121.702
Water content−0.0880.194−0.428−0.4540.681−0.7050.529
Sieve No. 100.1250.1220.8791.0290.379−0.2620.512
Sieve No. 2000.2720.2020.9371.3460.271−0.3710.915
Internal friction angle−1.62812.123−3.138−0.1340.902−40.20836.951
Cohesion0.1101.0452.1600.1060.923−3.2143.435
a: Dependent Variable: Bearing Capacity.
Table 7. Correlation analysis results for Settlement.
SettlementExcavation
Level
Groundwater
Level
Unit
Volume
Weight
Water
Content
Sieve
No. 10
Sieve
No. 200
Internal
Friction
Angle
Cohesion
Coefficient
SettlementCorrelation1−0.402 *0.004−0.240−0.052−0.303−0.310−0.0020.334
Sig. 0.0460.9860.2470.8060.3380.1320.9930.150
N272727272727272727
Excavation
Level
Correlation−0.402 *10.0670.047−0.121−0.3470.1450.036−0.094
Sig. 0.046 0.7400.8160.5470.2700.4710.8640.676
N272727272727272727
Ground water
Level
Correlation0.0040.0671−0.457 *−0.094−0.642 *0.323−0.2250.190
Sig0.9860.740 0.0160.6390.0240.1010.2790.397
N272727272727272727
Unit
Volume
Weight
Correlation−0.2400.047−0.457 *10.0510.632 *−0.2970.402 *−0.210
Sig.0.2470.8160.016 0.8020.0280.1320.0460.347
N272727272727272727
Water
Content
Correlation−0.052−0.121−0.0940.05110.297−0.1580.2690.028
Sig.0.8060.5470.6390.802 0.3480.4310.1930.903
N272727272727272727
Sieve
No. 10
Correlation−0.303−0.347−0.642 *0.632 *0.2971−0.687 *−0.588 *−0.596 *
Sig. 0.3380.2700.0240.0280.348 0.0140.0440.041
N272727272727272727
Sieve
No. 200
Correlation−0.3100.1450.323−0.297−0.158−0.687 *1−0.567 **−0.010
Sig.0.1320.4710.1010.1320.4310.014 0.0030.963
N272727272727272727
Internal
Friction
Angle
Correlation−0.0020.036−0.2250.402 *0.269−0.588 *−0.567 **10.322
Sig.)0.9930.8640.2790.0460.1930.0440.003 0.144
N272727272727272727
Cohesion
Coefficient
Correlation0.334−0.0940.190−0.2100.028−0.596 *−0.0100.3221
Sig.0.1500.6760.3970.3470.9030.0410.9630.144
N272727272727272727
*: Correlation is significant at the 0.05 level (2-tailed); **: Correlation is significant at the 0.01 level (2-tailed).
Table 8. Multiple linear regression analysis results for Settlement.
Model Summary b
ModelRR
Square
Adjusted
R Square
Std. Error of
the Estimate
Change Statistics
R Square ChangeF
Change
df1df2Sig.
F Change
10.920 a0.8460.4350.248820.8462.058830.299
a: Predictors: (Constant), cohesion, sieve no. 200, water content, excavation level, sieve no. 10, unit volume weight, groundwater level, internal friction angle; b: Dependent Variable: Settlement.
Table 9. Analysis of Variance (ANOVA) results for Settlement.
ANOVA a
ModelSum of SquaresdfMean SquareFSig.
1Regression1.01980.1272.0580.299 b
Residual0.18630.062
Total1.20511
a: Dependent variable: Settlement; b: Predictor Parameters: (Constant), cohesion, sieve no. 200, water content, excavation level, sieve no. 10, unit volume weight, groundwater level, internal friction angle.
Table 10. Multiple regression analysis results to predict Settlement.
Coefficients a
ModelUnstandardized
Coefficients
Standardized
Coefficients
tSig.95% Confidence
Interval for B
BStd. ErrorBeta Lower BoundUpper Bound
1(Constant)2.30423.898 0.0960.929−73.75078.358
Excavation level−0.1220.382−0.271−0.3180.771−1.3381.094
Groundwater level−1.6731.254−2.739−1.3340.274−5.6642.318
Unit weight−13.4946.746−2.536−2.0000.139−34.9647.976
Water content0.0670.0370.9081.8020.169−0.0510.186
Sieve No. 10−0.0570.023−1.114−2.4390.093−0.1310.017
Sieve No. 200−0.0620.039−0.589−1.5820.212−0.1850.062
Internal friction angle3.6172.33219.3661.5510.219−3.80411.039
Cohesion−0.3480.201−18.907−1.7300.182−0.9870.292
a: Dependent Variable: Settlement.
Disclaimer/Publisher’s Note: The statements, opinions and data contained in all publications are solely those of the individual author(s) and contributor(s) and not of MDPI and/or the editor(s). MDPI and/or the editor(s) disclaim responsibility for any injury to people or property resulting from any ideas, methods, instructions or products referred to in the content.