Article

Analysis of Buffeting Response and Stay Cable Fatigue Damage in Super-Long-Span Carbon Fiber-Reinforced Polymer (CFRP) Cable-Stayed Bridges

School of Civil Engineering and Architecture, Hainan University, Haikou 570228, China
*
Author to whom correspondence should be addressed.
Appl. Sci. 2025, 15(10), 5267; https://doi.org/10.3390/app15105267
Submission received: 12 April 2025 / Revised: 28 April 2025 / Accepted: 30 April 2025 / Published: 9 May 2025
(This article belongs to the Section Civil Engineering)

Abstract

:
As the span of cable-stayed bridges continues to increase, traditional steel cables face challenges such as excessive self-weight, significant sag effects, and sensitivity to wind-induced vibrations. This study proposes two super-long-span cable-stayed bridge schemes with a main span length of 1500 m and identical girder cross-sections, employing steel cables and CFRP cables, respectively. Based on a discretized finite element model of stay cables, the global dynamic responses, cable vibration characteristics, and fatigue performance of both schemes were systematically evaluated using time-domain buffeting analysis and Miner’s linear fatigue damage accumulation theory. The results demonstrate that CFRP cables, benefiting from their lightweight and high-strength properties, significantly reduce the vertical, lateral, and torsional RMS responses of the main girder under the critical 3° angle of attack, achieving reductions of 31.6%, 28.5%, and 20.6% at mid-span, respectively. Additionally, CFRP cables suppress cable–girder internal resonance through frequency decoupling. Fatigue analysis reveals that the annual fatigue damage of CFRP cables under the design wind speed is far lower than that of steel cables and remains well below the critical threshold, highlighting their superior fatigue resistance. This research confirms that CFRP cables can effectively enhance the aerodynamic stability and long-term durability of super-long-span cable-stayed bridges, providing theoretical support for span breakthroughs. To further ensure long-term service safety, this study recommends implementing damping measures at critical cable locations.

1. Introduction

With the increasing demand for long-span bridge construction, cable-stayed bridges and suspension bridges have emerged as the primary structural systems for achieving breakthroughs in span length. Compared to suspension bridges, cable-stayed bridges possess greater resistance stiffness, offering superior performance under wind loads while maintaining significant economic competitiveness for spans around 1400 m [1,2]. In cable-stayed bridge systems, the stay cables serve as critical load-bearing components, transferring deck loads to the pylons and ultimately to the pylon foundations.
However, as the main spans of cable-stayed bridges continue to expand, the self-weight of traditional steel wire cables increases exponentially with cable length. This results in pronounced sag effects that drastically reduce the equivalent elastic modulus of the cables, significantly degrading their mechanical performance [3,4]. Furthermore, the growing cable diameter and cross-sectional area with increasing length and tensile force amplify aerodynamic drag, heightening the risks of wind-induced structural damage. Additionally, the enhanced structural flexibility of super-long-span cable-stayed bridges leads to dense overlaps between cable and structural vibration modes, rendering the system highly sensitive to wind-induced vibrations [5,6]. This susceptibility may trigger parametric oscillations or internal resonance in the cables, causing fatigue damage at cable anchorage zones and compromising service life [7].
Carbon fiber-reinforced polymer (CFRP) cables demonstrate notable advantages over steel cables, including high strength-to-weight ratio, corrosion resistance, and low thermal conductivity [8]. Its application reduces the dead load proportion of cables, decreases overall aerodynamic loads, and elevates cable natural vibration frequencies. Consequently, replacing steel cables with CFRP stay cables presents substantial potential for achieving span-length breakthroughs in super-long-span cable-stayed bridges.
Over the past few decades, CFRP materials have been extensively researched. Meier [9] proposed conceptual designs over three decades ago, yet progress in applying CFRP stay cables to long-span bridge structures remain slow and limited. The world’s first CFRP cable-stayed bridge, the Storchen-brücke Bridge [10], features a single pylon and a 63 m main span. Subsequently, CFRP stay cables have seen incremental applications in bridge engineering, including the Herning Footbridge [11]; the Laroin Cable-Stayed Footbridge [12] with a 110 m single span; and Jiangsu University Footbridge [13] in China, the country’s first such structure with a 30 m main span. To date, practical implementations of CFRP stay cables have been restricted to pedestrian bridges and short-span road bridges, which operate under low load levels and simplified design conditions. Consequently, these applications offer limited reference value for the construction and implementation of long-span or mega-span cable-stayed bridges. Although existing studies have explored ultra-long-span CFRP cable-stayed bridges, most focus on preliminary analyses of static and dynamic performance [14,15,16]. In particular, the research on aerodynamic behavior often neglects the geometric nonlinearity of stay cables, instead simplifying them as single-truss models using the equivalent elastic modulus method [17]. This simplification introduces significant inaccuracies in computational results [18].
To investigate these issues, this study establishes a 1500 m main-span cable-stayed bridge with steel girders and steel stay cables as the baseline configuration. By replacing steel cables with CFRP counterparts while maintaining identical span arrangements, two comparative schemes are developed: a CFRP cable-stayed bridge and a conventional steel cable-stayed bridge. A systematic comparison is conducted to analyze the global buffeting responses and cable vibration characteristics of both schemes. Furthermore, the fatigue damage in CFRP stay cables under long-term turbulent wind loads is quantitatively evaluated. Through this methodology, the operational performance of CFRP materials in super-long-span cable-stayed bridges is rigorously demonstrated from the perspective of wind-induced vibrations. A detailed flowchart outlining the analysis steps of this study is shown in Figure 1.

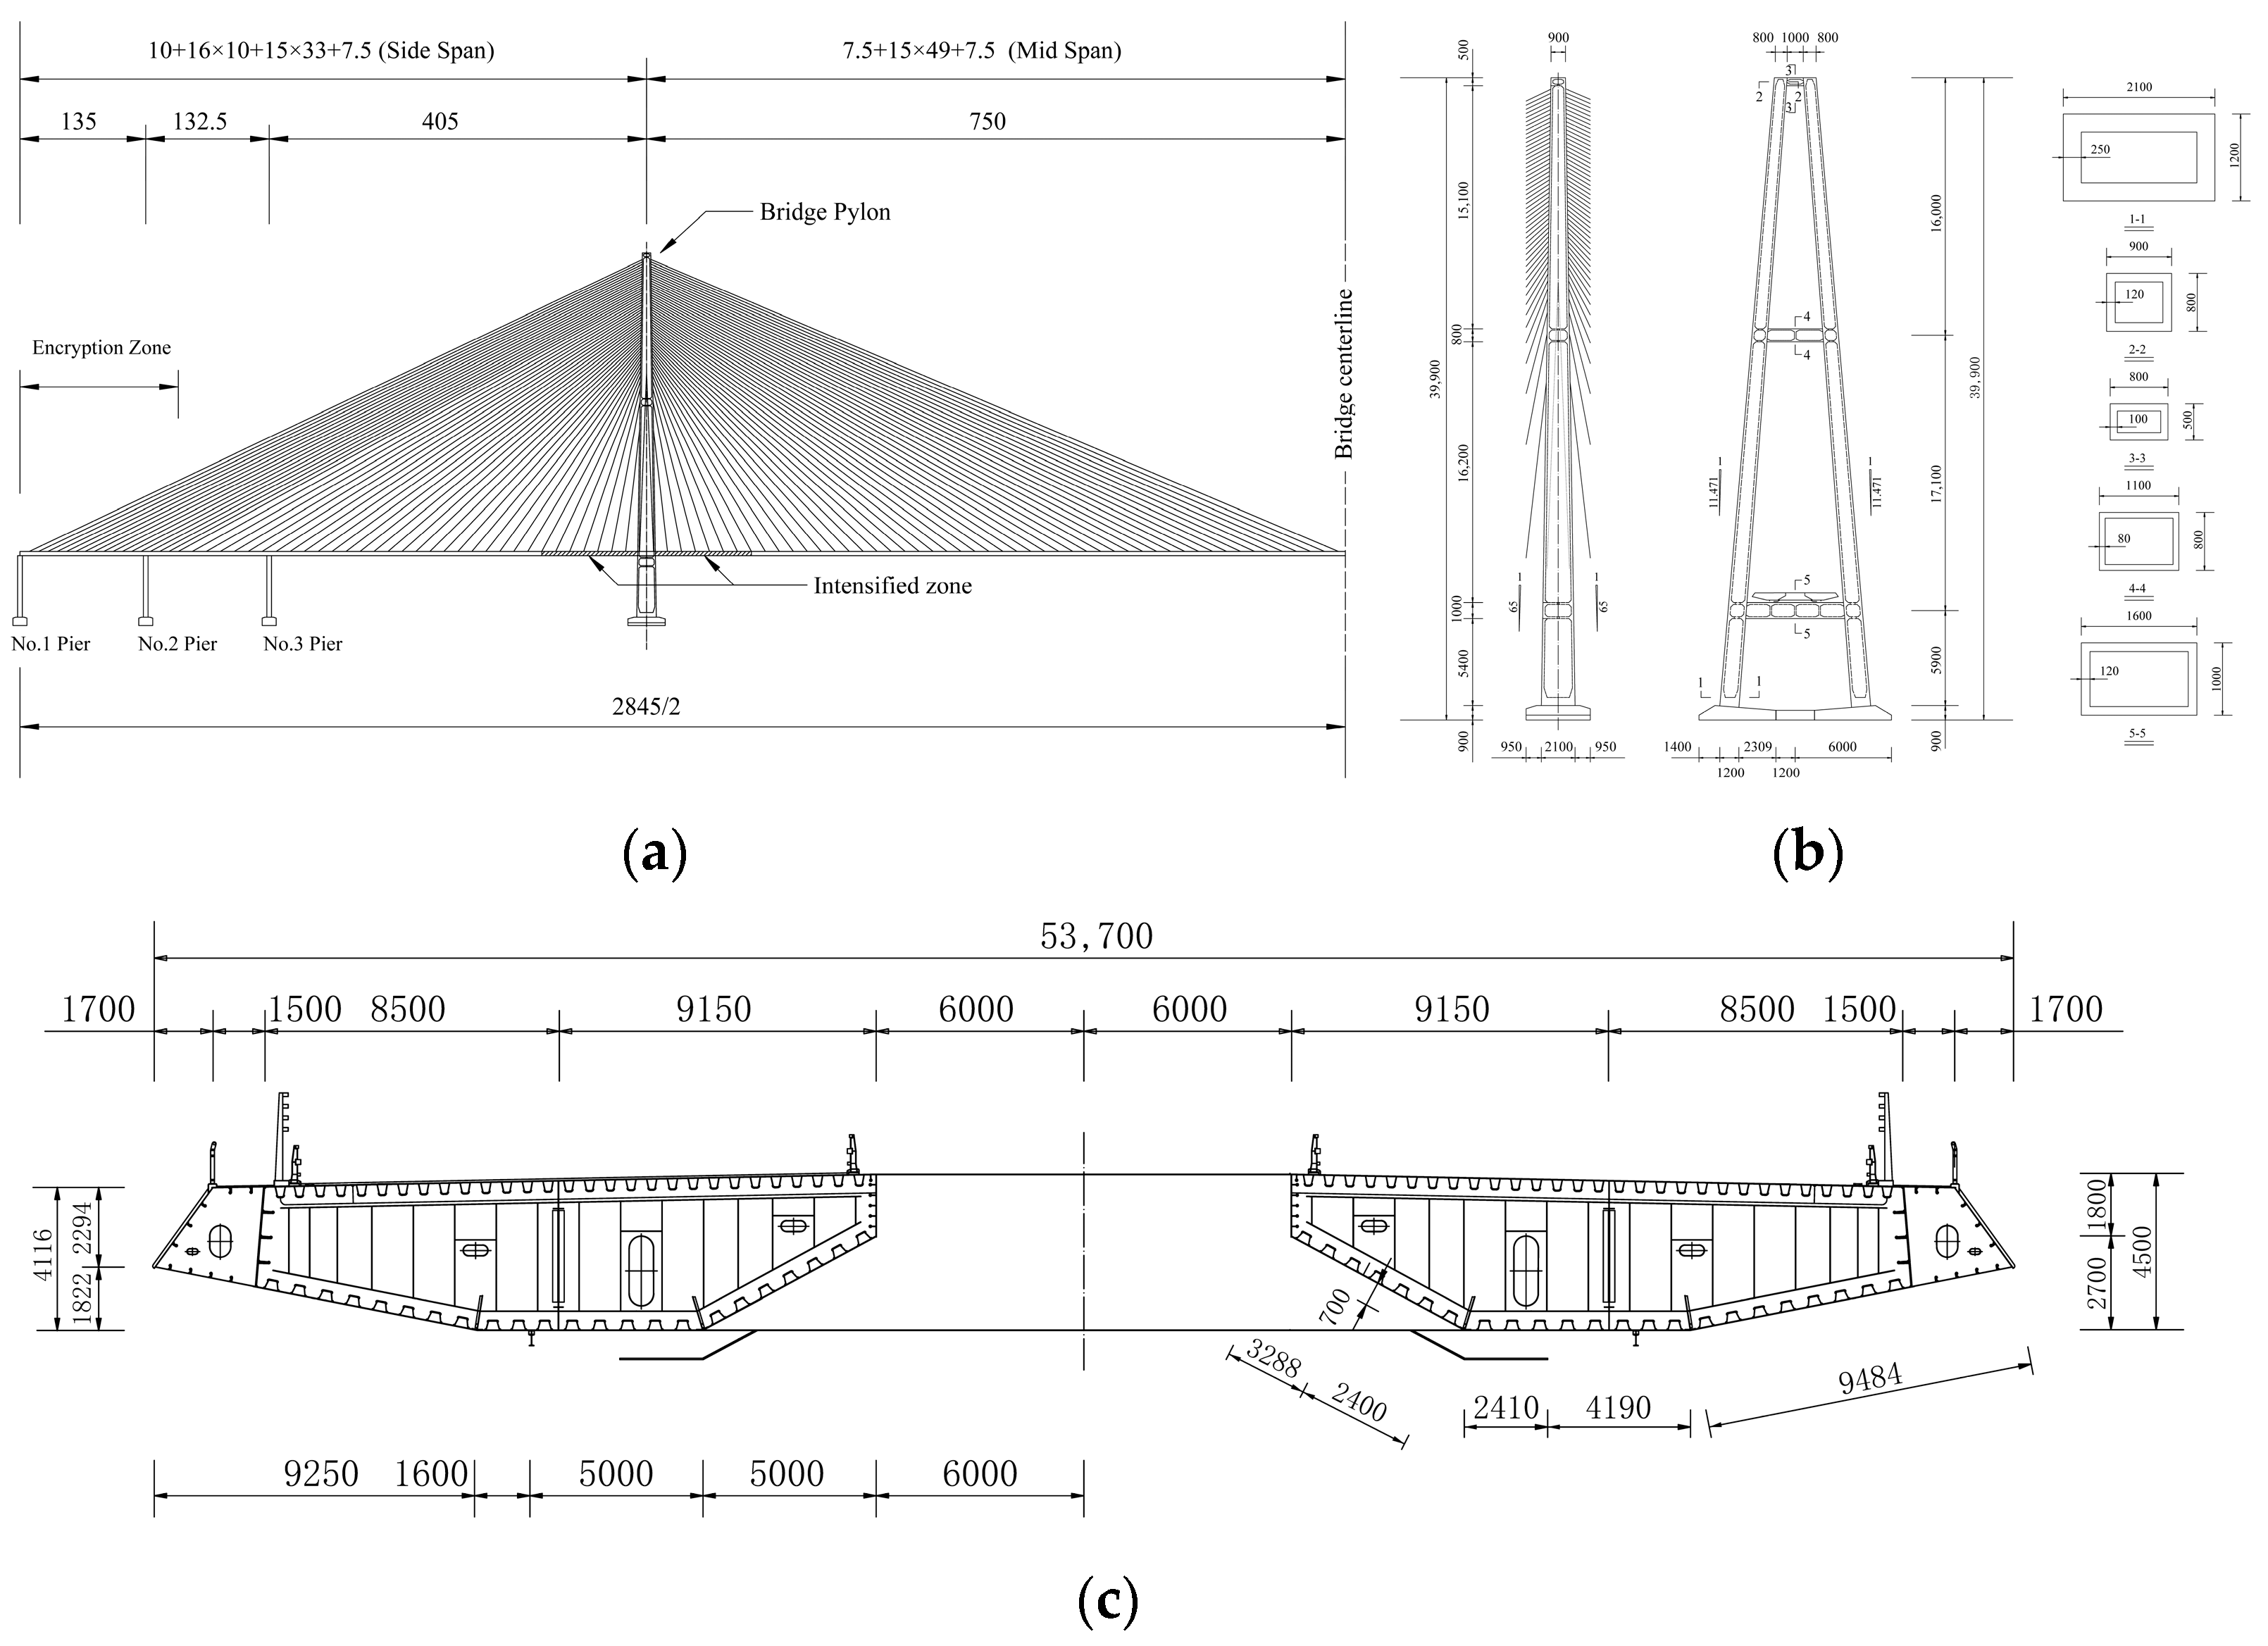
2. Structure Description

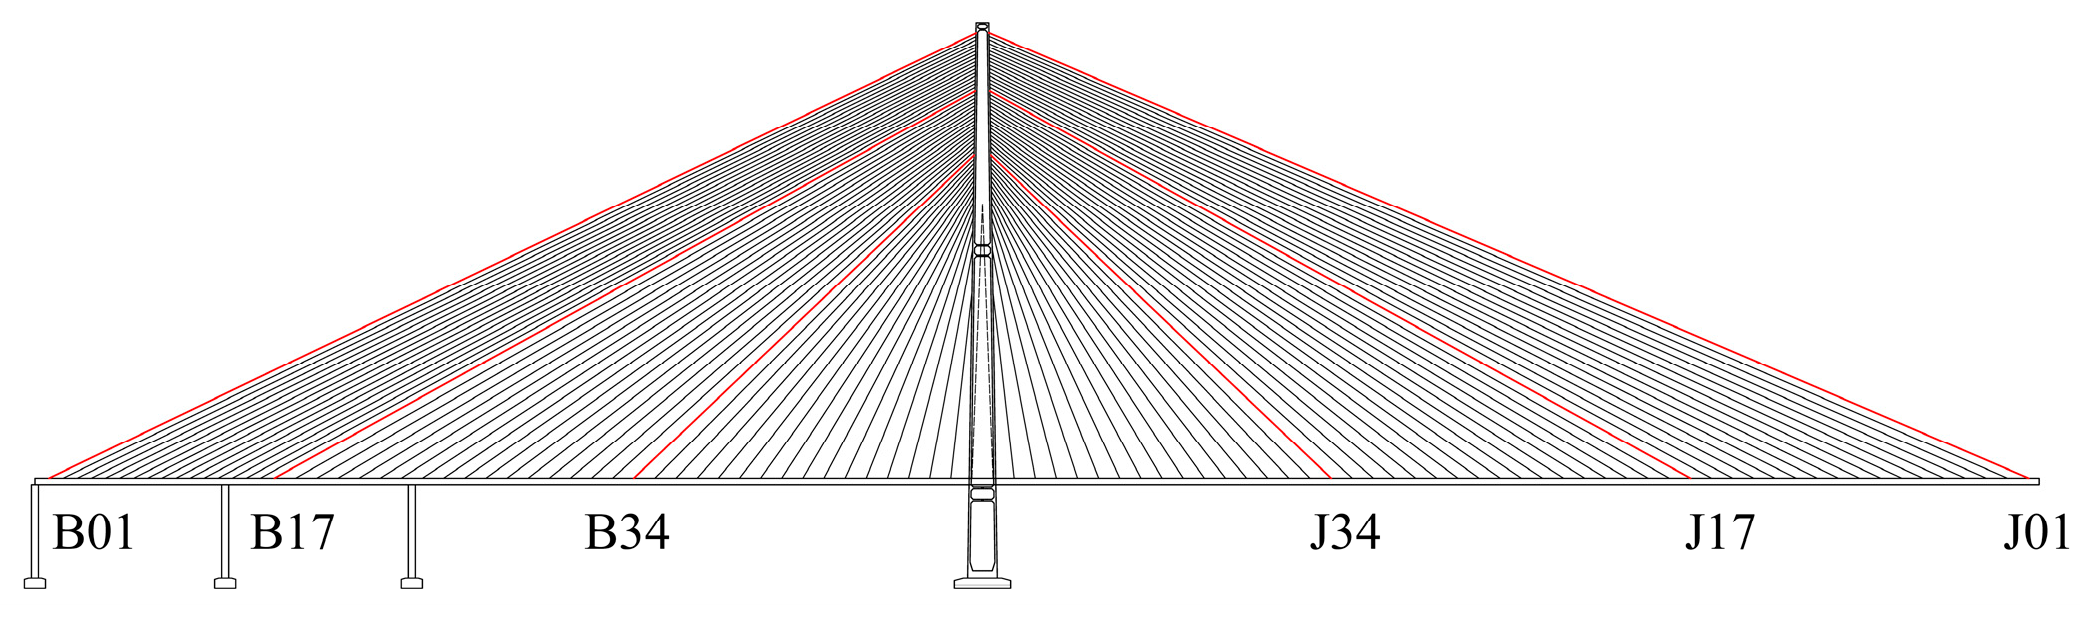
2.1. General Information of the Bridge Scheme with Steel Cable

As illustrated in Figure 2, the cable-stayed bridge featured a main span of 1500 m, supported by an A-shaped concrete pylon with a total height of 390 m, of which 320 m extended above the bridge deck. The pylon-to-span ratio and side-to-main span ratio were 0.26 and 0.448, respectively. Three auxiliary piers were installed in each side span. The stay cables were constructed using 1860-grade high-strength steel wires, while the steel girders employed Q345 steel.
The main girder adopted a flat twin streamlined box girder configuration with a width of 53.7 m and a height of 4.5 m. Both the top and bottom plates of the girder incorporated U-shaped stiffeners, and internal diaphragms with a thickness of 10 mm were installed at regular 4 m intervals. To address the progressive accumulation of axial forces, the girder was divided into standard zones and reinforced zones, with the latter extending 112.5 m on either side of the pylons.
The standard horizontal spacing of the stay cables was 15 m, which reduced to 10 m in densified cable regions near the side spans. The bridge was equipped with a total of 4 × 100 stay cables, designated from B1 to J1, where ‘B’ denotes side span cables and ‘J’ indicates main span cables.

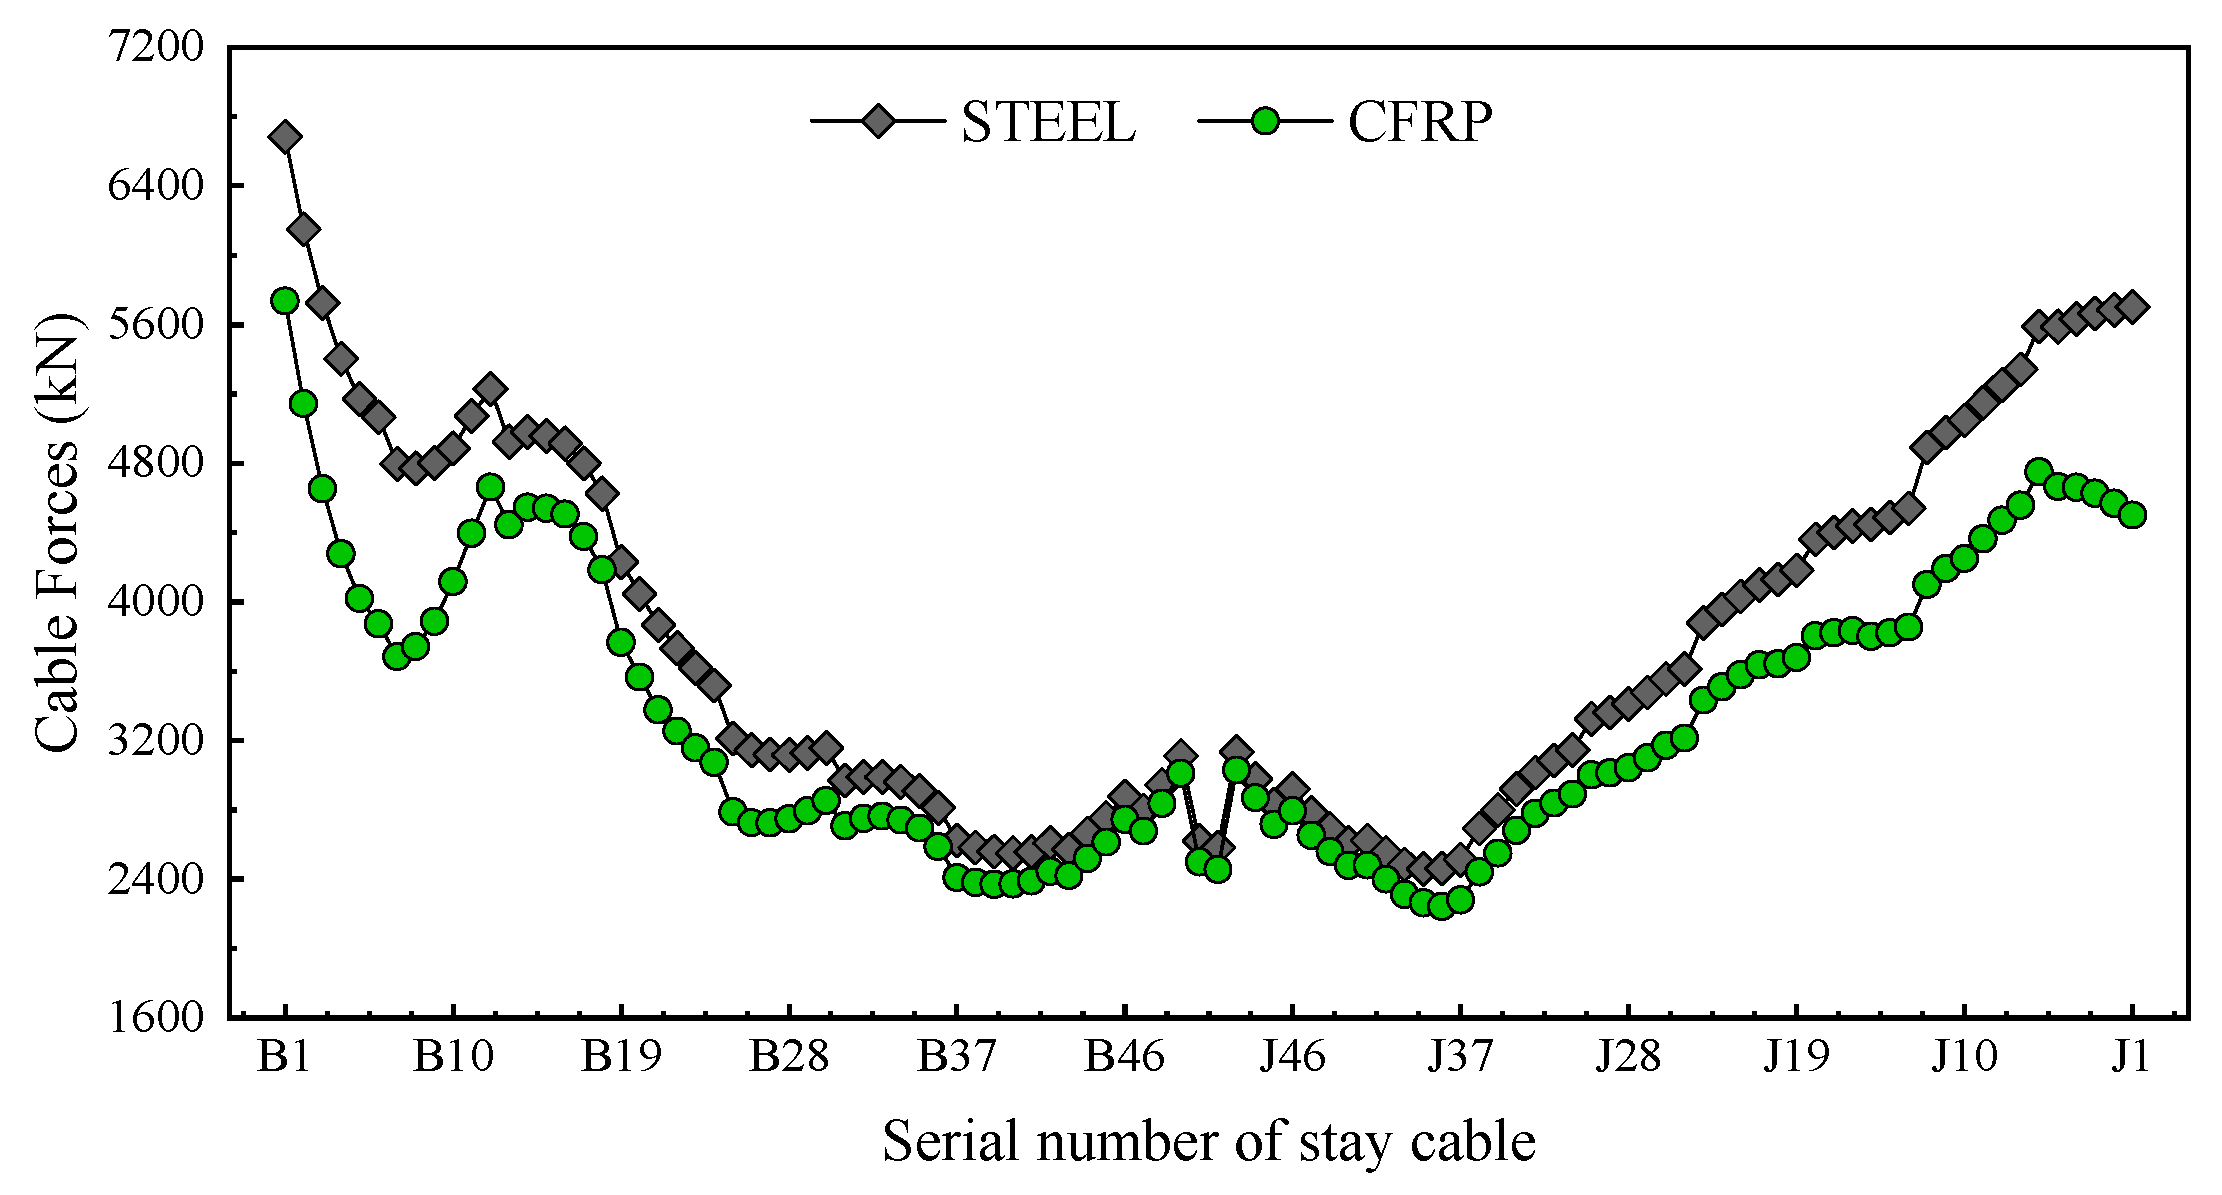
2.2. Bridge Scheme with CFRP Cable

When replacing steel stay cables, either the equal-stiffness principle or the equal-strength principle can be adopted. This approach effectively mitigates the geometric nonlinearity induced by the sag effect of cables. To fully utilize the high-strength properties of CFRP materials, this study adopted the equal-strength replacement principle:
A C = [ σ ] S A S / [ σ ] C
where A C and A S represent the cross-sectional areas of the CFRP and steel cables, respectively, and [ σ ] C and [ σ ] S denote the allowable stress values of the CFRP and steel cables. The safety factor for steel cables was set to 2.5, while that for CFRP cables was 3 [19,20].
After replacement, the cross-sectional area of the CFRP cables was approximately 1.32 times that of the steel cables. Figure 3 compares the cross-sectional area and diameter of stay cables between the two schemes. The ratios of cross-sectional equivalent elastic [21] modulus to original values under sag effects for both cable types are shown in Figure 4. As illustrated in Figure 4, the equivalent elastic modulus reduction of steel cables was significantly influenced by the cable length, horizontal inclination, and initial cable force. The minimum ratio occurred at the mid-span J1 cable, reaching 0.58, indicating a reduction of approximately 42% in elastic modulus under dead load. In contrast, the CFRP cables exhibited excellent performance, with their elastic modulus nearly unaffected by sag effects. The ratio of equivalent elastic modulus to the original value for the entire bridge remained close to 1.0, and, even at the longest cable J1, the ratio was 0.982, corresponding to a mere 2% reduction.

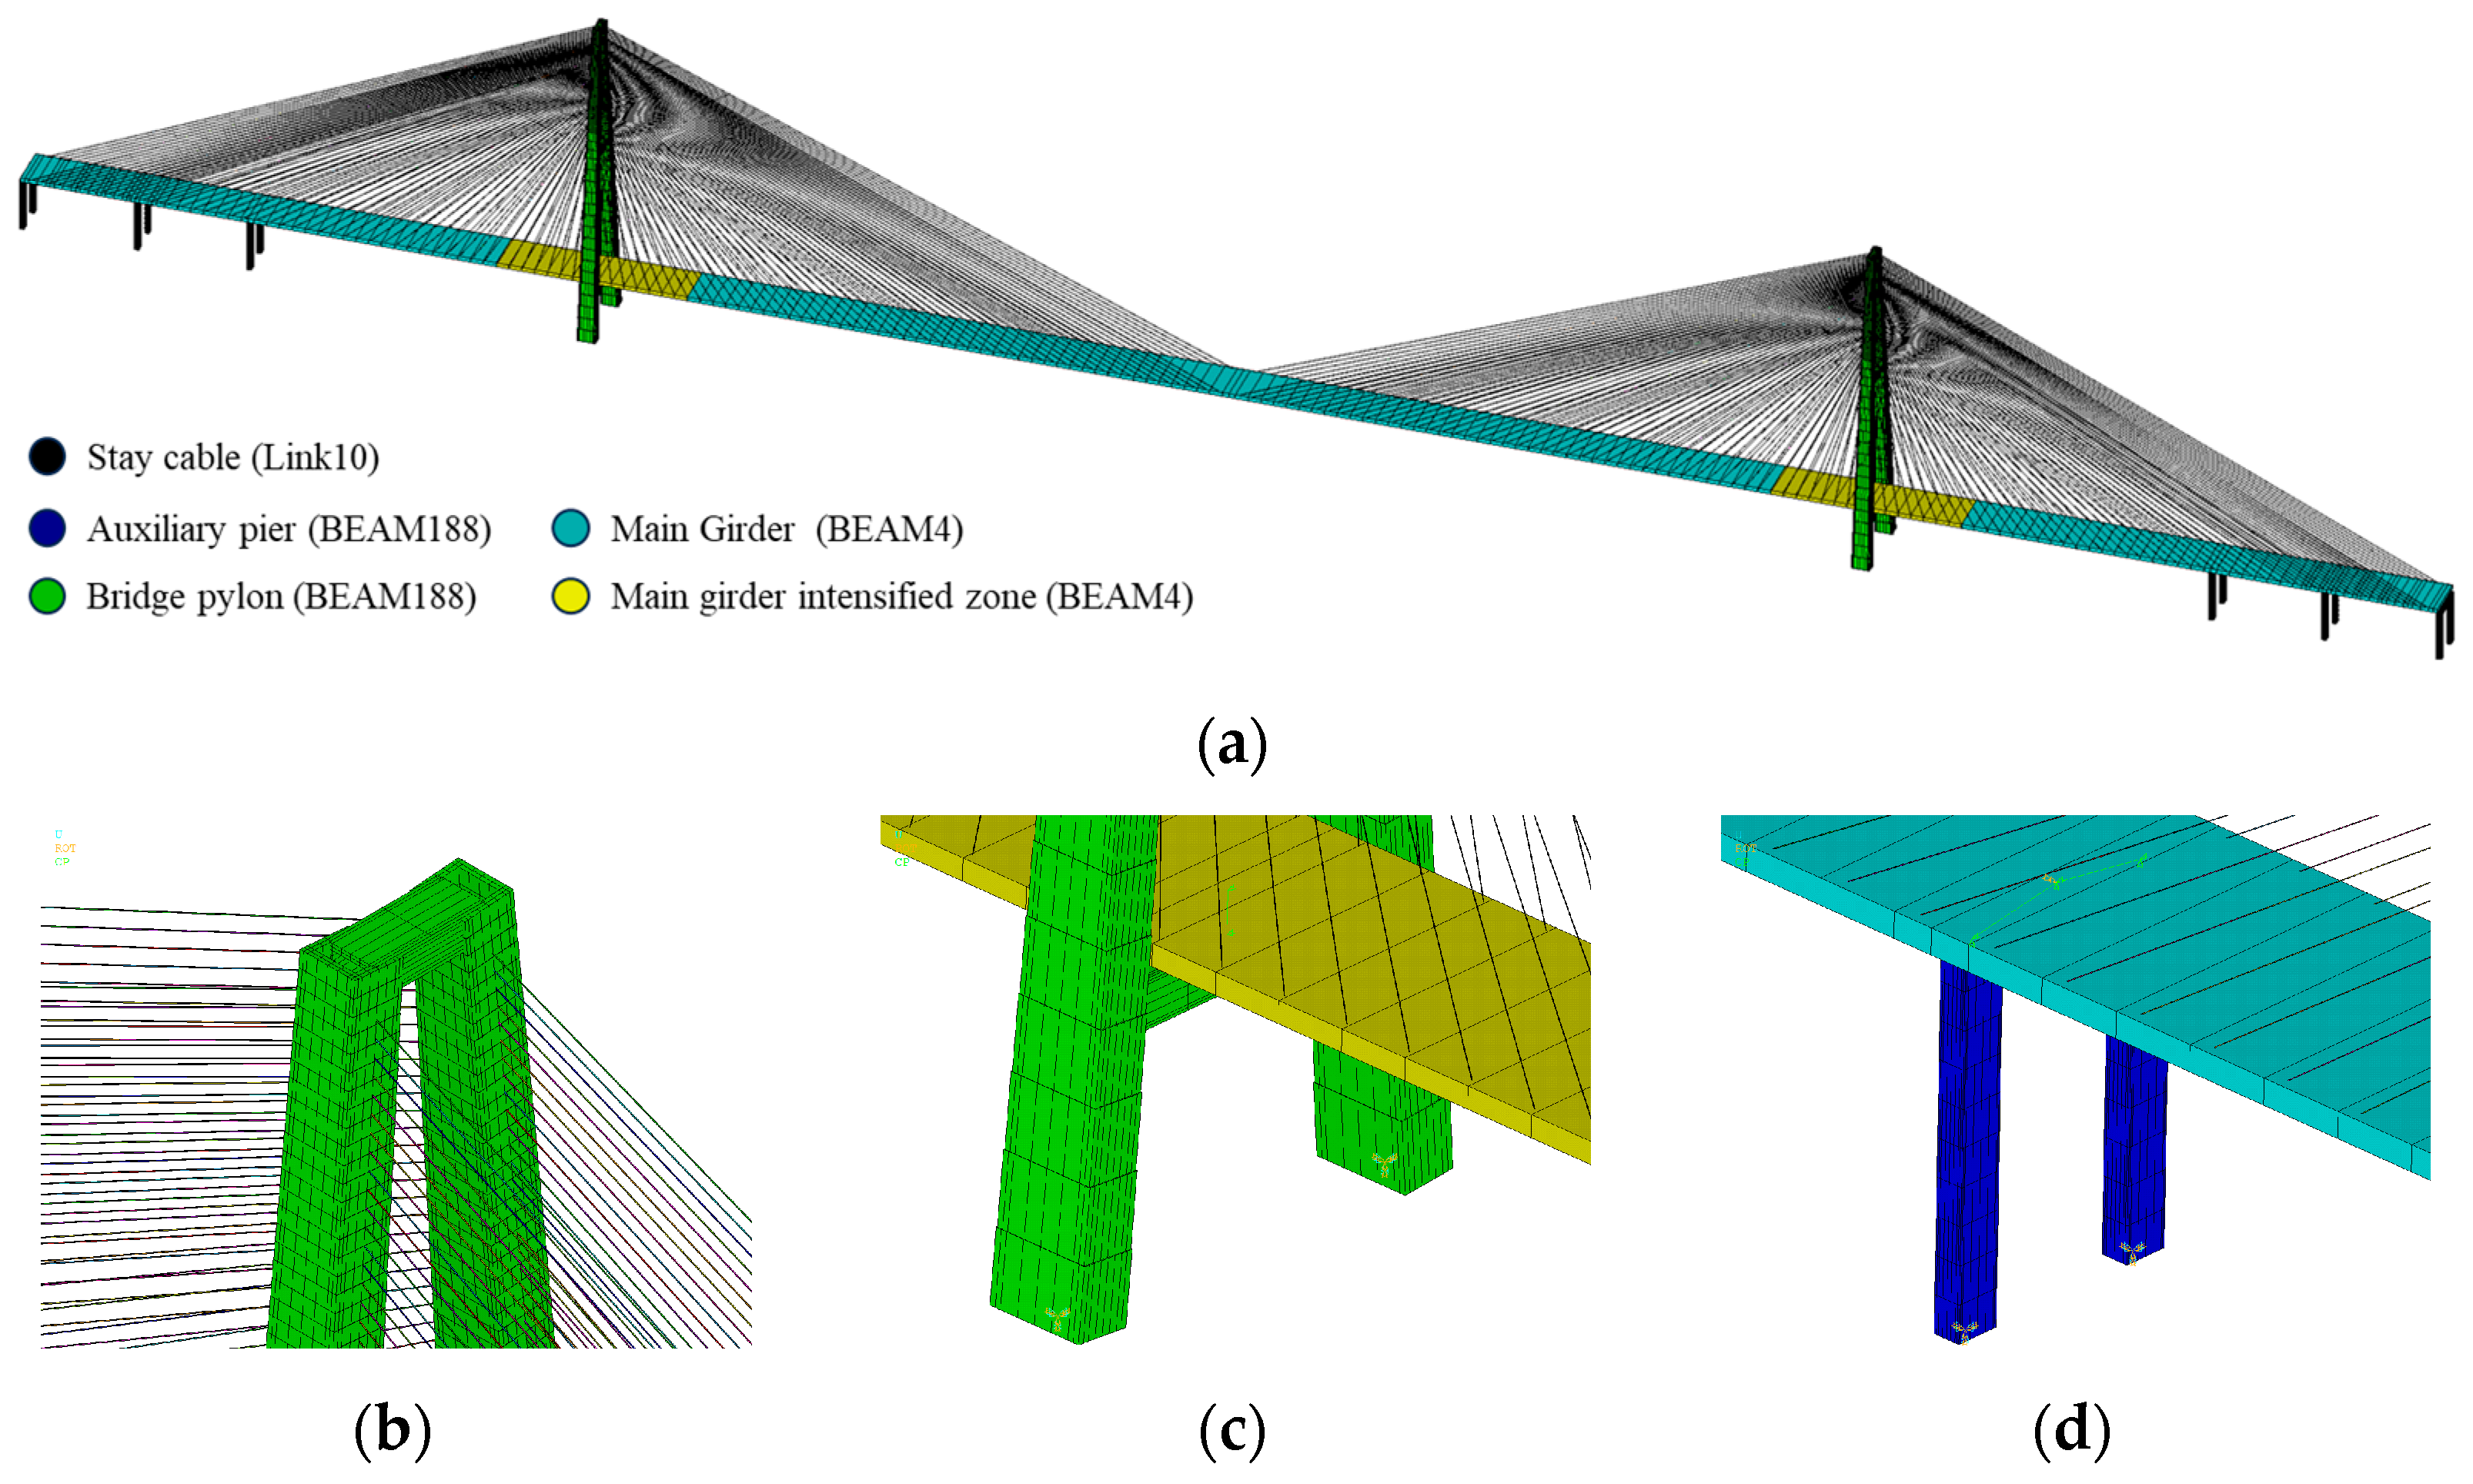
2.3. The FE Model Construction

This study used a single-beam fishbone model to simulate the cable-stayed bridge system. Based on the parameters listed in Table 1, finite element models for two types of schemes were established using ANSYS 2021. Among them, the pylon and auxiliary pier were modeled using Timoshenko beam elements (BEAM188), while the main beam was modeled using Euler–Bernoulli beam elements (BEAM4). The stay cable was simulated using LINK10 units divided into 10 segments. The structure was a fully floating system, so only lateral wind-resistant bearings were provided between the pylon and the main beam, allowing the main beam to undergo longitudinal displacement relative to the pylon and auxiliary piers. The weight of the bridge deck system and the main beam diaphragm was simulated using the MASS21 mass unit. This model contained a total of 4657 nodes and 5254 units, as shown in Figure 5.
After performing cable tension adjustment and optimization in Midas Civil 2022 using the stiffness reduction method and unknown load factor method, the final cable force distributions for both schemes under identical dead load conditions are shown in Figure 6. The results demonstrate that, compared with the steel cable scheme, the CFRP cable scheme exhibited significantly reduced cable forces in long-span cables, while short cables showed only minor force reductions. This phenomenon primarily stems from the substantially higher self-weight of steel cables compared with CFRP cables. To counteract their own weight, steel cables require significantly higher initial stresses, leading to a sharp increase in cable forces as the cable length increases.

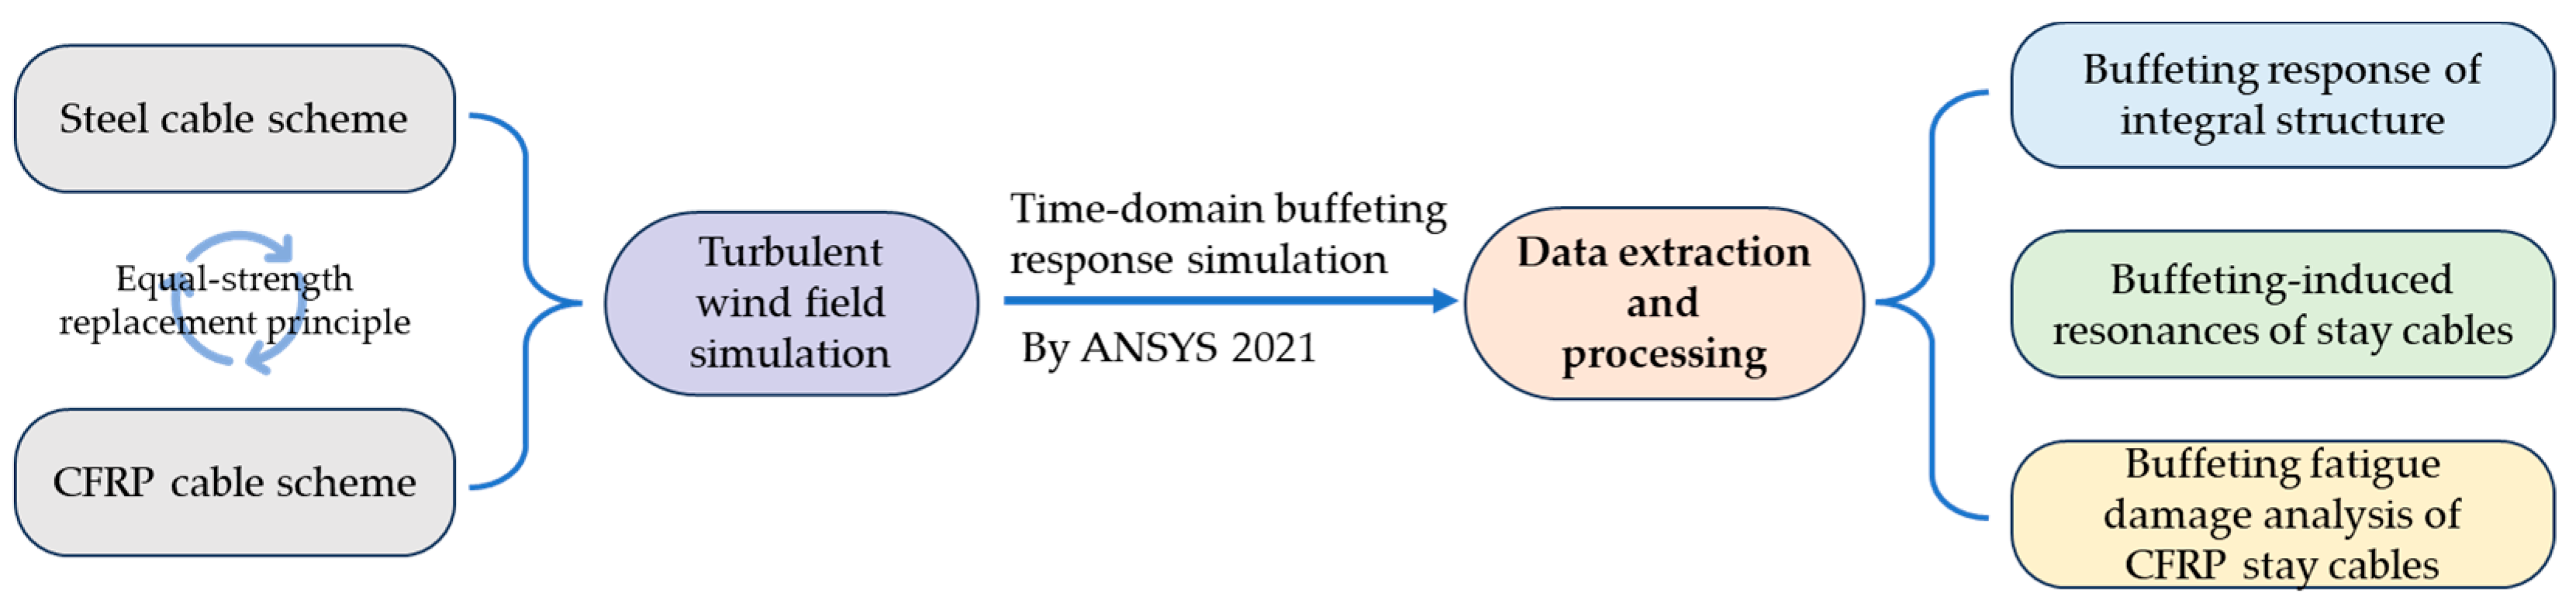
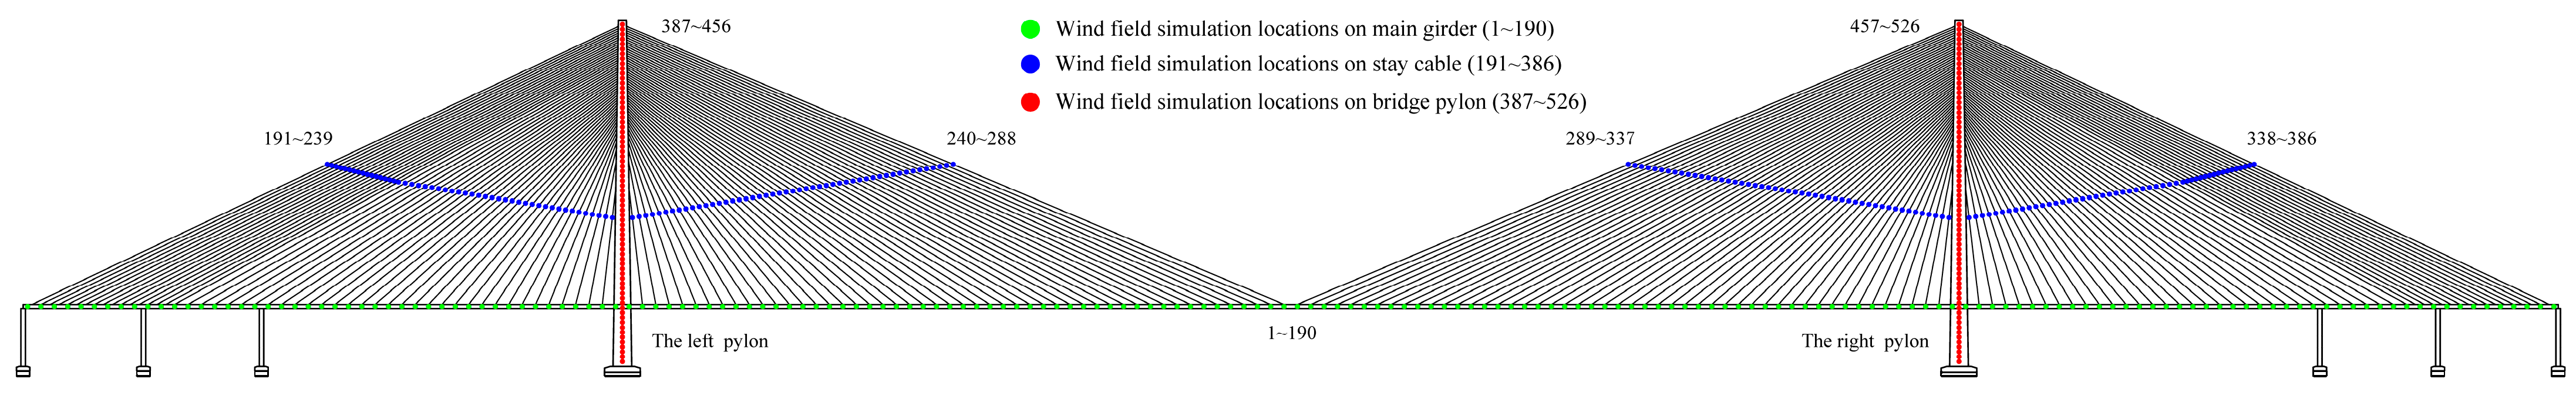
3. Wind Load Description

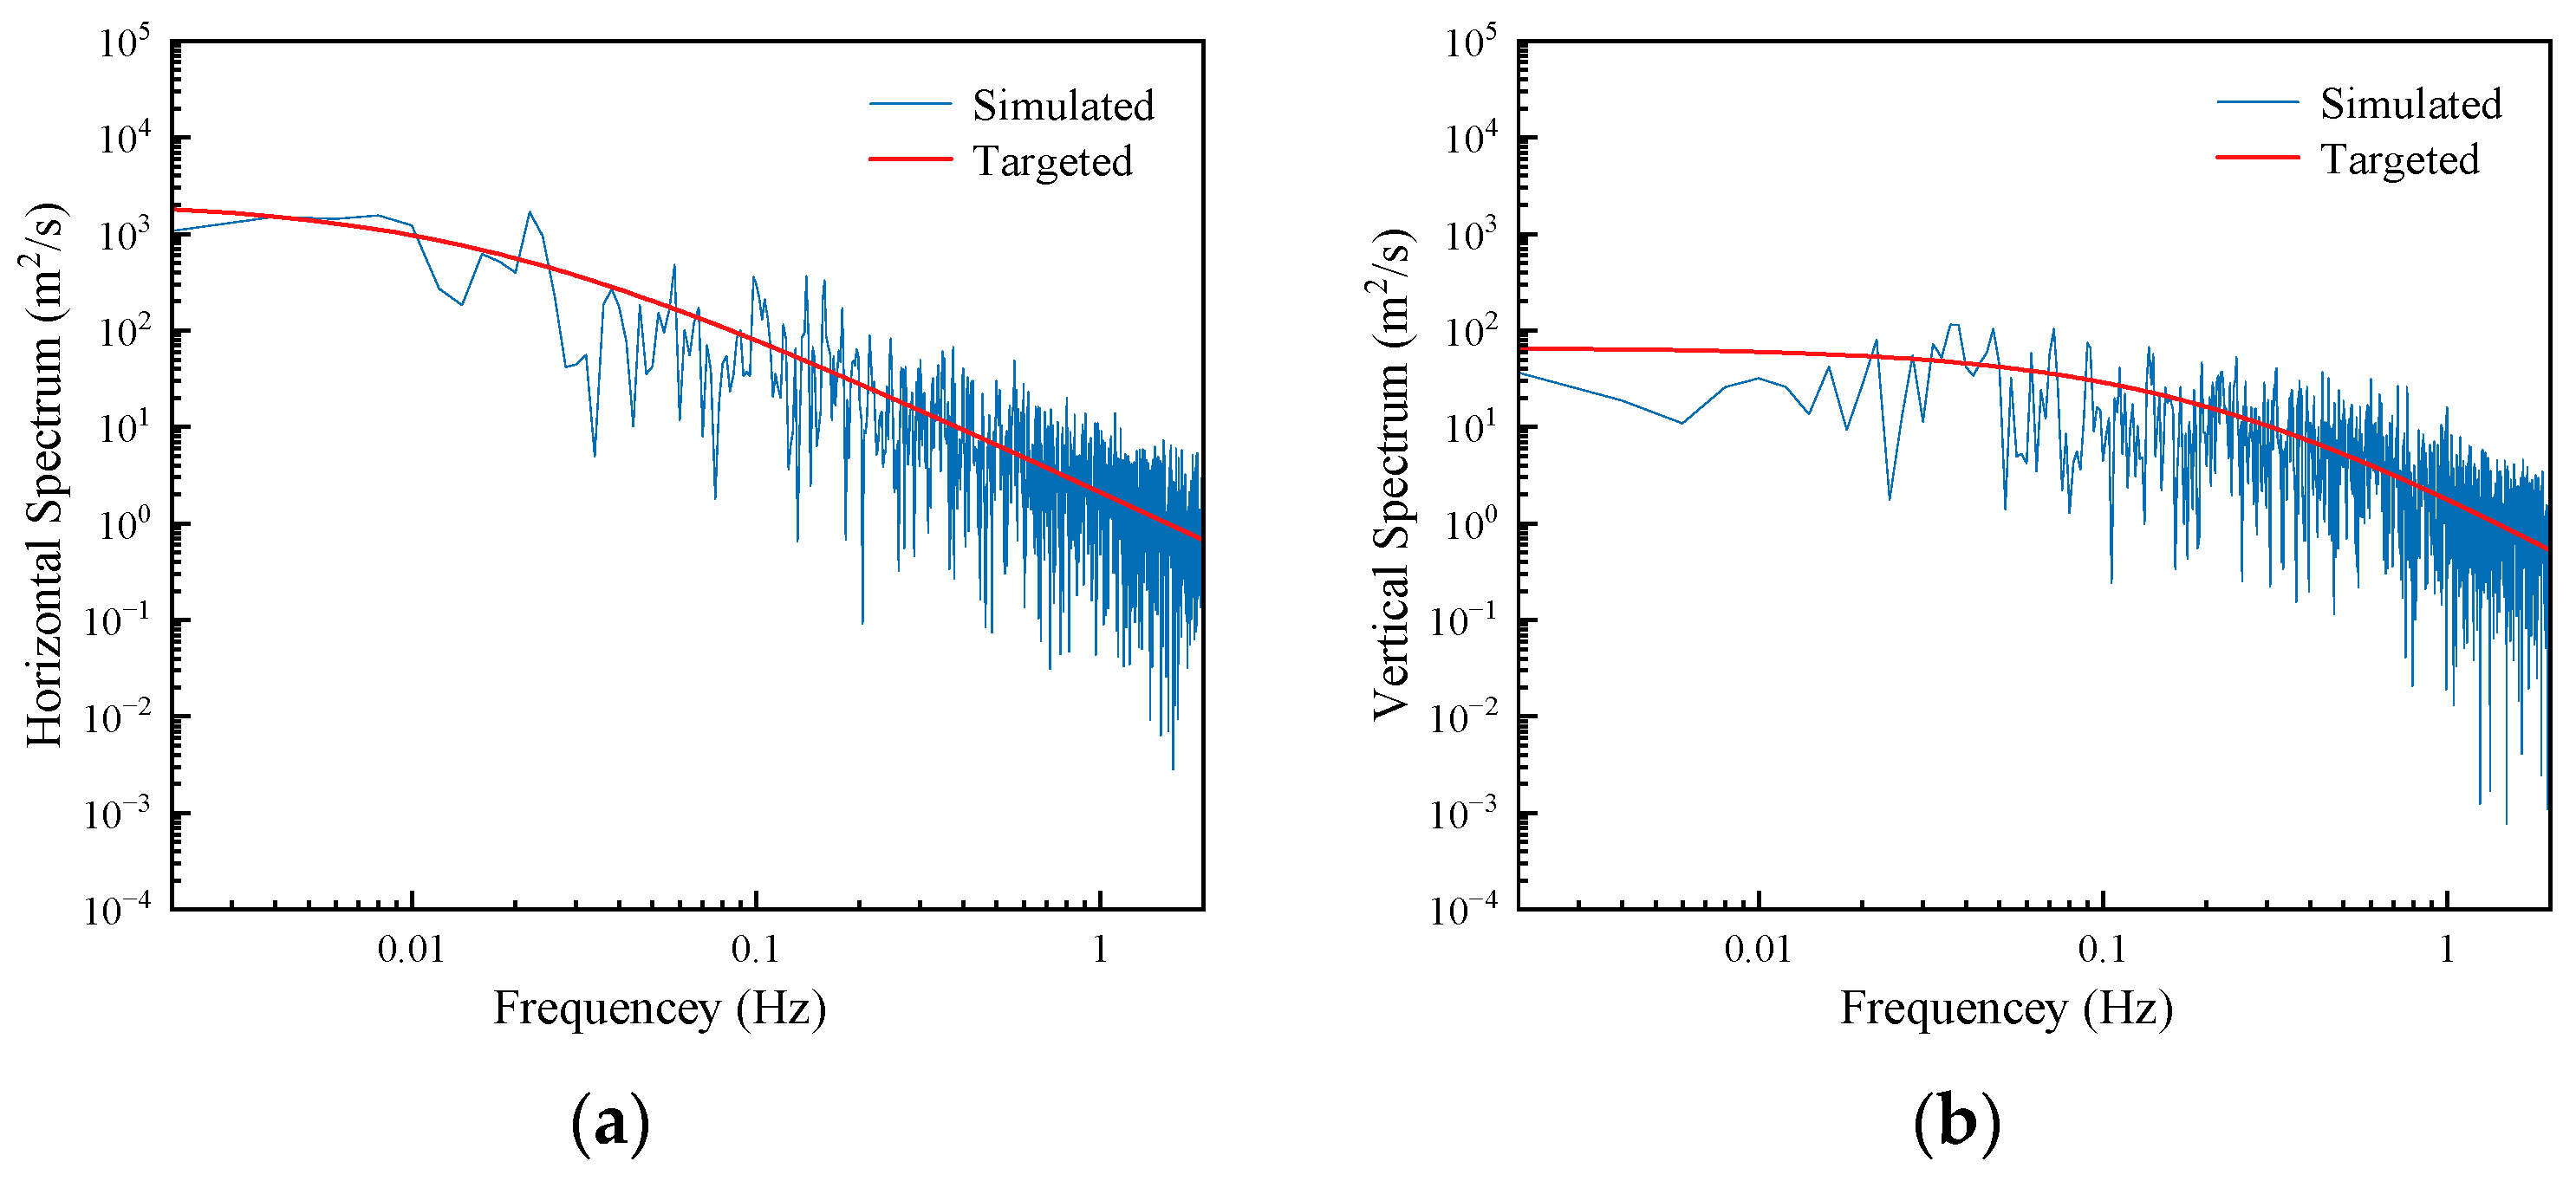
3.1. Turbulent Wind Field Simulation

To accurately simulate the turbulent wind loads acting on the cable-stayed bridge in real environmental conditions, the wind field at the bridge site was simplified into eight independent 1D multi-variable stochastic wind processes. As shown in Figure 7, a total of 190 wind field simulation points were evenly distributed along the traffic direction on the main girder at 15 m intervals. Additionally, 70 wind field simulation points were arranged along the height of each pylon (left and right banks), and 196 wind field simulation points were set at the midpoints of all the stay cables. The turbulent wind on the auxiliary pier and the stay cable inside the pylon was not considered.
According to the Wind-Resistant Design Specifications for Highway Bridges [22], the spatial turbulent wind field was simulated using the harmonic superposition method [23,24], generating 526 spatially correlated wind speed time histories for all the structural components. The mean wind speed at the deck height ranged from 20 m/s to 52.7 m/s, with a simulated duration of 1000 s. It is critical to set the cutoff frequency at 2.5 Hz to avoid frequency aliasing, ensuring the sampling interval t satisfies t 1 / 2 f u , where f u denotes the upper cutoff frequency of the turbulent wind. The parameters for turbulent wind field simulation are listed in Table 2.
The horizontal and vertical target turbulent wind spectra were defined as the Kaimal spectrum and the Panofsky spectrum, respectively, with their equations provided in Equations (2) and (3).
n S u ( Z , n ) ( u * ) 2 = 200 f ( 1 + 50 f ) 5 / 3
n S w ( Z , n ) ( u * ) 2 = 6 f ( 1 + 4 f ) 2
where S u ( Z , n ) and S w ( Z , n ) represent the horizontal and vertical turbulent wind PSD functions, respectively; n is fluctuation frequency of the wind; u * is shear velocity of the oncoming flow; f = n Z / U ( Z ) is the similarity coordinate, and U Z is the mean wind speed at height Z .
The cross-power spectral density function is as follows:
S u 1 u 2 c r , n = S Z 1 , n S Z 2 , n · e r
where
r = 2 n C z 2 Z 1 Z 2 2 + C y 2 y 1 y 2 2 1 / 2 U Z 1 + U Z 2
where C z and C y is dependent on the ground surface roughness. In this paper, C z and C y are taken as 10 and 16, respectively. The typical time histories of wind turbulence are given in Figure 8, and the wind spectra obtained from the simulated turbulence histories are presented in Figure 9.
The horizontal and vertical turbulent wind velocity power spectra of the turbulent wind field generated by the program exhibited excellent agreement with the target spectra. This validates the fidelity of the simulated wind field for dynamic analysis of structures under turbulent wind conditions.

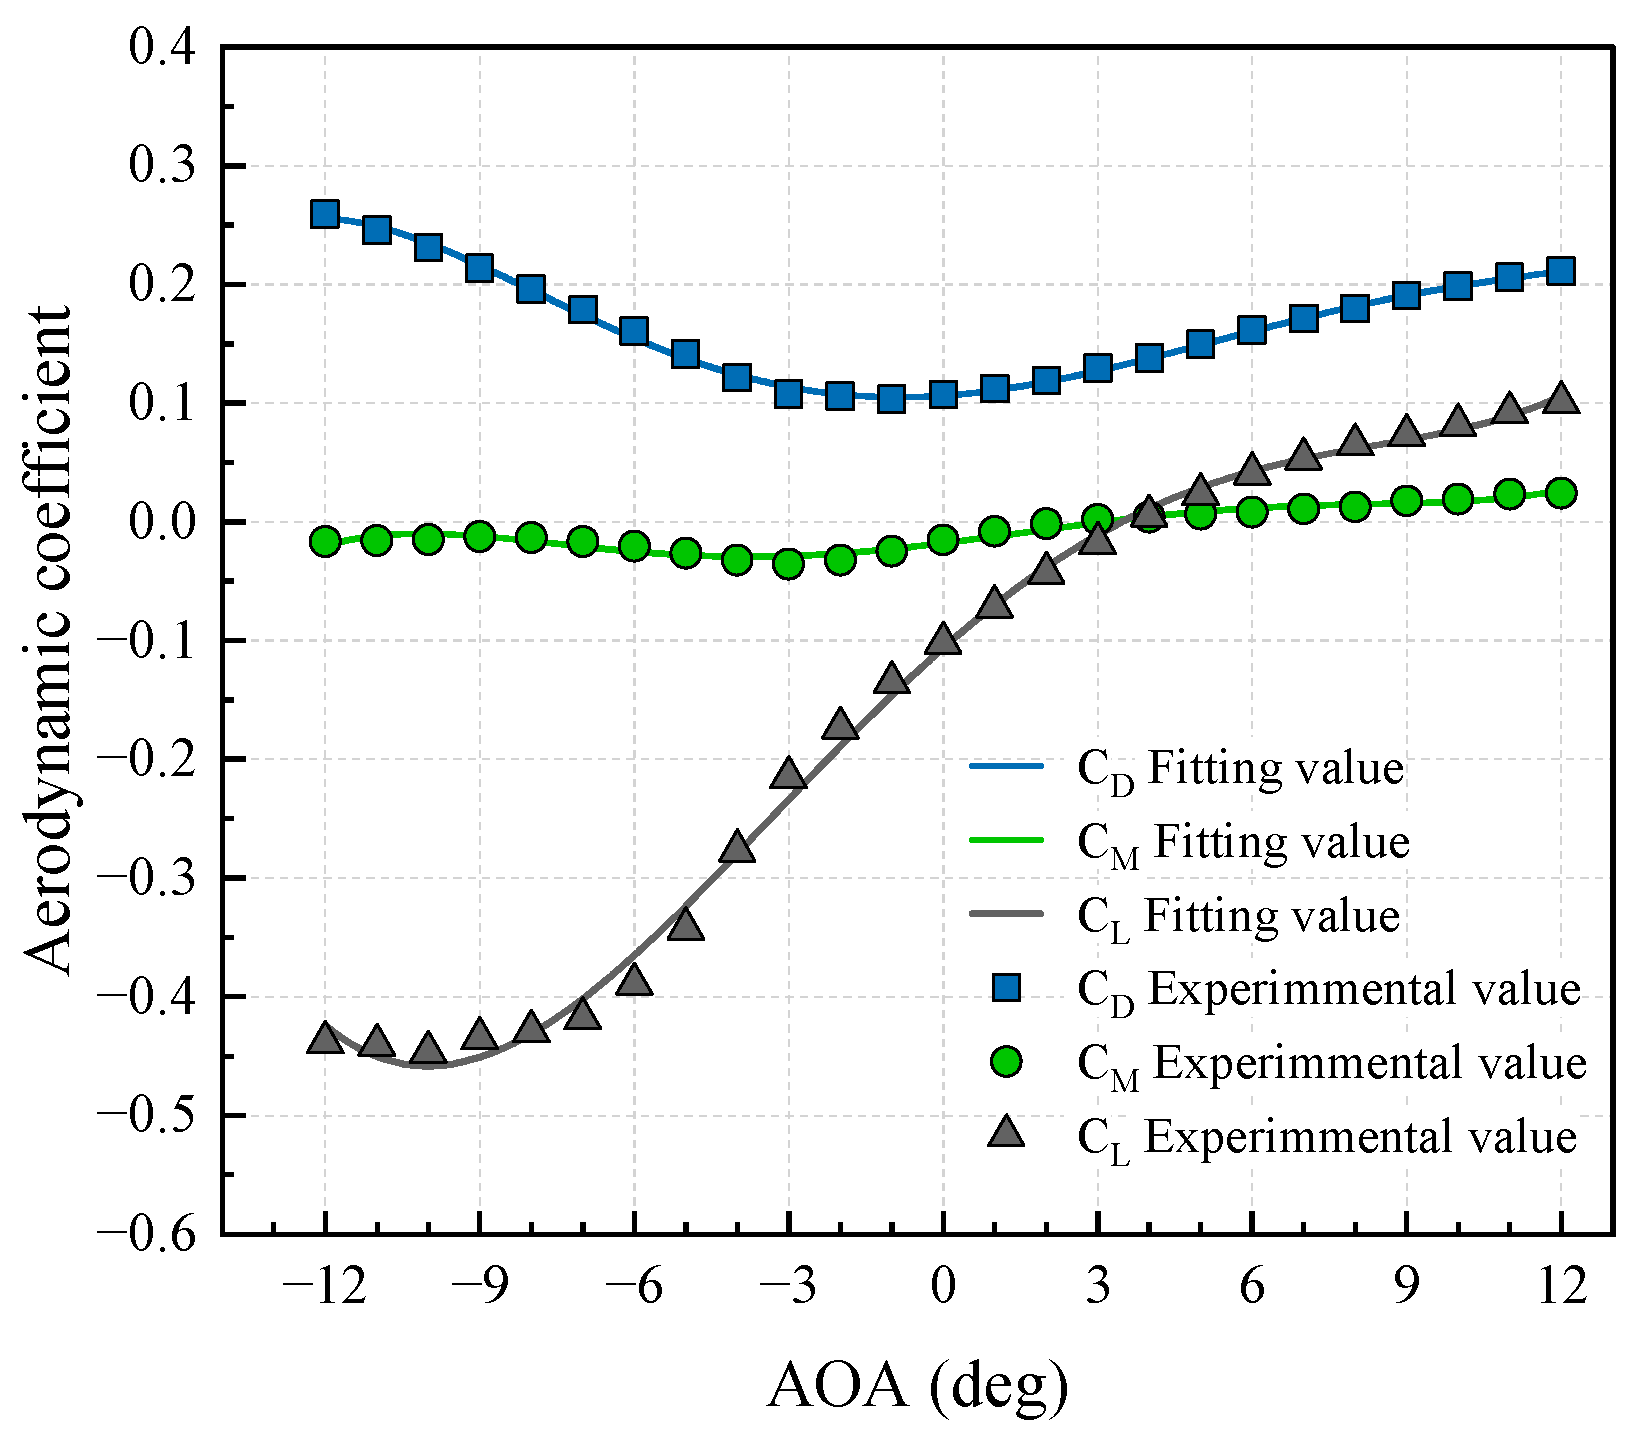
3.2. Wind Load Expression

To better characterize the aerodynamic stiffness and damping properties of the bridge structure, this study adopted a novel aerodynamic model distinct from the conventional Scanlan flutter-derivative framework, as proposed in Reference [25]. Assuming the mean wind attack angle at equilibrium state is α 0 ( x ) , with an additional wind attack angle α x , t induced by turbulence, and α x , t denoting the torsional angle of the girder, the three-component forces per unit length acting on the main girder cross-section in the instantaneous wind-axis coordinate system can be expressed as follows:
D x , t = 1 2 ρ B U 2 x , t C D [ α 0 + α x , t + α x , t ]
L x , t = 1 2 ρ B U 2 x , t C L [ α 0 + α x , t + α x , t ]
M x , t = 1 2 ρ B 2 U 2 x , t C M [ α 0 + α x , t + α x , t ]
where D x , t , L x , t , M x , t denote the aerodynamic drag, lift, and moment per unit length acting on the main girder cross-section in the instantaneous wind-axis coordinate system, respectively; x is the longitudinal bridge coordinate; ρ represents the air density ( ρ = 1.25 kg/m); C D , C L , and C M , functions of effective wind angle of attack, are the aerodynamic drag, lift, and torque coefficients, respectively. The aerodynamic coefficients [26], obtained from wind tunnel tests by a rigid section model of the bridge deck, are plotted against the wind angle of attack in Figure 10.
α 0 is the initial wind attack angle; α x , t is the torsional angle of the girder; and α x , t denotes the additional attack angle induced by turbulent wind at time t calculated as follows:
α x , t = tan 1 ω x , t U 0 + u x , t ,
U x , t represents the instantaneous wind speed at time t, which is calculated by combining the mean wind speed U 0 , the horizontal turbulent wind component u x , t , and the vertical turbulent wind component ω x , t , as follows:
U x , t = [ U 0 + u ( x , t ) ] 2 + w ( x , t ) 2
This model incorporates the higher-order terms in the turbulent wind and accounts for aerodynamic stiffness effects in the torsional direction, while neglecting aerodynamic damping effects. Consistent with the wind load calculation procedure, the aerodynamic forces acting on the main girder in the wind-axis coordinate system must be transformed into the ANSYS global coordinate system for loading via Equation (11):
F ( x , t ) L ( x , t ) M ( x , t ) = cos [ α 0 + α x , t ] sin [ α 0 + α x , t ] 0 sin [ α 0 + α x , t ] cos [ α 0 + α x , t ] 0 0 0 1 D x , t L x , t M x , t
For the wind loads acting on the pylons, auxiliary piers, and stay cables, this study considered only the aerodynamic drag forces. The aerodynamic drag per unit length can be calculated using the following equation:
F d = 1 2 [ U 0 + u x , t ] 2 C d A n
where A n is the along-wind projected area of the pylons/auxiliary piers or diameter of stay cables; C d is the drag coefficient of the component.
Due to the regular rectangular or circular aerodynamic shape of the pylon, auxiliary pier, and stay cable, the resistance coefficients of each component were obtained using interpolation according to wind resistance design specifications. In this article, the stay cable is taken as 0.8; the auxiliary pier is taken as 1.39; and the range of resistance coefficients for the pylon is 1.984~2.086.

4. Buffeting Response Analysis

Buffeting loads and mean wind loads were applied to the main girder, pylons, and stay cables, while only mean wind loads were considered for the auxiliary piers. The aerodynamic forces at all the structural components were computed in real-time through a command-stream-driven approach, which iteratively updated based on the structural response from the previous step to rigorously account for the nonlinear effects of effective wind attack angles. To mitigate numerical instabilities caused by step excitation, the critical damping ratio method was employed during the initial 100 s of the simulation. Subsequently, a Rayleigh damping model was adopted, with damping coefficients calibrated using the first vertical bending mode and first torsional mode frequencies of the main girder—both of which are critically linked to the buffeting response characteristics of the CFRP cable-stayed bridge system.

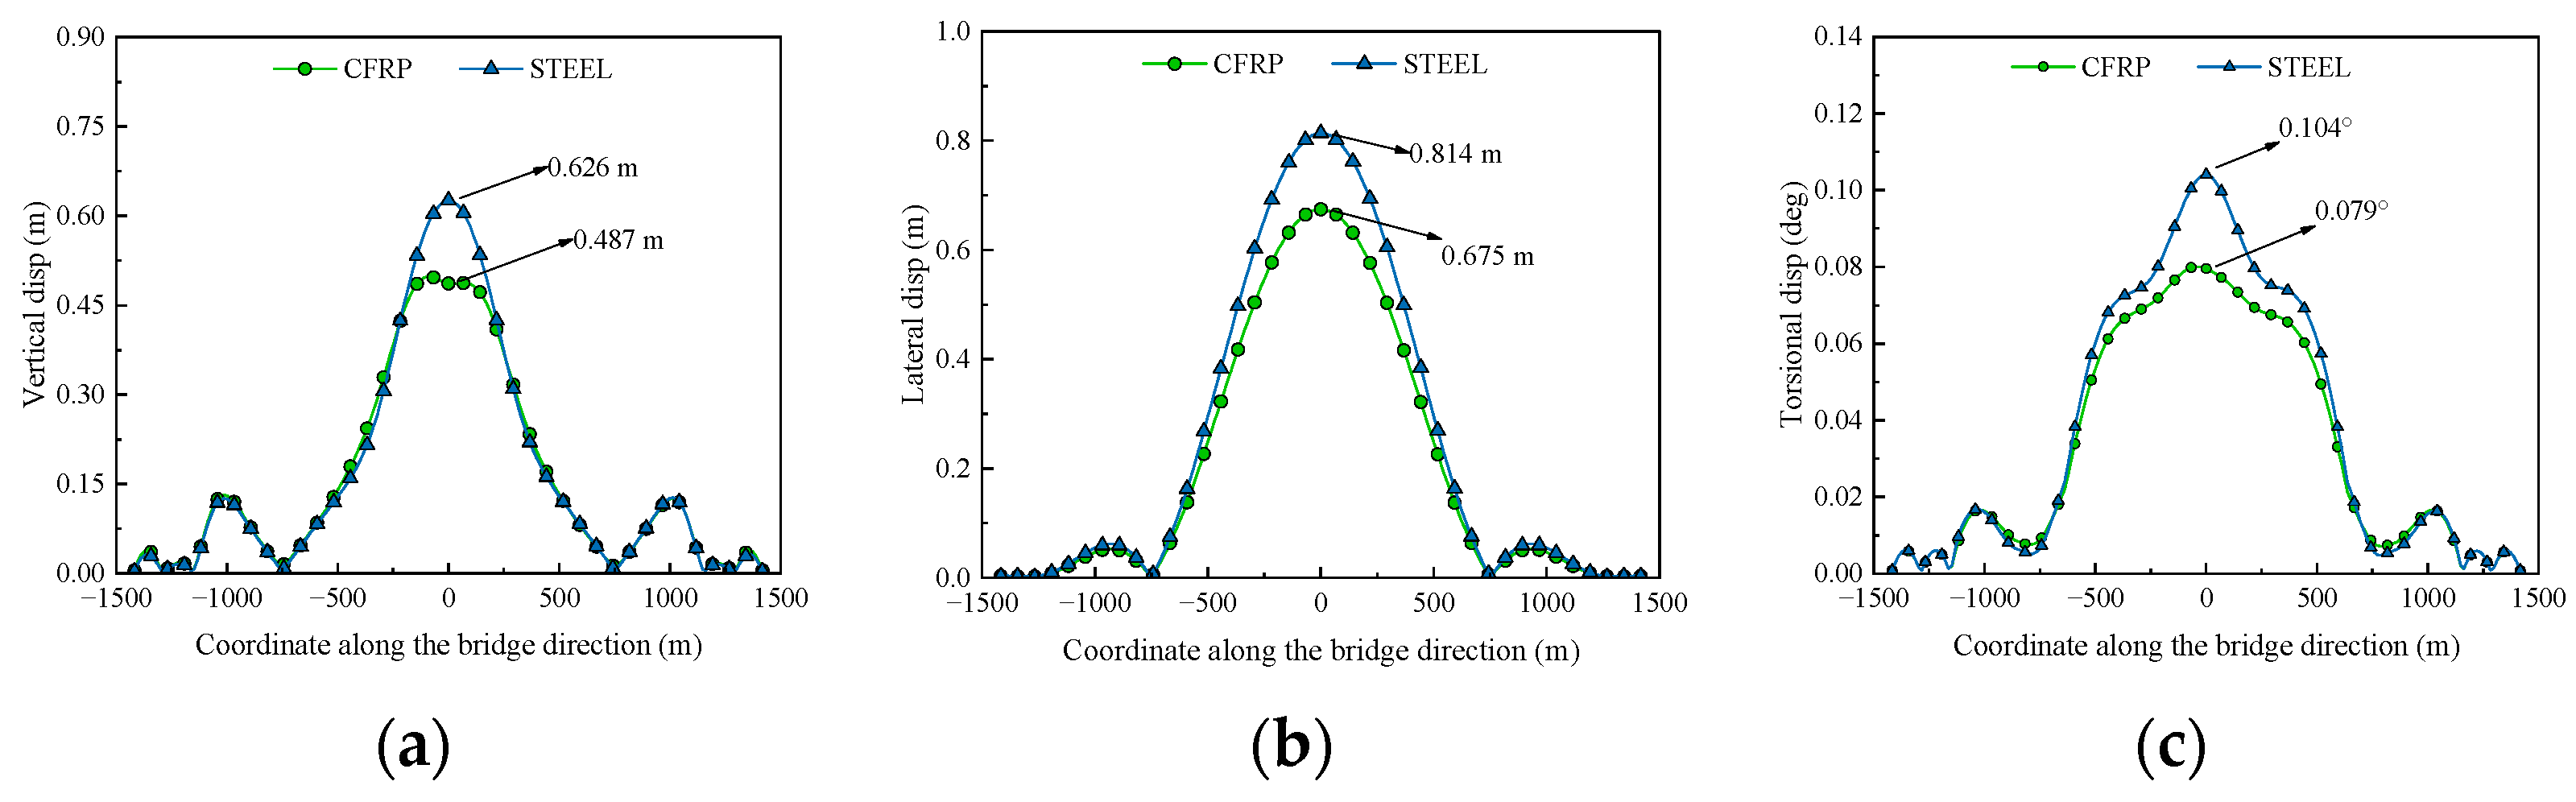
4.1. Buffeting Response of Integral Structure

Under the design wind speed at deck height ( U d = 52.9 m/s), the dynamic responses of both the cable schemes were analyzed at three angles of attack: −3°, 0°, and 3°. Figure 11 illustrates the vertical, lateral, and torsional displacement time histories at the mid-main span. The results demonstrate that stochastic wind-induced vibrations in the turbulent flow field oscillated around the static wind equilibrium position. The equilibrium position responses at mid-span under static wind loads are summarized in Table 3. Benefiting from the smaller diameter of CFRP stay cables compared with their steel counterparts, the CFRP cable scheme exhibited reduced lateral displacements, validating its aerodynamic superiority in suppressing cross-wind oscillations.
Figure 12 shows the distribution of RMS values for vertical, lateral, and torsional displacement responses along the longitudinal axis of the main girder under the critical 3° angle of attack for both the cable schemes. The CFRP cable scheme exhibited reduced vertical and lateral RMS displacement values compared with the steel cable scheme. At the mid-span, the vertical, lateral, and torsional RMS responses of the CFRP scheme were reduced by 31.6%, 28.5%, and 20.6%, respectively. Globally, the torsional RMS displacements of the CFRP scheme were smaller across most spans, except near the pylons where they were slightly larger than those of the steel cables. However, the torsional RMS value at mid-span under the CFRP scheme remained significantly lower, demonstrating improved buffeting performance under adverse wind angles.

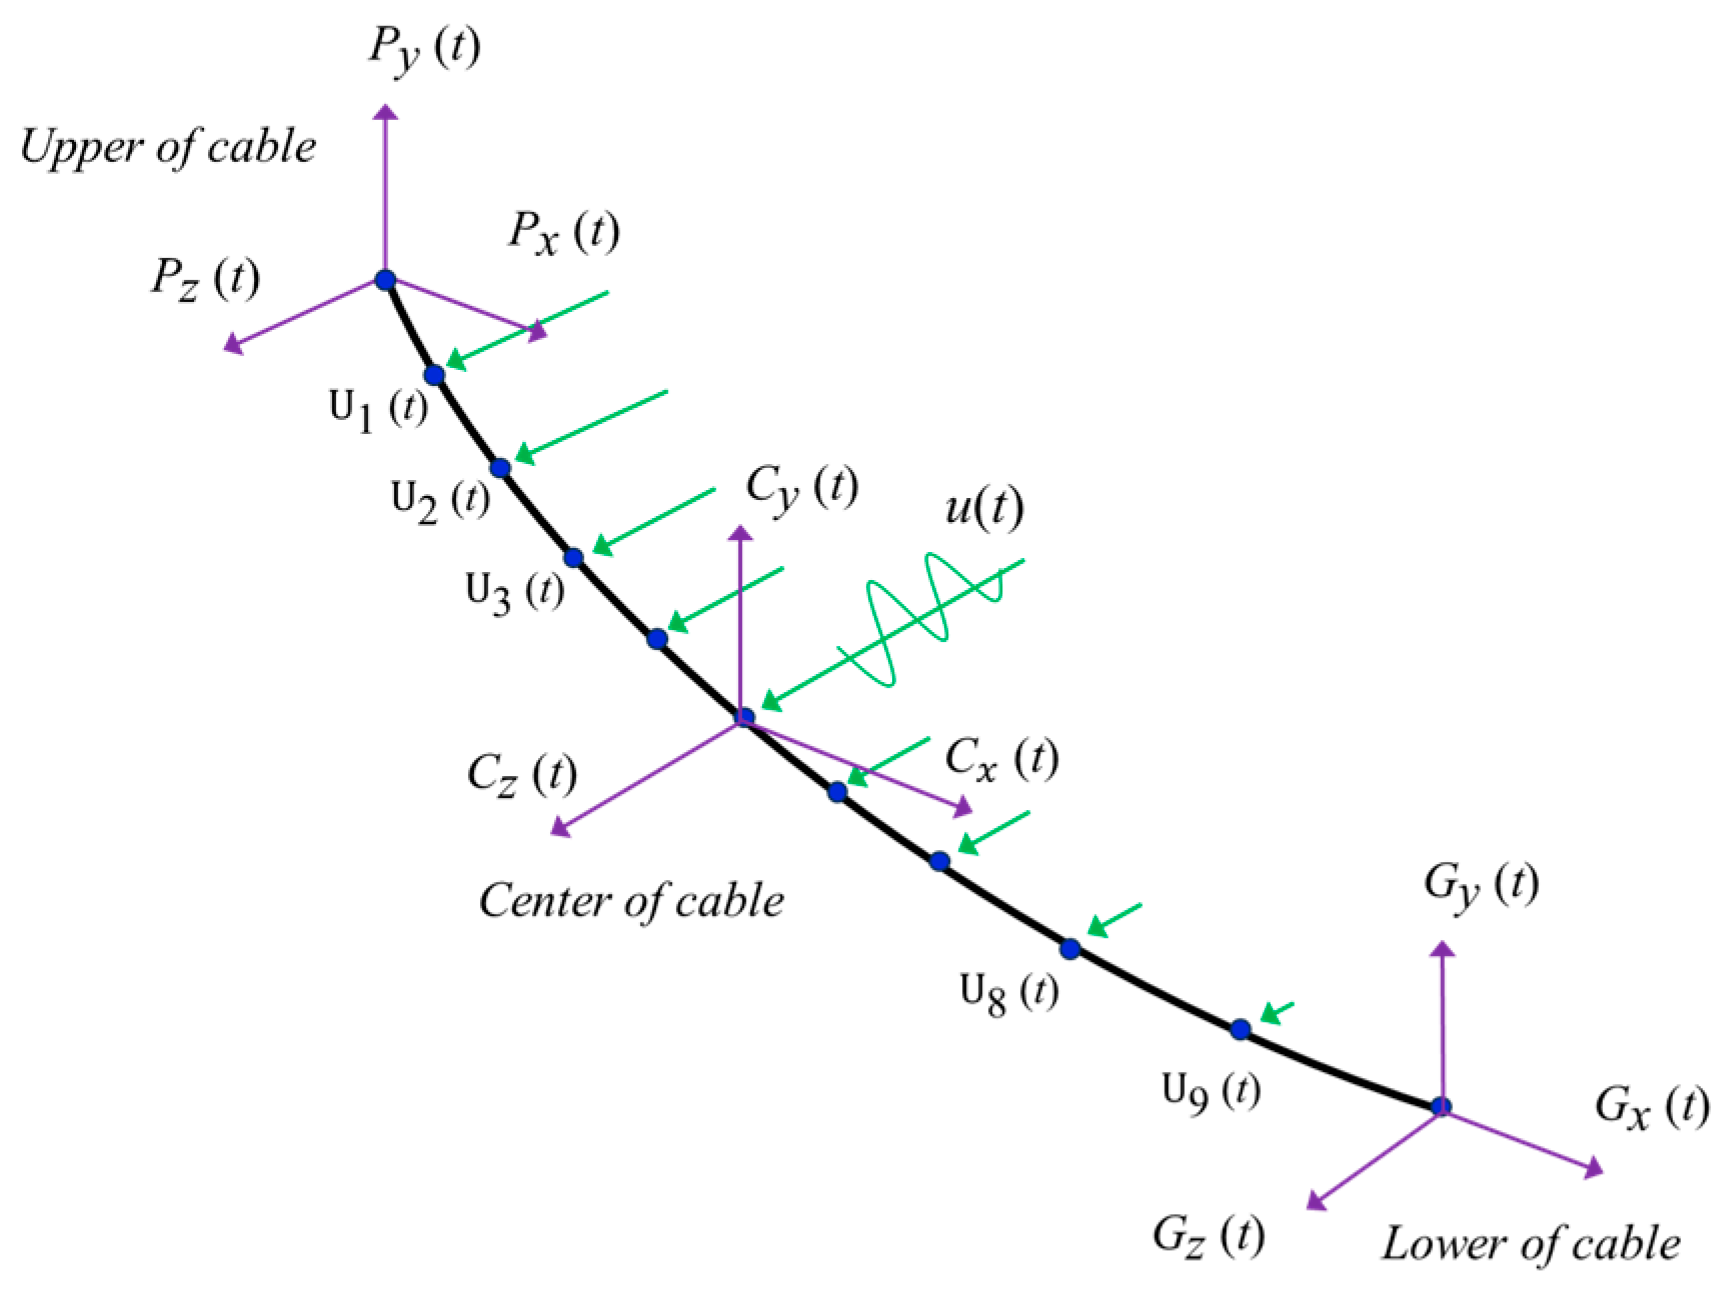
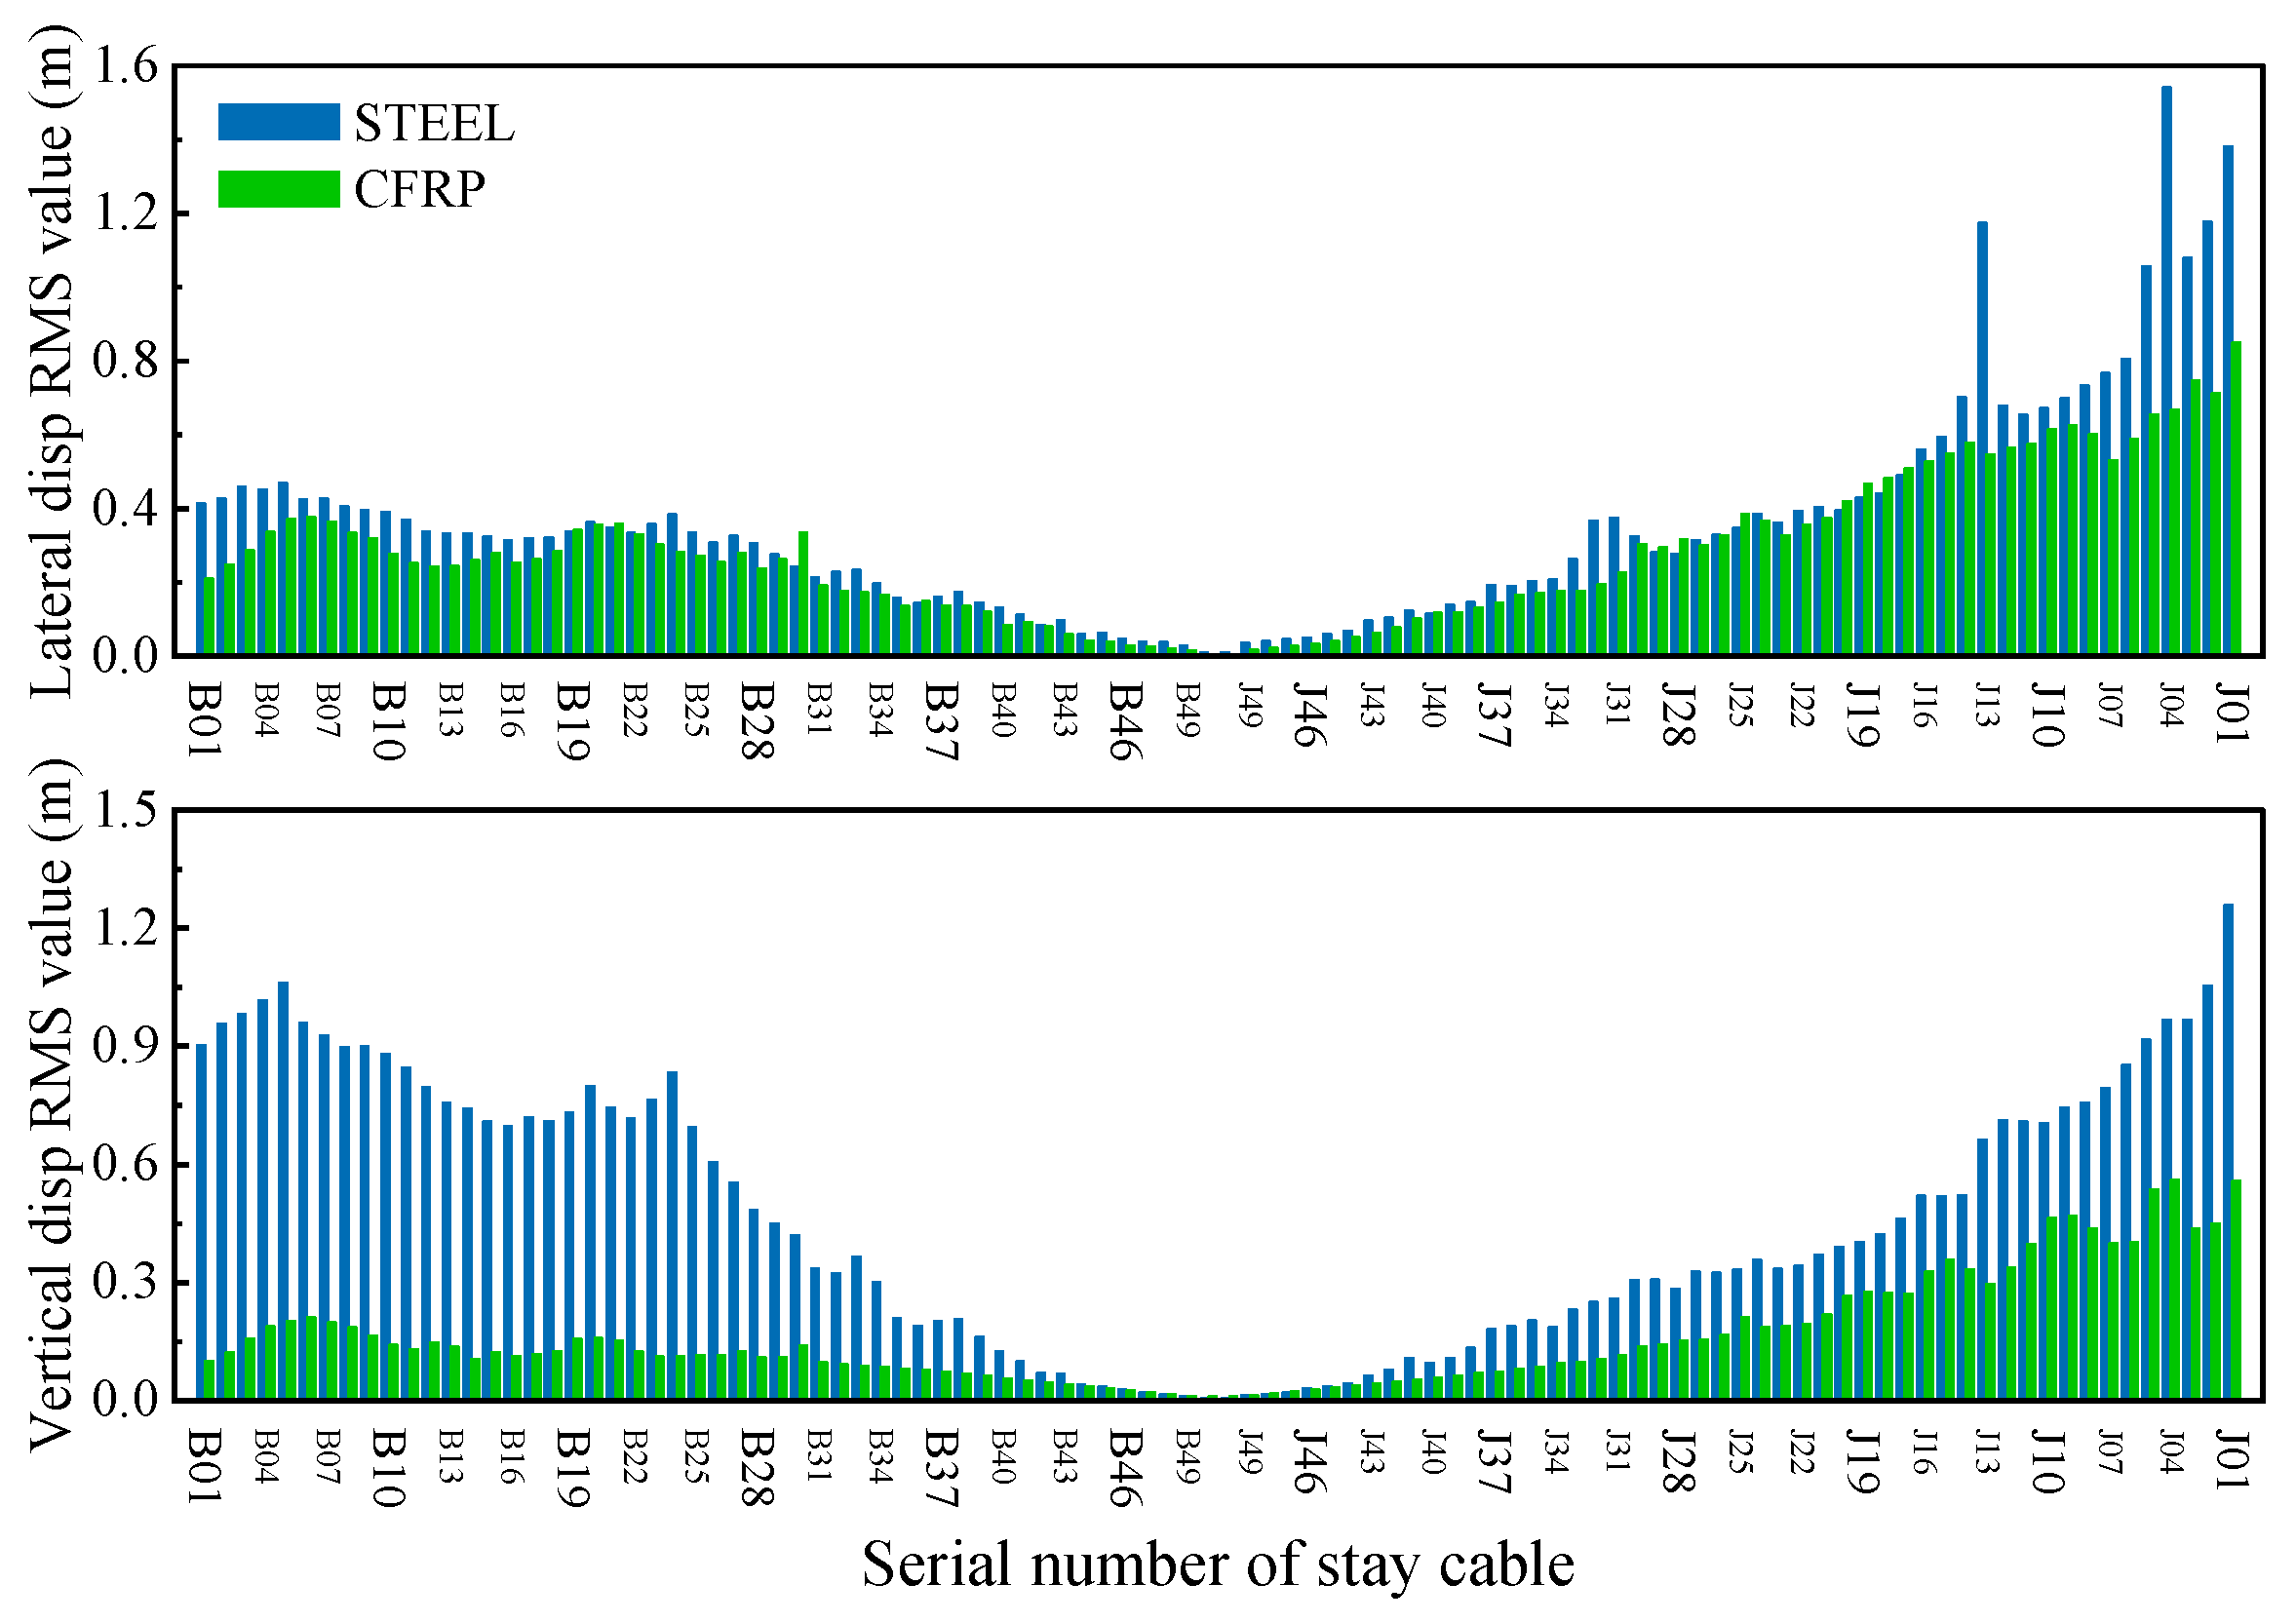
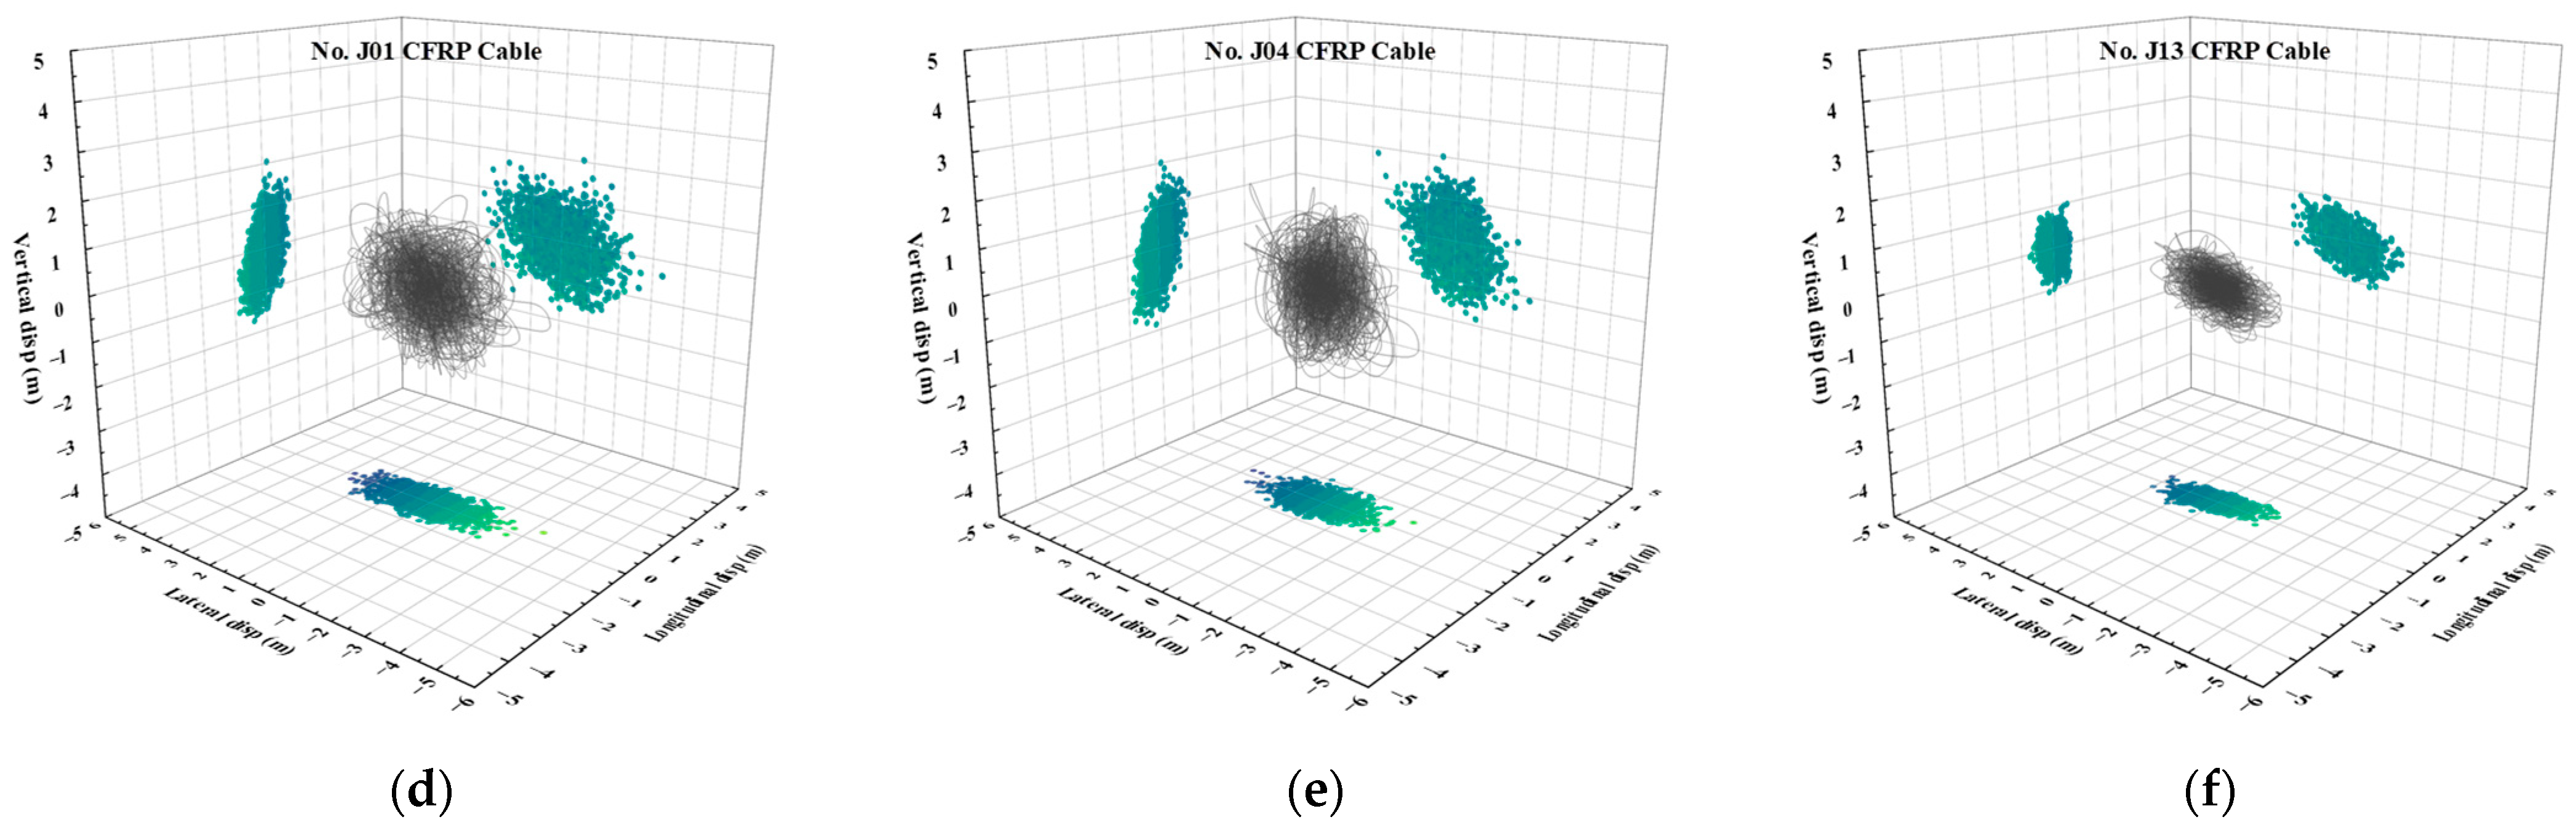
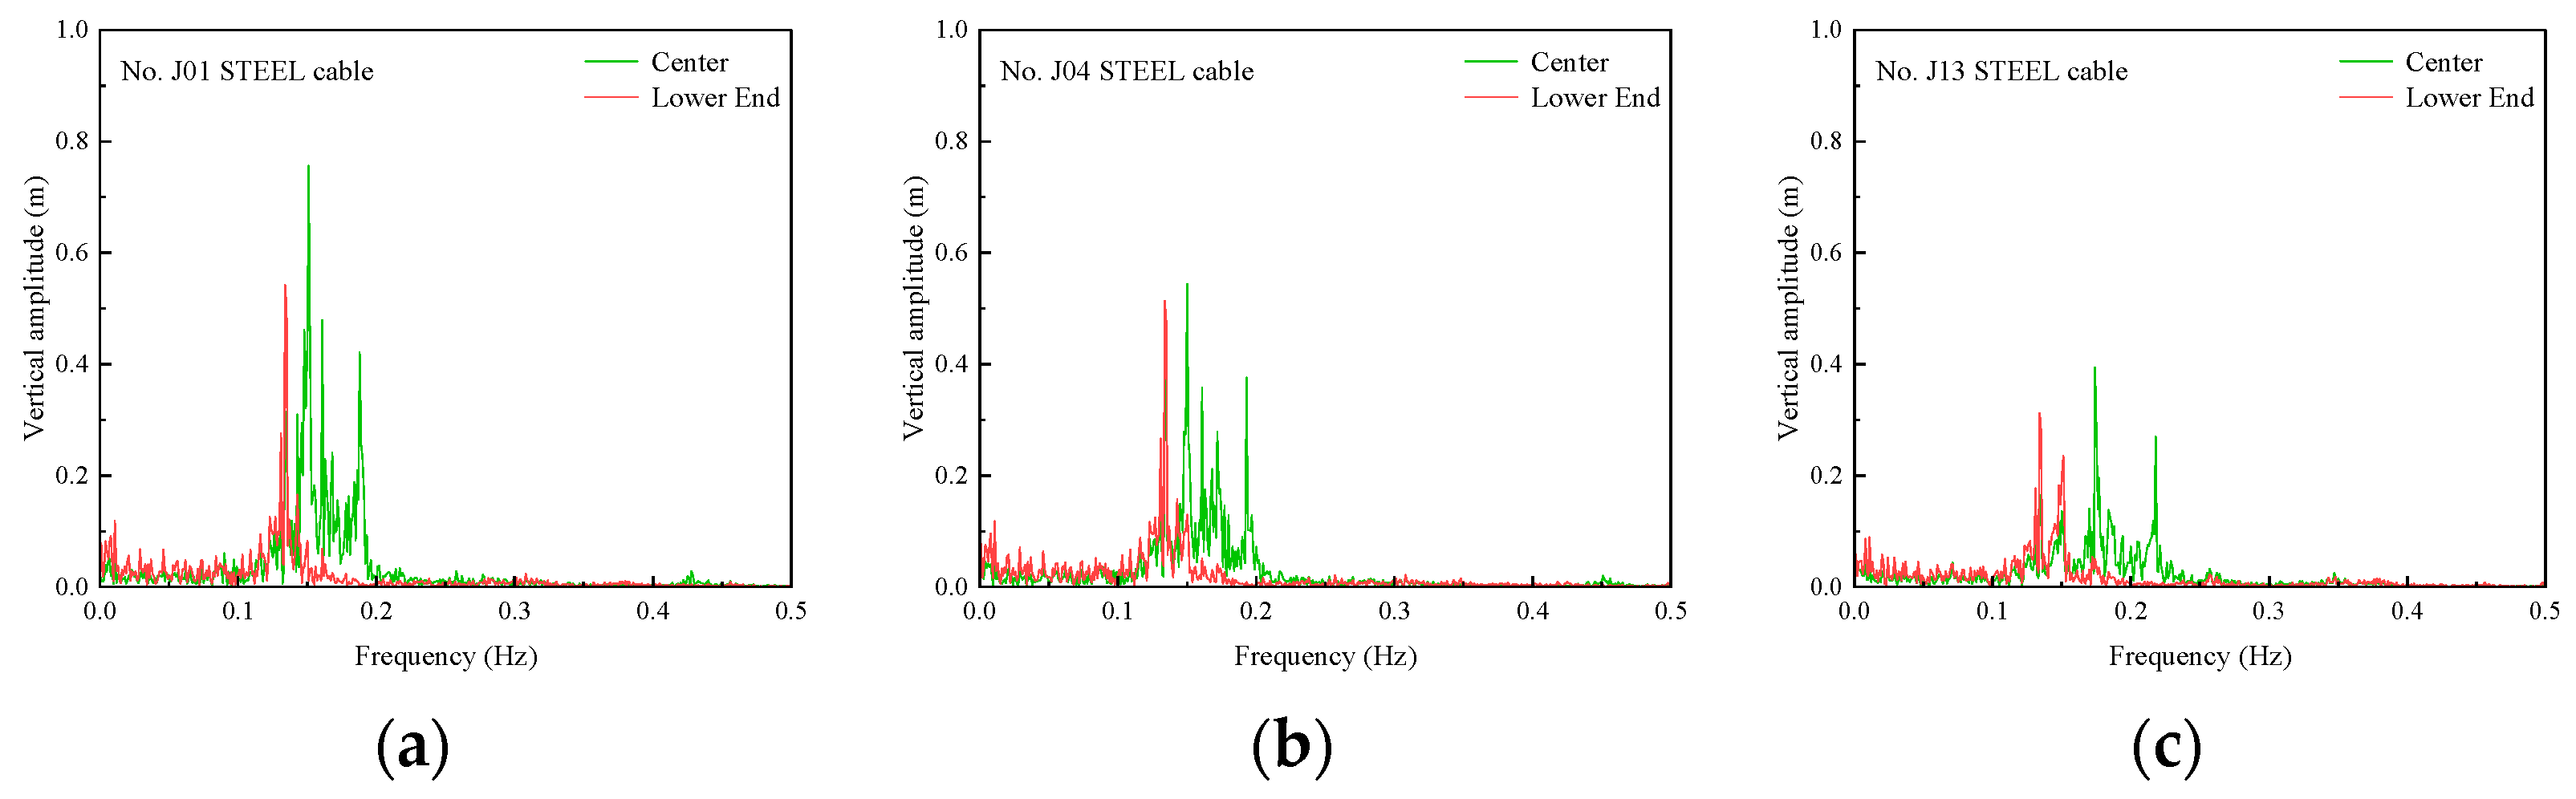
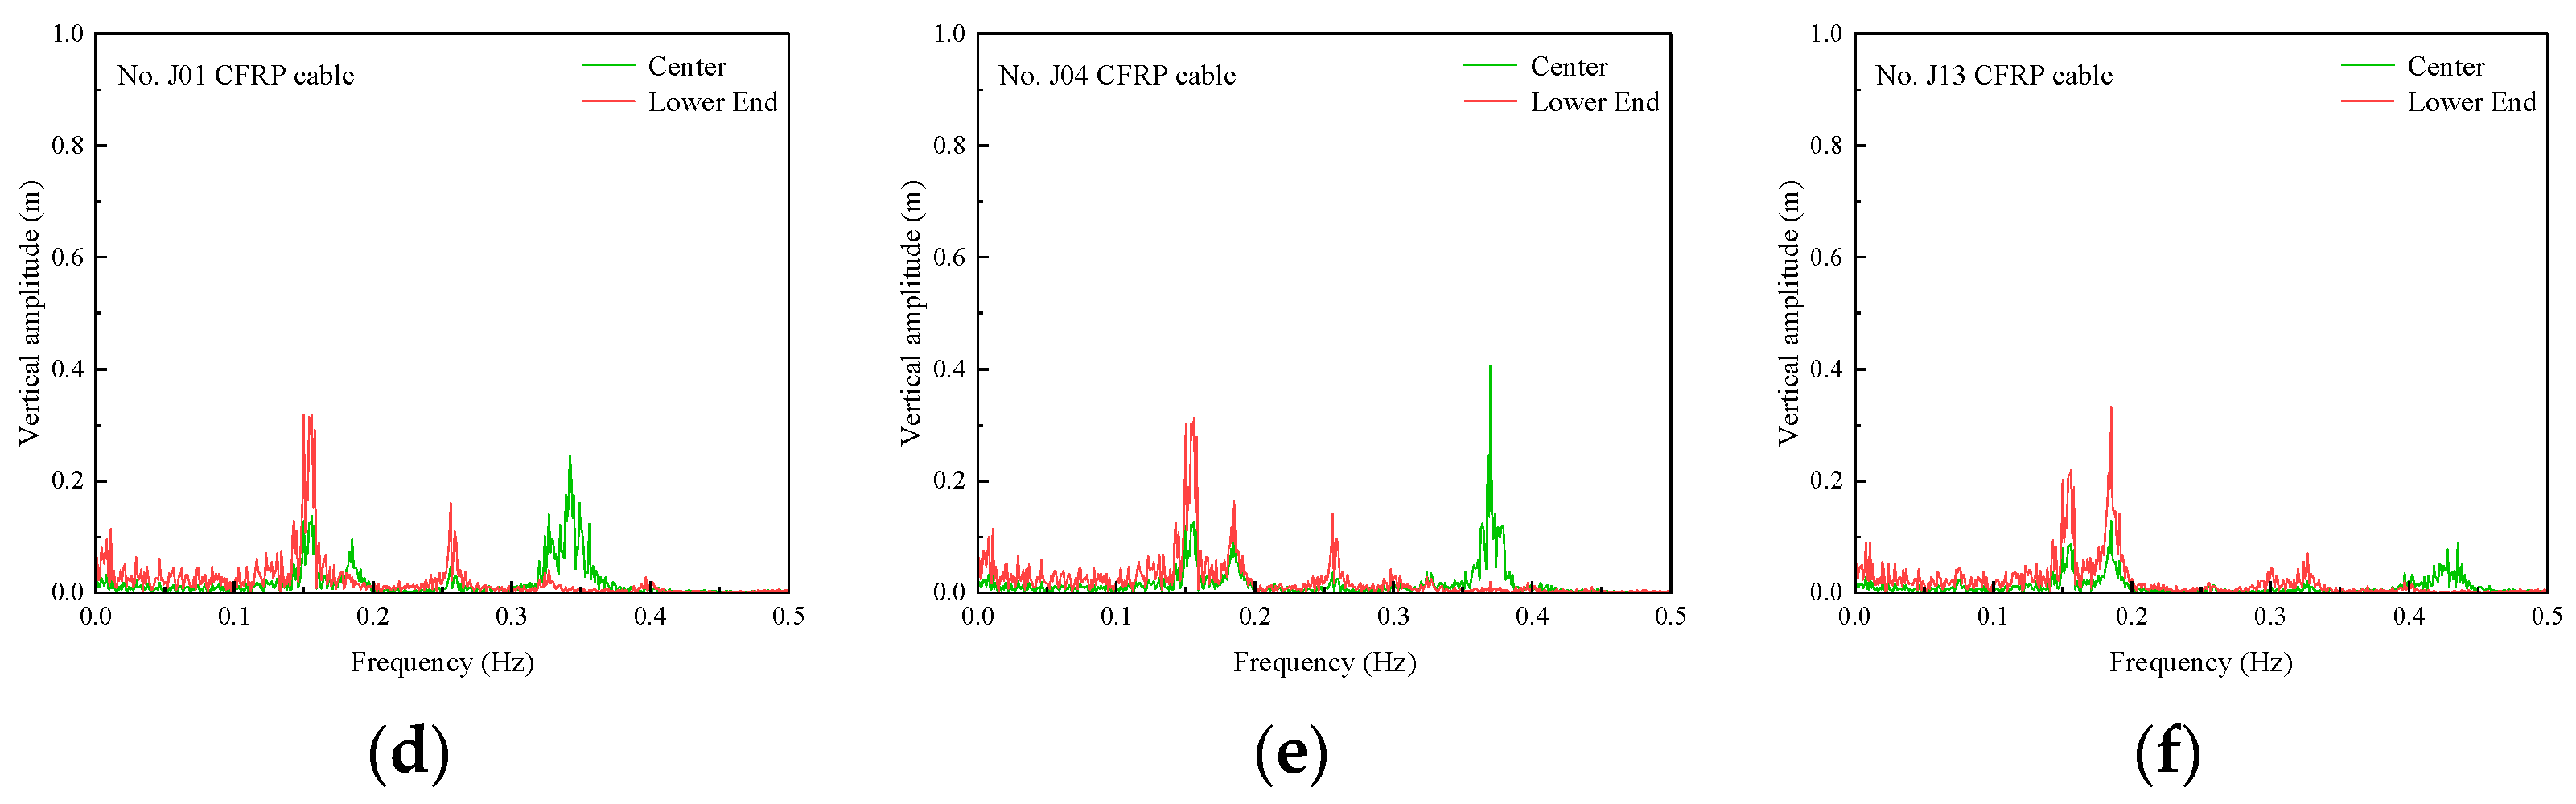
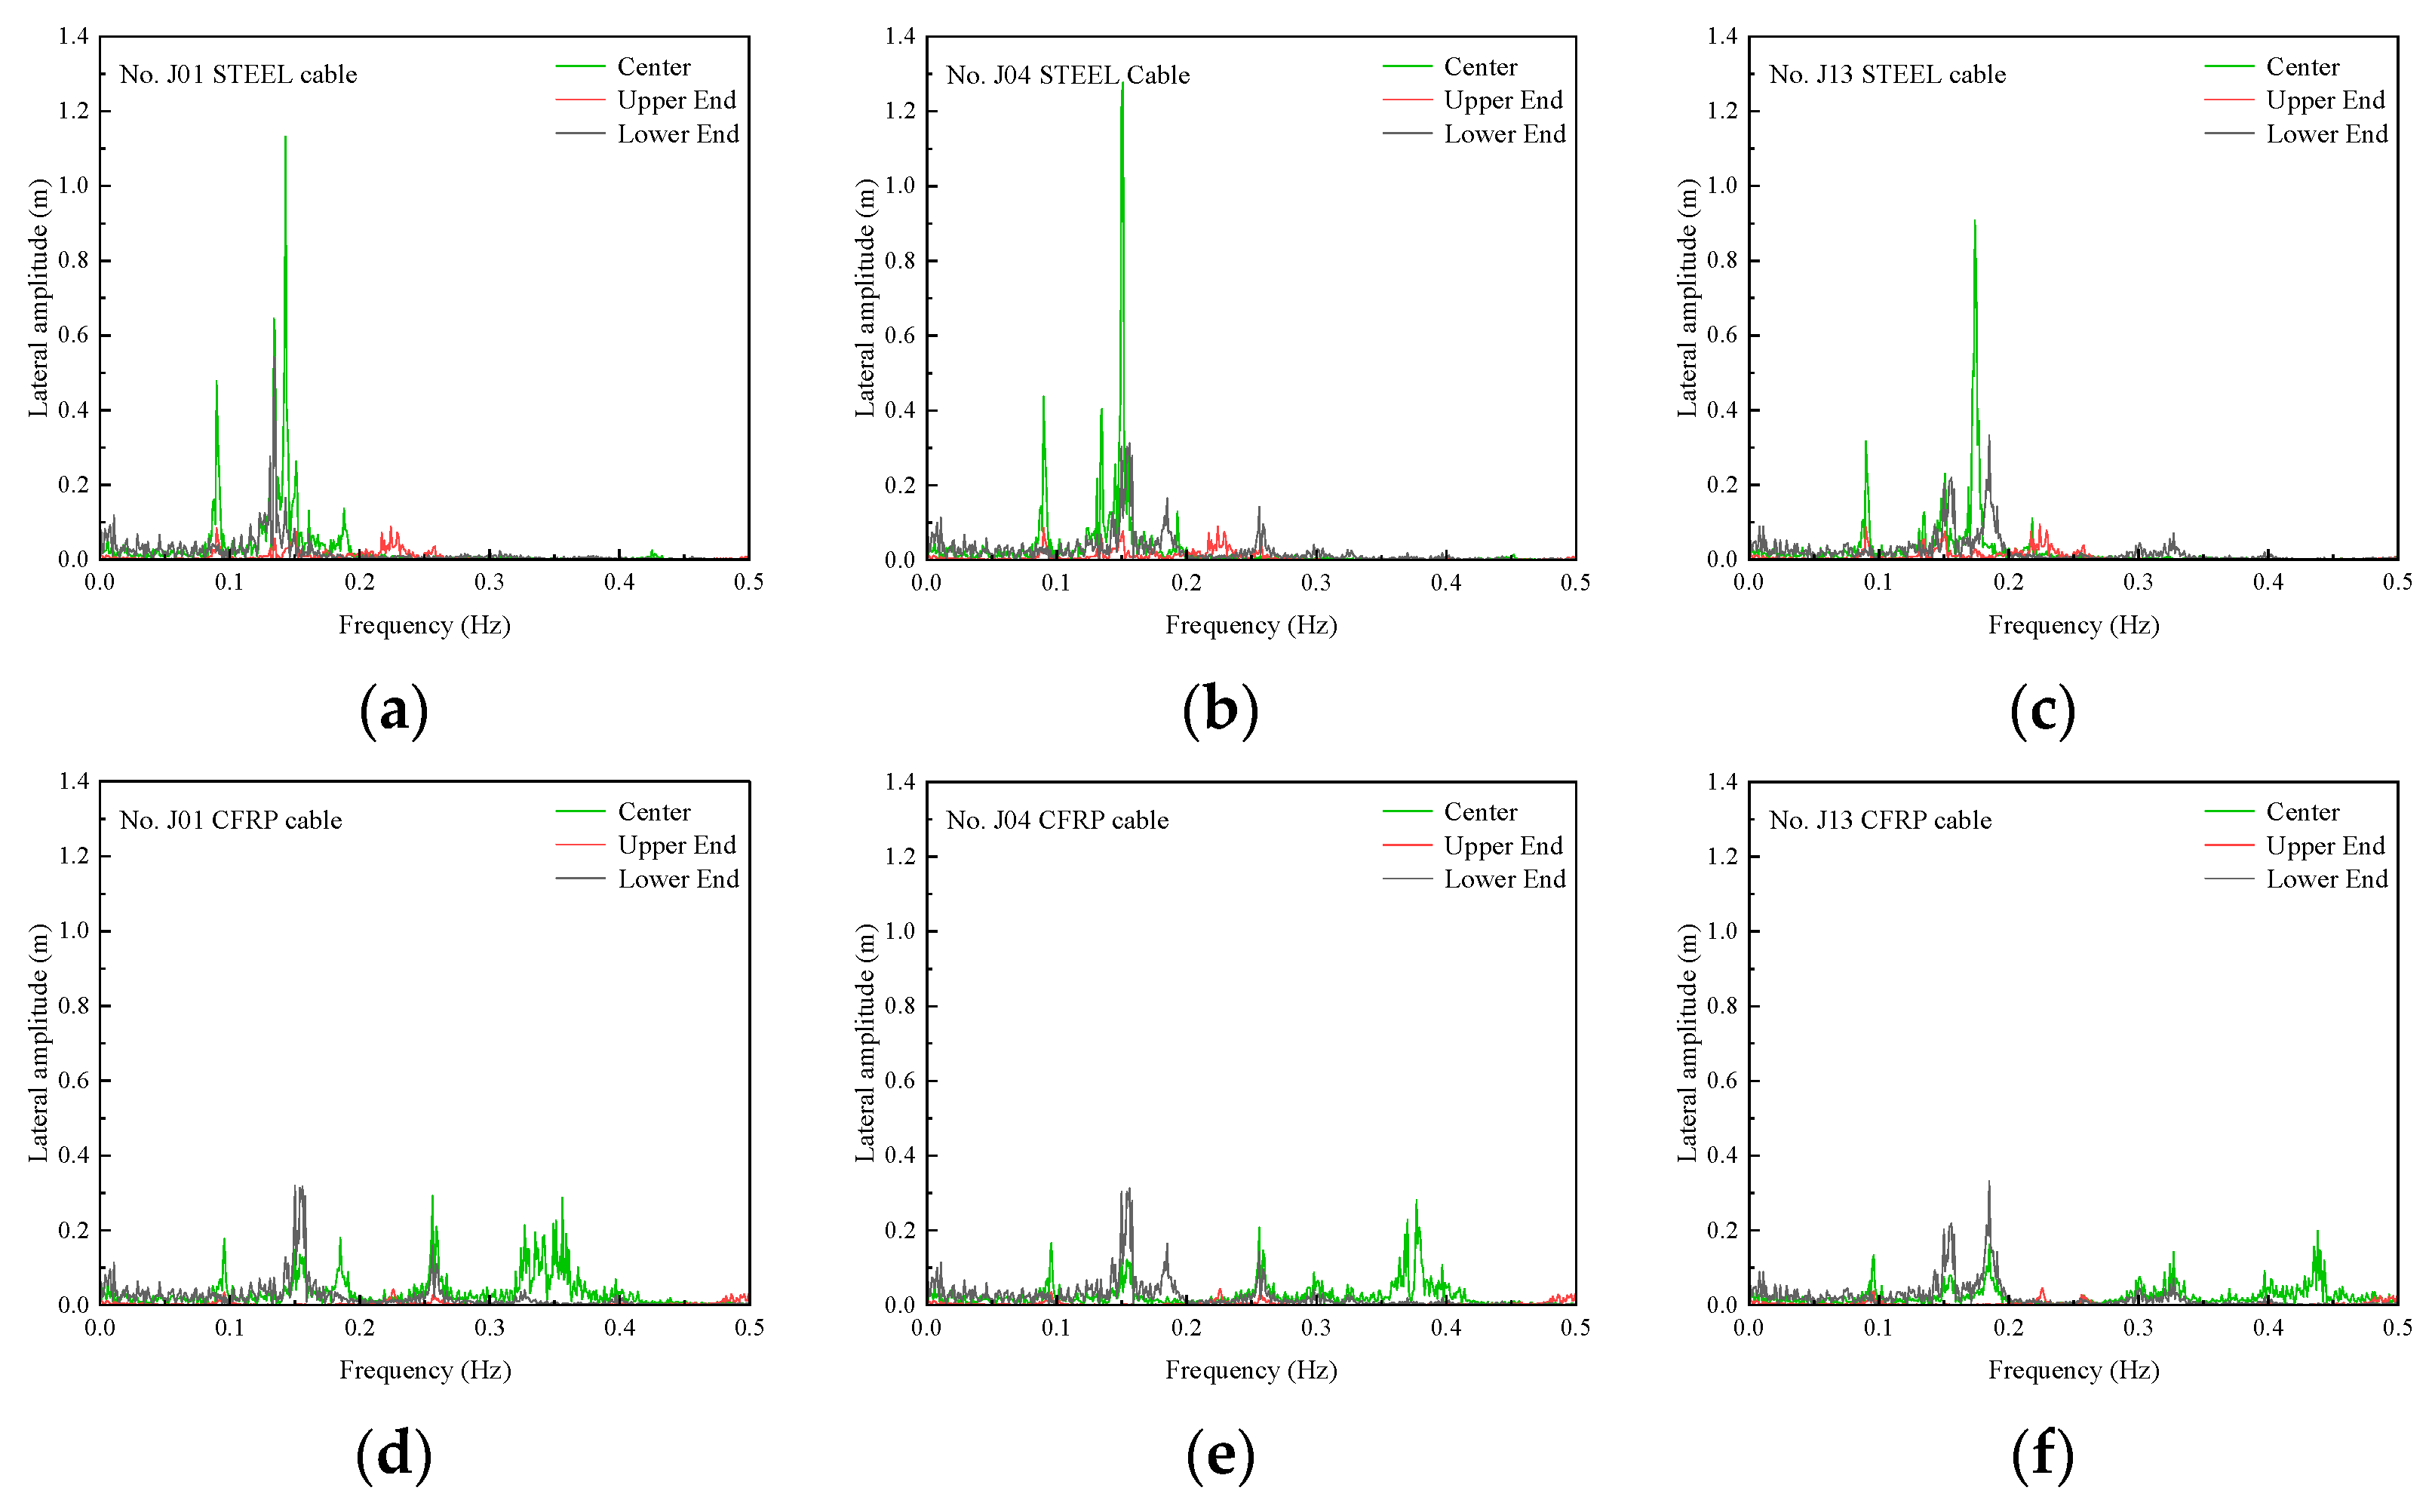
4.2. Buffeting-Induced Resonances of Stay Cables

The internal resonance of stay cables arises from frequency-matching characteristics between the cables and primary structural components. To simulate the geometric nonlinearity of the cables under wind loads, each stay cable was discretized into 10 segmented link10 elements [27], resulting in the dynamic behavior illustrated in Figure 13.
The upper end of the cable is connected to the pylon, while the lower end is anchored to the deck. Here, U i ( t ) denotes the mean wind velocity acting on the cable nodes, and u ( t ) represents the turbulent wind component. Due to the broadband frequency characteristics of wind-induced buffeting, which distributes energy across a wide spectrum, the cables experience multi-directional vibrations x , y , and z at their upper, midpoint, and lower nodes when exposed to turbulent flow fields. This significantly elevates the risk of exciting resonant vibrations [28].
Based on the dynamic analysis results, the vertical and lateral displacement responses at the midpoints of all the windward-side stay cables in the left span were extracted. Figure 14 compares the RMS values of these responses between the two schemes. Distinct peaks were observed at J1, J4, and J13 in the steel cable scheme, whereas the CFRP cable scheme exhibited more uniform and smoother response distributions.
As shown in Figure 15, the three-dimensional motion trajectories of the stay cable midpoints were plotted using the lateral response (x-axis), longitudinal response (y-axis), and vertical response (z-axis). By observing their projections on the x-y, y-z, and x-z planes, the following can be noted: For steel cables J01, J03, and J13, the lateral motion trajectories exhibited a more scattered distribution than the vertical component, with isolated points at the edges of the projected point clouds. This indicates the occurrence of abnormal lateral oscillations in the steel cables. In contrast, the CFRP cable midpoint trajectories displayed more concentrated circular distribution patterns across all three projection planes, reflecting smaller vibration amplitudes. These observations will be further discussed through spectral analysis.
A spectral analysis was performed on the vertical and lateral displacement responses at the upper, lower, and midpoint nodes of the stay cables for both the schemes. Vertical excitation at the upper pylon connection was excluded due to negligible displacement magnitudes. The results in Figure 16 and Figure 17 show that, while the steel cable scheme exhibited no significant amplitude amplification from frequency coupling in the vertical component, minor amplitude peaks occurred near the dominant frequencies of the main girder (0.12~0.25 Hz) due to the proximity of the cables’ fundamental frequencies to the girder frequencies. In the lateral component, steel cables J04 and J13 showed resonant peaks at 0.15 Hz and 0.18 Hz. These peaks originate from weak excitation components at the upper end, despite the absence of corresponding frequency content at the lower deck connection. The lower fundamental frequency of the steel cables leads to denser higher-mode frequency distributions, causing frequent mode shape transitions under turbulent excitation and resulting in multiple closely spaced spectral peaks.
For the CFRP cables, the resonance peaks in the vertical response spectrum aligned with the main girder’s fundamental frequency range (0.15~0.2 Hz). However, these peaks represent background responses rather than internal resonance, as the CFRP cables’ fundamental frequencies lie outside the girder’s dominant frequency band. The lateral response of the CFRP cables was dominated by higher-order modes, with minimal energy transfer to the fundamental frequency. The sparser higher-mode frequency distribution of the CFRP cables suppressed mode transitions, avoiding clustered spectral peaks. Replacing steel cables with CFRP cables in long-span bridges effectively suppressed wind-induced internal resonance by decoupling cable–girder frequency matching and enhanced aerodynamic stability.

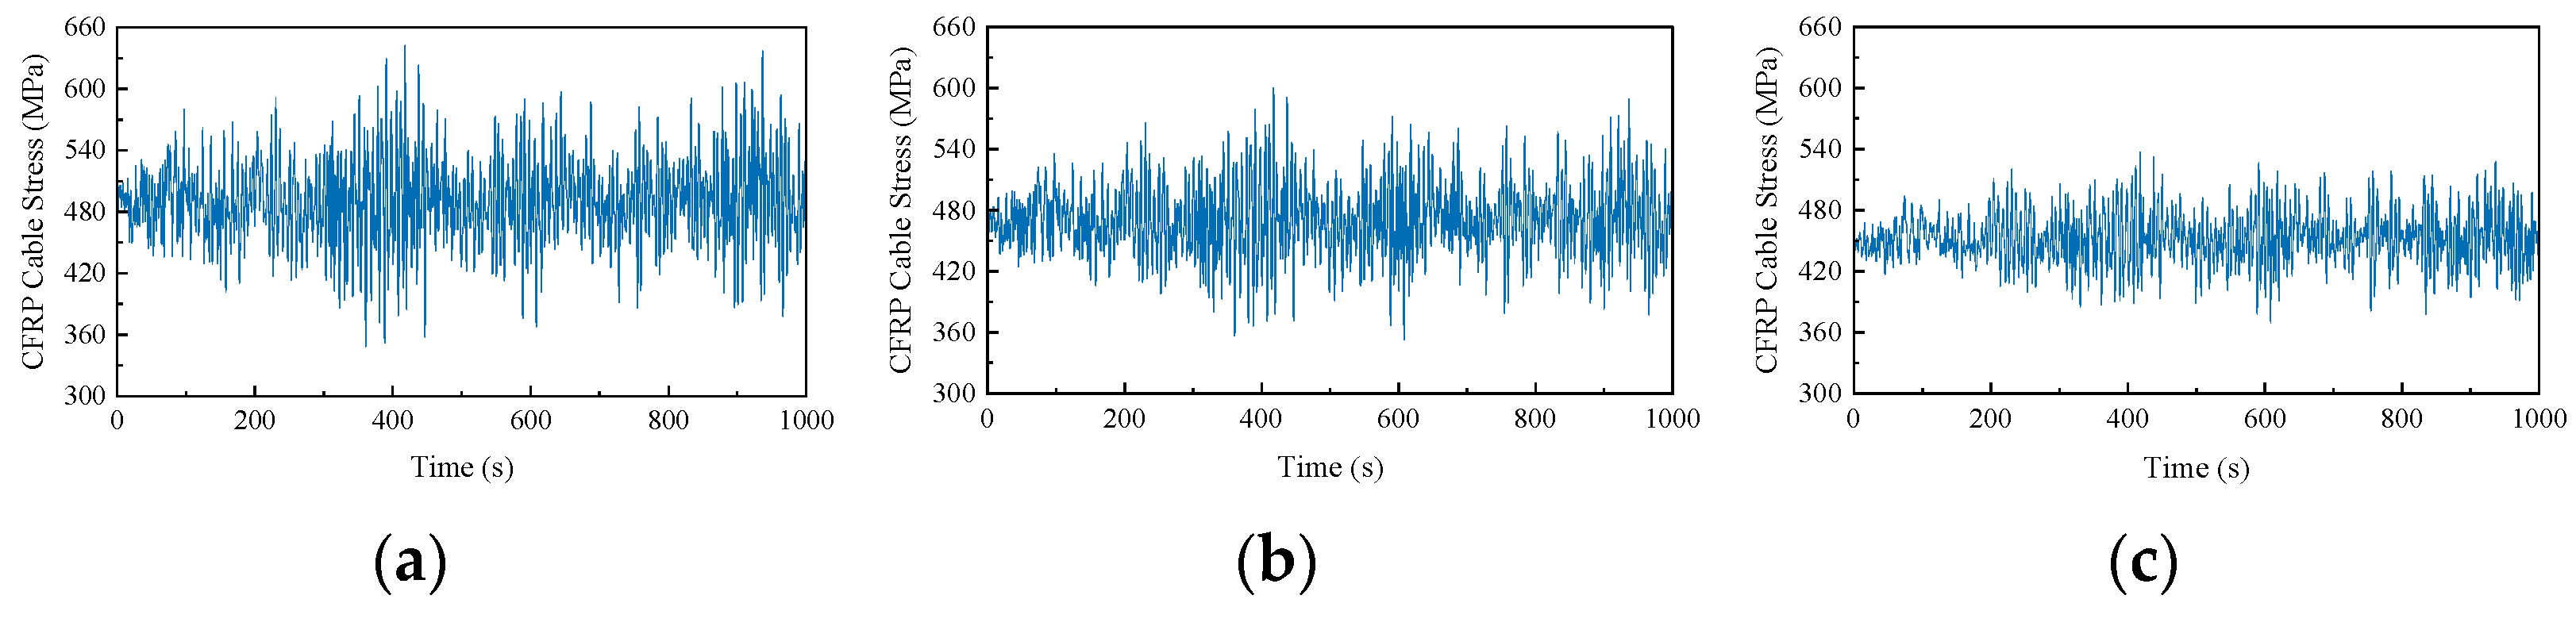
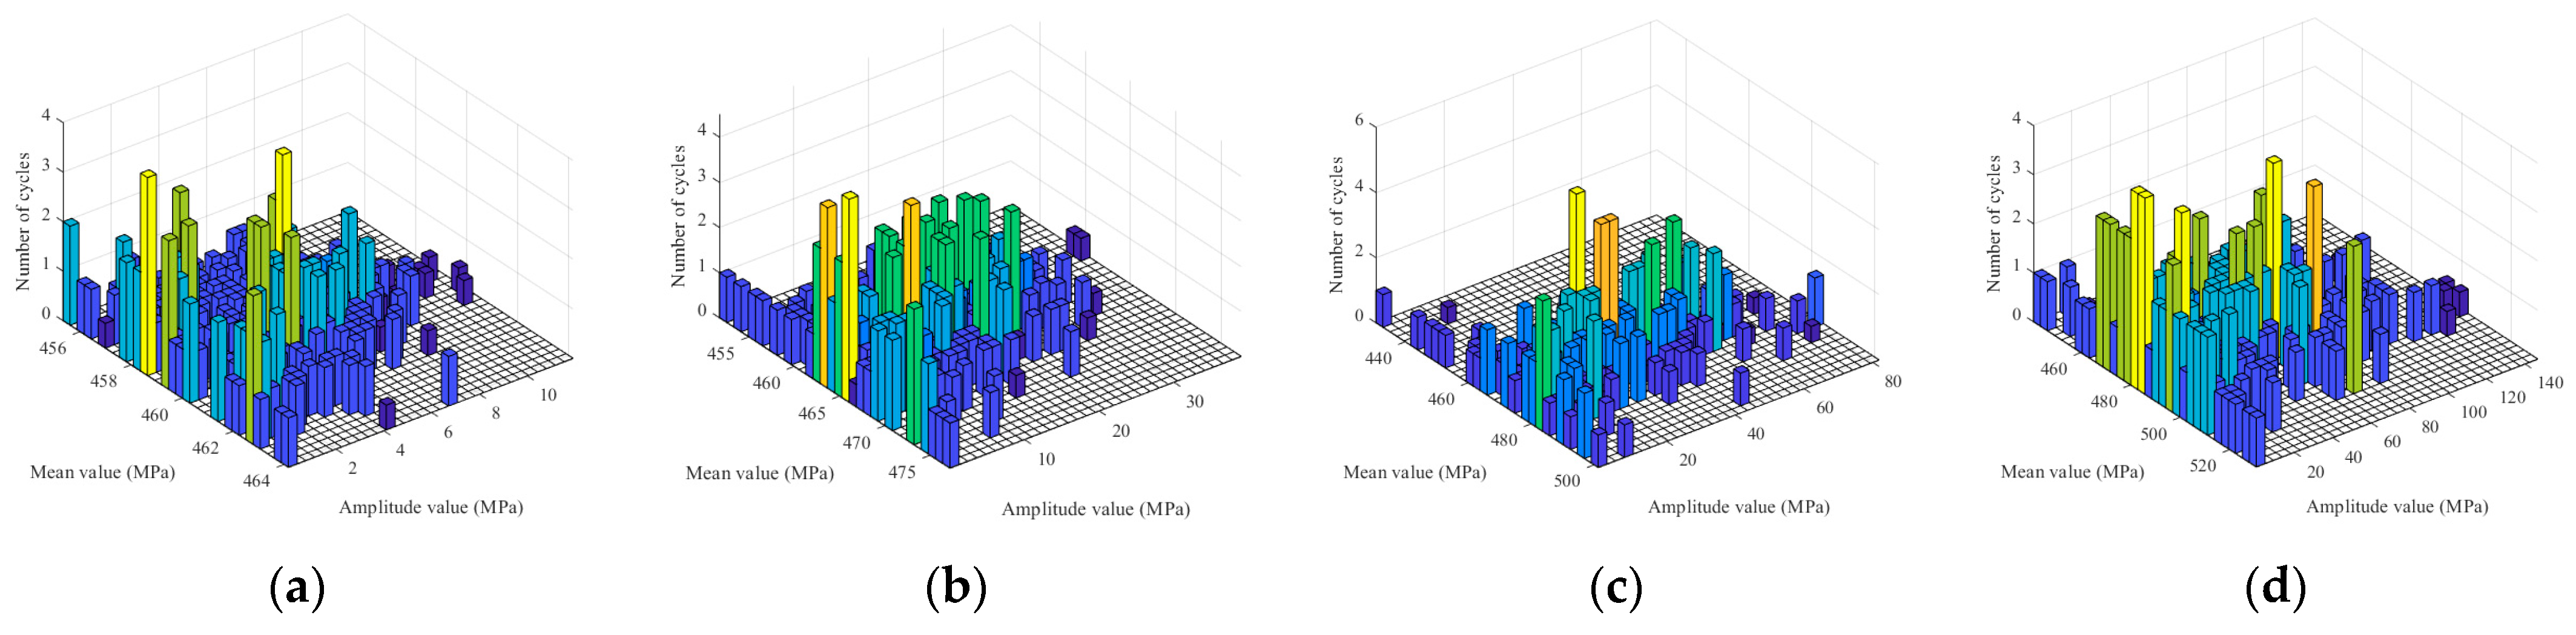
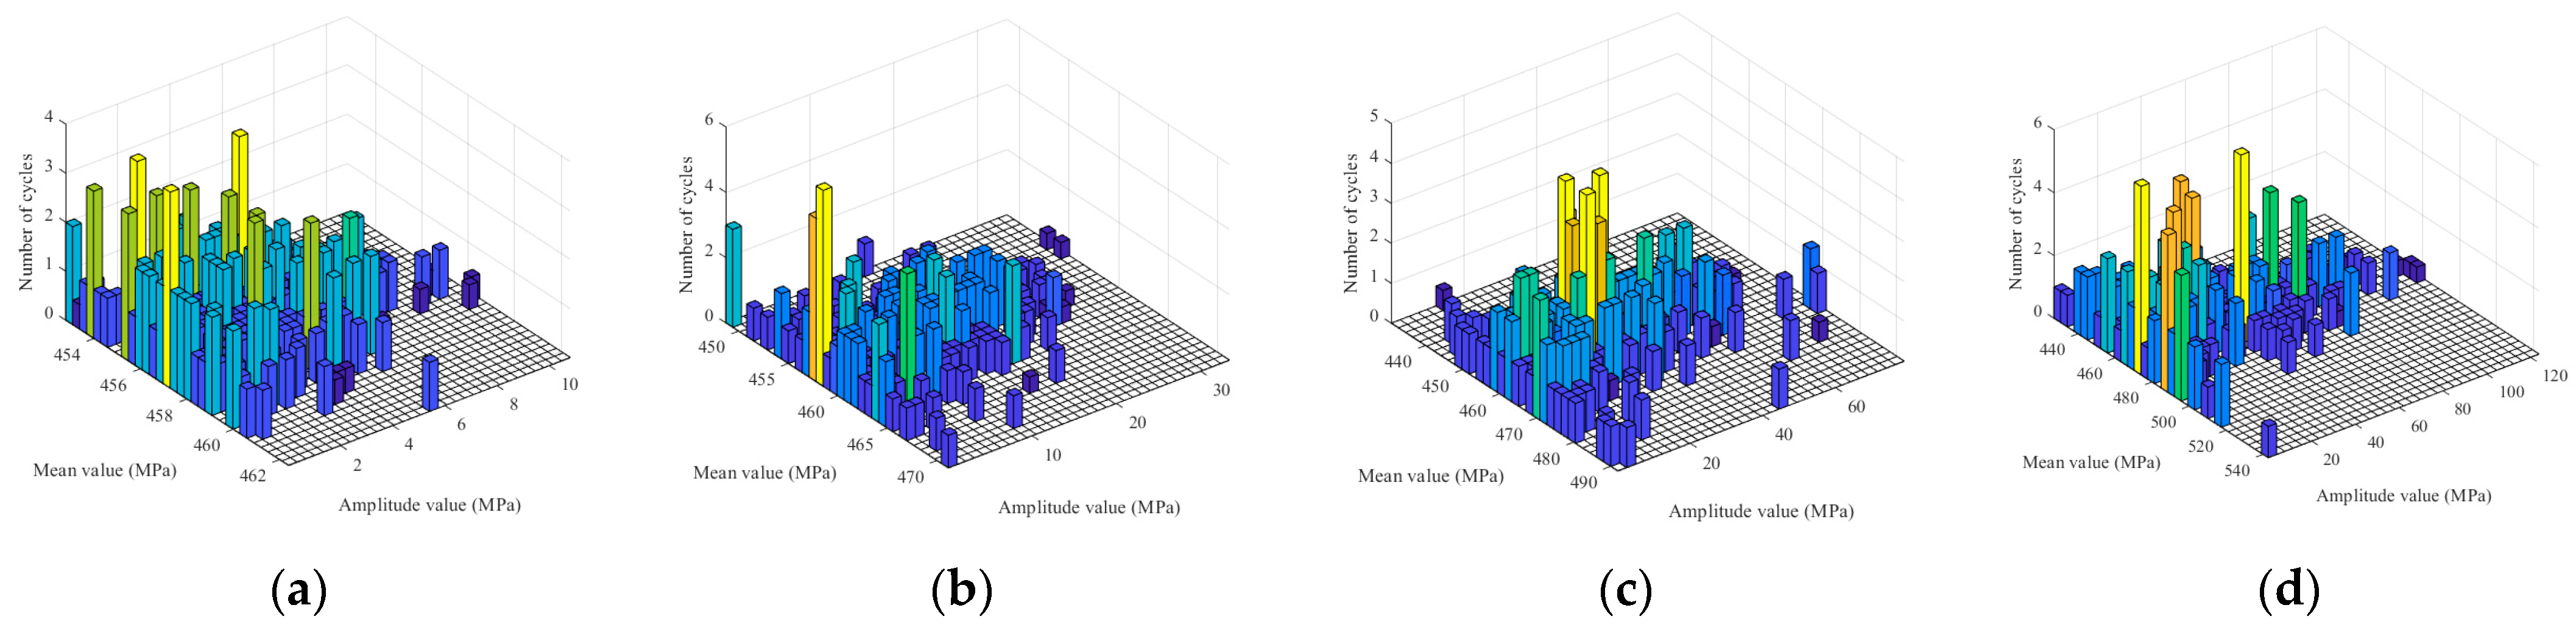
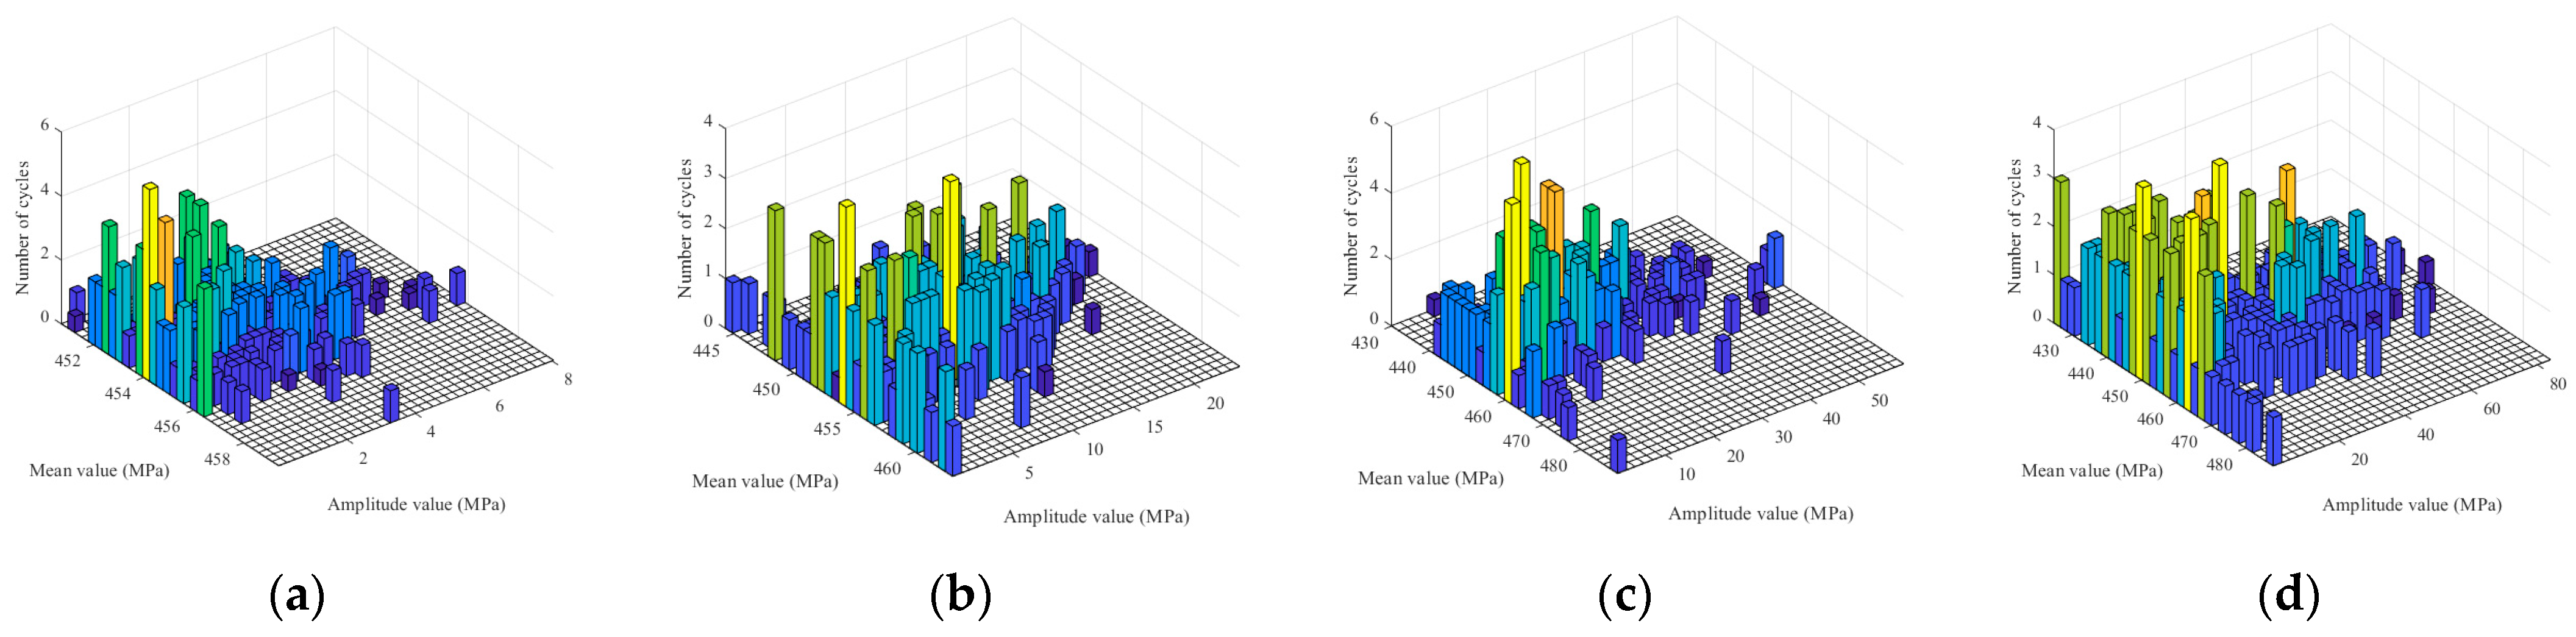
5. Buffeting Fatigue Damage Analysis of CFRP Stay Cables

As critical load-bearing components in cable-stayed bridges, the stay cables must endure not only complex and variable environmental conditions but also stress fluctuations caused by live loads such as wind, rain, and vehicular traffic. While CFRP cables offer advantages such as light weight and high strength, their susceptibility to high-frequency vibrations may accelerate fatigue damage accumulation. Therefore, it is essential to evaluate their fatigue performance and damage under wind-induced responses during service.

5.1. Fatigue and Damage Analysis Theory

Fatigue failure occurs under cyclic stress loading, where the relationship between the stress amplitude and the number of cycles is defined by the S-N curve as Equation (13). Serving as a critical indicator of the fatigue performance of components, this curve characterizes the entire temporal progression from stress initiation and crack formation to functional failure.
S m × N = C
where m and C are constants related to the material properties, stress ratio, and loading mode, typically determined experimentally; S denotes the stress amplitude, and N represents the number of cycles.
Fatigue failure under constant-amplitude loading can be estimated using the material’s S-N curve to predict the number of cycles to structural failure. However, for real-world cable-stayed bridges subjected to stochastic wind loads, direct application of the S-N curve is inadequate. This necessitates the use of fatigue cumulative damage theory, which accounts for variable-amplitude stress histories. The Palmgren–Miner rule postulates a linear relationship between fatigue damage and applied load cycles, assuming independence between stress-level effects. Total damage is calculated as the linear summation of individual cycle contributions, expressed as follows:
D t = n i N i
where n i is number of cycles at stress level S i ; N i is cycles to failure at S i , which is obtained from the S-N curve.
Given the complexity of fatigue phenomena and the current limitations in cumulative damage theory, alternative models to the Miner’s linear cumulative damage rule often involve excessive computational complexity, hindering their practical engineering applications. Therefore, this study employed the Miner’s rule to investigate the fatigue damage of CFRP stay cables under turbulent wind loads. Furthermore, based on reference [29,30], the S-N curves for CFRP and steel stay cables were, respectively, defined as follows:
S = 20.512 lg ( N ) + 541.33
lg N = 14.36 3.5 lg S   S > 200   M P a 37.187 13.423 lg S   S < 200   M P a
where S denotes the stress amplitude, and N represents the number of cycles to material failure under the corresponding stress amplitude.

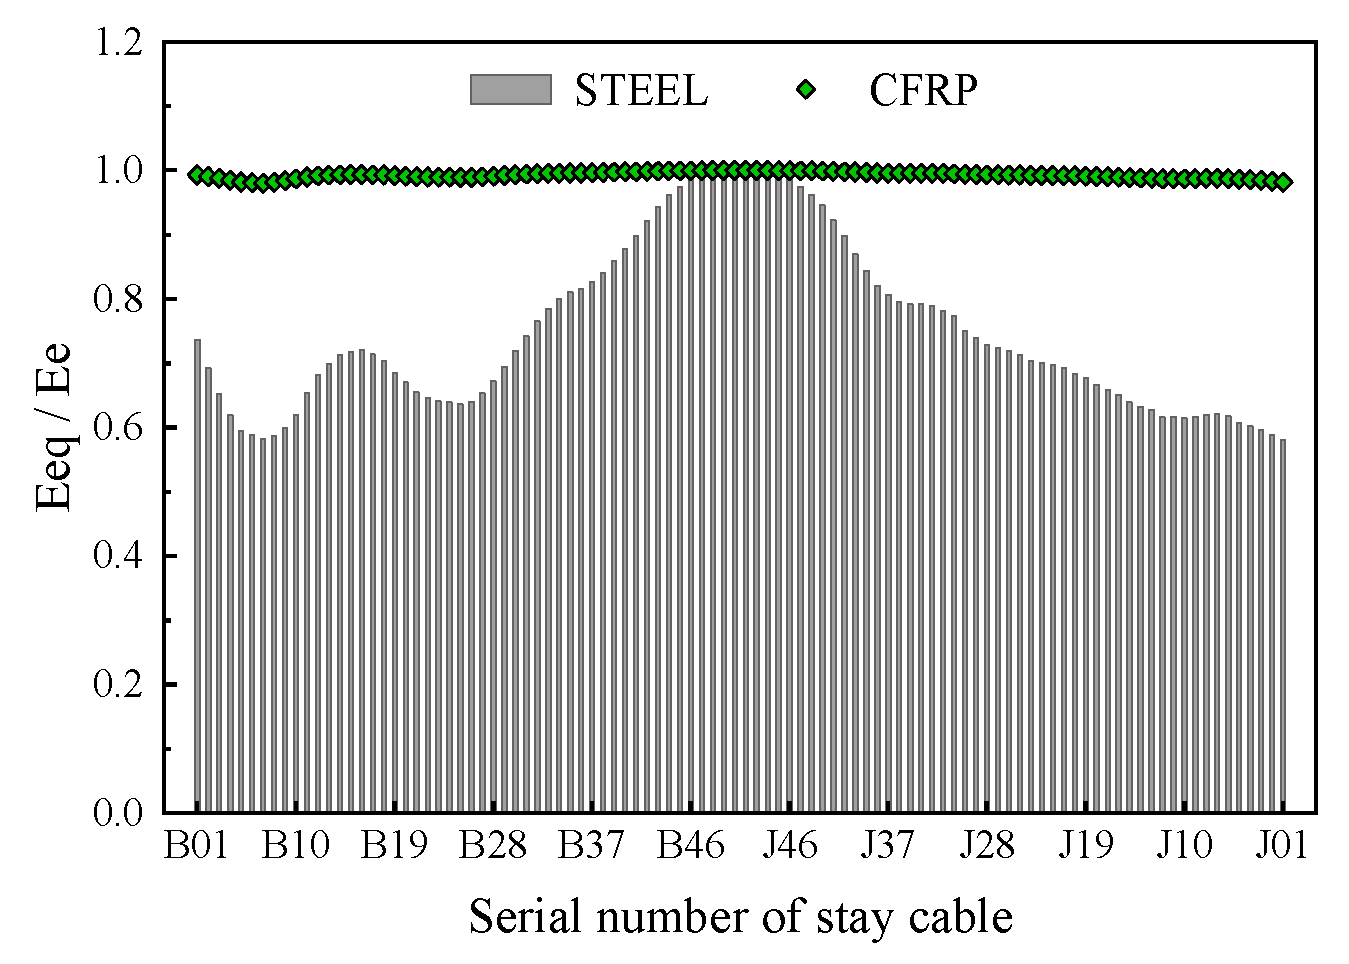
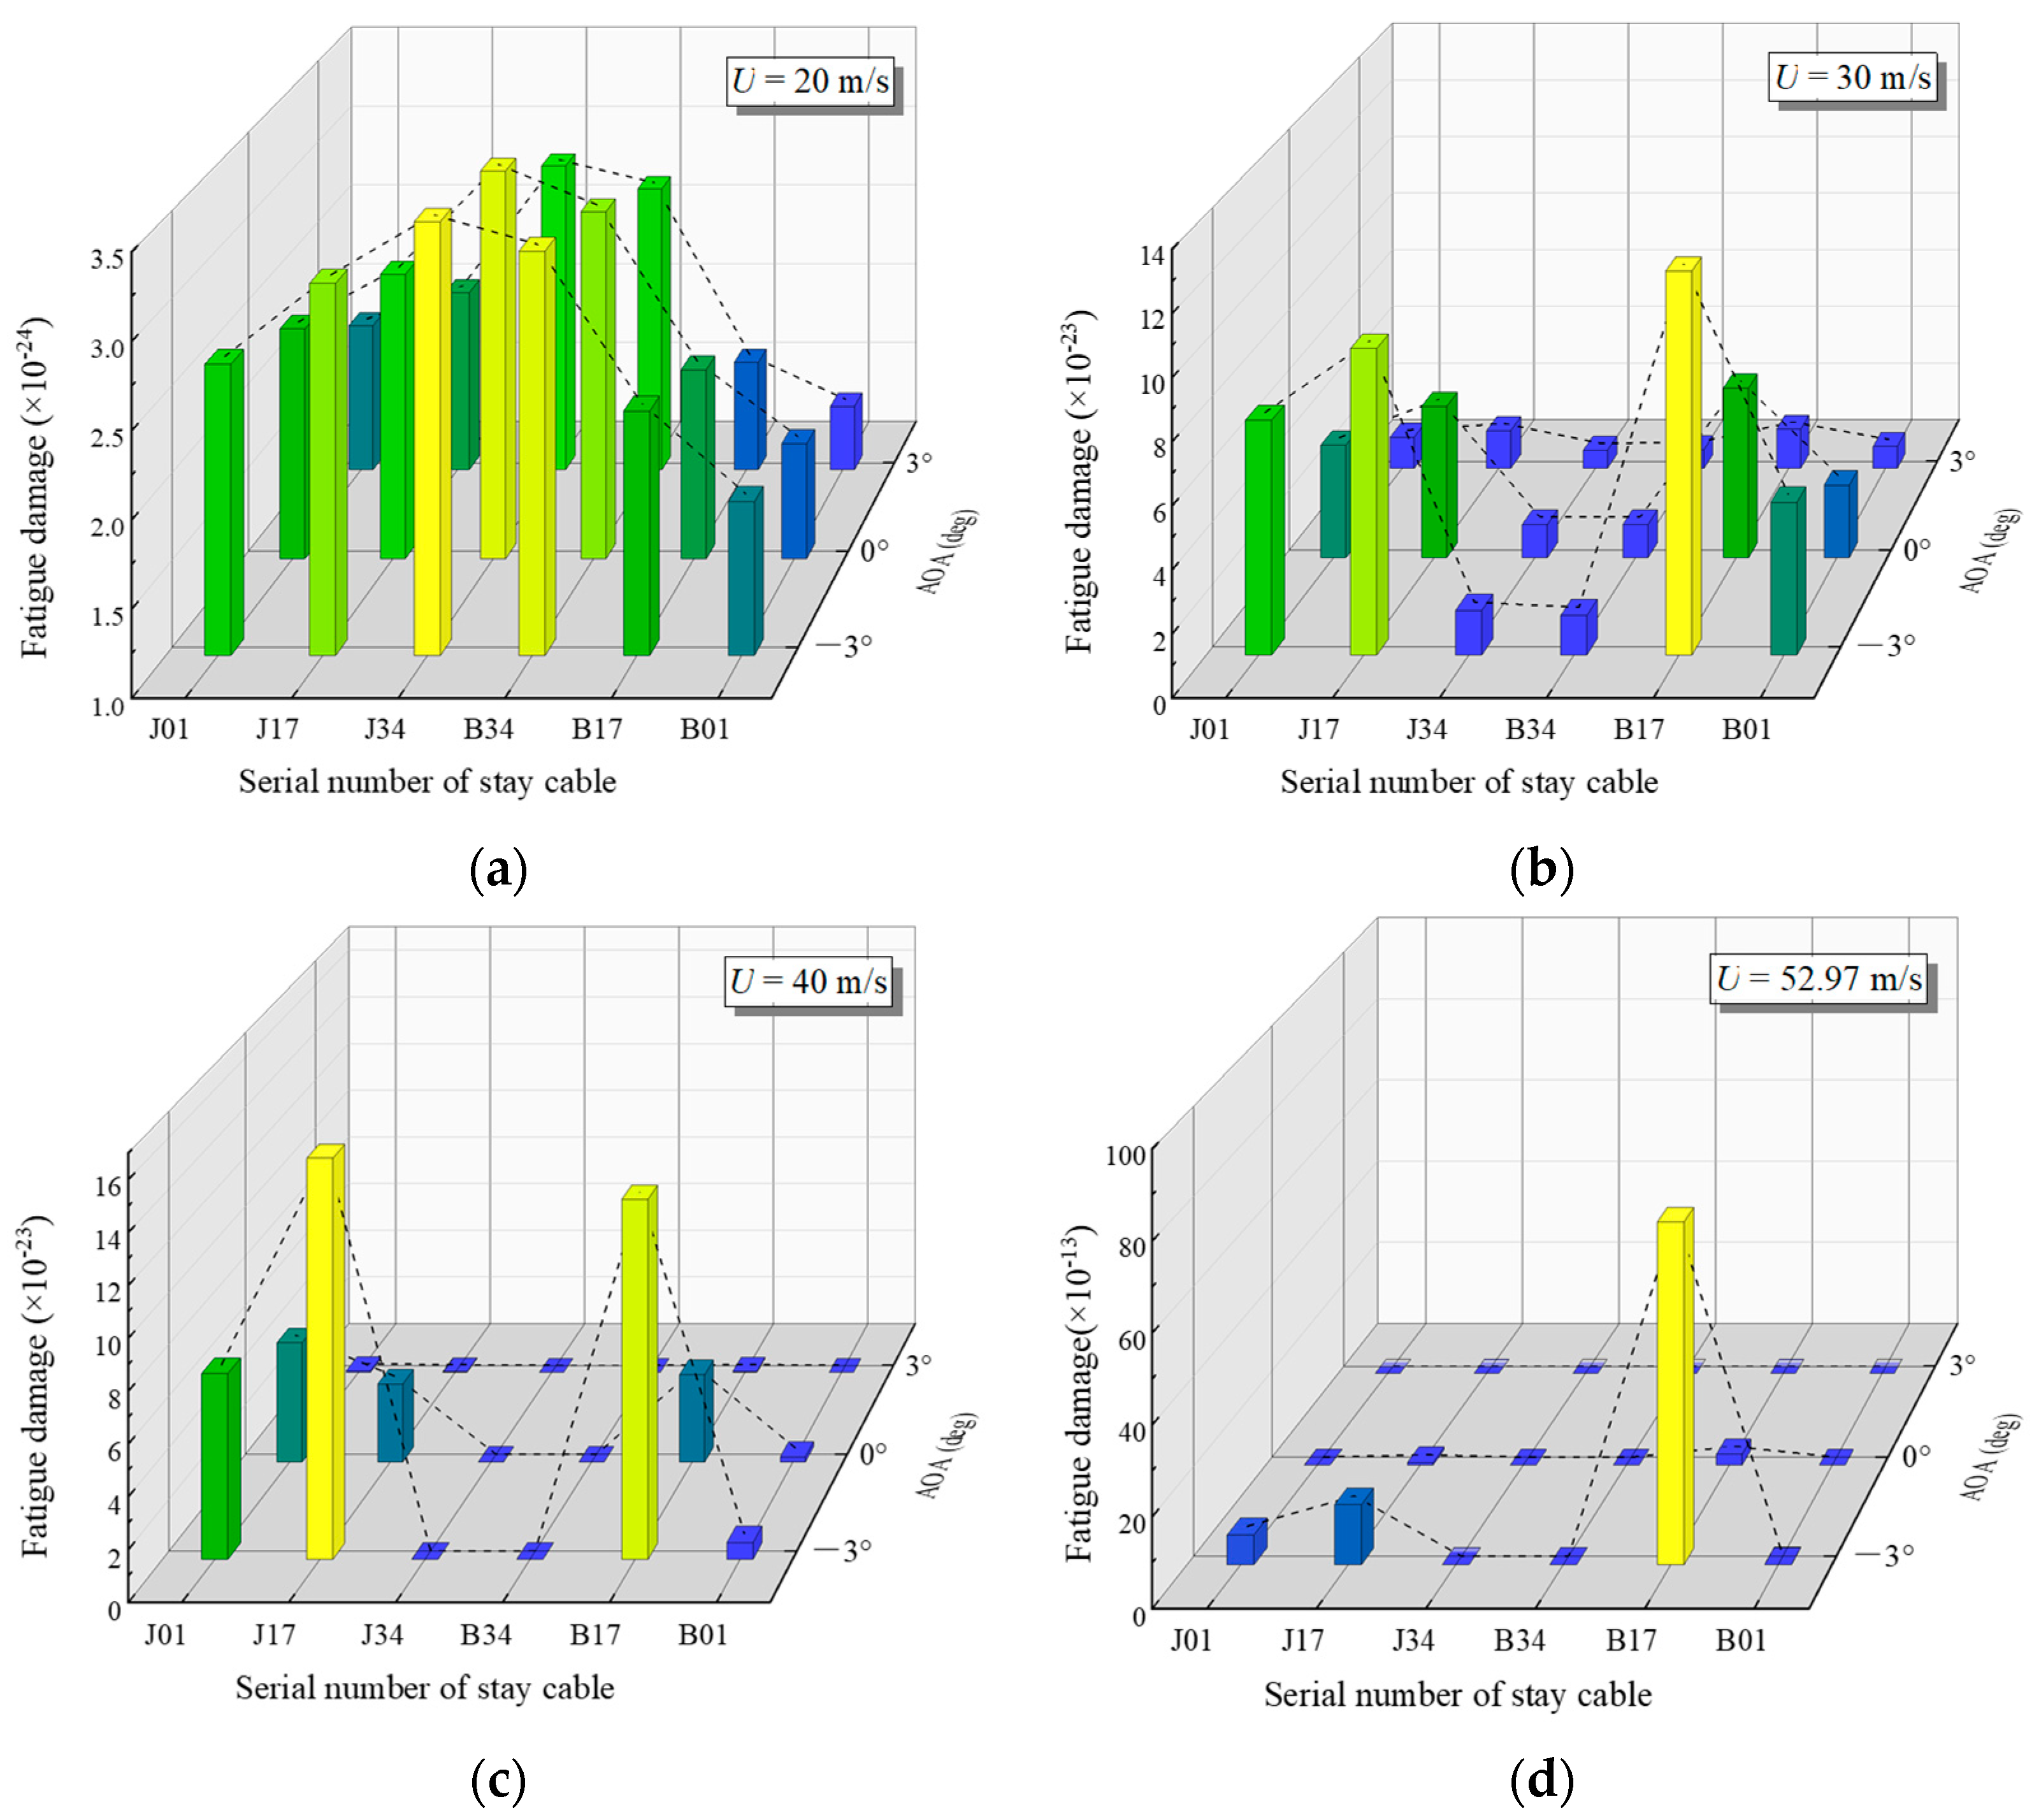
5.2. CFRP Cable Fatigue Damage Analysis

As shown in Figure 18, the analysis focused on stay cables B01, B17, and B34 from the side spans and J01, J17, and J34 from the main span of the CFRP cable-stayed bridge scheme. These cables were uniformly distributed along the longitudinal axis of the bridge, covering a range of lengths and stress amplitudes. The stress time histories of these cables under varying wind speeds and angles of attack were extracted. The comparative analysis revealed that the windward-side cables exhibited larger stress amplitudes and more intense buffeting responses. Therefore, this study conducted a statistical analysis of fatigue damage based on stress variations in windward-side cable elements.
The stress time histories of these cables under varying wind speeds and angles of attack were extracted. Due to space constraints, only the stress time histories of cable J01 under the design wind speed at AOA of 0°, 3°, and −3° are presented in Figure 19.
To statistically analyze the cyclic stress amplitudes and the corresponding cycle counts of the bridge stay cable elements under buffeting forces, a rainflow counting algorithm [31] was programmed in MATLAB R2024a to process the stress time histories of multiple critical stay cables across various loading conditions. Distribution plots of the stress amplitudes were generated to illustrate the relationships among stress amplitude, cycle count, and mean stress. To conserve space, Figure 20, Figure 21 and Figure 22 present the stress amplitude distributions of the J01 stay cable under three angles of attack (−3°, 0°, 3°) and varying wind speeds, derived from the rainflow counting method. These results illustrate the relationships among stress amplitude, cycle count, and mean stress under different wind–load combinations.
By statistically processing the stress amplitudes and cycle counts obtained from the rainflow counting method and combining the S-N curve Equation (15) with the fatigue damage accumulation formula Equation (14), the cumulative fatigue damage of stay cables at various locations under different wind conditions can be calculated. This study compared the fatigue damage of critical cables in both schemes under the design wind speed over a 1000 s duration across different angles of attack. The results, summarized in Table 4, demonstrate that, under identical wind loads, the steel stay cables exhibited significantly higher fatigue damage caused by turbulent wind than the CFRP stay cables. Additionally, at a −3° angle of attack, cables at all locations in both the schemes showed greater fatigue damage than under other angles. This phenomenon may arise because, at negative angles of attack, the aerodynamic lift coefficient and aerodynamic moment coefficient of the main girder both become negative. Consequently, the aerodynamic load on the girder manifests as a downward pressure and a torsional moment that forces the girder cross-section to face the incoming flow. Simultaneously, the stay cables experience larger lateral deformations due to aerodynamic drag. The combined effects of these factors result in significantly higher cable stresses at −3° than at other angles of attack.
After performing dynamic calculations on the CFRP cable-stayed bridge structure under varying wind speeds and angles of attack, the stress time histories of the stay cables at characteristic positions were extracted. Through the rainflow counting method and fatigue damage accumulation calculations, the fatigue damage of each CFRP cable under different wind speeds and angles of attack was obtained, as shown in Figure 23. The results indicate that, when the mean wind speed at deck height was 20 m/s, the fatigue damage of the CFRP cables varied minimally and decreased with increasing cable length. However, at a mean wind speed of 30 m/s, the damage distribution showed significant changes, with the maximum fatigue damage occurring at cables J17 and B17 under a −3° angle of attack. As seen in Figure 17, these cables were close to the 1/4 span of the main girder and the mid-span of the side span, respectively. As the wind speed further increased, the fatigue damage of all cables grew nonlinearly, but the maximum damage remained concentrated at J17 and B17, significantly exceeding that at other locations. At the design wind speed, under a −3° angle of attack, the fatigue damage of cable B17 far surpassed that of the other cables.
This phenomenon likely arises because, under turbulent wind loads covering multiple frequencies, the main girder’s vibration at specific higher-order frequencies forces cables near these positions to endure substantially larger stress amplitudes than others, accelerating fatigue damage accumulation and rendering these cables the most vulnerable.
Based on the above computational results, this study estimated the fatigue damage of CFRP stay cables induced by turbulent wind loads. The analysis adopted a mean wind speed of 30 m/s at deck height. While a 3° angle of attack was more critical for structural deformation, the −3° angle induced greater cable stress amplitudes and was thus selected as the adverse angle of attack for fatigue life assessment. Taking the most vulnerable cable B17 as an example, its annual fatigue damage value under turbulent wind loads at 30 m/s and −3° angle of attack was approximately 1.42 × 10⁻¹⁹, which is far below the critical fatigue damage threshold of 1.0. This indicates that CFRP cables will not experience fatigue failure due to buffeting wind loads during their service life.
Nevertheless, despite the CFRP cables’ exceptional fatigue resistance, bridge design and maintenance protocols should rigorously address the fatigue performance of cables at critical locations such as B17. Where necessary, appropriate vibration mitigation measures including cross-ties or dampers should be implemented to prevent long-term damage accumulation under stochastic loads such as traffic or wave-induced vibrations.

6. Conclusions

Based on the comprehensive analysis of static wind stability, buffeting response, internal resonance characteristics, and fatigue damage in ultra-long-span CFRP cable-stayed bridges, the following conclusions can be drawn:
(1)
The CFRP cable scheme demonstrated superior static wind stability compared with the steel cable scheme, with reduced lateral displacements at equilibrium positions under design wind speeds. The RMS values of vertical, lateral, and torsional buffeting responses in CFRP cables were reduced by 31.6%, 28.5%, and 20.6%, respectively, at mid-span under critical wind angles of attack. This improvement stems from the CFRP’s lower self-weight and higher stiffness, which mitigate sag effects and aerodynamic drag.
(2)
The steel cables exhibited significant internal resonance under turbulent wind excitation due to frequency coupling between cable modes and structural vibration frequencies. In contrast, the CFRP cables avoided such resonance phenomena owing to their higher natural frequencies and reduced sensitivity to anchorage-end excitations. The sparser frequency distribution of CFRP cables effectively decoupled cable–girder interactions, suppressing mode transitions and clustered spectral peaks.
(3)
Fatigue analysis based on the Palmgren–Miner rule and rainflow counting demonstrated that the CFRP cables exhibited orders-of-magnitude lower cumulative fatigue damage than the steel cables under identical wind conditions. The maximum fatigue damage in CFRP cables remained confined to critical positions but stayed within safe limits, validating the CFRP’s superior durability under stochastic wind loading.
(4)
Replacing steel cables with CFRP cables in ultra-long-span cable-stayed bridges significantly enhances wind resistance, reduces maintenance costs associated with fatigue and corrosion, and extends service life. This study provides theoretical and computational support for CFRP cable applications in mega-span bridge engineering, addressing key challenges in aerodynamic stability and fatigue performance.

Author Contributions

Conceptualization, Y.N. and Z.Z.; Methodology, Y.N.; Formal analysis, Y.N.; Investigation, F.H.; Writing—original draft preparation, Y.N.; Writing—review and editing, Y.N.; Visualization, Y.N. and F.H.; Project administration, Z.Z. and J.Z.; Funding acquisition, Z.Z. and J.Z. All authors have read and agreed to the published version of the manuscript.

Funding

This research was funded by the National Natural Science Foundation of China (Grant numbers: 51938012; 52268073; 52068020) and the Natural Science Fund projects of Hainan Province (Grant number: 525RC708).

Institutional Review Board Statement

Not applicable.

Informed Consent Statement

Not applicable.

Data Availability Statement

The original contributions presented in this study are included in this article; further inquiries can be directed to the corresponding author.

Acknowledgments

We hereby extend our sincere gratitude to Renyang Lin for his support and supervision and data curation.

Conflicts of Interest

The authors declare no conflicts of interest.

Abbreviations

The following abbreviations are used in this manuscript:
CFRPCarbon fiber-reinforced polymer
PSDPower spectral density
FEMFinite element model
AOAAngle of attack
RMSRoot mean square

References

  1. Nagai, M.; Yamaguchi, H.; Nogami, K.; Fujino, Y. Effect of cable size on static and dynamic instabilities of long-span cable-stayed bridges. In Proceedings of the Cable-Supported Bridges—Challenging Technical Limits, Seoul, Republic of Korea, 12–14 June 2001. [Google Scholar]
  2. Nagai, M.; Fujino, Y.; Yamaguchi, H.; Iwasaki, E. Feasibility of a 1400 m Span Steel Cable-Stayed Bridge. J. Bridge Eng. 2004, 9, 444–452. [Google Scholar] [CrossRef]
  3. Xie, G.H.; Yin, J.; Liu, R.G.; Chen, B.; Cai, D.S. Experimental and numerical investigation on the static and dynamic behaviors of cable-stayed bridges with CFRP cables. Compos. Part B Eng. 2017, 111, 235–242. [Google Scholar] [CrossRef]
  4. Wang, X.; Wu, Z. Evaluation of FRP and hybrid FRP cables for super long-span cable-stayed bridges. Compos. Struct. 2010, 92, 2582–2590. [Google Scholar] [CrossRef]
  5. Zhang, M.J.; Xu, F.Y. Wind-induced Nonlinearities of Super Long Stay Cables. In Proceedings of the 2015 4th International Conference on Sustainable Energy and Environmental Engineering, Shenzhen, Chian, 20–21 December 2016. [Google Scholar]
  6. Chen, Z.Q.; Li, S.Y.; Deng, Y.C.; Wang, Y.Y.; An, M.; Yang, C. Recent Challenges and Advances on Study of Wind-induced Vibrations of Bridge Cables. J. Hunan Univ. (Nat. Sci.) 2022, 5, 1–8. [Google Scholar]
  7. Raeesi, A. Wind-Induced Response of Bridge Stay Cables in Unsteady Wind. Ph.D. Thesis, University of Windsor, Windsor, ON, Canada, 2015. [Google Scholar]
  8. Liu, Y.; Zwingmann, B.; Schlaich, M. Carbon Fiber Reinforced Polymer for Cable Structures—A Review. Polymers 2015, 7, 2078–2099. [Google Scholar] [CrossRef]
  9. Meier, U. Proposal for a Carbon Fiber Reinforced Composite Bridge across the Strait of Gibraltar at its Narrowest Site. Proc. Inst. Mech. Eng. Part B: Manag. Eng. Manuf. 1987, 201, 73–78. [Google Scholar] [CrossRef]
  10. Meier, H.; Meier, U.; Brönnimann, R. Zwei CFK-Kabel für die Storchenbrücke. Schweiz. Ing. Und Archit.-Schweiz. Bauztg. 1996, 114, 8–13. [Google Scholar]
  11. Christoffersen, J.; Hauge, L.; Bjerrum, J. Footbridge with Carbon-Fiber-Reinforced Polymers, Denmark. Struct. Eng. Int. 1999, 9, 254–256. [Google Scholar] [CrossRef]
  12. Geffroy, R.L. The Laroin Footbridge with Carbon Composite Stay-Cables. In Proceedings of the Footbridge 2002, Paris, France, 20–22 November 2002. [Google Scholar]
  13. Mei, K.H.; Li, Y.J.; Lu, Z.T. Application study on the first cable-stayed bridge with CFRP cables in China. J. Traffic Transp. Eng. (Engl. Ed.) 2015, 2, 242–248. [Google Scholar] [CrossRef]
  14. Tsay, J. Feasibility Study of Super-Long Span Bridges Considering Aerostatic Instability by a Two-Stage Geometric Nonlinear Analysis. Int. J. Struct. Stab. Dyn. 2021, 21, 2150033. [Google Scholar] [CrossRef]
  15. Long, G.; Sun, Y.; Shang, Z.; Wang, X.; Xu, X.; Wang, T. Aerodynamic performance and wind-induced response of carbon fiber-reinforced polymer (CFRP) cables. Sci. Rep. 2024, 14, 8154. [Google Scholar] [CrossRef] [PubMed]
  16. Yang, Y.Q.; Wang, X.; Wu, Z.S.; Peng, C. Damping properties of FRP cables for long-span cable-stayed bridges. Mater. Struct. 2016, 49, 2701–2713. [Google Scholar] [CrossRef]
  17. Zhang, Z.T.; Wu, T.; Fang, Z. Wind-resistance Performance Analysis of Long Span Cable Stayed Bridge Using High Performance Materials. J. Hunan Univ. (Nat. Sci.) 2018, 5, 11–18. [Google Scholar]
  18. Liu, Z.W.; Chen, A.R.; Zhou, Z.Y.; Ma, R.J. Comparison of Calculation Methods of Static Wind Loading on Stay Cables of Large Span Cable-Stayed Bridges. J. Tongji Univ. (Nat. Sci.) 2005, 5, 575–579. [Google Scholar]
  19. JTGT 3365-01-2020; Specifications for Design of Highway Cable-stayed Bridge. Ministry of Transport of the People’s Republic of China: Beijing, China, 2018. (In Chinese)
  20. Wang, X.; Wu, Z.S.; Wu, G.; Zhu, H.; Zen, F.X. Enhancement of basalt FRP by hybridization for long-span cable-stayed bridge. Compos. Part B Eng. 2020, 44, 184–192. [Google Scholar] [CrossRef]
  21. Zhao, H.X.; Zhang, W.M.; Jiang, X.F.; Liu, Z. Calculation Method for Equivalent Elastic Modulus of Cable Sag Effect Based on Catenary. J. China Foreign Highw. 2020, 02, 62–66. [Google Scholar]
  22. JTGT 3360-01-2018; Wind-resistant Design Specification for Highway Bridges. Ministry of Transport of the People’s Republic of China: Beijing, China, 2018. (In Chinese)
  23. Deodatis, G. Simulation of Ergodic Multivariate Stochastic Processes. J. Eng. Mech. 1996, 122, 778–787. [Google Scholar] [CrossRef]
  24. Luo, J.; Han, D. A fast simulation method of stochastic wind field for long-span structures. Eng. Mech. 2008, 25, 96–101. [Google Scholar]
  25. Zhang, Z.T.; Ge, Y.J.; Chen, Z.Q. A New Aerodynamic Method For Long-Span Bridge Buffeting Analysis. Eng. Mech. 2006, 23, 94–101. [Google Scholar]
  26. Qian, C.; Zhu, L.D.; Zhu, Q.; Ding, Q.S.; Yan, L. Pattern and mechanism of wind-induced static instability of super-long-span cable-stayed bridge under large deformation. J. Wind. Eng. Ind. Aerodyn. 2022, 221, 104910. [Google Scholar] [CrossRef]
  27. Wu, Z.; Wei, J. Nonlinear Analysis of Spatial Cable of Long-Span Cable-Stayed Bridge considering Rigid Connection. Ksce J. Civ. Eng. 2019, 23, 2148–2157. [Google Scholar] [CrossRef]
  28. Zhang, Z.T.; Zeng, J.D.; Zhu, L.D.; Ge, Y.J. Buffeting-Induced Resonances of Hangers at a Long-Span Suspension Bridge and Mitigation Countermeasure. J. Bridge Eng. 2021, 26, 4021064. [Google Scholar] [CrossRef]
  29. Khoramishad, H.; Crocombe, A.D.; Katnam, K.B.; Ashcroft, I.A. Predicting fatigue damage in adhesively bonded joints using a cohesive zone model. Int. J. Fatigue 2010, 32, 1146–1158. [Google Scholar] [CrossRef]
  30. He, X.H.; Cheng, H.; Li, G.Q. Buffeting-Induced Fatigue Damage Analysis on the Stayed Cables of Long-Span Steel Truss Cable-Stayed Bridge. J. Chongqing Jiaotong Univ. (Nat. Sci.) 2013, 32, 752–755. [Google Scholar]
  31. Amzallag, C.; Gerey, J.P.; Robert, J.L.; Bahuaud, J. Standardization of the rainflow counting method for fatigue analysis. Int. J. Fatigue 1994, 16, 287–293. [Google Scholar] [CrossRef]
Figure 1. Analysis steps of this study.
Applsci 15 05267 g001
Figure 2. Schematic diagram of key bridge components. (a) The general layout (unit: m). (b) The layout of the bridge pylon (unit: cm). (c) Bridge deck section (unit: mm).
Applsci 15 05267 g002
Figure 3. Comparison of two schemes of stay cables: (a) section area; (b) cable diameter.
Applsci 15 05267 g003
Figure 4. Comparison of equivalent elastic modulus.
Applsci 15 05267 g004
Figure 5. ANSYS finite element model: (a) isometric view; (b) pylon anchorage zone; (c) bottom of the pylon and pylon–girder constraint; (d) auxiliary pier–main girder constraint.
Applsci 15 05267 g005
Figure 6. Stay cable force comparison of two schemes.
Applsci 15 05267 g006
Figure 7. Target locations for wind field simulation.
Applsci 15 05267 g007
Figure 8. Simulated u ( t ) and w ( t ) at the middle span of the main girder.
Applsci 15 05267 g008
Figure 9. Wind spectra: (a) horizontal direction; (b) vertical direction.
Applsci 15 05267 g009
Figure 10. Aerostatic force coefficients of deck section.
Applsci 15 05267 g010
Figure 11. The displacement time history of the middle of the main girder: (a) vertical displacement; (b) lateral displacement; (c) torsional displacement.
Applsci 15 05267 g011
Figure 12. Buffeting-induced displacement responses RMS values in main girder under AOA of 3°: (a) vertical displacement; (b) lateral displacement; (c) torsional displacement.
Applsci 15 05267 g012
Figure 13. Diagram of overall wind-induced deformation in stay cables.
Applsci 15 05267 g013
Figure 14. RMS values of vertical and lateral displacements at center of the stay cables for the two schemes.
Applsci 15 05267 g014
Figure 15. Motion trajectories at the center of stay cables induced by buffeting: (a) No. J01 steel cable; (b) No. J04 steel cable; (c) No. J13 steel cable; (d) No. J01 CFRP cable; (e) No. J04 CFRP cable; (f) No. J13 CFRP cable.
Applsci 15 05267 g015aApplsci 15 05267 g015b
Figure 16. Vertical response spectra of the stay cables for the two schemes: (a) No. J01 steel cable; (b) No. J04 steel cable; (c) No. J13 steel cable; (d) No. J01 CFRP cable; (e) No. J04 CFRP cable; (f) No. J13 CFRP cable.
Applsci 15 05267 g016aApplsci 15 05267 g016b
Figure 17. Lateral response spectra of the stay cables for the two schemes: (a) No. J01 steel cable; (b) No. J04 steel cable; (c) No. J13 steel cable; (d) No. J01 CFRP cable; (e) No. J04 CFRP cable; (f) No. J13 CFRP cable.
Applsci 15 05267 g017
Figure 18. Layout of selected stay cables.
Applsci 15 05267 g018
Figure 19. Stress time history of No. J01 CFRP cable under design wind speed: (a) AOA = −3°; (b) AOA = 0°; (c) AOA = 3°.
Applsci 15 05267 g019
Figure 20. Stress amplitude distribution of the CFRP stay cable No. J01 under AOA of −3°: (a) U = 20 m/s; (b) U = 30 m/s; (c) U = 40 m/s°; (d) U = 52.97 m/s.
Applsci 15 05267 g020
Figure 21. Stress amplitude distribution of the CFRP stay cable No. J01 under AOA of 0°: (a) U = 20 m/s; (b) U = 30 m/s; (c) U = 40 m/s; (d) U = 52.97 m/s.
Applsci 15 05267 g021
Figure 22. Stress amplitude distribution of the CFRP stay cable No. J01 under AOA of 3°: (a) U = 20 m/s; (b) U = 30 m/s; (c) U = 40 m/s; (d) U = 52.97 m/s.
Applsci 15 05267 g022
Figure 23. Buffeting-induced fatigue damage of CFRP cables under different AOA within 1000 s: (a) U = 20 m/s; (b) U = 30 m/s; (c) U = 40 m/s; (d) U = 52.97 m/s.
Applsci 15 05267 g023
Table 1. Material parameters of primary structural members.
LocationMaterialTensile Strength (MPa)Modulus (GPa)Poisson’s RatioDensity (kg/m3)Area (m2)
PylonC60/360.22549/
Stay cable1860 HS steel18601950.38005(0.63~1.41) × 10−2
CFRP25501800.281500(0.55~1.30) × 10−2
Main girderQ3453452000.380052.1~3.53
Table 2. Parameters for turbulent wind field simulation.
ItemValueItemValue
Simulated points526Cutoff frequency2 Hz
Time span1000 sFrequency segmentation2000
Time step length0.25 sSurface roughness Coefficient0.16
Table 3. Equilibrium position of the middle of the main girder under the design wind speed.
Equilibrium PositionSchemeAOA (deg)
−303
Lateral (m)Steel2.7552.6692.972
CFRP2.5782.4882.786
Vertical (m)Steel−0.3950.1330.546
CFRP−0.597−0.0830.307
Torsion (deg)Steel−0.218−0.1190.048
CFRP−0.242−0.1460.008
Table 4. Buffeting-induced fatigue damage of cable under U d within 1000 s for both schemes.
AOA (deg)SchemeSerial Number of Stay Cable
B01B17B34J34J17J01
−3STEEL3.592 × 10−73.432 × 10−62.826 × 10−89.981 × 10−97.437 × 10−73.450 × 10⁻⁷
CFRP8.604 × 10−157.595 × 10−121.587 × 10−171.492 × 10−181.335 × 10−126.641 × 10⁻¹³
0STEEL8.368 × 10−81.786 × 10−61.543 × 10−83.064 × 10−95.903 × 10−77.542 × 10⁻⁷
CFRP5.868 × 10−162.515 × 10−131.351 × 10−182.555 × 10−195.618 × 10−145.004 × 10⁻¹⁵
3STEEL4.460 × 10−98.554 × 10−81.493 × 10−99.057 × 10−115.213 × 10−82.405 × 10−8
CFRP2.621 × 10−191.112 × 10−175.958 × 10−212.601 × 10−211.124 × 10−176.662 × 10⁻¹⁹
Disclaimer/Publisher’s Note: The statements, opinions and data contained in all publications are solely those of the individual author(s) and contributor(s) and not of MDPI and/or the editor(s). MDPI and/or the editor(s) disclaim responsibility for any injury to people or property resulting from any ideas, methods, instructions or products referred to in the content.

