1. Introduction
As construction projects continue to increase in densely populated urban areas, sidewalks adjacent to construction sites are often occupied by building materials and equipment [
1,
2,
3]. Such occupation reduces the available pedestrian space, forcing pedestrians to navigate narrow or disrupted pathways and thereby compromising the overall quality of walking [
4]. In severe cases, obstructed sidewalks compel pedestrians to detour onto vehicle roadways or other hazardous areas, increasing the risk of pedestrian accidents [
5,
6]. Given that pedestrian injuries arising from falls, slips, and trips significantly outnumber the reported fatalities yet remain unrecorded in official accident statistics [
7,
8,
9], ensuring pedestrian safety near construction sites is a critical issue.
To guarantee safe walking conditions around construction sites, many regulations prohibit excessive encroachment that interferes with pedestrian flow unless an alternative pedestrian route is provided [
10]. However, despite these clear guidelines, effective enforcement and implementation remain limited because construction sites are temporary and change rapidly [
11,
12,
13]. Moreover, improper safety practices and insufficient attention to pedestrian safety exacerbate the challenges of conducting timely inspections and maintaining compliance [
14,
15].
In response to these issues, various studies have proposed methods to evaluate sidewalks in terms of pedestrian comfort and safety. For example, Rostiyanti et al. [
12] conducted field observations to identify the potential risk factors affecting pedestrian safety on a temporary sidewalk near a light rail transit construction project in Indonesia. Although such expert-led audits provide in-depth, professional assessments of on-site conditions, they can be costly and time-consuming. Consequently, researchers have increasingly explored image- or virtual reality-based survey approaches. Lee et al. [
16] asked pedestrians to rate their satisfaction and dissatisfaction by viewing real images of diverse walking environments. Li et al. [
17] employed 360-degree panoramic street views enhanced with virtual reality technologies to identify scenes perceived as more pleasurable or safe for walking.
As image-based survey methods have become more common, researchers have adopted subjective indicators to capture pedestrians’ evaluations of their walking environments. One such indicator is perceived risk, which refers to an individual’s assessment of the potential danger in a given setting. Although the perceived risk may not directly correspond to the actual risk, it plays a critical role in safety research, as behavior is often guided by subjective perceptions rather than objective conditions [
18,
19]. For example, Kwon et al. [
20] observed that pedestrians who recognize a heightened risk tend to walk in haste to avoid perceived hazards, which, paradoxically, increases the likelihood of engaging in risky behavior.
Building on this perspective, other studies have highlighted that objective environmental attributes can shape pedestrians’ perceived risk and, in turn, influence their walking behavior. For example, Shuaib and Rana [
21] found that the presence of abandoned waste and piled-up construction materials on sidewalks heightens pedestrians’ perceived risk, leading many to avoid walking altogether. Conversely, Yoon and Lee [
22] reported that physical buffers, such as barrier walls, can reduce pedestrians’ perceived risk by providing a clear sense of separation and safety from nearby construction activity, thereby encouraging them to continue walking.
Although macro-level studies can capture general urban features, merely noting the presence or absence of specific objects reveals little about how these factors affect pedestrians’ perceived risk [
23]. In this context, researchers have introduced more fine-grained, micro-level approaches that examine factors such as surface materials, slopes, and width [
2,
11,
24,
25,
26,
27]. Among these, one widely used metric is the effective width, defined as the portion of sidewalk remaining available for pedestrians after accounting for obstructions. For example, Coppola and Marshall [
24] developed a method using QGIS software to calculate the effective sidewalk width considering static objects, but it does not address temporary encroachments like construction materials. Nag and Goswami [
11] developed a model that quantifies sidewalk encroachment with street images, but it required manual measurement by auditors, making it time-consuming and subjective. Ai and Tsai [
26] advanced an automated sidewalk assessment method using three-dimensional mobile LiDAR and image processing, yet the data collection costs remain a significant barrier. Furthermore, while many studies have examined the general factors that reduce sidewalk width, relatively few have specifically measured the extent of obstructions arising from construction activities.
Therefore, this study aims to quantitatively investigate how variations in the available sidewalk space adjacent to construction sites influence pedestrians’ perceived risk levels.
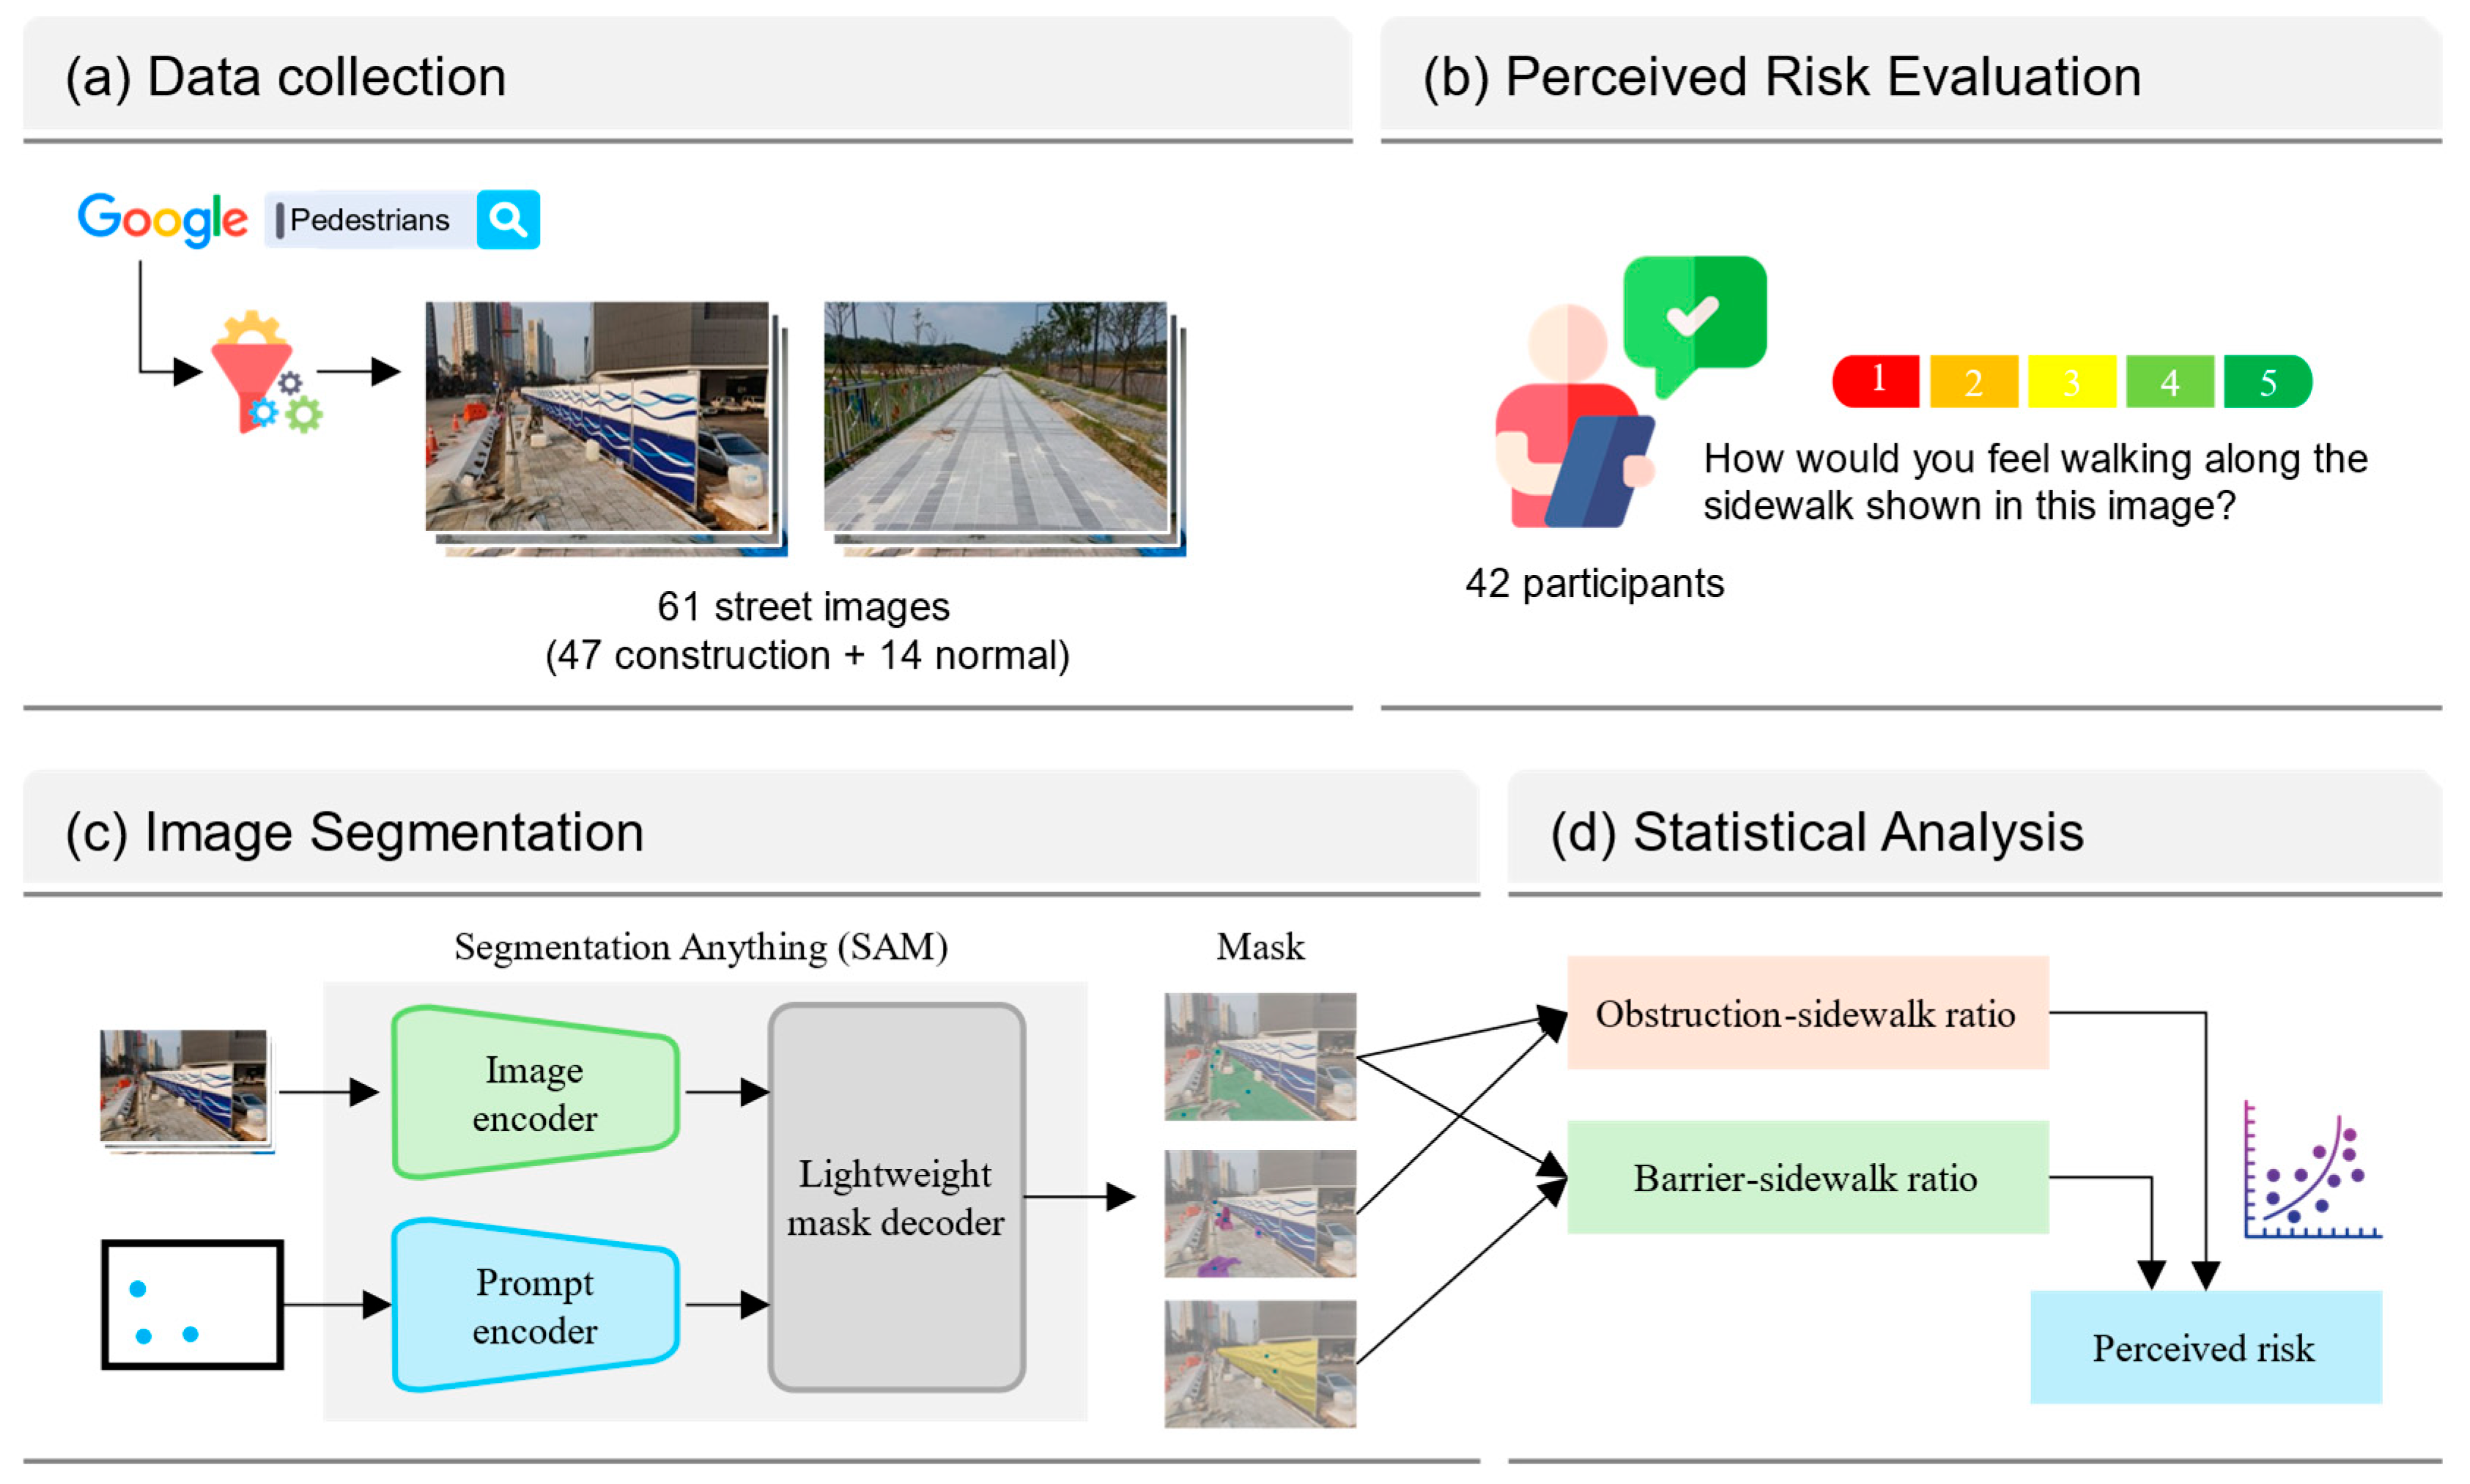
Figure 1 shows the research framework of the study, which consists of four main stages. First, 61 street images (47 depicting construction sites and 14 showing normal sidewalks) were collected through a web-scraping approach. Next, 42 participants were asked to evaluate their perceived risk while imagining walking along the sidewalks shown in each image. Perceived risk was rated using a five-point Likert scale. In the third stage, the Segment Anything Model (SAM) [
28] was applied to generate pixel-level segmentation masks for sidewalks, obstructions, and barriers in each image. SAM is a recently introduced foundation model that generates pixel-level segmentation masks, which refer to the spatial areas corresponding to specified objects based on a visual input and user-defined prompts [
28]. Its ability to segment complex scenes without task-specific training makes it particularly suitable for urban imagery involving construction zones. Finally, based on the extracted masks, two quantitative indicators—the obstruction–sidewalk ratio and the barrier–sidewalk ratio—were developed. These were used in a series of statistical analyses to explain variations in participants’ perceived risk based on objective visual features.
2. Materials and Methods
2.1. Data Gathering
Street images were gathered using a web-scraping approach that automatically retrieved pictures matching a predefined set of keywords [
29]. Google Images served as the primary search engine, employing queries such as “construction sites”, “work zones”, “sidewalks”, “pedestrians”, “building materials”, “temporary pedestrian walkways”, and “pedestrian accidents”. These queries aimed to capture a wide range of sidewalk conditions adjacent to construction sites, resulting in the initial retrieval of approximately 300 images. Once retrieved, the images underwent a thorough screening process to ensure both relevance and consistent quality. Three researchers independently reviewed the collected images based on the following five key criteria. First, any images that did not clearly depict a sidewalk adjacent to a construction site were excluded from the dataset. Second, images containing pedestrians, apart from construction workers, were removed to minimize any potential effects attributable to personal or behavioral characteristics [
30]. Third, to reduce the variability caused by differences in pavement materials and slopes, only sidewalks featuring brick-paved surfaces and flat gradients were retained. Fourth, images with resolutions below 320 × 320 or above 1920 × 1080 were excluded to ensure consistent visual clarity. Lastly, images containing large text overlays or visible watermarks were removed to avoid visual distractions. Ultimately, 47 images that met all five criteria were retained for analysis.
Because this study also aimed to compare obstructed sidewalks with unobstructed scenarios, an additional 14 images of normal sidewalks were collected to serve as a control dataset.
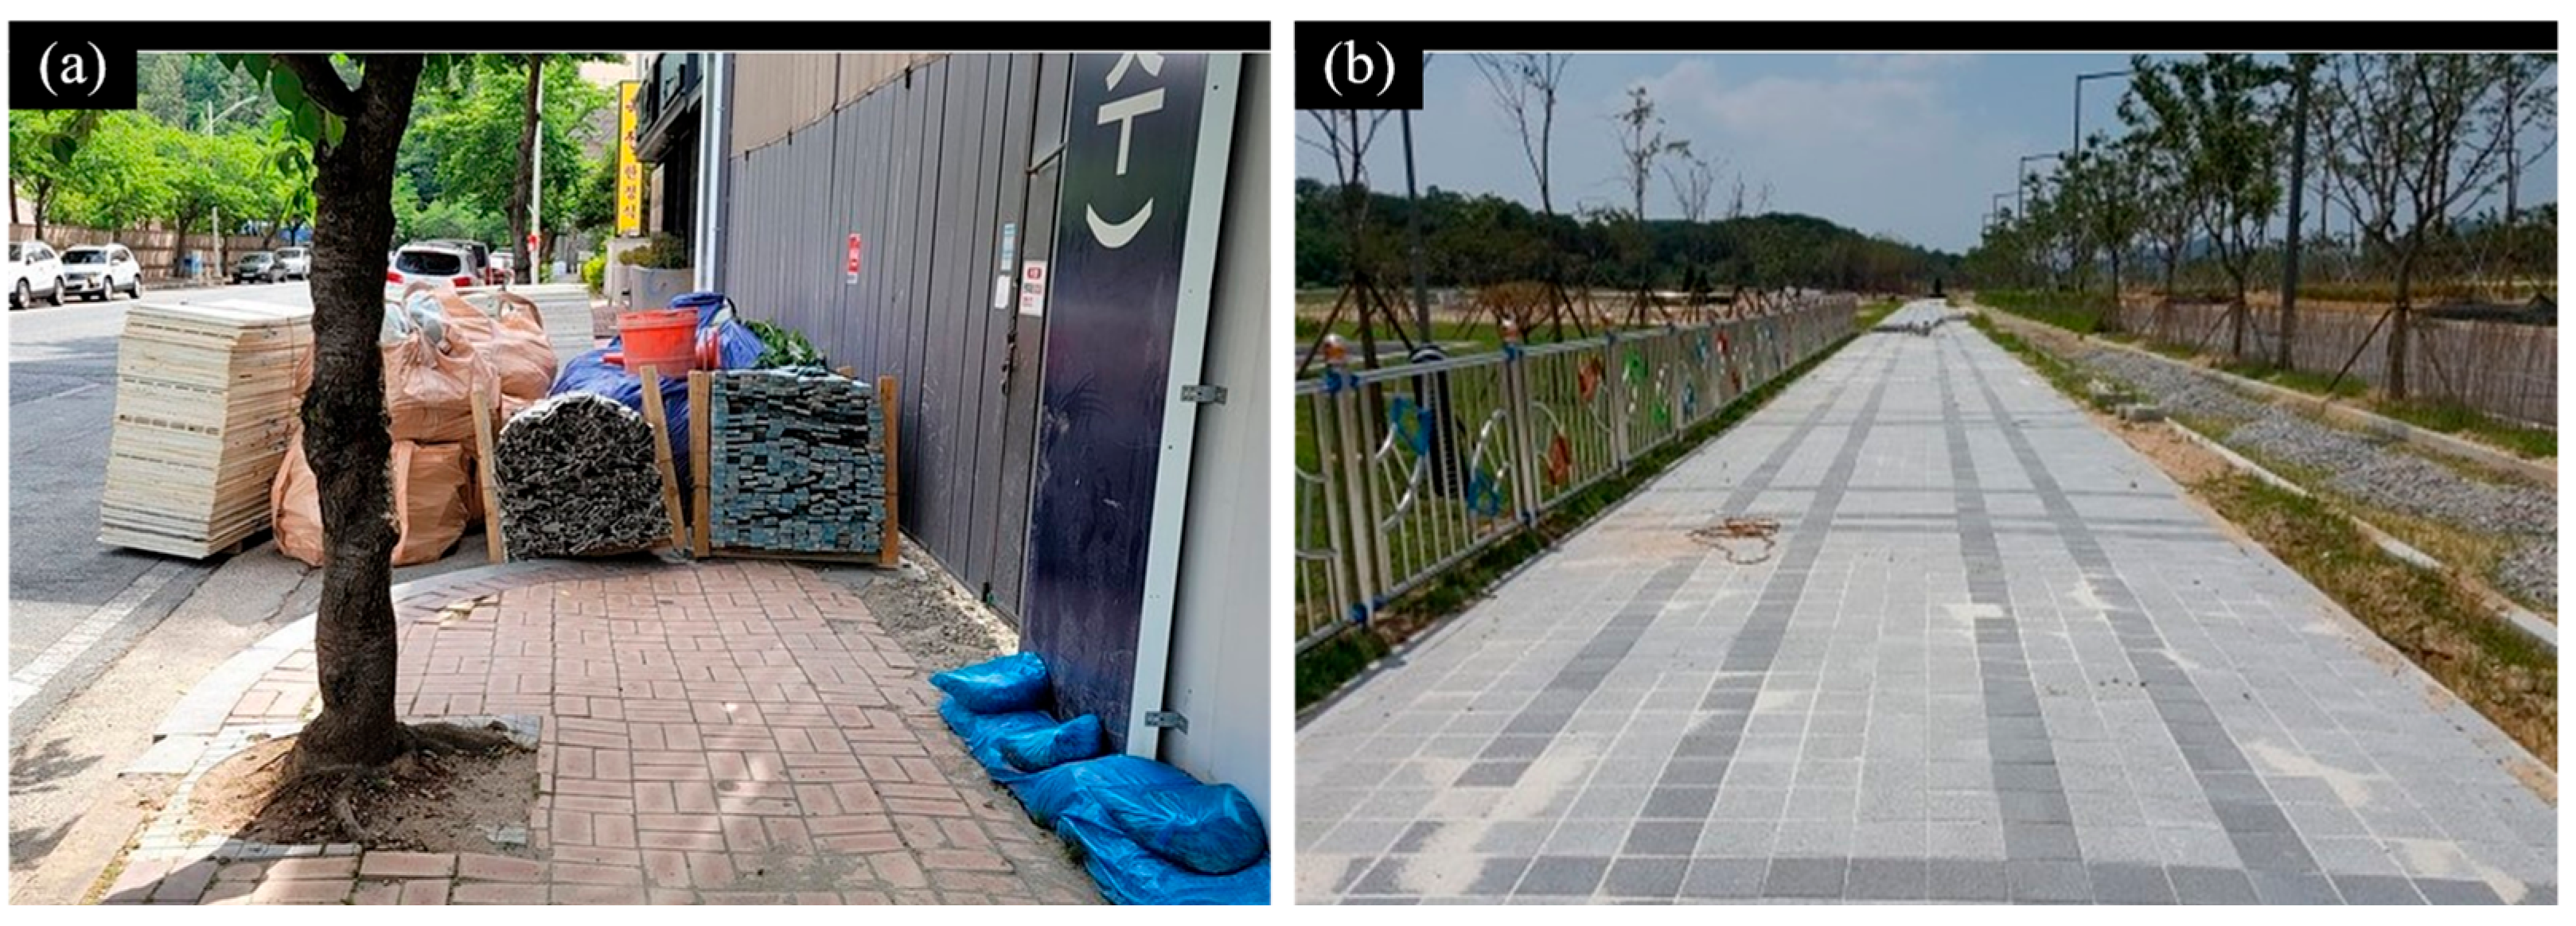
Figure 2a presents an example of a typical construction site environment with barrier walls and building materials placed on the sidewalk, whereas
Figure 2b depicts a representative normal urban sidewalk.
2.2. Participants and Sampling
An online survey was conducted to evaluate pedestrians’ perceived risk for the sidewalks depicted in the 61 collected images—47 illustrating sidewalks adjacent to construction sites and 14 representing normal conditions. Participants were recruited through a poster that was publicly displayed on a university campus for approximately six weeks (between 1 July 2023, and 10 August 2023). The poster included information about the study’s purpose, the estimated time commitment, and compensation for participation. Each participant received a mobile gift voucher equivalent to approximately USD 10 upon completion of the survey. To distribute rewards and prevent duplicate participation, mobile phone numbers were collected solely for one-time verification. These numbers were not linked to survey responses and were discarded after reward distribution.
The survey itself was administered through an online platform, and all responses were submitted anonymously. Prior to proceeding with the survey, participants were again informed about the general purpose of the study, the voluntary nature of their involvement, and their right to withdraw at any time without penalty. Informed consent was obtained from all participants before they began the survey. They were also assured that their responses would remain confidential. The research protocol was reviewed and approved by the Institutional Review Board of Incheon National University (Approval No.: 7007971-202305-010A).
Table 1 summarizes the demographic characteristics of the participants. A total of 42 individuals (33 males and 9 females) voluntarily participated in and completed the survey. This sample size is comparable to those used in similar image-based studies, which have typically recruited between 36 and 40 participants [
17,
31]. All participants were at least 20 years old, had experience walking along sidewalks adjacent to construction sites in urban areas, and reported no significant physical or mobility limitations. The majority of respondents (88.1%) were between 20 and 29 years old, which may reflect the university campus setting in which recruitment took place. In terms of the perceived sidewalk constraint, 64.3% of participants agreed or strongly agreed that the sidewalk became narrow due to construction work.
2.3. Perceived Risk Evaluation
The survey consisted of a straightforward evaluation designed to gauge pedestrians’ perceived risk based on street images. To facilitate user-friendly responses and ensure efficient data storage, a custom-built image evaluation program was developed using Python 3.12, as shown in
Figure 3. Using this program, participants reviewed a total of 61 images and provided their responses in a consistent format. Referring to questions used in previous studies [
32,
33,
34], only one standardized question was presented for each image: “How would you feel walking along the sidewalk shown in this image?” Response options were displayed using a five-point Likert scale: (1) very safe, (2) safe, (3) neither safe nor dangerous, (4) dangerous, or (5) very dangerous. The scale reflects the extent to which participants perceived the sidewalk as unsafe; thus, higher scores indicate a more dangerous walking environment. All images were displayed individually at the same size, and participants could either manually save each response or enable an auto-save option. To minimize ordering effects, the image sequence was randomized for each participant.
2.4. Image Segementation
Following the collection and evaluation of street images, this study employed SAM to generate segmentation masks for objects potentially impacting pedestrian safety. SAM, recently developed by Kirillov et al. [
28], constitutes a noteworthy advancement in computer vision by enabling real-time segmentation with minimal manual intervention. Designed as a foundation model for a broad range of segmentation tasks, SAM does not require an extensive training dataset and is therefore well suited to handling the complex nature of urban environments, where construction sites and pedestrians coexist [
35,
36,
37].
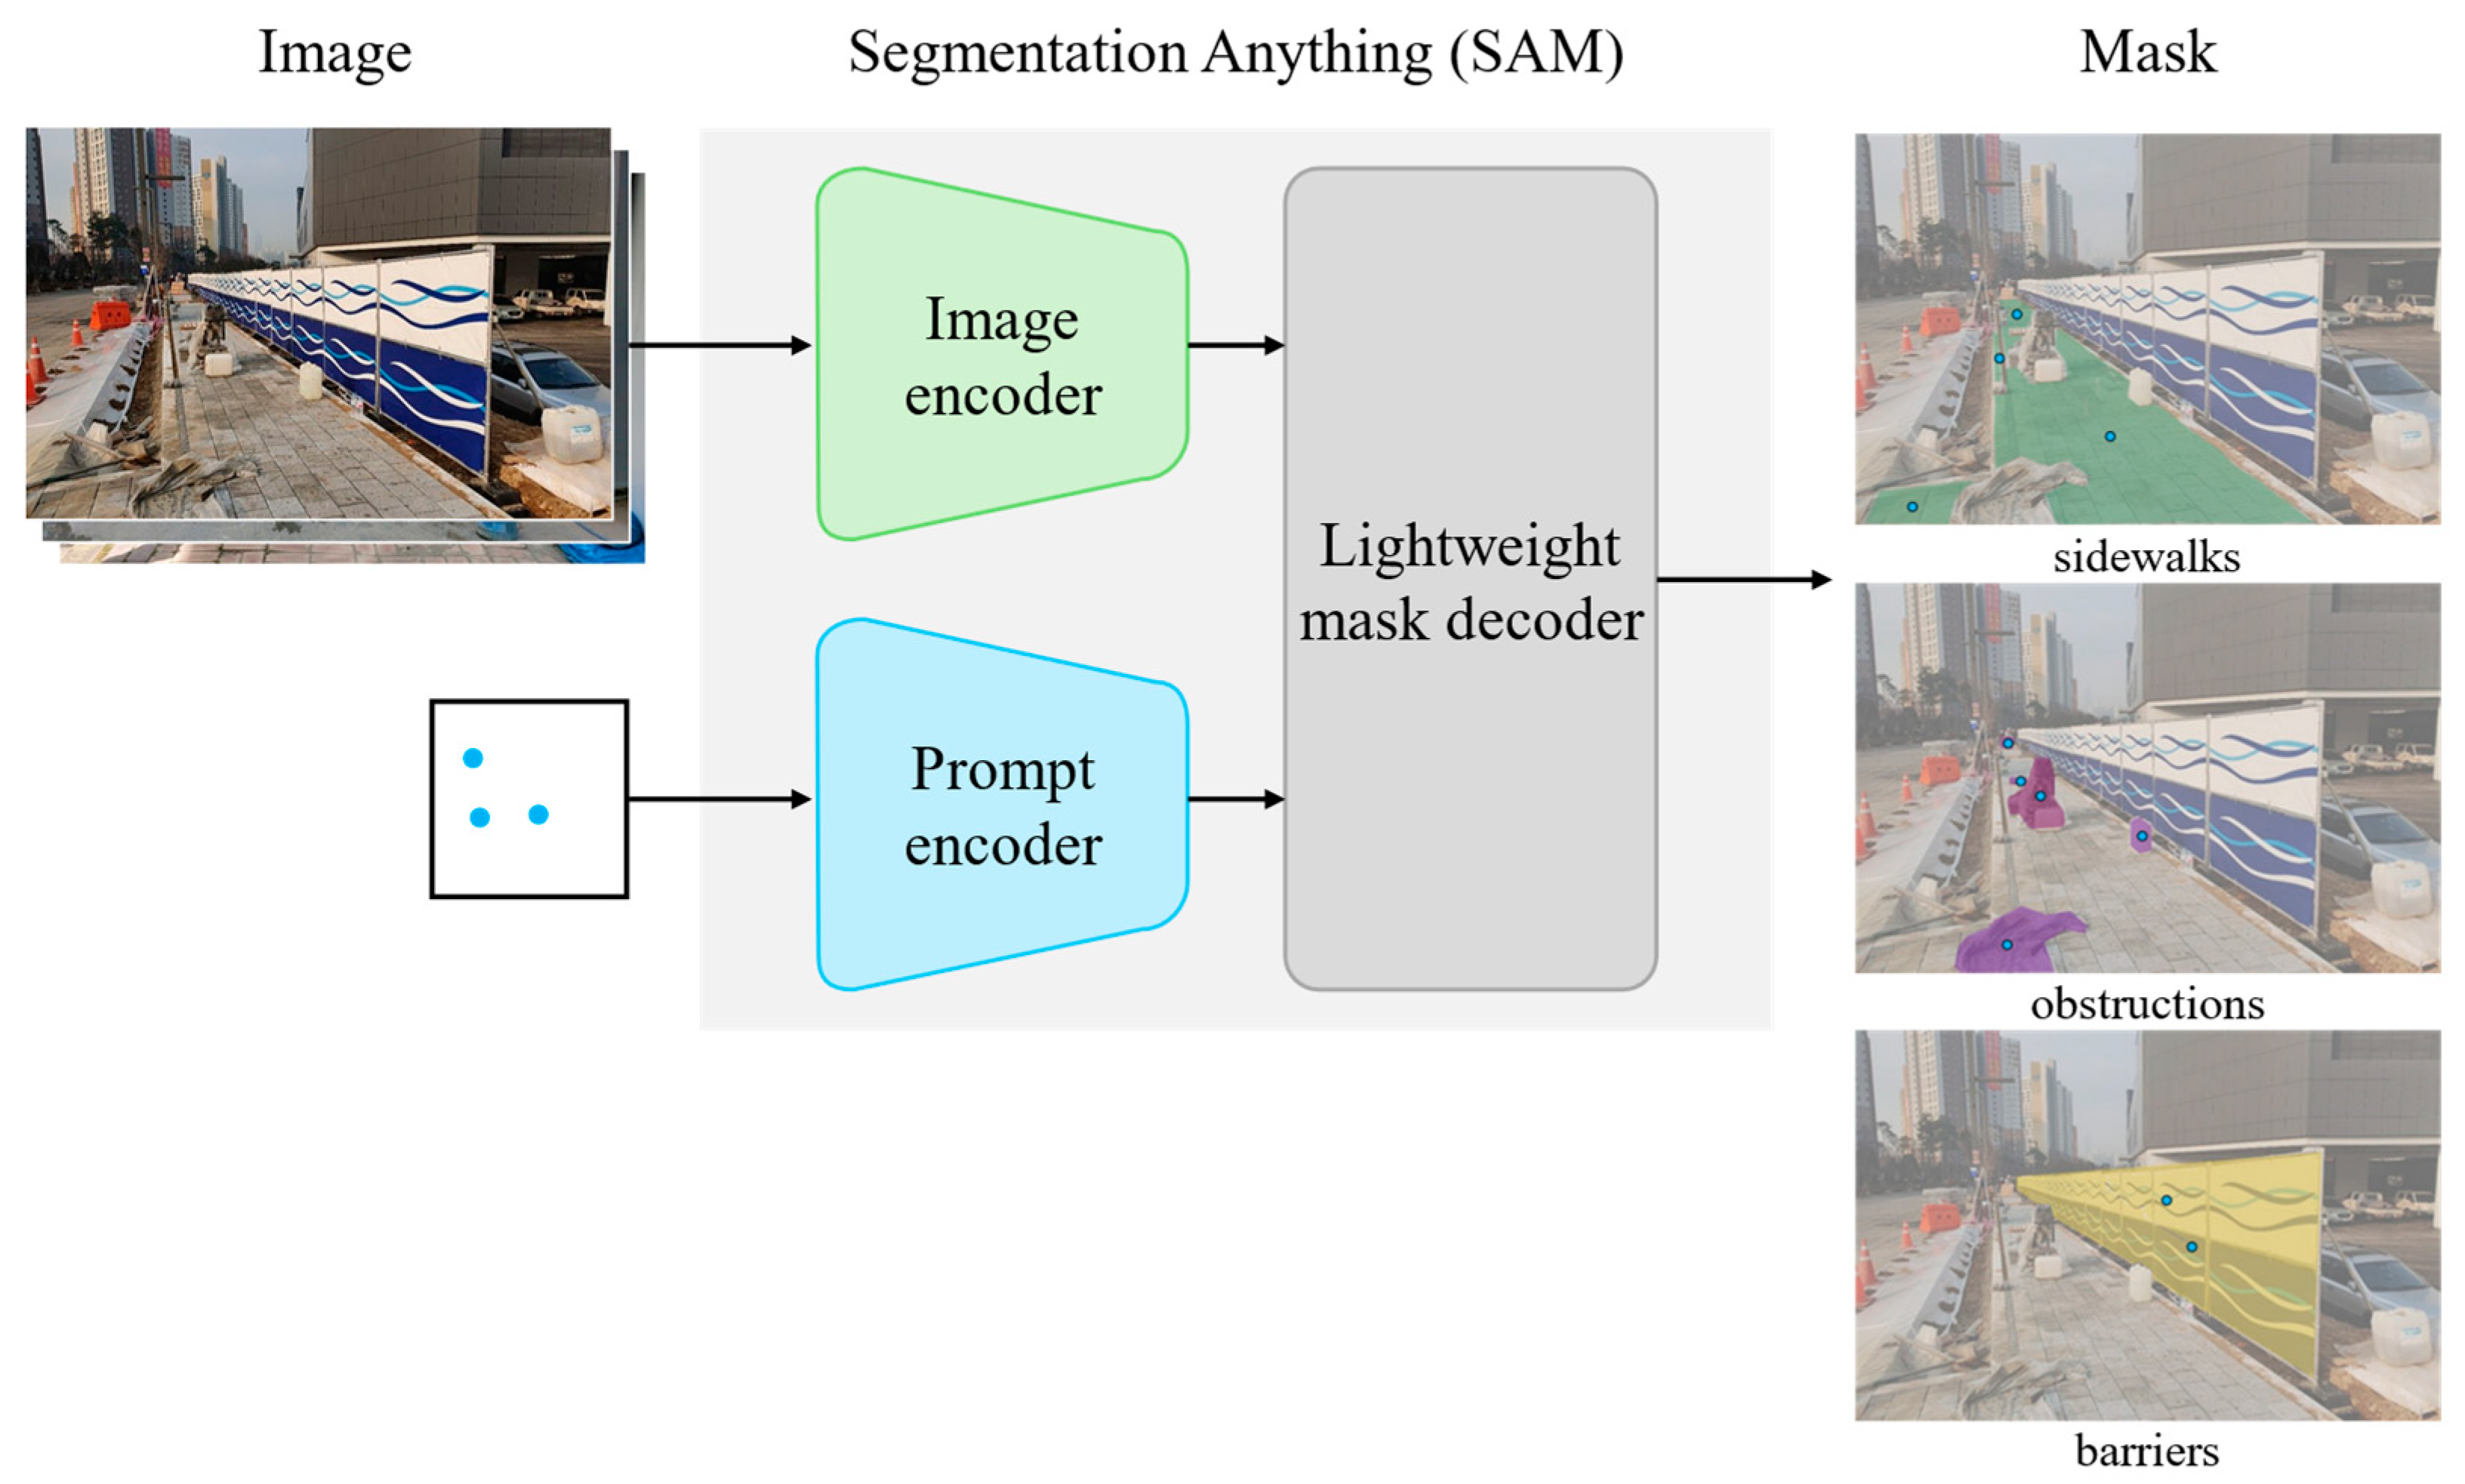
As illustrated in
Figure 4, SAM comprises three primary components: an image encoder, a prompt encoder, and a lightweight mask decoder. First, the image encoder processed each input image and transformed it into a high-dimensional embedding that captured global features such as color, texture, and object boundaries. Meanwhile, the prompt encoder accepted user-defined inputs indicating which elements to segment in the image. These prompts could range from a single point on the target object (point-prompt) to more sophisticated inputs like text descriptions (text-prompt). Finally, the lightweight mask decoder merged the outputs from both encoders and produced segmentation masks that outlined the specified objects.
Because the goal of this study was to quantify how construction activity affects pedestrian safety, segmentation was applied to three object categories in each image: sidewalks, obstructions, and barriers. Sidewalks refer to continuous pedestrian walkways, forming the basis for evaluating the walkable environment (shown in green-colored masks in
Figure 4). On the other hand, obstructions include materials, equipment, debris, or any other construction-related items encroaching on sidewalk space (shown in purple in
Figure 4). Barrier walls and fences that separate pedestrian pathways from construction sites constitute the third category (shown in yellow in
Figure 4). Although these barriers do not occupy sidewalk space in the same way as obstructions, they offer a degree of protection from adjacent hazards and may influence pedestrians’ perceived risk.
In this study, the prompt encoder adopted a point–prompt approach. By clicking a single point on a specific object in the image, SAM automatically produced colored segmentation masks for each object class. The subsequent step involved translating these masks into quantifiable measures that could be compared across images of varying sizes. To achieve this, the total number of pixels in the corresponding mask was counted for each object class (sidewalk, obstruction, and barrier). Although pixel counts do not directly correspond to real-world object size, the perceived size of objects in the images is likely to be the key factor influencing individuals’ perceived risk [
38,
39]. Supporting this rationale, Berryhill and Olson [
40] found that observers can reliably estimate object distances from 2D images with 94% accuracy, even though absolute distances tend to be underestimated. Accordingly, pixel-based measurements offer a theoretically sound proxy for perceived visual prominence.
To facilitate comparisons across images of varying resolutions or captured from different camera angles, the raw pixel counts were normalized by the total pixel area of each image. This yielded percentages for each object class that could be directly compared, regardless of differences in the image size or perspective. Subsequently, building on these basic pixel-based measures, two additional indices were developed to quantify how obstructions and barriers diminish the available space for pedestrians. First, the obstruction–sidewalk ratio was defined as the proportion of the nominal sidewalk area occupied by obstructions. Since SAM only extracted the visible sidewalk (portions not covered by obstructions), the nominal sidewalk area was calculated as the sum of the visible sidewalk and obstruction areas. For instance, if obstructions completely covered the sidewalk, the visible sidewalk area became zero, and the ratio approached 100%. Conversely, if there were no obstructions, the obstruction area was zero, resulting in a ratio of zero. Second, the barrier–sidewalk ratio was proposed to measure the extent to which barriers were present around sidewalk areas adjacent to construction zones. Unlike obstructions, barriers were not necessarily located on the sidewalk and could extend beyond its bounds. Consequently, the segmented barrier area could sometimes exceed the total nominal sidewalk area. In such cases, the ratio was capped at one to avoid distortion in the analysis. This approach assumes that once a barrier is large enough to fully enclose or demarcate the construction zone, and that an additional size does not further influence pedestrian perception.
2.5. Statistical Analysis
To bridge subjective risk assessments from the survey with the objective and numerical measures described in the previous sections, this study performed a series of statistical analyses. First, the study investigated whether participants’ risk ratings differed significantly among four categories of sidewalk environments based on the presence (1) or absence (0) of obstructions (O) and barriers (B). These were labeled O0_B0, O0_B1, O1_B0, and O1_B1. For example, all 14 images in the control dataset, which represent scenes with neither obstructions nor barriers, were classified under the O0_B0 category. Because the dataset did not meet normality assumptions, the non-parametric Kruskal–Wallis test was employed to evaluate whether there was a statistically significant difference in the perceived risk among these four groups. Whenever the Kruskal–Wallis test indicated a significant effect (p < 0.05), Dunn’s post hoc test was carried out to identify which specific pairs of groups differed. Next, the study examined the impact of the proportion of the sidewalk area occupied by obstructions and barriers denoted by the obstruction–sidewalk ratio and the barrier–sidewalk ratio, respectively. To investigate how increases in these ratios relate to perceived risk, both Spearman’s rank correlation and ordinary least squares regression analyses were performed. Lastly, considering that some visible characteristics in images may not directly influence the perceived risk but might shape how participants interpret the built environment, this study explored the mediating effects of candidate variables on the relationship between the obstruction–sidewalk ratio and participants’ perceived risk using a non-parametric, bootstrap-based approach.
3. Results
3.1. Differences in Perceived Risk Level
The Kendall coefficient of concordance (Kendall’s W) was computed to evaluate the consistency among survey participants in ranking the perceived risk levels of street images [
41]. The analysis yielded a Kendall’s W value of 0.72 (
p < 0.001), which falls within the range of 0.61 to 0.80, indicating a substantial level of agreement among raters [
42]. This significant concordance suggests that participants share a common perceived risk for each street image, rather than making entirely individual subjective judgments.
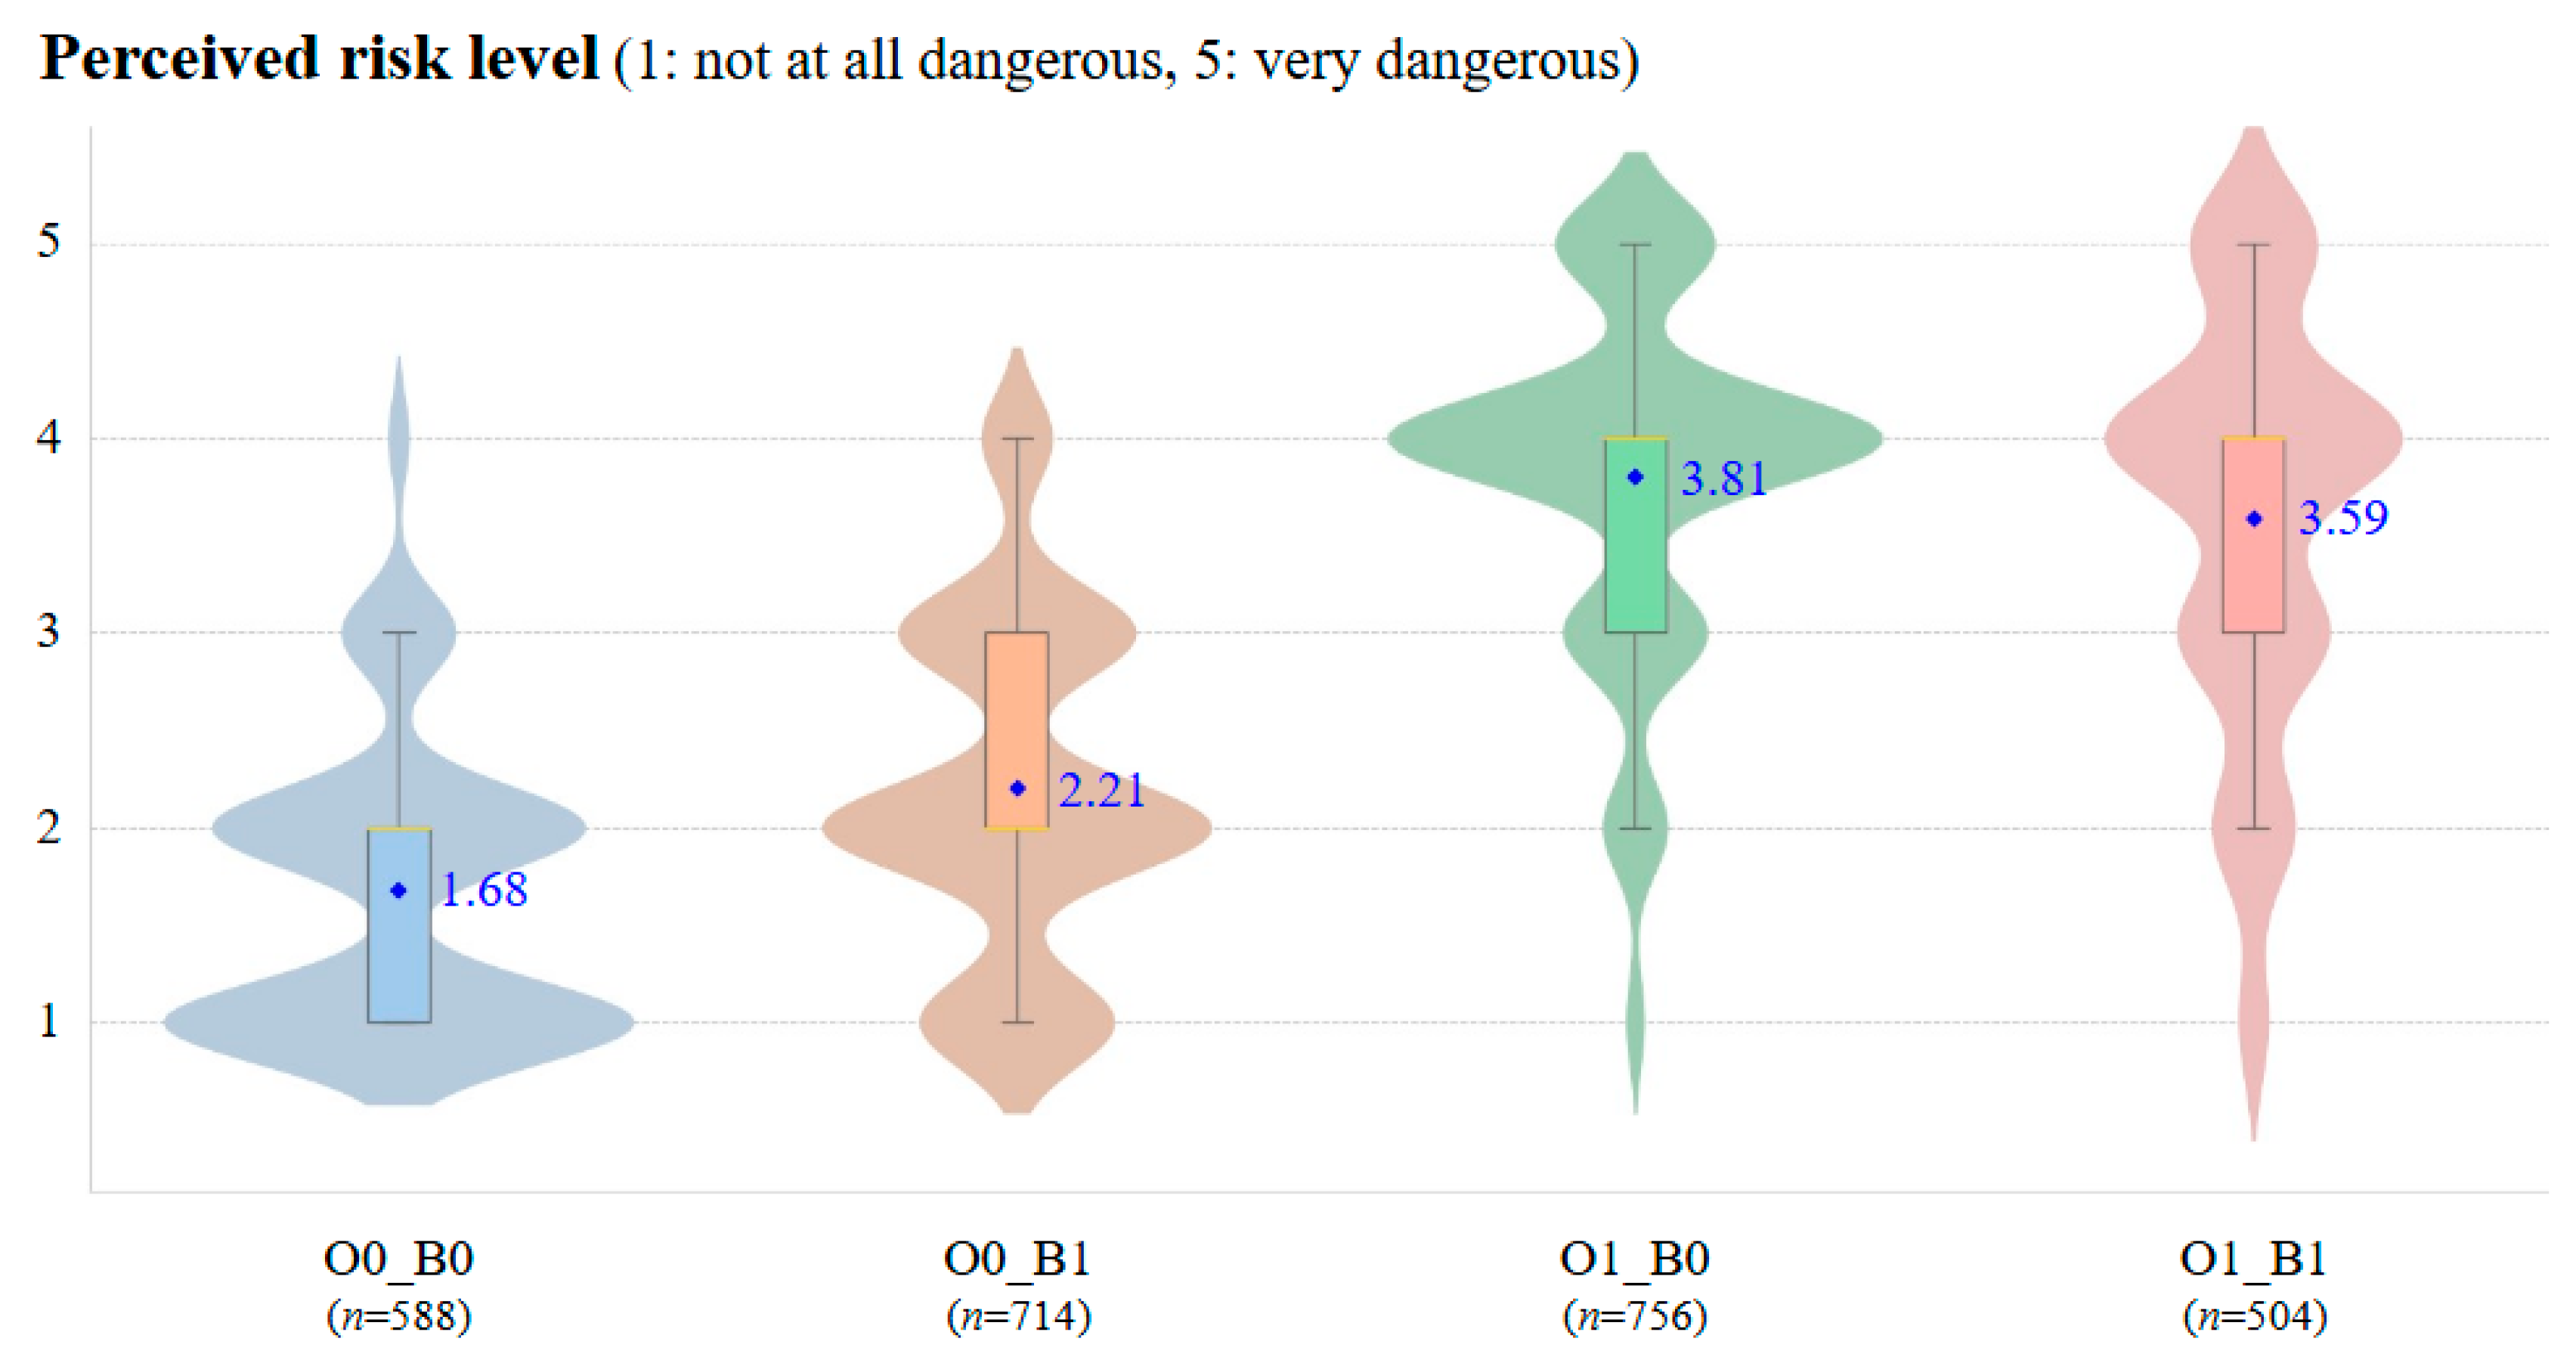
Following this confirmation of the inter-rater consistency, a Kruskal–Wallis test was performed to examine whether the four sidewalk environments differed significantly in terms of perceived risk. The test revealed a significant overall effect, H(3) = 1298.74, p < 0.001, ε2 = 0.51, indicating that participants’ risk ratings were influenced by the presence or absence of construction obstructions and barriers.
Specifically, as shown in
Figure 5, the group with no obstructions and no barriers (O0_B0) exhibited the lowest perceived risk with a median of 2 and mean of 1.68. This group was the only one that did not involve a construction setting, serving as the control condition consisting of well-maintained sidewalks without adjacent construction activity, and was thus perceived as the safest scenario. In contrast, the remaining three groups (O1_B0, O1_B1, and O0_B1) all depicted sidewalks adjacent to construction sites, but with differing physical conditions. Sidewalks obstructed by construction materials or equipment but lacking any protective barriers (O1_B0) were rated as the most hazardous, receiving a median risk rating of 3 and a mean of 3.81. When obstructions were present but barriers were also placed (O1_B1), the median remained 3, and the mean perceived risk slightly decreased to 3.59, suggesting that barriers may offer pedestrians a sense of protection. Lastly, in the barrier-only group (O0_B1), which represents well-maintained sidewalks adjacent to construction sites, the median perceived risk was 2 and the mean was 2.21, indicating a level of risk lower than moderate. The descriptive statistics for each group are also presented in
Table 2.
Dunn’s post hoc tests were conducted to identify which specific pairs of groups differed significantly, and the results are summarized in
Table 3. All pairwise comparisons revealed statistically significant differences in the mean perceived risk levels. Five of the six comparisons were highly significant (
p < 0.001), while the comparison between O1_B0 (obstructions without barriers) and O1_B1 (obstructions with barriers) showed a smaller yet still meaningful difference (
p < 0.05). Among all pairs, the largest difference in the mean perceived risk was observed between O0_B0 (no obstructions, no barriers) and O1_B0, indicating the substantial impact of construction material encroachment into pedestrian space on perceived risk.
3.2. Impact of Obstructions and Barriers
While the above analysis focused on the binary presence or absence of obstructions and barriers, this section explores how the quantitative extent of these objects affects pedestrians’ perceived risk. To do so, two pixel-based ratios were used: the obstruction–sidewalk ratio and the barrier–sidewalk ratio. These indices were derived from SAM-based image segmentation, as described in
Section 2.4.
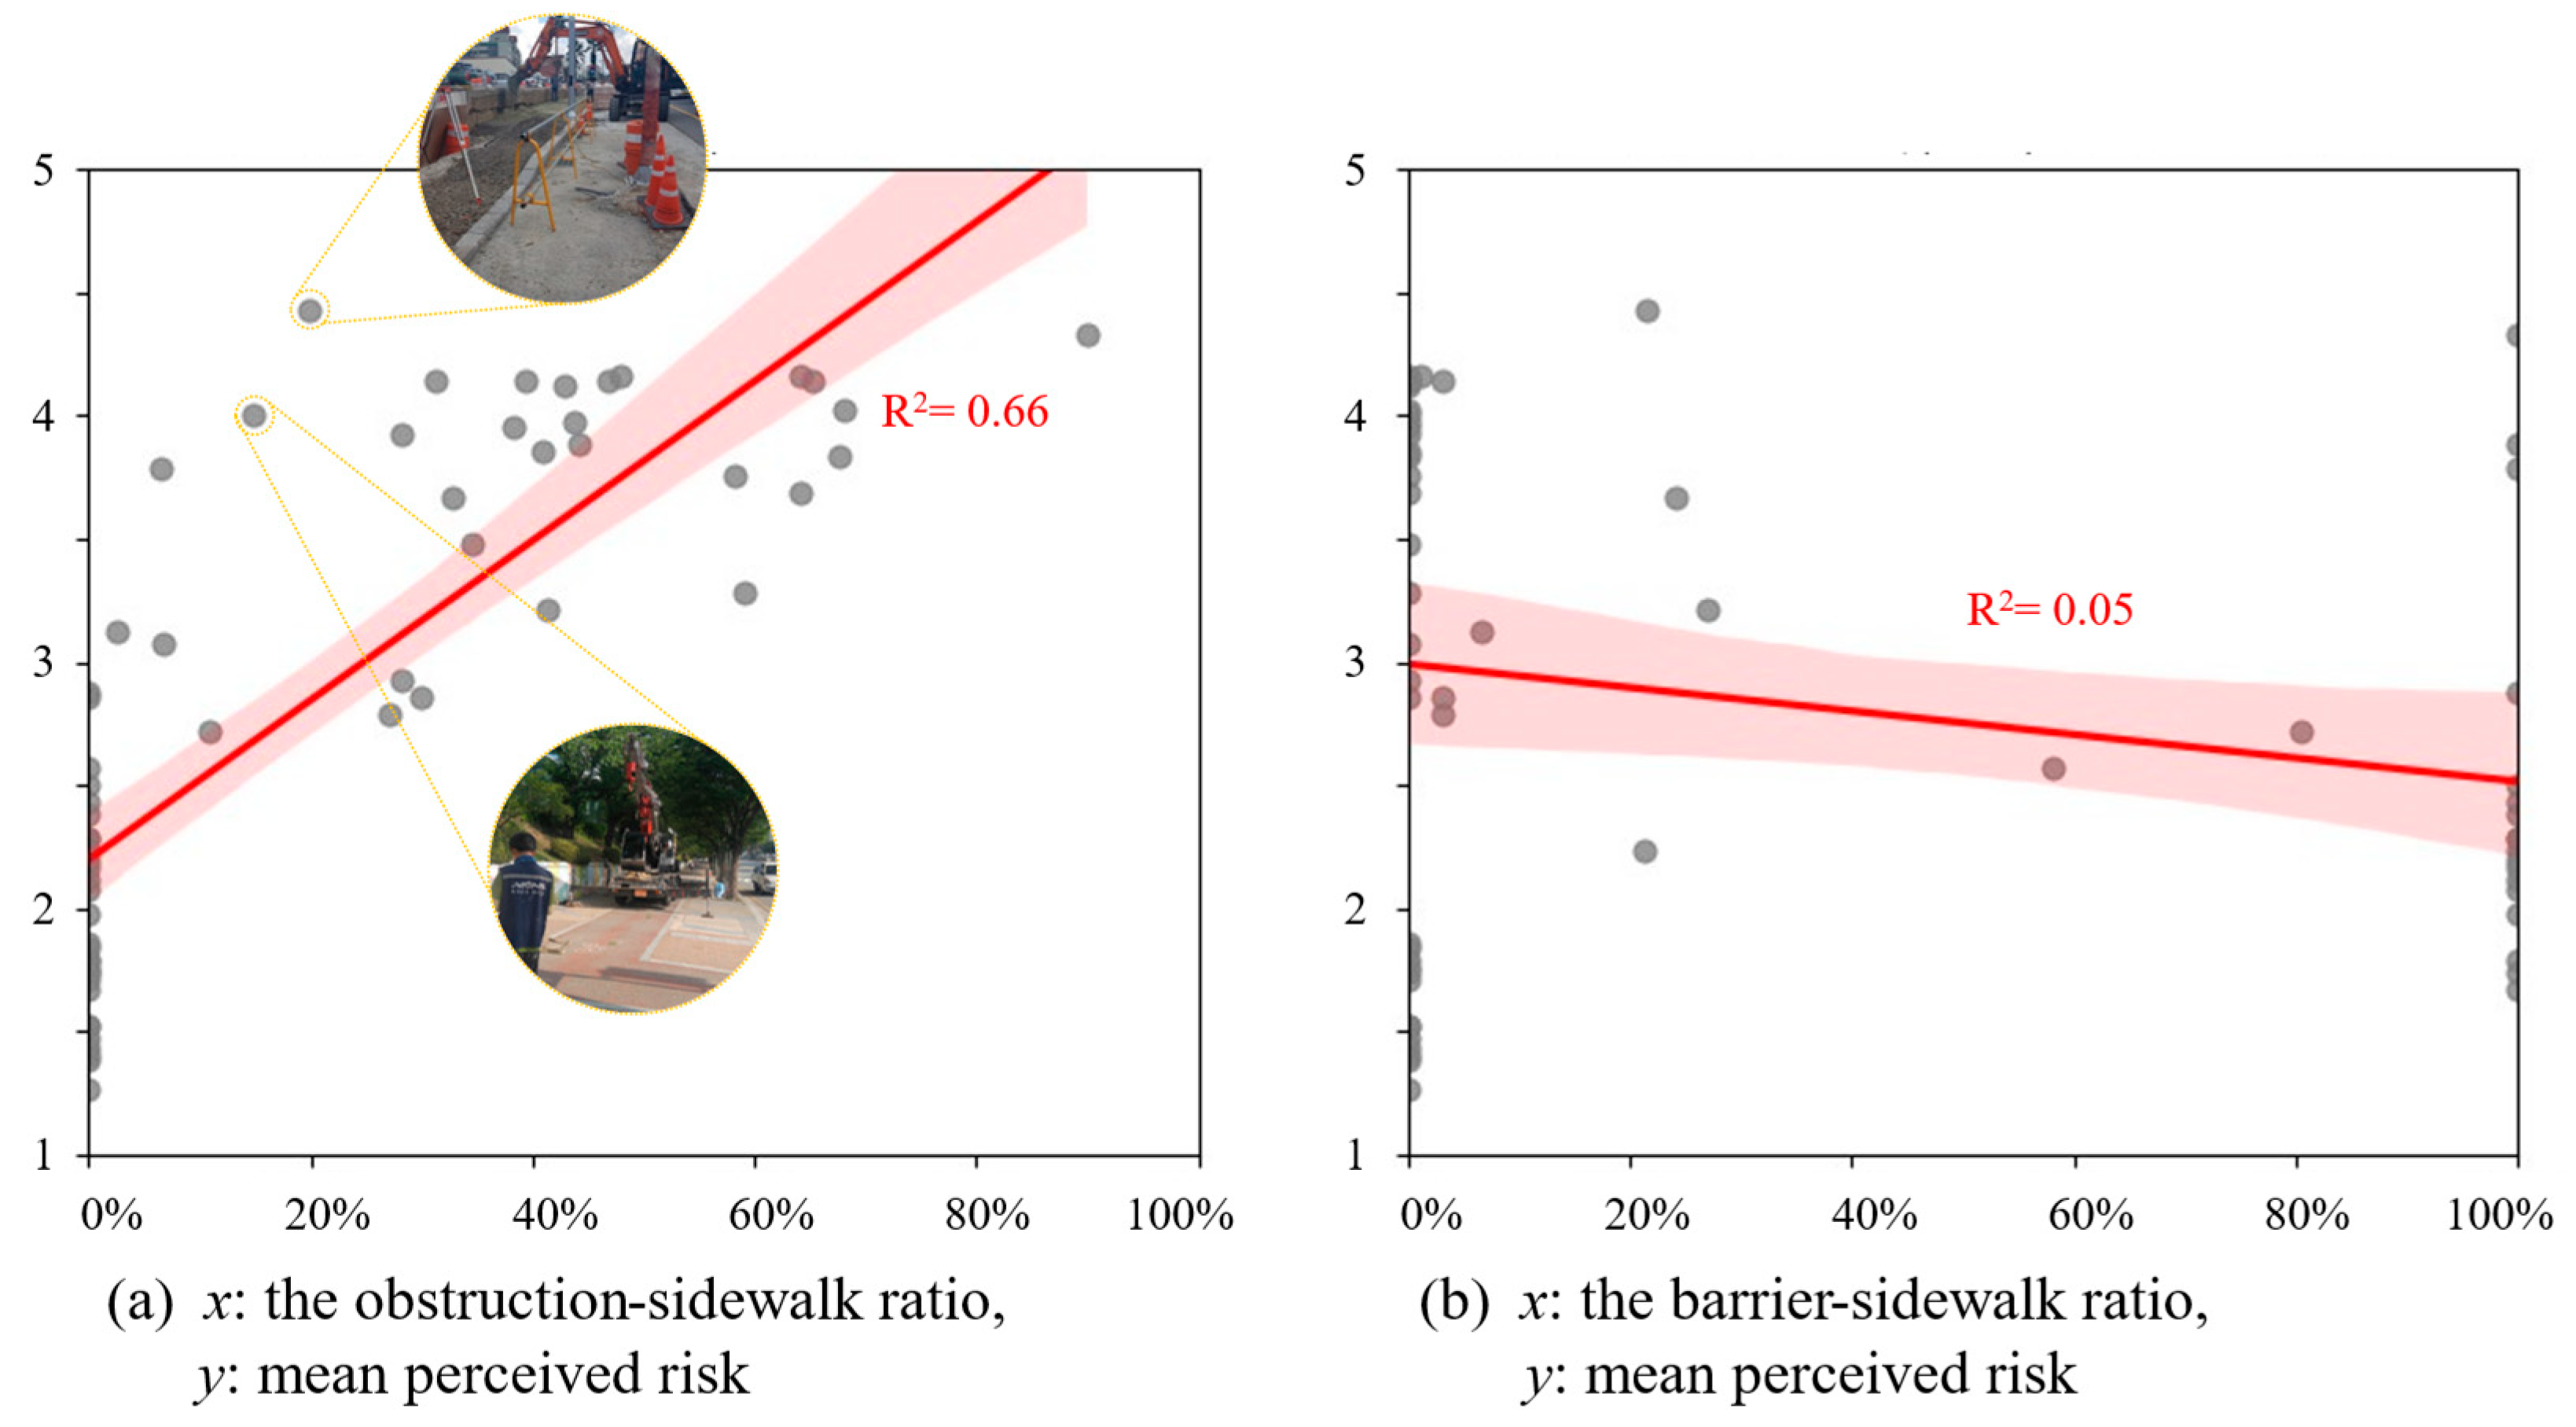
Table 4 shows Spearman’s rank correlation between the mean perceived risk levels and both the obstruction–sidewalk ratio and the barrier–sidewalk ratio, respectively. The results indicate that the obstruction–sidewalk ratio exhibited a significant, positive correlation with the mean perceived risk (Spearman’s coefficient = 0.856,
p < 0.001). In contrast, the barrier–sidewalk ratio showed no significant relationship with the mean perceived risk (Spearman’s coefficient = −0.088,
p = 0.502), suggesting that the relative size of barriers alone does not meaningfully alter pedestrians’ ratings.
In addition to the correlation analysis, an ordinary least squares regression was performed to determine whether the mean perceived risk could be estimated from the obstruction–sidewalk or barrier–sidewalk ratios. As shown in
Table 5, when the obstruction–sidewalk ratio was used as the independent variable, the model achieved an R-squared value of 0.66 and was highly significant (F = 112.4,
p < 0.001). The positive slope coefficient (3.24) confirmed that as obstructions occupy a greater portion of the sidewalk area, participants tend to perceive the environment as more dangerous. By contrast, when using the barrier–sidewalk ratio, the slope was negative (−0.4772), implying a potential trend whereby an increased barrier area might reduce the perceived risk. However, the model’s explanatory power was limited (R
2 = 0.05) and statistically non-significant (
p = 0.092).
Figure 6 visualizes these regression results as scatter plots. Each gray dot represents one street image, and the red line indicates the fitted regression line with a 95% confidence interval. In
Figure 6a, a clear positive linear relationship was observed between the obstruction–sidewalk ratio and the mean perceived risk. Conversely, a near-flat regression line in
Figure 6b indicated no meaningful association between the barrier–sidewalk ratio and the mean perceived risk.
A few outlier cases can also be observed from the plots. For example, one image showed a relatively high perceived risk level (~4.4) despite a low obstruction–sidewalk ratio (~20%), and another exhibited a similar pattern with a perceived risk of ~4.0 and an obstruction–sidewalk ratio of ~15%. To investigate the cause of these unexpected results, the corresponding images were reviewed. As a result, heavy construction equipment operating directly on the sidewalk was identified in both cases. This suggested that beyond the quantitative extent of obstructions, the type or visual characteristics of obstructions may also play a critical role in shaping the perceived risk.
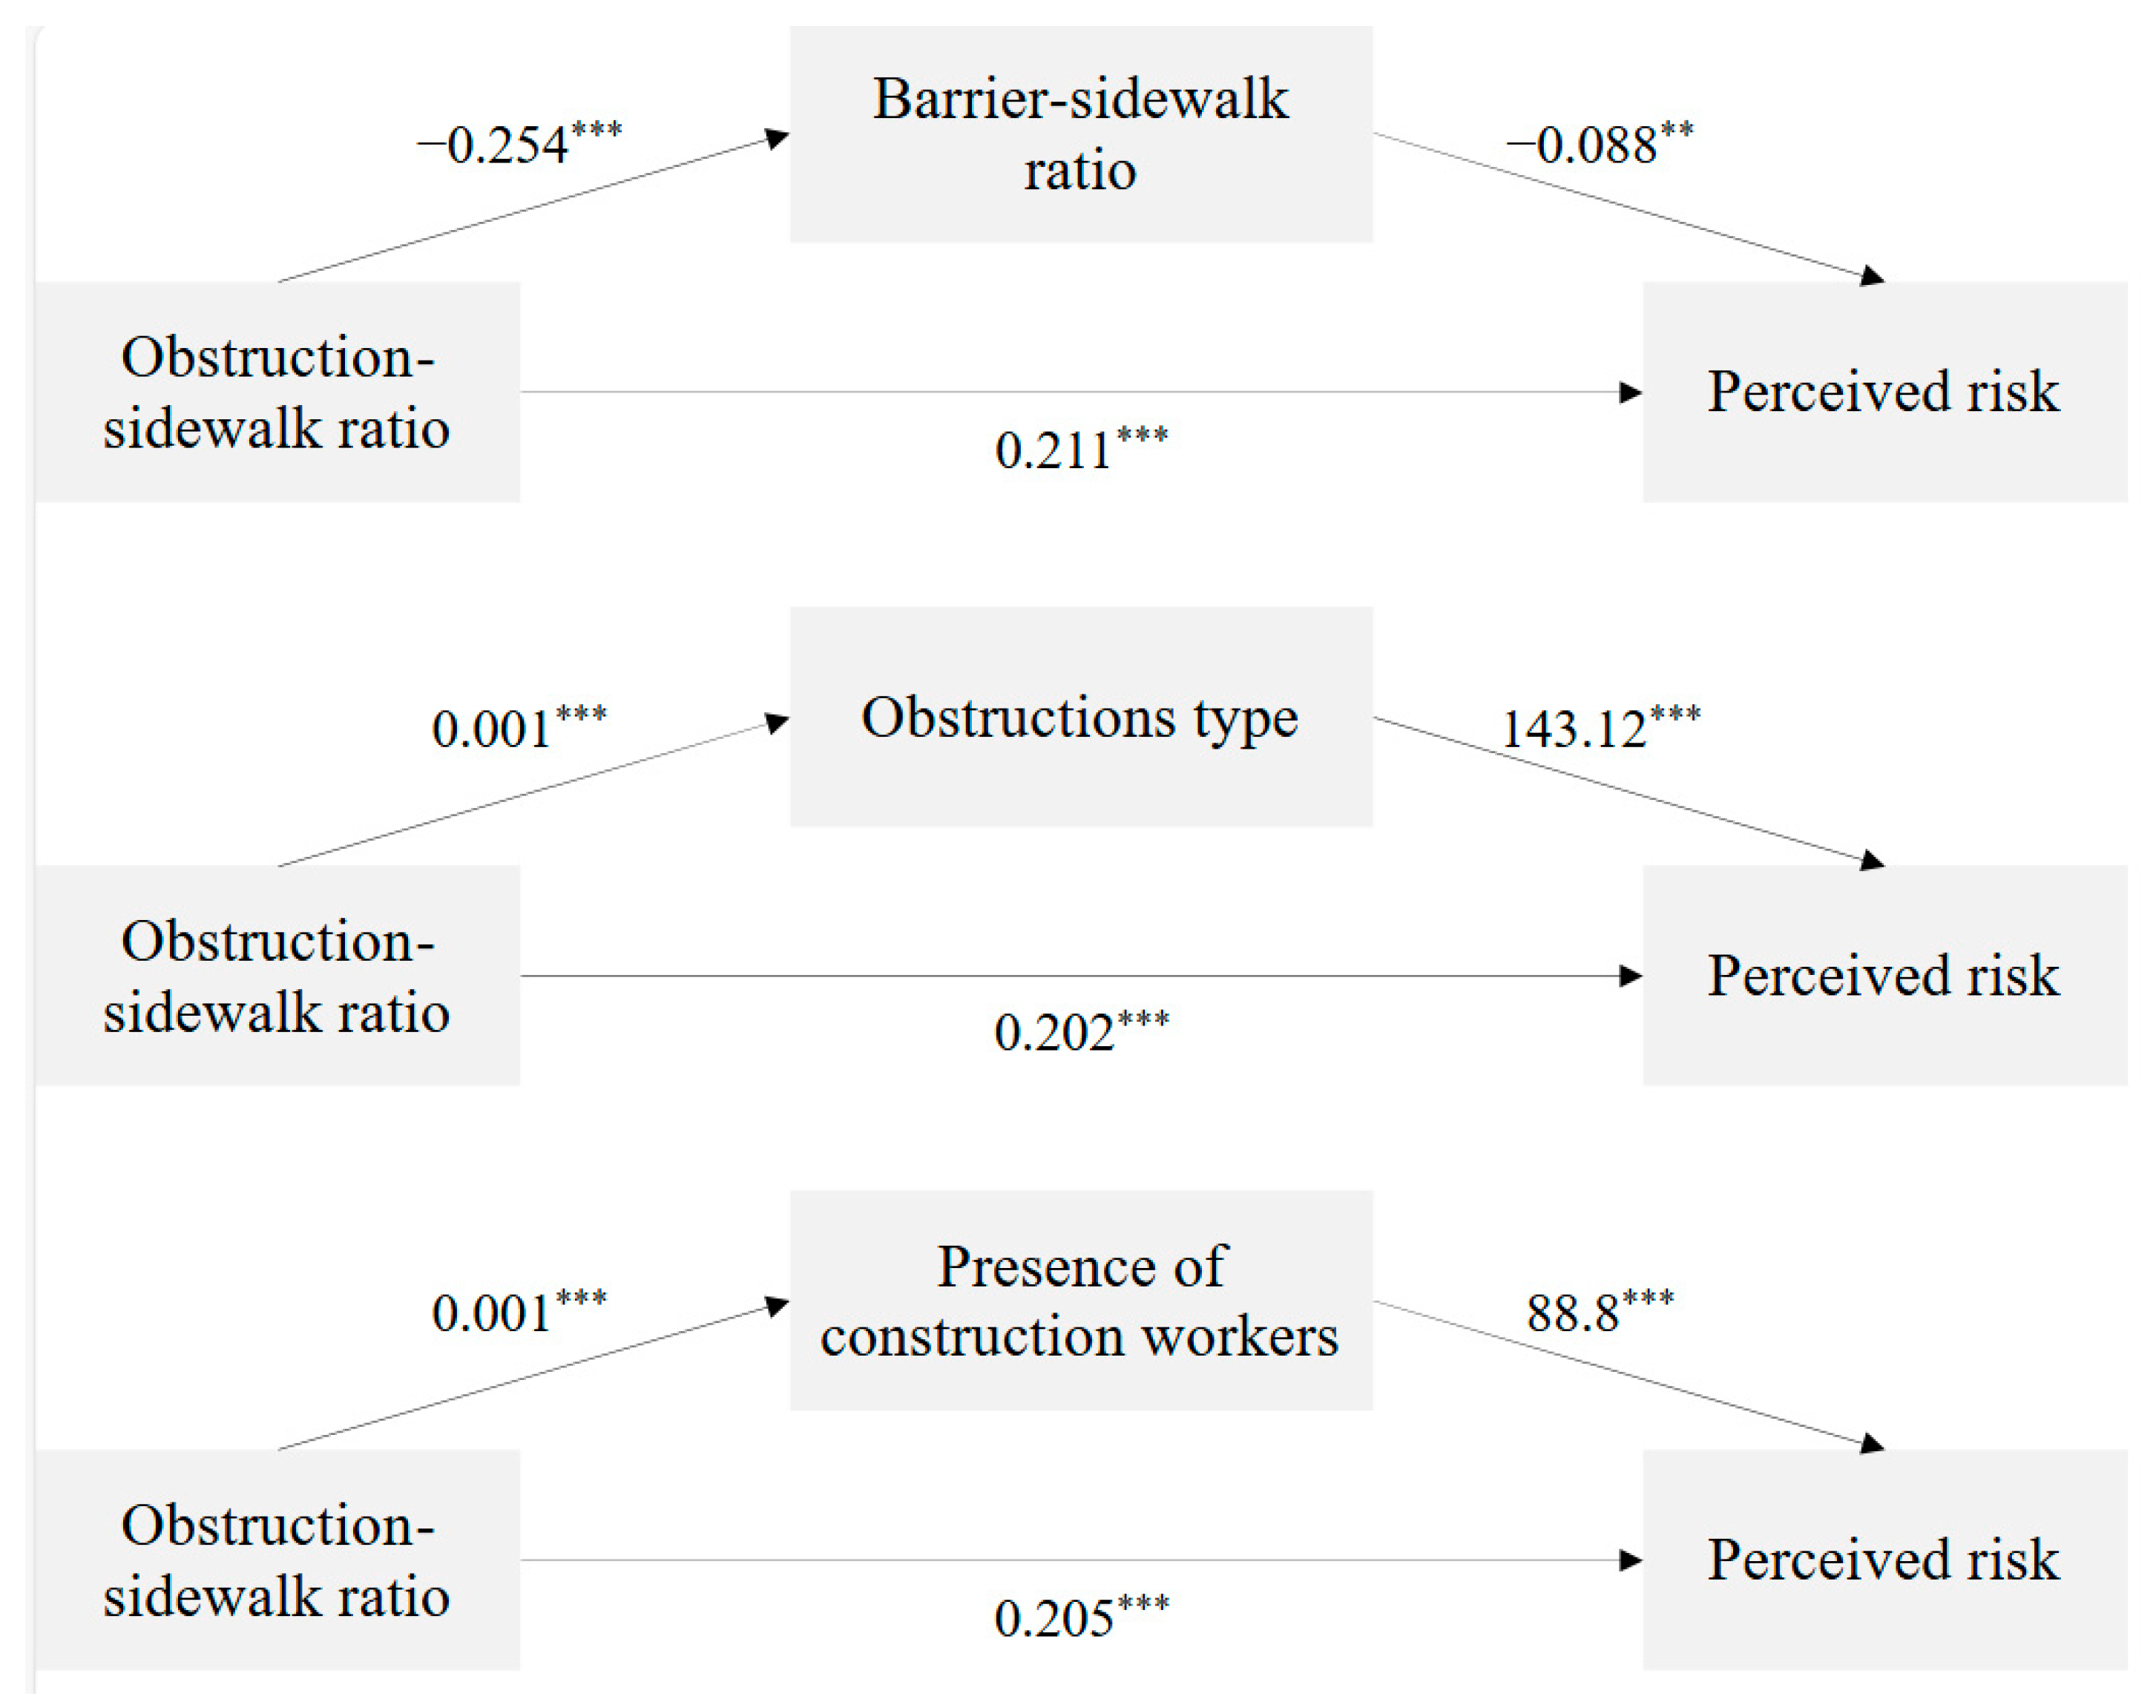
3.3. Indirect Effects from Mediators
The barrier–sidewalk ratio itself did not exhibit a statistically significant direct effect on perceived risk; however, it may still influence participants’ judgments indirectly, particularly when obstructions are present. Therefore, a third analysis was conducted to examine the potential mediating effects of the barrier–sidewalk ratio, focusing exclusively on images that contained obstructions (i.e., those in groups O1_B0 and O1_B1). Additionally, to account for the visual characteristics observed in several outlier images—those perceived as dangerous despite exhibiting a low level of sidewalk encroachment—two more variables were introduced as potential mediators: the type of obstruction (1 = materials, 2 = heavy equipment) and the presence of construction workers (0 = No, 1 = Yes).
In a mediation framework, the path from the independent variable (X) to the mediator (M) is denoted by
a, and the path from the mediator (M) to the dependent variable (Y), controlling for X, is denoted by
b [
43]. The indirect effect is typically computed as
a ×
b, while the direct effect (
c’) is the path from X to Y when M is included in the model. However, when the distribution of M is asymmetric, the estimated indirect effect may differ from the product of separately estimated a and b, because the bootstrap captures sampling variability across repeated resamples [
44].
Figure 7 illustrates the conceptual mediation model tested in this third analysis. As shown in the diagram, the obstruction–sidewalk ratio (X) may exert an indirect influence on the perceived risk (Y) through one of three potential mediators (M): (1) the barrier–sidewalk ratio, (2) the type of obstruction (materials vs. heavy equipment), or (3) the presence of construction workers. Overall, the direct effect of the obstruction–sidewalk ratio on perceived risk ranged from 0.202 to 0.211. This indicates that, holding other factors constant, a one-unit (%) increase in the obstruction–sidewalk ratio is associated with an approximate 0.2 unit increase in the perceived risk. In practical terms, this finding reaffirms that increasing the area of obstruction leads to a higher perceived risk.
For the two potential mediators—obstruction type and the presence of construction workers—both path coefficients (a and b) were positive. Notably, b for the obstruction type was extremely large (143.12), and b for the presence of construction workers was also sizable (88.8). These large b values suggest that when the obstruction is heavy equipment rather than materials, or when construction workers are present rather than absent, even relatively small changes in the obstruction–sidewalk ratio can result in substantial increases in the perceived risk. In contrast, when considering the barrier–sidewalk ratio as a mediator, both a and b were negative. This implies that as the obstruction–sidewalk ratio increases, the barrier–sidewalk ratio tends to decrease, and a lower barrier–sidewalk ratio is then associated with a higher perceived risk.
Table 6 presents the results of the mediation analysis using a rank-based, non-parametric, bootstrap procedure (5000 resamples) [
36]. Among the three candidate mediators, both the obstruction type and the presence of construction workers mediated the association between the obstruction–sidewalk ratio and perceived risk (i.e., their 95% confidence intervals did not include zero) [
36]. Specifically, obstruction type exhibited the strongest mediating role, with a bootstrap-estimated indirect effect of 0.069 and a 95% confidence interval [0.027, 0.124]. This suggests that pedestrians tend to perceive heavy equipment as more hazardous than materials when these obstructions are encountered on the sidewalk. Similarly, the presence of construction workers also acted as a significant mediator, with an indirect effect of 0.064 and a 95% confidence interval [0.020, 0.126]. This may be explained by the fact that the presence of construction workers indicates ongoing construction activities, which heighten perceptions of danger compared to scenes containing only construction materials. In contrast, the barrier–sidewalk ratio did not yield a statistically significant mediation effect (indirect effect = 0.005, 95% CI [−0.001, 0.020]).
5. Conclusions
Although ensuring pedestrian safety near construction sites is a critical responsibility in construction safety management, the illegal encroachment of construction materials and equipment onto sidewalks continues to place pedestrians in hazardous situations. This study quantitatively investigated how changes in the pedestrian environment caused by construction-related objects influence perceived risk levels, using segmentation masks generated by the SAM. To collect pedestrian safety evaluation data, an online survey was conducted in which 42 participants rated their perceived risk for each of the 61 street images. The statistical analysis bridging subjective risk ratings and objective measures can be summarized into three key findings. First, the presence or absence of obstructions and barriers significantly influenced the perceived risk. Second, while the degree of sidewalk obstruction showed a strong positive correlation with the perceived risk, the relative size of barriers did not significantly affect the perceived risk. Third, certain visible characteristics in street images, such as the obstruction type and the presence of construction workers, indirectly influenced the perceived risk.
This study provides a better understanding of how temporary obstructions and barriers affect pedestrians’ perceived risk near construction sites. This study also offers an objective method to assess visible hazards by utilizing advanced image segmentation techniques. Despite these contributions, several limitations remain. First, this study relied solely on image-based evaluations and was unable to capture pedestrian behavior in real-world settings. Second, although the sample street images were carefully selected, the range of visual factors considered was relatively limited. Third, the segmentation accuracy of the fully automated SAM model under complex real-world conditions has not yet been validated. Fourth, the limited sample size and lack of demographic diversity may restrict the generalizability of the findings. Therefore, future studies should focus on developing real-time surveillance systems to monitor unsafe pedestrian behaviors induced by construction activities through CCTV data. In particular, such systems should incorporate various visual features, including barrier height, color, material type, and other urban elements, to deepen our understanding of risk perception. Methodological advancements, such as the application of few-shot learning algorithms, are also necessary to enhance segmentation accuracy under diverse real-world conditions. Additionally, future studies should recruit larger and more diverse samples to better examine how demographic characteristics influence pedestrians’ perception of risk.


