1. Introduction
Driver distraction, also known as driver diverted attention, has typically been defined as “the diversion of attention away from activities critical for safe driving, toward a competing activity, which may result in insufficient or no attention to activities critical for safe driving” [
1]. In recent years, the focus of driver distraction research has shifted towards in-vehicle distractions, such as mobile phone use and interactions with In-Vehicle Information Systems (IVISs), i.e., infotainment systems [
2,
3,
4]. Dingus et al. [
5] concluded that the riskiest activities while driving were those which required drivers to take their eyes away from the forward roadway. Amongst these activities were interactions with the vehicle, such as adjusting the climate controls (i.e., heating, ventilation, air conditioning) which increased crash risk by 2.3. Drivers’ interactions with other in-vehicle devices, such as touchscreen menus, even increased the driver’s odds of having a crash by 4.6 times. For reference, the same study found lower crash risks for other risky driving behaviours, such as fatigued driving (odds ratio of 3.4), overall handheld mobile phone use (odds ratio of 3.6) and eating or drinking a non-alcoholic beverage (odds ratio of 1.8 each). In addition, being unfamiliar with a vehicle is amongst the contributing factors with the highest crash risk. The performance errors resulting from unfamiliarity increased the odds of having a crash by 204.5 times. These results are based on naturalistic driving data from the USA from 2010 to 2013 [
6].
1.1. More Functions and More Touchscreens
Cars have greatly evolved since 2013. In particular, Human–Machine Interfaces (HMIs) in passenger cars have become more complex over the years. A technology scan of passenger vehicles from 2020 to 2024 revealed a trend towards larger touchscreens. It also found that the interaction modality for functions—such as climate control, audio entertainment and even primary vehicle controls—moved from physical buttons to touchscreens [
7]. The menu-structures of touchscreens allow for more functions to become available in the car [
8]. These recent HMI designs might look clean, but they also take longer to operate and can result in navigating through multiple layers of menus to perform simple tasks [
9]. The distraction that occurs while operating these more complex interfaces could impose problems regarding road traffic safety [
10]. Since 2013, the number of functions on cars has also expanded. Various Advanced Driver Assistance Systems (ADASs) have become mainstream on new cars. Functions such as speed control and lane control have increased the number of functions to manage when driving one’s car. A recent study representative of Dutch drivers owning a car built between 2017 and 2023 showed that 65% of them experienced some level of distraction by operating the ADAS in their own vehicle. Only 27% of the drivers reported not being distracted at all by operating these functions while driving [
11]. It can be expected that the impact of operating in-vehicle functions on crash risk has increased since 2013 [
3]. To mitigate distraction due to vehicle operation, The German Insurers Accident Research institute (UDV) [
8] has devised guidelines for assessing distractions resulting from HMI design, especially for basic driving tasks. As part of these guidelines, a decision tree for function implementation has been developed. It provides guidance regarding the acceptable minimum type of function implementation—ranging from a direct physical input to a menu-based input—depending on the following set of general functionality questions: Is there an external cause for usage of a function? Is it time-critical? Is an immediate reaction necessary? Is the function to be used in a complex situation? Is there a high frequency of usage of the function? Thus, to be able to assess the distraction resulting from using a particular function, one would need to know whether or not this function is frequently used while driving. The UDV [
8] has defined frequent usage as ‘being used on almost every trip’. This brings about the following question: which vehicle controls are frequently used while driving?
1.2. Aim of the Study
The purpose of the current study is to investigate how often various vehicle controls are used while driving a passenger car and which are underlying factors that contribute to function usage. To this end, the same drivers are observed during on-road driving, both in their own car as well as in an unfamiliar car.
2. Materials and Methods
2.1. Experimental Design
In a 2 × 1 within-subjects design, the experimenter drove along with each participant and recorded the number of times they interacted with specific functions of their vehicle while driving. For this, the experimenter used a predefined checklist which included a large variety of functions. The checklist also allowed for logging particular contextual circumstances, such as road type and weather conditions. Participants made two trips: one in their own, familiar car and the other in an unfamiliar car. Whether the first trip was with the participant’s own car or in the unfamiliar car was counterbalanced across participants. To increase ecological validity, they drove a route familiar to them, as most trips are made along familiar routes [
12,
13]. Thus, distractions from an unknown road environment were avoided [
5]. The study took place in the Netherlands, from the 29 November, 2023, until the 8 January 2024. It was preceded by a small pilot study, which was performed to test the procedures. Ethical approval was obtained from the Human Research Ethics Committee (HREC) of the TU Delft (application number 3679, 16 November 2023).
2.2. Participants
In total, thirty people participated in the experiment. Twenty participants identified as male, the other ten identified as female. To be eligible for the study, participants were required to be above the age of eighteen, and they had to own a driving licence. Participants’ age ranged from twenty to eighty-five years old (average age was 41.1 years) and they had held their driving licence for three to sixty-five years, with an average of twenty-two years. Participants drove at least once a week, with a maximum of twenty-eight times per week and an average of 7.9. Participants were paid for their participation.
2.3. Materials
The checklist. A predefined checklist was created which allowed the experimenter to quickly score each interaction of the driver with a wide variety of functions while driving. The checklist listed various tasks—such as adjusting the volume, changing the temperature or using the direction indicator—which were categorised per function. Tasks considered for the checklist were on the tactical level of Michon’s driving task hierarchy [
14]. This meant that, e.g., they excluded continuous vehicle control, such as steering or braking, and took some seconds to perform. The checklist was adapted based on a pilot study and also allowed for noting down any additional tasks. This resulted in eleven main categories of functions: Radio and media, Climate control, Phone calls, Lights, Cruise control, Danger signalling, Windshield, Car setup, Settings, Extra features and Other.
Table 1 provides an overview of all tasks per function. Also noted was whether or not a task was available in the car, and whether a task was performed while driving on a motorway, a rural road, a city road or in a traffic jam, or whether it was performed during stand still.
In addition, the checklist included logging the time driven per road type, the weather conditions (sunny, rainy, cloudy, dark, outside temperature), additional car characteristics, the trip duration and trip distance. It also had room for additional comments.
The route. Participants were asked to select themselves a route that was familiar to them, which would take between fifteen and thirty minutes to drive, one way. To assess whether or not participants were sufficiently familiar with the route they had chosen, they rated how familiar they were with the selected route on a 10-point route familiarity scale [
12]. On average, they scored a 9.5, with a minimum score of eight and a maximum score of ten. In accordance with Burdett, Charlton and Starkey [
15] and Harms, van Dijken, Brookhuis and de Waard [
16], this score is interpreted as being very familiar with the route.
All trips lasted between fifteen and thirty-two minutes, with an average trip duration of 22.4 min. Per trip, 18.2 min were driven on roads in the city, which made city roads the most frequented road type. Usually, the starting point of the route was the participant’s home address. Routes were driven both with a familiar car as well as with an unfamiliar car. Most participants drove these two trips during the same appointment, to minimise weather and context differences. Nevertheless, seven out of the thirty participants had to drive the two trips on separate days.
The cars. For the familiar car, participants used their personal vehicle. This resulted in a good variety of brands and models, such as BMW, Fiat 500, Fiat Panda, Fiat Sportage, MG4, Mitsubishi Spacestar, Nissan Juke, Peugeot 208, Peugeot 308 Station, Renault Twingo, Seat Arona, Seat Tarraco, Suzuki Swift, Tesla Model Y, Tesla Model 3 and Volvo XC40.
The unfamiliar car for the study was provided by the experimenter. For twenty-eight out of the thirty participants, the unfamiliar car provided was a Seat Toledo from 2014.
Table 2 presents an overview of both the familiar and this unfamiliar car’s characteristics. Due to circumstances, two participants drove another vehicle as their unfamiliar car. One drove a Renault Megane from 2012, the other a Renault Modus from 2005. This ensured that the familiar car was indeed considerably more familiar compared to the unfamiliar car. The participants were asked to rate their familiarity with the car—both their own car as well as the car provided by the researcher—on a 10-point scale, similar to the route familiarity scale. A score of ten means one is very familiar with the car, a score of one indicates one is very unfamiliar with the vehicle. On average, participants scored 9.5 for their own car and 4.7 for the car provided by the researcher. A paired-samples test showed that these scores were indeed significantly different from each other (
t = 8.80,
p < 0.001).
The initial settings of the unfamiliar car were the same for all participants. The climate-control temperature was set to 19 degrees, and the radio was set to Radio 538 on volume 8. All lights and the windshield wipers were turned off.
2.4. Measures
Number of interactions. To measure which functions were used and how often during a drive, the number of interactions was counted. The continued and virtually uninterrupted execution of a single task on the checklist was considered one interaction, regardless of task duration. Task execution stopped either as the task was completed or aborted for more than five seconds (see
Table 1 for the overview of all tasks). To be able to distinguish whether an interaction pertained to the same or to a different task, a cooldown timer was used. It was set to five seconds as it was assumed that, when a driver performs the same task again within five seconds or continues with a task within five seconds, it is still part of the same task, in which case it was counted as a single interaction. However, turning on a function was considered a separate task from turning the same function off. Counting began when the driver moved the vehicle for the first time. Only interactions with the original installed HMI equipment were part of the observations. Each interaction was counted separately.
Based on the counts for the separate tasks and the trip durations, the individual task frequencies and total frequencies per category were calculated.
Driving context. To be able to account for contextual factors during the drive, which may influence the use frequency of specific functions, the following factors were logged: road type, outside temperature, weather type, peak hour and day of the week. Similar to Metz et al. [
17], the following road types were distinguished: city roads, rural roads and motorways. In addition, it was also logged when the participant was in a traffic jam, either in standstill or driving. To calculate the frequencies per road type, the driving time per road type was documented.
Weather type and outside temperature were included as they could influence the use of climate-control functions and windshield wipers. For example, it was hypothesised that rainy weather increases the number of tasks related to the windshield. Peak hour and day of the week were included, as Cuentas-Hernandez et al. [
18] found that traffic density had an impact on secondary task engagement.
Socio-demographic variables. To understand whether or not socio-demographic variables contribute to function usage, the following factors were registered: age, gender and driving experience. Older drivers (55–75 years) have been found to struggle more with the use of IVIS while driving, compared to younger drivers between 21 and 36 years of age [
19]. Other research has shown that novice drivers engage in distracting tasks more frequently as they gain more driving experience [
20]. Drivers are also more inclined to engage in secondary tasks when task difficulty is low, which may be the case for more experienced drivers [
12]. In the current study, driving experience therefore included both participants’ driving frequency as well as the time they had held their driving licence.
2.5. Procedure
The experimenter drove the unfamiliar car to the start location, and the participants brought their own car (i.e., the familiar car). The participants filled out a consent form, completed a short questionnaire about their socio-demographic background and suggested a route familiar to them. The route was driven once in the familiar car and once in the unfamiliar car, counterbalanced across participants. Participants were asked to drive as they would normally do when driving their car. They were instructed to refrain from engaging in any conversations with the experimenter, as most car trips are made without passengers [
21] and engaging in conversations can distract the driver, which may result in performing fewer secondary tasks than they would normally do [
17]. During both trips, the experimenter sat in the front passenger seat and noted down participants’ interactions with the car using the predefined checklist. After each trip, participants indicated their familiarity with the car and characteristics of the participants’ car were noted. Before the participants were debriefed, they were asked to describe what they thought to be the purpose of the study and whether or not they felt that the experimenter had influenced their behaviour. Only one participant correctly guessed the purpose of the study (3.3%); the others did not (96.7%). Four participants (13.3%) shared that their behaviour may have been influenced, but for the majority of participants this was not the case (86.7%).
2.6. Data Analysis Methods
To test whether or not the average frequencies of the performed tasks varied significantly between participants, a repeated-measures ANOVA was performed. Paired-samples t-tests were used to test for differences in average frequencies between the familiar and the unfamiliar car.
To test if the distribution of tasks that were performed while driving versus standing still was the same for different categories of tasks, a chi-square test was performed. The test hypothesis was that tasks that were more typically performed while standing still could be interpreted as less dangerous compared to tasks that were typically performed while driving. To meet the requirements of a chi-square test, only tasks or task categories that had enough observations were tested for differences in distribution.
The dependent variable was the number of times that a task was performed adjusted by the driving time for each participant. This type of data can be considered as count data, which is why Poisson regressions were performed to investigate which factors influenced these frequencies. The natural log of the trip durations was used as the offset (exposure) variable, in order to take into account the fact that the trip durations varied across participants. The formula for the Poisson regressions, in which xi stands for independent variable i and εi stands for the random error in observations (assumed to be Poisson-distributed), is the following: ln(count) = ln(exposure) + β0 + β1x1 + β2x2 … βixi + εi.
Multiple models were constructed with two different types of dependent variables: the total number of tasks performed per hour and the total number of tasks per category performed per hour. The Poisson models were eventually only constructed using the data from the trips with each participant’s own car, because the unfamiliar car data had almost no variety in car types, as 28 out of the 30 participants drove the same unfamiliar car. To obtain the final Poisson models, first, separate models were created with only one independent variable. The independent variables with best interpretability and highest statistical significance were then combined in a single model.
All data were manually entered into Excel, after which the calculations were performed using the statistical software SPSS Statistics 25.
3. Results
3.1. The Most Frequently Performed Tasks Across All Cars
Based on all sixty trips (i.e., the trips with the familiar and unfamiliar car grouped together), direction indicators are the most frequently used controls, followed by adjusting the front windshield wipers’ speed and adjusting the radio volume. On average, the direction indicators were used 66.4 times per hour. A repeated-measures ANOVA revealed that this is statistically significantly higher than the average use frequency for any of the other tasks (
p < 0.001).
Figure 1 shows the average frequency of the ten most frequently performed tasks over all trips, and an overview of the statistical results of the repeated-measures ANOVA, which compares the average task frequencies per hour, is provided in
Table 3. The front windshield wipers’ speed was adjusted with an average frequency of 4.2 times per hour, whilst the radio volume was averagely adjusted 2.2 times per hour. The average frequency with which the radio volume was adjusted is significantly higher than the average frequency with which participants switched radio stations (
p < 0.01) or adjusted the rear-view mirror (
p < 0.05).
Particularly noteworthy is the usage of the front windshield wiper, as its maximum use frequency is relatively high compared to many of the other tasks. This finding can be explained by the fact that some of the participants were unable to figure out how to set the windshield wipers to a proper interval in the unfamiliar car. Therefore, some participants had to constantly trigger the windshield wipers manually, resulting in a maximum of 29 occurrences on a single trip for this task. This can also be seen in Figure 3.
To get a better overview of the type of tasks that are used relatively frequently, the tasks have been grouped together into several function categories (the overview of all tasks per function is displayed in
Table 1).
Figure 2 shows the aggregated frequencies for all tasks per function category. Presented are only the function categories for which there were more than ten interactions with any of its tasks.
Table 4 comprises the results of the repeated-measures ANOVA to compare the average task frequencies for these function categories.
Since the direction indicator is part of the lights category, it is not surprising that this function category has the highest average use frequency, which is 66.6 interactions per hour. This is significantly higher than all other categories (p < 0.001). The function categories with the second and third highest use frequencies are the windshield and radio and media categories, with an average of 7.2 and 3.3 interactions per hour, respectively. The average frequency of both the windshield task category as well as the radio and media category is significantly higher (p < 0.05 for all) than the setup category and the “other” category (respectively 0.6 and 0.7 interactions per hour). The categories with the lowest aggregated average use frequency per trip are calling, changing settings and danger signalling, with average frequencies of 0.06, 0.08 and 0.10 per hour of driving, respectively.
To give an impression of the number of interactions drivers have with their vehicle while driving,
Figure 2 also displays the average use frequency per hour over all tasks. On average, participants performed 81.4 tasks per hour of driving. Since the direction indicator is used much more frequently compared to the other tasks—hence putting a lot of weight on the average use frequency per hour over all tasks—a separate variable was created to visualise the average use frequency per hour over all tasks, excluding the direction indicator. Excluding direction indicator usage reduces the average total number of interactions from 81.4 tasks per hour to 15.0 tasks per hour of driving. Lastly, again for visualisation purposes, a variable was created that also excludes the front windshield wiper. This was done, given the issues some participants experienced with it in the unfamiliar car, resulting in extremely high use frequencies.
3.2. Comparing Task Performance in the Familiar and the Unfamiliar Car
Before comparing participants’ interactions with the vehicle in their own car versus the unfamiliar car, it was first established that each participant’s own vehicle was indeed more familiar to them than the car that was brought by the experimenter. This analysis has been described in more detail in the Materials section as part of the paragraph titled The cars.
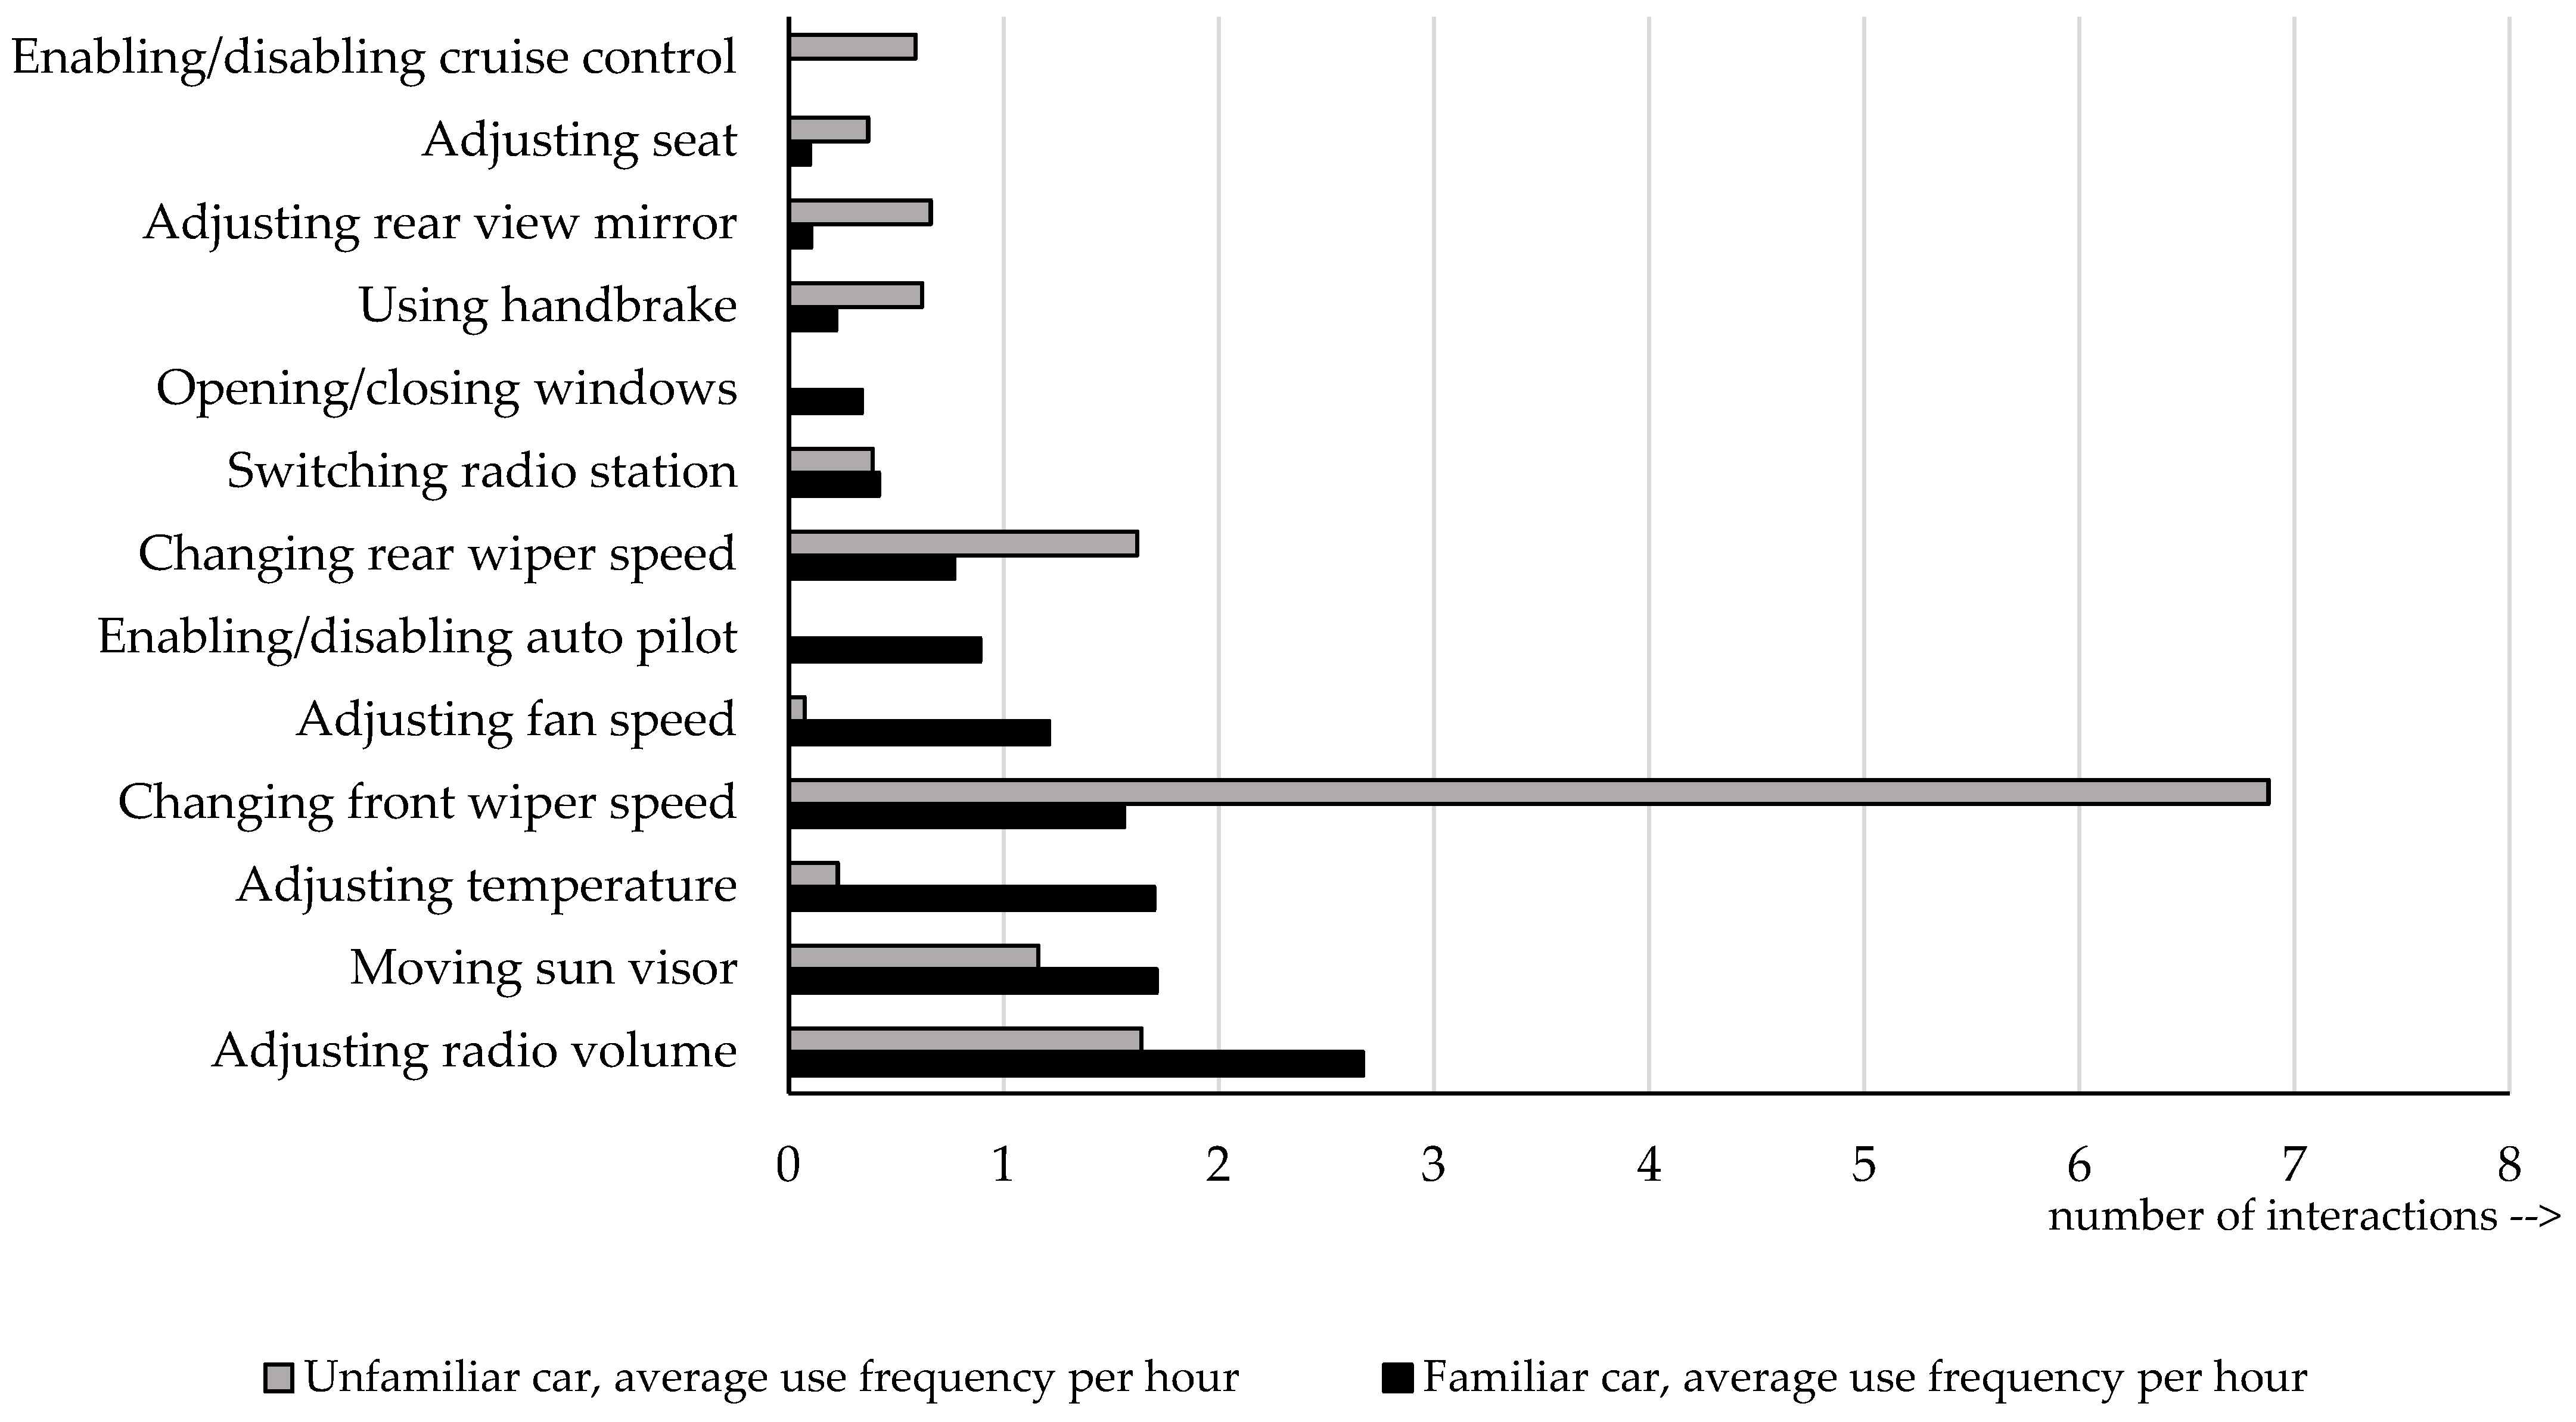
The most frequently performed task while driving was using the direction indicator. This was the case for both the familiar car as well as the unfamiliar car, with an average frequency of 66.2 and 66.6, respectively. For the familiar car, the next most-used tasks were found to be changing the volume, moving the sun visor, changing the temperature of the climate-control system and changing the front windshield wiper speed, with average frequencies of 2.7, 1.7, 1.7 and 1.6, respectively. For the unfamiliar car, the most performed tasks after changing the direction indicator were changing the front windshield wiper speed, adjusting the volume, changing the speed of the rear windshield wiper and moving the sun visor. The average frequencies were 6.9, 1.6, 1.6 and 1.2, respectively. For the unfamiliar car, higher frequencies can be found for tasks that are related to setting up the car, compared to in the familiar vehicle. Examples of these tasks are adjusting the rear-view mirror as well as the seat. These were adjusted 0.7 and 0.4 times per hour of driving, respectively, compared to 0.1 and 0.1 times in the familiar car.
Figure 3 shows the average frequencies of the most performed tasks in both the familiar versus the unfamiliar car, whilst
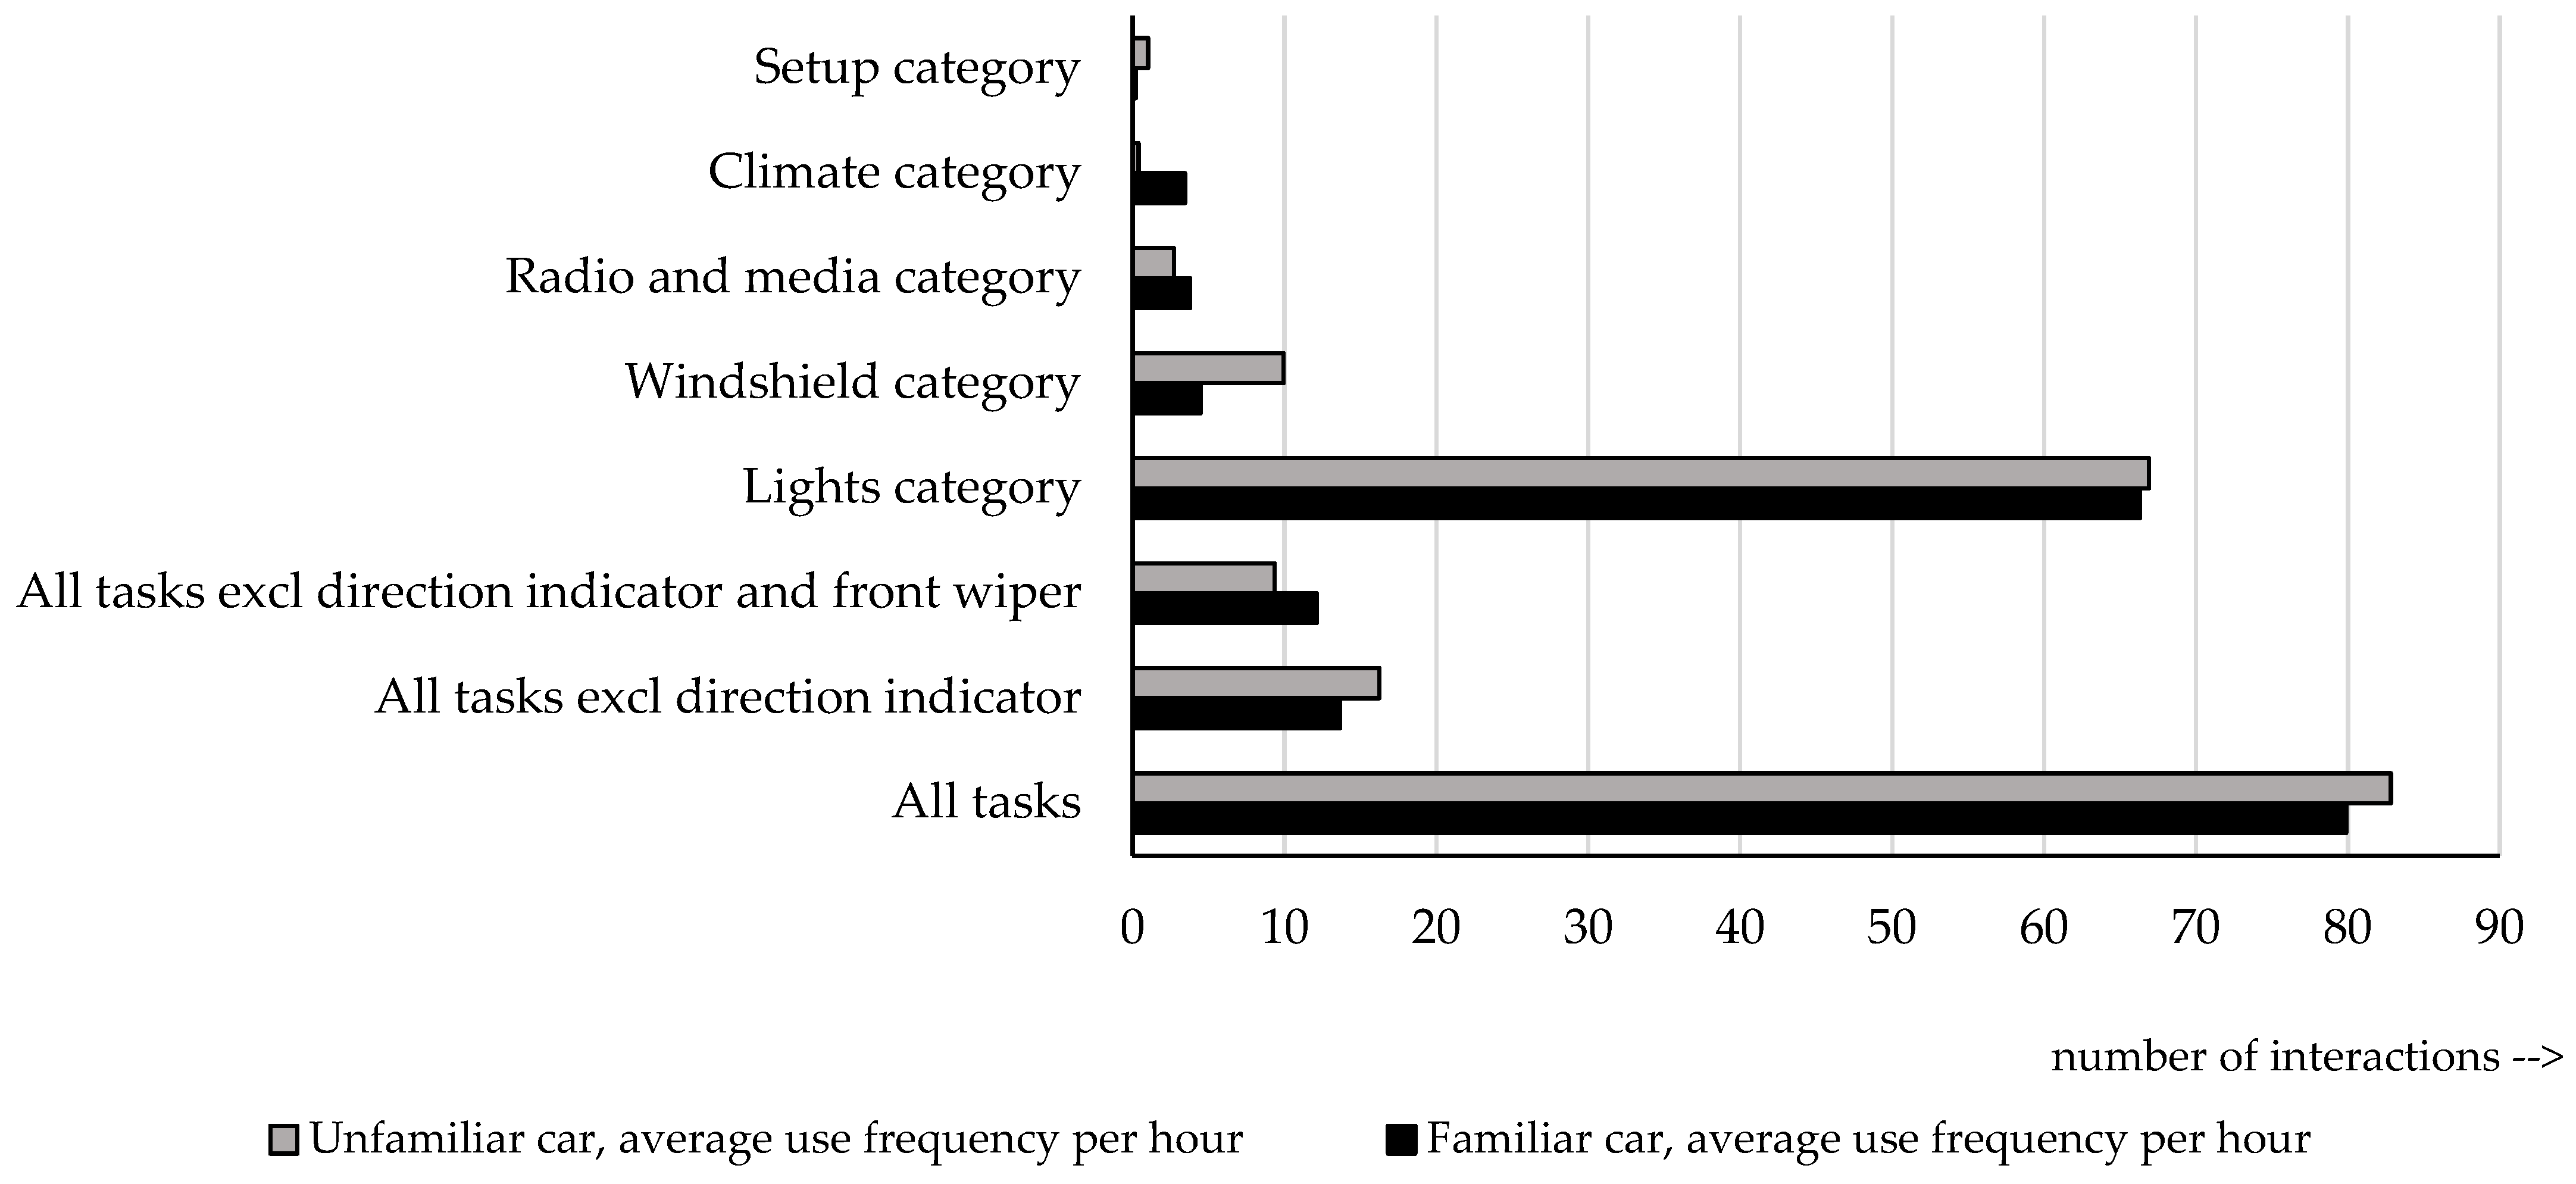
Figure 4 presents the same comparison but on the aggregated level of the function categories.
To understand whether function usage differs between driving a familiar or an unfamiliar car, paired-samples
t-tests were performed on the function category level. An overview of the results of these paired-samples
t-tests is provided in
Table 5. When looking at the aggregated function category level again, it shows that the three categories with the highest average task frequencies are the same for the familiar and the unfamiliar car. These are the categories for tasks related to the lights, the windshield and to radio and media, with average frequencies of 66.3, 4.5 and 3.8 for the familiar car and 66.9, 9.9 and 2.7 for the unfamiliar car, respectively. However, the fourth most frequently used category of tasks differs between the familiar and the unfamiliar car. For the familiar car, the fourth category with the highest task frequencies is the climate-control category. When driving their own car, on average participants used functions in this category 3.5 times per hour compared to 0.4 times per hour in the unfamiliar car, which is significantly less (
p < 0.001). On the other hand, in the unfamiliar car, the fourth most used category of tasks is the setup category. In the unfamiliar car, participants engaged in tasks from this category significantly more often than in the familiar car (
p = 0.03), with an average frequency of 1.0 times per hour when driving the unfamiliar car compared to 0.2 times in their own car. Note however, that the trip took approximately half an hour.
Next to differences in individual functions, it is also of interest to understand whether function usage in general differs between driving your own car or an unfamiliar car. In order to make a proper comparison between the total number of interactions per hour while driving a familiar car versus an unfamiliar car, for the current study it is imperative to exclude both direction indicator usage as well as front windshield wiper usage. As the route in the familiar car was not always similar to the route in the unfamiliar car, this could affect the need for indicator usage. Hence, direction indicator usage needs to be excluded, as differences might not be related to the car itself. Regarding the front windshield wipers, it appeared that their design in the Seat Toledo—which acted as the unfamiliar car—was so unintuitive for some participants that it resulted in very high use frequencies, as explained earlier (see also
Figure 3).
For the familiar car, the average use frequency over all functions, excluding direction indicator usage as well as front windshield wiper usage, is 12.1 interactions per hour (it is 79.9 when including all functions and 13.7 when only excluding direction indicator usage). In comparison, the average use frequency over all functions, excluding both direction indicator usage and front windshield wiper usage, is lower for the unfamiliar car, with 9.4 interactions per hour (it is 82.8 when including all functions and 16.3 when only excluding direction indicator usage). Statistical analyses, shown in
Table 5, indicate a tendency to use less functions when driving an unfamiliar car (
p = 0.07).
3.3. Underlying Factors That Contribute to Task Frequency
To study the influence of the factors in the study, Poisson regression models, as presented in
Table 6, have been constructed based on the data from driving the familiar car. It is important to note that all models showed (some) overdispersion in the dependent variable, which is common in Poisson models; the final models had a statistically significantly better fit than the intercept-only model (see Likelihood Ratio test in
Table 6). The exponent of the parameter estimates (B) of the model can be interpreted as an odds ratio of the impact of the independent variable on the dependent variable (i.e., its effect across units of the independent variable; either the variable is continuous or discrete).
The results of the Poisson model 1 for the total tasks indicate that, overall, participants performed 28% more tasks for every point higher on the car familiarity scale.
The results of the Poisson model 2 indicate that, for the radio and media category, the use frequency for radio and media tasks is more than three times higher (Exp(B) = 3.239) for male drivers compared to female drivers. Furthermore, for every additional year of driver age, 2% fewer radio and media tasks are performed. Finally, the coefficient for car familiarity is statistically significant and indicates that participants perform 44% more radio and media tasks when they scored one point higher on the familiarity scale.
The results of the Poisson model 3 for the windshield category indicate that participants performed around nine times more windshield tasks in both rainy conditions (exp(B) = 8.725) and in sunny conditions (Exp(B) = 9.167), compared to cloudy conditions (which was the reference case in this model). In rainy conditions, this may be due to usage of the windshield wipers, while in sunny conditions it may be due to more frequent usage of the sun visor. Furthermore, when cars were driven with an automatic transmission participants performed 63% less windshield tasks. A possible explanation for this could be that cars with an automatic transmission more often have automatic windshield wipers, which by default reduces the need to trigger the wipers manually. However, this correlation cannot be tested as part of this study as the availability of automatic windshield wipers has not been recorded. Finally, the regression analyses indicates that men perform 47% less windshield tasks than women.
The results of the Poisson model 4 for the climate-control category suggest that men use 42% less climate-control tasks compared to women. However, the coefficient for gender is only statistically significant at a confidence level of 90%. In addition, participants performed 65% fewer climate-control related tasks in cars with adaptive cruise control. This may be explained by the fact that, in modern cars, more tasks have been automated.
4. Discussion and Conclusions
This study showed that, regardless of the car being familiar to the driver or not, the direction indicator is by far the most frequently used function. Other frequently performed actions include adjusting the volume of the radio, moving the sun visor, adjusting the temperature and changing the wiper speed.
The factors that influenced the task frequencies included car familiarity, gender, age and weather conditions. Unsurprisingly, rainy weather triggered an increase in wiper usage and sunny weather resulted in increased use of the sun visor. Men, younger drivers and drivers familiar with the car were more likely to use HMI functions related to radio and media. As radio and media tasks are optional (i.e., not required to use in order to safely drive the car) and mostly for entertainment purposes, it seems that older people choose to perform these tasks less [
19]. The same reasoning might be true for those not familiar with the car, as a means to self-regulate the task load. Women, on the other hand, were more likely to use HMI functions related to climate control. This could be because women have been found to be more perceptible to cold [
22].
In more modern cars, it appears that drivers have fewer interactions with their vehicle’s HMI, possibly because more functions can be put on auto mode. An exception is the usage of the Autopilot function. Despite the fact that only two out of the thirty participants were driving a car with this function, the engaging and disengaging is comparatively prominent in the overview of average use frequencies per task. This suggests that this function triggers a significant amount of interactions while driving.
In general, drivers familiar with a car were more likely to engage with its HMI functions compared to when driving an unfamiliar car. Possibly, participants are more comfortable in a familiar car and therefore more confident that they can perform these tasks safely while driving. This behavioural adaptation may indicate that drivers find driving in an unfamiliar car more effortful and that they try to regulate their mental load by using fewer functions. This can be seen as a form of self-regulation, where people only perform tasks when they think they can safely perform them [
23]. Contrary to good driving practices, it was also found that, in the unfamiliar car, participants continued adjusting their seat as well as the rearview mirror while driving.
Dingus et al. [
5] found that driving an unfamiliar car increased crash risk by 204.5 times. In the current study, it was found that driving an unfamiliar car may also result in increased distraction when the design of the car is unintuitive. Multiple participants driving the unfamiliar car struggled to set the front windshield wipers to an interval due to the unfamiliar design. This example shows that a lack of standardisation can result in an unnecessary high number of interactions, thus causing distractions [
24,
25]. As part of their study, the UDV [
8] pointed out that currently ‘there are no regulations or mandatory best practice that define how to design increasingly complex HMIs that distract drivers as little as possible from their driving task’. In fact, when HMIs are addressed in regulations, the focus is mostly on symbols and telltales only [
26], such as UN R121, including its 01 series of amendments [
27]. As a result, there is much variety in HMIs across different brands. Standardisation is also lacking, and this is often mentioned as a problem in the literature [
24,
25], as it can result in reduced safety, particularly when driving unfamiliar cars. This is backed up by naturalistic driving research, which finds that crash risk increases when driving unfamiliar cars [
5,
28]. This lack of standardisation could become an even bigger problem due to a growing number of people who are using services such as car sharing, where they are driving unfamiliar cars [
29].
A limitation of the current study is that each participant drove their own selected route. As a result, there is considerable variety in the exact driving circumstances for the participants, which increases the noise in the data. The advantage of the method used is that we were able to observe driving behaviour under rather naturalistic circumstances since, in the real-world, most trips are made along familiar roads [
12,
13,
30,
31,
32]. To somewhat account for the lack of control over the routes and still be able to understand the driving contexts, certain characteristics of the route and the weather conditions were noted. Due to choosing their own familiar routes, the exact trip length also varied between participants, though the total trip time never exceeded one hour. This time budget was chosen as it was expected that participants might not have been willing to drive longer than 60 min. In addition, these trip durations have resulted in distances travelled that are reasonably close to the average distance per car trip in the Netherlands, which is found to be 17.44 km [
33].
The ride-along method of simply counting the number of interactions has been shown to be effective, though there are also some drawbacks. Counting was performed manually, which makes it more vulnerable to human error. Some people also found it difficult to refrain from engaging in a conversation with the researcher. This could be remedied by using cameras, which would also allow for tracking people for longer periods of time and/or using a larger participant sample. Nevertheless, for the purpose of the current study, the ride-along method has proven to be efficient, as it is an easy-to-use, low-budget method. Another limitation of the current study is that the Seat Toledo that was used as the unfamiliar car lacks some modern features. This may have increased the number of interactions with the unfamiliar vehicle, as less functions could be put on auto mode.
Nevertheless, the results of this study are particularly relevant for vehicle HMI designers as well as for policymakers. They may also prove to be a useful input for HMI guidelines and assessment tools. For example, the UDV decision tree [
8] includes use frequency of a function to determine the appropriate function implementation. This decision tree is one of the main building blocks of Euro NCAP’s new assessment protocol on HMIs for 2026, to encourage car manufacturers to implement good HMI practices and facilitate the safe use of general vehicle controls [
26]. For this, their protocol assesses a wide variety of functions used while driving. Insights into which functions are used significantly while driving compared to which are less frequently used help to understand which functions should be easily and swiftly available while driving in order to reduce distraction by the car’s HMI design.


