Abstract
In addition to their practical and aesthetic qualities, ceramic teapots are highly decorative and stylish. Based on the theory of perceptual engineering, this study employs eye-tracking technology and semantic-difference methods to investigate user preferences for ceramic teapot shapes. Using eye-movement experiments, the study first determines users’ visual attention to different morphological regions. Using the orthogonal alignment method, nine styling samples were developed by combining expert classification of classic and traditional teapot styling elements. By combining a semantic perception questionnaire with a satisfaction questionnaire, the study evaluated users’ visual attention to these samples and their satisfaction with them. It was found that shapes characterized by classic, rounded, and proportional coordination were more in line with consumers’ aesthetic preferences despite the differences in semantic evaluations among consumers of different genders and ages, which led to relatively consistent consumer satisfaction. The purpose of this study is not only to provide a scientific basis for styling ceramic teapots but also to assist designers in grasping the laws of consumer preference in order to create better products.
1. Introduction
As a very common and key necessity in daily life around the world [1], the ceramic teapot skillfully integrates plastic arts, aesthetic interest, practical efficiency, and multiple emotional experiences [2], thus becoming a unique product that integrates practical value and cultural heritage.
Reviews of ceramic teapot-related studies focus on color, packaging, and materials. For example, Yan, F studied the application of color in ceramic design [3]; Yan, RS focused on the impact of packaging on ceramic products [4]; and Myz, AL studied ceramic materials [5]. In addition, the existing research methods of ceramic teapot modeling design rely more on subjective evaluation, lack of objectivity, and comprehensiveness, and it is difficult to accurately grasp user preferences. In the study of aesthetic preference, the existing research has not deeply explored the differences between different user groups.
Presently, eye-tracking technology is widely used in various product-design fields. For example, in automotive design, it is used to understand the user’s visual focus areas on the exterior and interior of a car, helping to optimize the design layout. In view of this, eye-tracking technology is introduced in this study, which can objectively record users’ visual concerns and obtain more real and reliable data, making up for the lack of objectivity of the original research. At the same time, understanding users’ semantic perception with the help of semantic evaluation enables us to understand the emotional and cognitive associations with different teapot designs by different user groups.
With the help of eye-tracking technology and the semantic-difference method, this study aims to break through the limitations of existing research at the theoretical level and deeply study the cognitive intention preference and differences of users of different genders and ages on the overall shape design features of ceramic teapots. From a practical point of view, it can provide data support for designers in the industrial field, assist them in optimizing design schemes, and help designers understand users’ emotional cognitive preferences. It can prompt the ceramic industry to pay close attention to the needs of users, optimize the production process, and inject a strong impetus into the sustainable development of the industry.
2. Literature Review and Theoretical Basis
2.1. Current Status of Ceramic Teapot Research
As shown in Figure 1, except for China, the international academic research on ceramic teapots is relatively small and narrow in scope. Some scholars have explored the relationship between different countries and Chinese ceramics, such as JUNGMIN, who studied the connection between English Worcester ceramic and Chinese export ceramic, focusing on the landscape decoration of blue and white teapots [6]. Bang explored the imitation of Chinese ceramics and kiln manufacturing techniques in Japan during the medieval period [7]. Wei and Zhen compared Jeju clay with Yixing clay and argued that Jeju clay could have been used for teapot production [8].
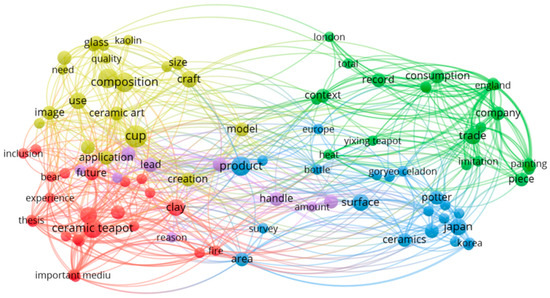
Figure 1.
Keyword co-occurrence mapping of ceramic teapot subject literature (Source: author).
Scholars have studied the design and craftsmanship of ceramic products in depth. In the area of design, H. Hang studied the emotional design of ceramic packaging [9], J. M. Huang studied the application of ceramic materials in modern bamboo furniture design [10], and P. Jae-yeon studied the impact of ceramic tableware design elements on user sensitivity [11]. In terms of craftsmanship, Lu, YQ used digital image processing technology to design ceramic product shapes [12], Zhang, JH used reverse engineering technology to improve the manufacture of purple clay teapot molds [13]. Sung explored the production process of Gijang ceramics and its characteristics in the history of ceramics [14]. Chow, SK, on the other hand, created an interactive virtual exhibition of ceramic artifacts using 3D-modeling technology [15]. However, it lacks a link to consumer preferences.
In addition, some scholars have paid attention to the study of ceramic materials. Some scholars actively explore new materials. For example, K. Sakita proposed environmentally friendly ceramic materials from the perspective of industrial design [16]. Some scholars have focused on the improvement of traditional materials, including the precise control of ceramic firing and molding process parameters [17], in order to enhance product quality. Moreover, Liao, ZH suggested that the taste of tea is related to the material of the pot [18], and Lin, CL explored the effect of light, color, temperature, and illumination on ceramic teapots [19]. Finally, scholars have also paid attention to the cultural value and market demand for teapots; Chen studied the design style and inscription decoration of purple clay teapots, giving them deep cultural connotations and traditional Chinese artistic qualities [20].
Functionality research mainly focuses on durability and functional coatings. Some scholars have improved the abrasiveness of ceramic materials using low temperatures as a coolant [21]. Meanwhile, J. Osés developed coatings with antimicrobial functions to enhance usage performance [22]. However, there is a lack of research on the sustainable production and design of ceramic teapots, such as the use of environmentally friendly materials and energy-efficient manufacturing processes.
The research status in this section shows that the current research involves many aspects of ceramic teapots, such as the emotional design of ceramic packaging, the application of materials in furniture design, and the influence of tableware design elements in design and technology. For ceramic materials, there is an exploration of new materials and traditional material improvement research; there is also cultural value, market demand, and some functional research. However, globally, except for China, the relevant academic research is small in scale and narrow in scope. A lack of correlation with consumer preferences and a lack of systematic research in modeling and design provides the research direction for this study.
2.2. State-of-the-Art Eye-Tracking Research in Product Styling
Eye-tracking data provides communication scholars with the opportunity to examine more accurately the extent to which audiences pay visual attention to information [23]. Furthermore, eye-tracking technology goes beyond self-reported subjective data and provides a fairly objective measure [24] that can reveal how audiences process visual and textual information [25]. By tracking an individual’s eye movements, researchers can not only discover what users find interesting but also gain insight into how information is perceived and understood [26]. These valuable insights into user behavior help communication scholars design information-dissemination strategies that are more relevant to audience needs.
In recent years, the application of eye-tracking technology in the field of product styling and design research has been characterized by the following aspects.
First, it focuses on the research of visual attraction. Scholars have used eye-tracking experiments to explore the impact of product design on users’ visual attention, with a view to optimizing the visual attractiveness of products. For example, Cummins, RG found that advertisements containing mannequins produced a visual distraction effect that increased brand attention [27], while Cooper, M examined the relationship between youth attractiveness attributes on marijuana edibles packages and higher attractiveness ratings, more visual attention to these attributes, and less attention to warning labels [28].
Scholars also use eye-tracking techniques to focus on differences in users’ visual attention to color preferences when looking at products. For example, Wu, B found that people with different Asian cultural backgrounds have different viewing patterns when choosing the color of a product [29], and Song, ES investigated the differences between color perception and preference in a dental-treatment setting [30].
In addition, some scholars have combined eye-tracking experiments with users’ subjective evaluations to understand the impact of product styling more fully on user perceptions of an experience. For example, Pei, HN found that moving images with different presentation times caused differences in users’ cognitive levels and emotional experiences [31], while Schall, A evaluated the user experience of moving content on a large TV monitor [32].
Finally, some scholars have used eye-tracking experiments to compare and analyze various product-styling options to provide a basis for design decisions. For example, Grabinger, L used eye-tracking to evaluate elements of a graphic modeling language [33], and Sergeyev, A explored the optimal solution for viewing stereoscopic images in an eye-tracking system [34].
Taken together, the past eye-tracking research in different fields has value. However, regarding the design of ceramic teapots, the lack of specific research is obvious. In view of this, this research boldly innovates, uses eye-tracking technology, and successfully obtains method references and theoretical help by virtue of its existing application in the field of product modeling.
2.3. Current Status of the Application of Semantic Differentials in the Field of Product Semantic Evaluation
Scholars often utilize semantic differences to gain insight into user needs for products. A more mature basic framework for product semantic evaluation is provided at the theoretical level, which clarifies how to obtain information about user perceptions of product semantics through specific scale design and scoring methods.
For example, scholars in electronic product design, by allowing users to semantically evaluate the multi-criteria usability of a product [35], can accurately discover user expectations and thus optimize the product design, and this approach can help translate users’ ambiguous needs into specific design directions [36].
Researchers have focused on how products convey specific semantics through design elements. In the field of furniture design, M. Chen found through semantic-difference research that different combinations of materials, shapes, and colors convey different semantics [37], such as wood may convey natural and warm semantics, while metal may convey modern and cold semantics. Designers can select design elements to convey the intended semantics in a targeted manner according to the positioning of the product and the target user group.
Semantic differences play a key role in the product-design evaluation and improvement process. In product design, by allowing users to semantically evaluate the product, designers can obtain users’ intuitive feelings and opinions about the product and then adjust and optimize the design [38].
With the passage of time, semantic-difference methods have continued to evolve, and many researchers have focused on the optimization of semantic scale in order to accurately grasp user perception. In view of the complete application paradigm and solid theoretical foundation, this has been built into the field of product semantic evaluation, which provides a solid basis and support for the integration and application of the research.
Current research on the modeling of ceramic teapots is in a state of relative scarcity. In terms of research methodology, subjective evaluation occupies a dominant position, but there is a serious lack of systematic and objective research to provide strong support. In addition, at the level of research into aesthetic preference, on the one hand, there is a lack of in-depth exploration of the differences between different user groups, which makes it difficult to accurately grasp the unique aesthetic needs of various types of users of ceramic teapots; on the other hand, there is a lack of a comprehensive and detailed analysis and exploration of the subject from multiple perspectives, which makes it difficult to form a complete cognitive system of ceramic teapot aesthetic preference.
To summarize, users’ aesthetic preferences for ceramic teapot shapes have yet to be clarified. This study will focus on solving the following problems:
- What is the order of user preference for the elements of ceramic teapot shape?
- What is the preference of users for different combinations of ceramic teapot shapes?
- Is there a different influence on user semantic perception and satisfaction with ceramic teapots in terms of gender and age group?
3. Methodology
The flow of this research is shown in Figure 2. First, in order to study user preference for ceramic teapot shape elements, experiment one is conducted using eye-tracking experiments, dividing the interest area to collect information from the subjects to interpret the representation data and analyzing the data in order to know the product shape area that attracts the attention of the subjects.
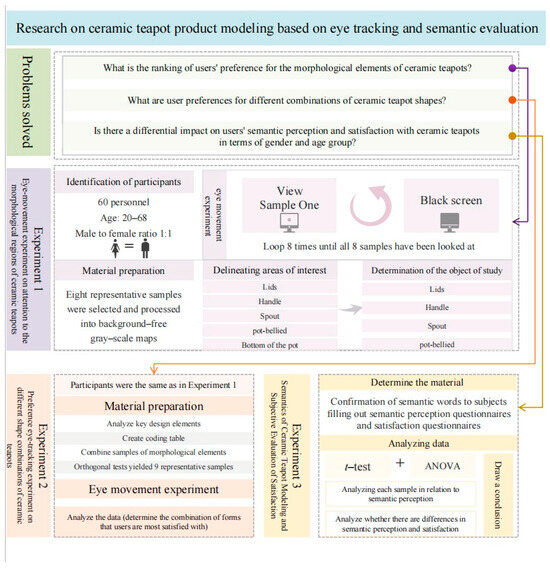
Figure 2.
Experimental flow chart (Source: author).
Second, in order to investigate user preferences for different combinations of ceramic teapot shapes, Experiment 2 was conducted, in which the eye-tracking experiment was used again to observe the subjects’ attention to nine combinations of samples and, combined with the satisfaction questionnaire, to find out the ceramic teapot shape combinations with which users were most satisfied.
Finally, in order to investigate whether there is a different effect of users’ semantic perception and satisfaction with ceramics in terms of gender and age group, the data from the semantic perception questionnaire and the satisfaction questionnaire were analyzed by t-test analysis and ANOVA, and conclusions were drawn.
3.1. Experiment 1: Eye-Movement Experiment on Attention to Ceramic Teapot Morphological Regions
3.1.1. Experiment One Participants
With a total of 60 subjects ranging in age from 20 to 68 years old, male to female ratio of 1:1, and subjects from different cities, this experiment has universal applicability. All subjects had normal color vision, normal visual acuity (or corrected visual acuity), myopia ≤ 300°, and met the requirements of the eye-movement experiment. All participants participated in the experiment voluntarily, and no visual abnormalities or other factors affecting the experiment were found.
3.1.2. Experiment One Equipment
The experiment adopted the advanced Tobii Pro Fusion 250 Hz eye tracker, whose high sampling frequency of 250 HZ ensures the accuracy of data, this equipment manufacturer is from Beijing Jinfa Co., Ltd. (Beijing, China). ErgoLAB was used for experimental and data analysis to facilitate efficient research, the software is from Beijing Jinfa Co., Ltd. (Beijing, China). The subject and the experimenter were separated by isolation to ensure the independence of the experiment. The subject was about 60 cm away from the screen and needed to keep their body still during the experiment. A 60.96-centimeter 1920 × 1080 pixel computer screen was used to present the test material.
The experimental environment was quiet. The noise in the space of 10 square meters was less than 40 decibels, the temperature was constant at 20 °C, and the light was stable so that the subjects were comfortable. In lighting, natural and artificial light sources were combined to diffuse artificial light to avoid screen shadow reflection. The room was soundproofed and free from debris to minimize interference and ensure that the experimental data were real and reliable.
This study collected abundant ceramic teapot materials, focusing on the representative exhibits of the Forbidden City Museum and Longquan celadon, and combined them with the highly popular cultural and creative ceramic bottle products on the e-commerce market. The experts systematically sorted out these materials and finally selected eight representative samples as experimental materials, which integrated the long Chinese ceramic cultural tradition with modern design elements. In terms of shape design, they combine the classic stylistic features of traditional ceramic teapots with modern minimalist line-design concepts; in terms of decoration, there are traditional textures but also modern, more uniform, and simple colors.
In order to ensure the scientific reliability of the experiment, the main view of these teapots was selected as the sample pictures. In order to avoid the interference of the background with the experimental results, Photoshop was used to process the pictures, remove the background, and uniformly process them into the same grayscale in order to ensure that the product material, color, and other conditions would not affect the experimental results. See Table 1.

Table 1.
Experimental samples.
In this study, the teapot parts were divided into 5 areas of interest (cover, spout, belly, handle, and bottom) to collect eye-movement data, as shown in Figure 3. Then, the importance of gaze order was ranked according to the value of eye movement. The regions with the lowest attention were removed, and the top four interest regions were selected as the key parts of the in-depth exploration in the follow-up experiment.
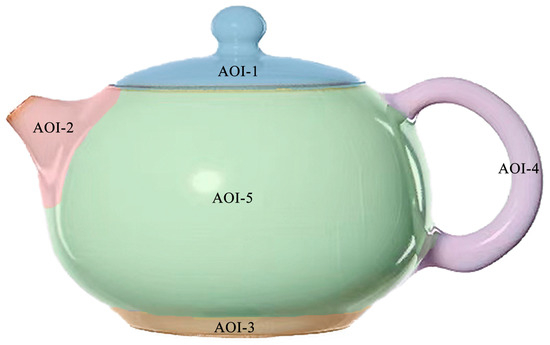
Figure 3.
AOI division of ceramic teapot (Source: author).
3.1.3. Experimental Procedure
Before the eye-movement experiment began, participants were given detailed verbal and written instructions. They were told the purpose of the study and what was expected of them during the experiment. The instructions emphasized the importance of maintaining a natural viewing behavior and not deliberately focusing on any particular part of the teapot sample. Participants were also told the duration of each sample presentation and the rest time in between to avoid visual fatigue. In addition, they were assured that their personal data would be kept confidential and used only for research purposes. After the experiment began, the subjects observed 8 ceramic teapot samples successively. As shown in Figure 4, the observation time of each sample was set for 10 s. After the observation of each picture, the black screen paused for 3 s to eliminate viewing fatigue and then automatically switched to the next one until the playback of all samples ended.
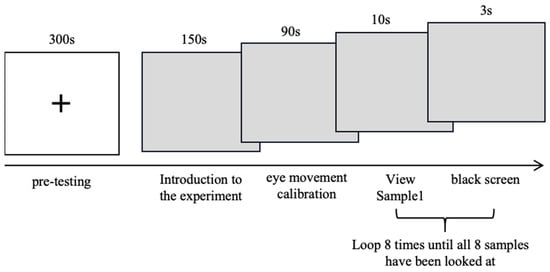
Figure 4.
Flowchart of Experiment 1 (Source: author).
3.2. Experiment 2: Preference Eye-Tracking Experiment on Different Shape Combinations of Ceramic Teapots
3.2.1. Trial Two Participant
Same as in Experiment 1.
3.2.2. Trial Two Equipment
Same as in Experiment 1.
3.2.3. Experimental Materials
In order to further explore user preferences for the combination of morphological features of ceramic teapots, we conducted an in-depth analysis of the key design elements of the teapot samples. First, we established a coding list of ceramic teapot morphological design elements and lettered the main morphological features A–D, as shown in Table 2, while the different elements were denoted by numbers 1, 2, and 3. Next, we made a total of 27 morphological code combinations for the 12 morphological design elements from A1B1C1, A1B1C2, etc., to A3B3C3.
Table 2.
Ceramic teapot morphological design element codes.
In order to avoid eye fatigue of the subjects during the experiment, which would affect the rigor of the data, we adopted the orthogonal experiment method to arrange experimental factors reasonably and effectively. Orthogonal experimentation is a statistical experimental design technique used to effectively study the effects of multiple factors on response variables. In this study, we have several morphological design elements (such as the shape of the ampulla, the style of the lid, etc.) of the ceramic teapot that may influence user preferences. Using orthogonal testing methods, we were able to systematically combine these factors to reduce the number of experiment runs required while still capturing the main effects and interactions.
According to the 12 key shape design elements extracted in the previous stage, 9 combination samples with typical characteristics were selected from the experimental samples, namely A1B1C1D1, A1B2C3D2, A1B3C2D3, A2B1C3D3, A2B2C2D1, A2B3C1D2, A3B1C2D2, A3B2C1D3, and A3B3C3D1, as shown in Figure 5. These combinations will provide enough information about the relationship between different design elements and user perception. This approach helps ensure that the selected sample represents all possible combinations and allows for more efficient analysis of the data.
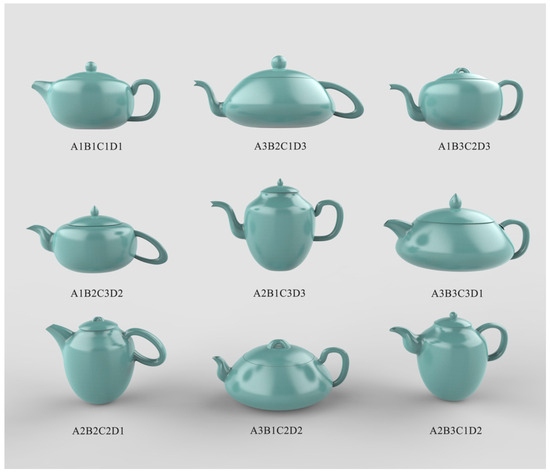
Figure 5.
Preliminary samples of ceramic teapot form design element combination (Source: author).
3.2.4. Experiment 2 Process
The flow of Experiment 2 is shown in Figure 6. Subjects were asked to browse through 9 ceramic teapot samples, and eye-tracking devices were used to capture the eye-movement data of the subjects. In this experiment, each teapot sample was regarded as an independent area of interest, which was divided into 9 areas of interest in total. A total of 9 teapot samples were arranged and combined on a graph to be shown to the subjects, as shown in Figure 7, and the observation time of each sample was set to 15 s. After observing the samples, the subjects were asked to fill in the corresponding semantic perception questionnaire. Each subject was required to repeat the above steps until 9 samples were observed and evaluated.
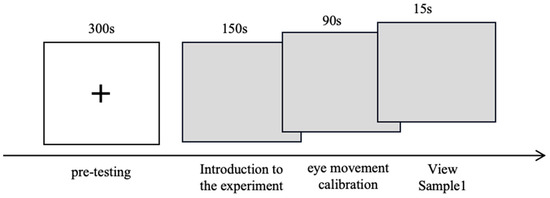
Figure 6.
Flowchart of Experiment 2 (Source: author).
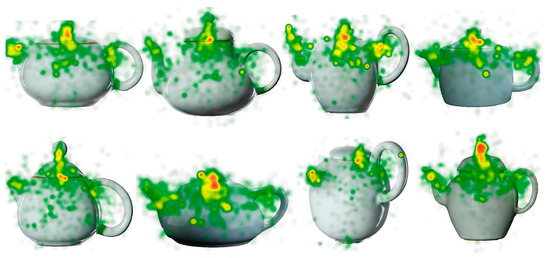
Figure 7.
Hot spot map of experiments in regions of interest (Source: author).
3.3. Experiment 3: Ceramic Teapot Modeling Semantics and Subjective Evaluation of Satisfaction
3.3.1. Questionnaire Design
We designed a two-part questionnaire: the first part is a semantic vocabulary perception questionnaire. By querying the semantic vocabulary of ceramic teapot styles in the glossary, consumer evaluations, and related papers, we finally obtained 10 groups of adjective pairs for each sample. Among them, 5 groups are product-form semantic vocabulary, and the other 5 groups are produced-emotion semantic vocabulary, specifically including lightness–bulkiness, hardness–warmth, plainness–gorgeousness, classicness–individuality, lightness–thickness, and comfortable–uncomfortable, passion–tranquility, freedom–binding, looseness–tightness, and harmony–hardness.
These 10 sets of adjective pairs are closely related to the samples. The product-form semantic vocabulary describes the samples in terms of appearance, such as “lightweight–bulky” to reflect the sense of weight and “tough–warm” to relate to the feeling of materials and lines. The product-emotion semantic vocabulary describes the user’s feeling; “comfortable–uncomfortable” reflects the feeling of use, and “passionate–serene” involves the emotional atmosphere. These were chosen because they cover the key features of ceramic teapot modeling in terms of form and emotion, and can comprehensively and accurately evaluate the samples and provide a reference for design.
3.3.2. Rating Method
The second part is the satisfaction questionnaire. In the semantic vocabulary perception questionnaire, we asked subjects to rate the semantic match of each sample, with a range of −3 to +3, where +3 or −3 means the best match to the corresponding vocabulary, and 0 means neutral. Meanwhile, we also set up a satisfaction questionnaire in the form of a five-point Likert scale, in which subjects were asked to rate the overall morphology of the samples according to how much they liked them, with scores ranging from 1 to 5, with higher scores representing higher levels of liking.
3.3.3. Data Collection and Analysis
A total of 270 data were collected. Through quantitative analysis, we were able to more accurately obtain users’ initial cognitive preferences for product morphology features, thus enhancing the reliability and relevance of the data from the subsequent eye-movement experiments.
4. Results
4.1. Analysis of the Experimental Results on the Attention of Ceramic Teapot Morphology Region
The hotspot map of the eight samples is shown in Figure 7, with red representing the areas with the highest concentration of browsing and gaze and yellow and green representing the areas with less gaze. It can be clearly seen that user attention is concentrated on the top of the ceramic teapot, and less attention is paid to the area below the ceramic teapot.
Table 3 makes a quantitative comparison of the data and superimposes the interest-region data of eight samples, such as the first fixation time, average fixation duration, and total fixation duration.
Table 3.
Ceramic teapot morphological characteristics intended cognitive eye-movement experimental data analysis.
Eye-movement experimental data can accurately analyze the user’s visual behavior. AOI first fixation time/ms is the number of milliseconds of first looking at the area of interest, and the shorter it is, the easier it is to be attracted. The longer the first gaze duration (s) and the average gaze duration (s), the greater the interest. If the total gaze time/ms and the total gaze number of AOI are large, the interest is strong. The number of the first gaze sequence and the number of gaze points before entering also indicate that interest in the area is high.
According to the numerical value, the importance of the subject gaze order was ranked, and the results show that the bottom of the pot is the lowest in terms of first gaze time, order, total gaze times and time, etc. Users rarely paid attention to the bottom of the pot, which was the lowest area of attention. The abdomen, spout, handle, and lid are the focus of follow-up experimental research.
4.2. Analysis of Experimental Results of Preference for Different Shape Combinations of Ceramic Teapots
4.2.1. Means of Imagery Phrases and Favorite Degree of the Nine Samples
Figure 8 presents the general status of the satisfaction mean of the nine samples, with Samples 8, 6, and 9 having relatively high satisfaction means and Sample 7 having the lowest.
Figure 8.
Satisfaction of each sample (Source: author).
Table 4 shows that subject satisfaction with Sample 8 was the highest at 4 points, and Sample 7 was the lowest at 1.93 points. The subject semantic ratings for Samples 8 and 7 were warm, cozy, and loose, and hard, personalized, and difficult, respectively.
Table 4.
Means of imagery phrases per group and sample satisfaction means.
4.2.2. Eye-Movement Metric Extraction and Data Analysis of Nine Samples
The hotspot map in Figure 9 and the eye-movement experimental data in Table 5 clearly show that Sample 8 stands out and is more favored by users due to the large red area of the hot spot map, the longest first gaze duration, the largest number of looks, and the longest average visit and total gaze time. Sample 7 became the sample that users paid the least attention to because of the short staring time and the small number of times. It can be seen that questionnaire satisfaction is highly consistent with the results of the eye-movement experiment.

Figure 9.
Hot spot map for 9 samples (Source: author).
Table 5.
Analysis of eye-movement experimental data for each sample.
4.3. Analysis of Experimental Results of Subjective Evaluation of Semantics and Satisfaction in Ceramic Teapot Modeling
As shown in Table 6, before data analysis, reliability analysis was conducted on the semantic and satisfaction questionnaire data, and the Cronbach α coefficients were 0.711 and 0.782, respectively, indicating good reliability.
Table 6.
Test data for reliability, validity, and normal distribution.
Validity analysis was performed on the semantic and satisfaction questionnaire data, and the KMO values were 0.647 and 0.724, respectively, indicating that the data were suitable for extracting information.
Finally, the data were tested for normal distribution. The absolute value of kurtosis of the satisfaction questionnaire and semantic words for the questionnaire is less than 10, and the absolute value of skewness is less than 3, indicating that although the data are not absolutely normal, they can basically be accepted as having a normal distribution.
Therefore, the experimental data passed the reliability, validity, and normal distribution tests, meaning that the t-test and variance analysis could be carried out to lay the foundation for subsequent accurate analysis.
4.3.1. The Effect of Gender on the Ceramic Teapot Perceptual Evaluation Results
After the 60 subjects scored the average of 10 groups of semantic word pairs and classified them according to gender, a t-test was conducted to analyze the influence of different genders on the results of the perceptual evaluation of ceramic teapots.
As can be seen in Table 7, subjects of different genders show a high degree of uniformity in their perception of semantic word pairs.
Table 7.
Comparison of t-tests for gender and semantic word pairs.
The gender samples show a significant difference (p < 0.05) for passion–tranquility. Specific analysis shows that the average value of women (0.84) is significantly higher than that of men (0.02). In addition, the remaining nine semantic word pairs do not show significance (p > 0.05), which means that there is no difference between the genders in terms of consistency for all these semantic word pairs.
4.3.2. The Effect of Different Age Groups on the Results of Ceramic Teapot Perceptual Evaluation
The mean values of the scores of the 60 subjects on the 10 semantic word pairs were categorized according to age groups and then analyzed by ANOVA in order to analyze the effect of different age groups on the results of the evaluation of the perception of ceramic teapots.
As can be seen from Table 8, there is no significance for the 9 semantic word pairs in different age groups (p > 0.05), and the degree of perception shows a high unity.
Table 8.
ANOVA for age group and semantic word pairs.
4.3.3. Influence of Gender on Satisfaction Results of Ceramic Teapots
The means of satisfaction scores of different genders for the nine samples were analyzed by a t-test.
It can be seen from Table 9 that Sample 3 and Sample 9 show a significant influence (p < 0.05), and the specific comparison difference shows that the average value of women (3.33) in Sample 3 is significantly lower than that of men (3.73). The average for women in the sample of nine (3.47) is significantly lower than that for men (4.17).
Table 9.
Comparison of gender and satisfaction t-test.
Except for Samples 3 and 9, different genders did not show significance for the other samples (p > 0.05), which means that different genders showed consistency for all of these without difference.
4.3.4. The Effect of Different Age Groups on the Satisfaction Results of Ceramic Teapots
The homogeneity test of variance should be conducted before the one-way ANOVA. As shown in the figure, all p values are greater than 0.05, which satisfies the homogeneity of variance, and ANOVA can be performed, as shown in Table 10.
Table 10.
Variance homogeneity test of satisfaction.
The means of the satisfaction scores for the nine samples were analyzed by ANOVA for the different age groups.
It can be seen from Table 11 that different ages do not show significant differences in influence (p > 0.05) for all nine samples, implying that different ages show consistency for all these samples.
Table 11.
Analysis of variance for age group and satisfaction.
5. Discussion
5.1. Visual Attention to Key Modeling Areas and Design Guidance
Through in-depth analysis of eye-movement data, we can define the four major modeling features of the belly, spout, handle, and lid of the teapot, which can quickly grasp the user’s visual focus and highlight visual cognitive preference. In daily use and observation, these parts are intuitive and eye-catching and are the key to building the overall shape of the teapot, which instantly attracts attention. Combined with the attention theory, the unique design of the spout of Sample 7 in Experiment 1 is taken as an example, which constitutes significant visual stimulation, attracts many attention resources, and demonstrates the core value of innovation area in shaping user preferences. The research results indicate the direction of teapot design.
When designers carry out their work, they should focus on these key morphological characteristics, carefully polish the design details, adapt to the visual preferences of users, effectively improve product attractiveness and user satisfaction, and help the teapot design achieve greater breakthroughs in meeting user needs and improving quality.
5.2. Preferences and the Characterization of Different Shape Combinations
For the morphological design elements, the small top and large bottom of the belly may be of interest because they are visually unique and suggest good capacity and stability; the upward-trending handle is ergonomic, comfortable to use, and visually dynamic; the hollowed-out lid adds a sense of transparency and sophistication, and better satisfies subjects’ curiosity; and the moderate spout is popular, probably because it feels convenient to use for subjects and aesthetically pleasing. For the semantic and perceptual features, the classic shape evokes a traditional good impression and conveys a sense of quality and reliability; the roundness and proportional coordination are in line with traditional aesthetics, giving a sense of gentleness and comfort, which can satisfy the user demand for emotional experience, and make users feel happy visually and psychologically.
5.3. Consistency of Users’ Semantic Perception and Satisfaction of Ceramic Teapots and Design Inspiration
In terms of semantic perception, through the study of the differences in scores of different samples, it can be found that users naturally associate specific semantic traits with different shapes. For example, classic shapes evoke a sense of tradition and quality, while round and proportionally harmonious shapes evoke comfort and harmony. In order to understand this phenomenon more deeply, the Gestalt principle is introduced to explain it. When the proportion and shape of the ceramic teapot body, spout, handle, and other parts fit the principle of similarity and continuity, a sense of visual harmony and overall cognition is presented to users, thus affecting their preferences.
The experimental data show that the semantic perception and aesthetic preferences of different genders and age groups are highly consistent with little difference. This is because the overall beauty of the classic shape and harmonious proportion of the ceramic teapot is widely recognized. This consistency indicates that users have common aesthetic needs for ceramic teapots, and designers can focus on commonality to enhance the charm of products. Although the differences are small, with the analysis of these differences, the complexity and diversity of user needs can still be met, and then accurate and comprehensive guidance and strategic reference for the design process can be provided so that the product can better meet the expectations of different groups and promote the continuous optimization and innovation of ceramic teapot design.
6. Conclusions
This research focuses on the perceptual field of ceramic teapot modeling, showing innovation and comprehensiveness in research methods. The innovative introduction of eye-tracking technology and the clever combination of semantic questionnaires and satisfaction questionnaires successfully realized the organic integration of qualitative and quantitative research methods. This research process is highly practical and provides a comprehensive and objective insight into user preferences for the shape design of ceramic teapots.
Based on Kansei’s engineering theory, eye-movement experiments were used to analyze users’ visual attention in detail, while questionnaires were used to deeply explore users’ semantic perception and satisfaction. Finally, a series of valuable and effective conclusions were drawn. These conclusions strongly support the modeling design of ceramic teapots, fully verify the scientific rationality of the research method and framework, and set up a reference example for related perceptual-research fields.
From a broader perspective of product modeling, this research method has good universality. Taking automobile surface design as an example, similar research ideas can be followed: with the help of eye-tracking technology, we can accurately grasp the visual focus of users on different areas of a car’s surface and then combine semantic questionnaires and satisfaction questionnaires to dig deeply into users’ semantic perception and satisfaction evaluation of feature areas, so as to comprehensively and deeply understand user preferences for product modeling, and point out accurate design directions for designers. This process would effectively enhance the competitiveness of products in the market. In follow-up research, this research method can be extended to various ceramic and decorative products.
However, this study has some limitations. The current study only used 60 subjects, meaning that the sample size was relatively small, which may restrict the generalization of the research results. In future research, it will be necessary to greatly increase the number of subjects and include subjects from different cultural backgrounds, social and economic classes, and geographical regions to strengthen the universality and representation of research results. In addition, it would be of great significance to increase the longitudinal analysis of consumer preferences over time in future studies to accurately grasp short and long-term design trends.
Author Contributions
Conceptualization, W.L. and Z.H.; methodology, Z.H.; investigation, W.L.; validation, W.L. and Z.H.; software, Z.H., J.C. and Y.F.; resources, Z.H.; writing—original draft preparation, W.L. and Y.F.; writing—review and editing, W.L.; visualization, J.C., Y.F. and C.Y.; supervision, Y.F. and J.C. All authors have read and agreed to the published version of the manuscript.
Funding
This research received no external funding.
Institutional Review Board Statement
Not applicable.
Informed Consent Statement
Not applicable.
Data Availability Statement
This article encompasses the study’s original contributions. Further inquiries can be addressed to the corresponding author.
Acknowledgments
The authors would like to thank the university teachers and students who participated in the experiment, as well as the editors and anonymous reviewers for their constructive comments.
Conflicts of Interest
The authors declare no conflicts of interest.
References
- Yeon, P.J. A Study on the Design Management Strategy for the Advancement of Domestic Ceramic Ware Industry. J. Korean Soc. Des. Cult. 2008, 14, 141–159. [Google Scholar]
- Wu, W.; Gao, Y. Analysis of the Application of the Beauty Based on the Material in the Modern Ceramic Art Design. In Proceedings of the 2nd International Conference on Economic, Business Management and Education Innovation (EBMEI 2014), Singapore, 5–6 November 2014; pp. 117–121. [Google Scholar]
- Yan, F. Study on the Application of Colors in the Design of Domestic Ceramic Decoration-Taking White Tone as an Example. In Proceedings of the 5th International Conference on Physical Education and Society Management (ICPESM 2017), Amman, Jordan, 6–7 February 2017; pp. 276–279. [Google Scholar]
- Yan, R.; Wang, M. Status Analysis and Countermeasure Research on Package Design of Domestic Ceramic in Jingdezhen. In Proceedings of the 5th International Conference on Applied Social Science (ICASS 2015), Limassol, Cyprus, 4–5 October 2015; pp. 353–357. [Google Scholar]
- Myz, A.L.; Karagedov, G.R.; Lyakhov, N.Z. Evaluation of Domestic Alumina As Raw Material for Structural Ceramic. Glass Ceram. 2016, 73, 66–70. [Google Scholar] [CrossRef]
- Jungmin, L.E.E. The Relationship between English Worcester Porcelain and Chinese Export Porcelain: Focusing on Blue and White Teapot with Landscape Decorations. Art Hist. 2020, 39, 161–188. [Google Scholar]
- Bang, B. Emulation of Chinese Ceramics and Manufacturing Technology of Seto Kiln during the Japanese Medieval Period. Art Hist. J. 2018, 51, 215–237. [Google Scholar] [CrossRef]
- Wei, Z.; Choi, S. A Comparative Study of Jeju Clay and Yixing Clay. J. Korean Soc. Ceram. Art 2022, 19, 67–80. [Google Scholar]
- Hang, H.; Liu, J.; Shao, J. Research on Emotional Design of Ceramic Packaging. In Proceedings of the 5th International Conference on Advanced Design and Manufacturing Engineering (ICADME), Shenzhen, China, 19–20 September 2015; pp. 267–271. [Google Scholar]
- Huang, J.; Dong, W.; Zhang, S. Brief Introduction to Ceramic Material Application in Modern Bamboo Furniture Design. In Proceedings of the 4th International Conference on Sensors, Mechatronics and Automation (ICSMA), Zhuhai, China, 12–13 November 2016; pp. 202–205. [Google Scholar]
- Jae-yeon, P. A Study on the Influence of Ceramic Tableware’s Design Elements upon Users’ Sensitivity. J. Korean Soc. Des. Cult. 2009, 15, 123–135. [Google Scholar]
- Lu, Y. Modeling Design of Ceramic Products Based on Digital Image Processing Technology. Mob. Inf. Syst. 2022, 2022, 6939127. [Google Scholar] [CrossRef]
- Zhang, J.; Ma, Y. Manufacturing Method of The Purple-clay Teapot Mold Based on Reversing Engineering. In Proceedings of the 4th International Conference on Digital Manufacturing and Automation (ICDMA), Qindao, China, 29–30 June 2013; pp. 760–762. [Google Scholar]
- Sung, H.-J. The Production Processes of Ceramics in Gijang and Its Characteristics in Ceramic History. J. Koreanol. 2009, 33, 75–131. [Google Scholar]
- Chow, S.-K.; Chan, K.-L. Reconstruction of photorealistic 3D model of ceramic artefacts for interactive virtual exhibition. J. Cult. Herit. 2009, 10, 161–173. [Google Scholar] [CrossRef]
- Sakita, K.; Mori, T.; Igoshi, M. Proposal of environmentally conscious ceramics products from point of view of industrial design. In Proceedings of the 3rd International Symposium on Environmentally Conscious Design and Inverse Manufacturing (EcoDesign 03), Tokyo, Japan, 8–11 December 2003; pp. 552–558. [Google Scholar]
- Meethong, N.; Pattanasiriwisawa, W.; Somphon, W.; Tanthanuch, W.; Srilomsak, S. Properties of Dan Kwian, Sukhothai and Ratchaburi Pottery Clays Fired at 700 and 900 °C. In Proceedings of the International Conference on Traditional and Advanced Ceramics (ICTA), Bangkok, Thailand, 11–13 September 2013. [Google Scholar]
- Liao, Z.-H.; Chen, Y.-J.; Tzen, J.T.-C.; Kuo, P.-C.; Lee, M.-R.; Mai, F.-D.; Rairat, T.; Chou, C.-C. Effect of teapot materials on the chemical composition of oolong tea infusions. J. Sci. Food Agric. 2018, 98, 751–757. [Google Scholar] [CrossRef]
- Lin, C.-L. The influence of color temperature and illuminance on the touch motivation and preference of craft. J. Ambient. Intell. Humaniz. Comput. 2020, 14, 14409–14422. [Google Scholar] [CrossRef]
- Chen, H. Analysis on the Historical Role and Significance of Purple Clay Teapot and Its Inscription Decoration. In Proceedings of the International Conference on Education, Language, Art and Intercultural Communication (ICELAIC), Zhengzhou, China, 6–7 May 2014; pp. 569–575. [Google Scholar]
- Singh, V.; Ghosh, S.; Rao, P.V. Grindability Improvement of Composite Ceramic with Cryogenic Coolant. In Proceedings of the World Congress on Engineering (WCE 2010), Imperial Coll London, London, UK, 30 June–2 July 2010; pp. 1124–1128. [Google Scholar]
- Oses, J.; Garcia Fuentes, G.; Fernandez Palacio, J.; Esparza, J.; Antonio Garcia, J.; Rodriguez, R. Antibacterial Functionalization of PVD Coatings on Ceramics. Coatings 2018, 8, 197. [Google Scholar] [CrossRef]
- Bol, N.; Boerman, S.C.; Bergstrom, J.C.R.; Kruikemeier, S. An Overview of How Eye Tracking Is Used in Communication Research. In Proceedings of the 10th International Conference on Universal Access in Human-Computer Interaction Held as Part of 18th International Conference on Human-Computer Interaction (HCI International), Toronto, ON, Canada, 17–22 July 2016; pp. 421–429. [Google Scholar]
- Chen-Sankey, J.; Elhabashy, M.; Gratale, S.; Geller, J.; Mercincavage, M.; Strasser, A.A.; Delnevo, C.D.; Jeong, M.; Wackowski, O.A. Examining Visual Attention to Tobacco Marketing Materials Among Young Adult Smokers: Protocol for a Remote Webcam-Based Eye-Tracking Experiment. JMIR Res. Protoc. 2023, 12, e43512. [Google Scholar] [CrossRef] [PubMed]
- Subrahmaniam, S. CG&A with Eye Tracking for Cognitive Behavior Analysis and Psychoanalysis. In Proceedings of the Sixth International Conference on Developments in eSystems Engineering (DeSE), Abu Dubai, United Arab Emirates, 16–18 December 2013; pp. 132–137. [Google Scholar]
- Varela, P.; Antunez, L.; Silva Cadena, R.; Gimenez, A.; Ares, G. Attentional capture and importance of package attributes for consumers’ perceived similarities and differences among products: A case study with breakfast cereal packages. Food Res. Int. 2014, 64, 701–710. [Google Scholar] [CrossRef] [PubMed]
- Cummins, R.G.; Gong, Z.H.; Reichert, T. The impact of visual sexual appeals on attention allocation within advertisements: An eye-tracking study. Int. J. Advert. 2021, 40, 708–732. [Google Scholar] [CrossRef]
- Cooper, M.; Shi, Y. Appeal rating and visual attention associated with youth-appealing cannabis packaging: An eye-tracking experiment. Drug Alcohol Depend. 2023, 253, 110992. [Google Scholar] [CrossRef] [PubMed]
- Wu, B.; Nishimura, S.; Zhu, Y.; Jin, Q. Experiment Design and Analysis of Cross-Cultural Variation in Color Preferences Using Eye-Tracking. In Proceedings of the 13th International Conference on Multimedia and Ubiquitous Engineering (MUE)/14th International Conference on Future Information Technology (Future Tech), Xi’an, China, 24–26 April 2019; pp. 44–49. [Google Scholar]
- Song, E.-S.; Kim, W.-H.; Lee, B.-H.; Han, D.-W.; Lee, J.-H.; Kim, B. Assessment of Color Perception and Preference with Eye-Tracking Analysis in a Dental Treatment Environment. Int. J. Environ. Res. Public Health 2021, 18, 7981. [Google Scholar] [CrossRef] [PubMed]
- Pei, H.; Huang, X.; Ding, M. Image visualization: Dynamic and static images generate users’ visual cognitive experience using eye-tracking technology. Displays 2022, 73, 102175. [Google Scholar] [CrossRef]
- Schall, A. Eye Tracking Evaluation of User Experience on Large-Scale Displays. In Proceedings of the 9th International Conference on Universal Access in Human-Computer Interaction (UAHCI) Held as Part of 17th International Conference on Human-Computer Interaction (HCI), Los An, CA, USA, 2–7 August 2015; pp. 98–108. [Google Scholar]
- Grabinger, L.; Hauser, F.; Mottok, J. Evaluating Graph-based Modeling Languages. In Proceedings of the 5th European Conference on Software Engineering Education (ECSEE), Seeon Monastery, Germany, 19–21 June 2023; pp. 120–129. [Google Scholar]
- Sergeyev, A.; Levin, E.; Roggemann, M.C.; Gienko, G. Design of the stereoscopic eye-tracking system for quantative remote sensing applications. In Proceedings of the 1st SPIE Conference on Remote Sensing System Engineering, San Diego, CA, USA, 11–13 August 2008. [Google Scholar]
- Atalay, K.D.; Eraslan, E. Multi-Criteria Usability Evaluation of Electronic Devices in a Fuzzy Environment. Hum. Factors Ergon. Manuf. Serv. Ind. 2014, 24, 336–347. [Google Scholar] [CrossRef]
- Chuang, M.C.; Ma, Y.C. Expressing the expected product images in product design of micro-electronic products. Int. J. Ind. Ergon. 2001, 27, 233–245. [Google Scholar] [CrossRef]
- Chen, M.; Lv, J.-h. A Study of Furniture Design Based on Product Semantics. In Proceedings of the 12th IEEE International Conference on Computer-Aided Industrial Design and Conceptual Design, Chongqing, China, 1–3 December 2011; pp. 915–918. [Google Scholar]
- Gonzalez-Huerta, J.; Insfran, E.; Abrahao, S. Models in Software Architecture Derivation and Evaluation: Challenges and Opportunities. In Proceedings of the 2nd International Conference on Model-Driven Engineering and Software Development (MODELSWARD), Lisbon, Portugal, 7–9 January 2014; pp. 12–31. [Google Scholar]


Disclaimer/Publisher’s Note: The statements, opinions and data contained in all publications are solely those of the individual author(s) and contributor(s) and not of MDPI and/or the editor(s). MDPI and/or the editor(s) disclaim responsibility for any injury to people or property resulting from any ideas, methods, instructions or products referred to in the content. |
© 2024 by the authors. Licensee MDPI, Basel, Switzerland. This article is an open access article distributed under the terms and conditions of the Creative Commons Attribution (CC BY) license (https://creativecommons.org/licenses/by/4.0/).