
A Dynamic Framework for Community-Facility Siting with Inter-Community Competition


Abstract
1. Introduction
2. Literature Review
2.1. Facility Location Problems
2.2. Community-Facility Location Problems
2.3. Dynamic Facility Location Problems
2.4. Contributions
- (1)
- This study is the first to introduce the issue of inter-community-facility competition in the community-facility location problem, and it simulates this issue through the implementation of a spatial allocation strategy constraint termed facility-community allocation.
- (2)
- By incorporating a social equity objective into the framework and defining the methods and processes to compute this objective, this study aims to maximize the equity of community facilities’ distribution among different demographic groups.
- (3)
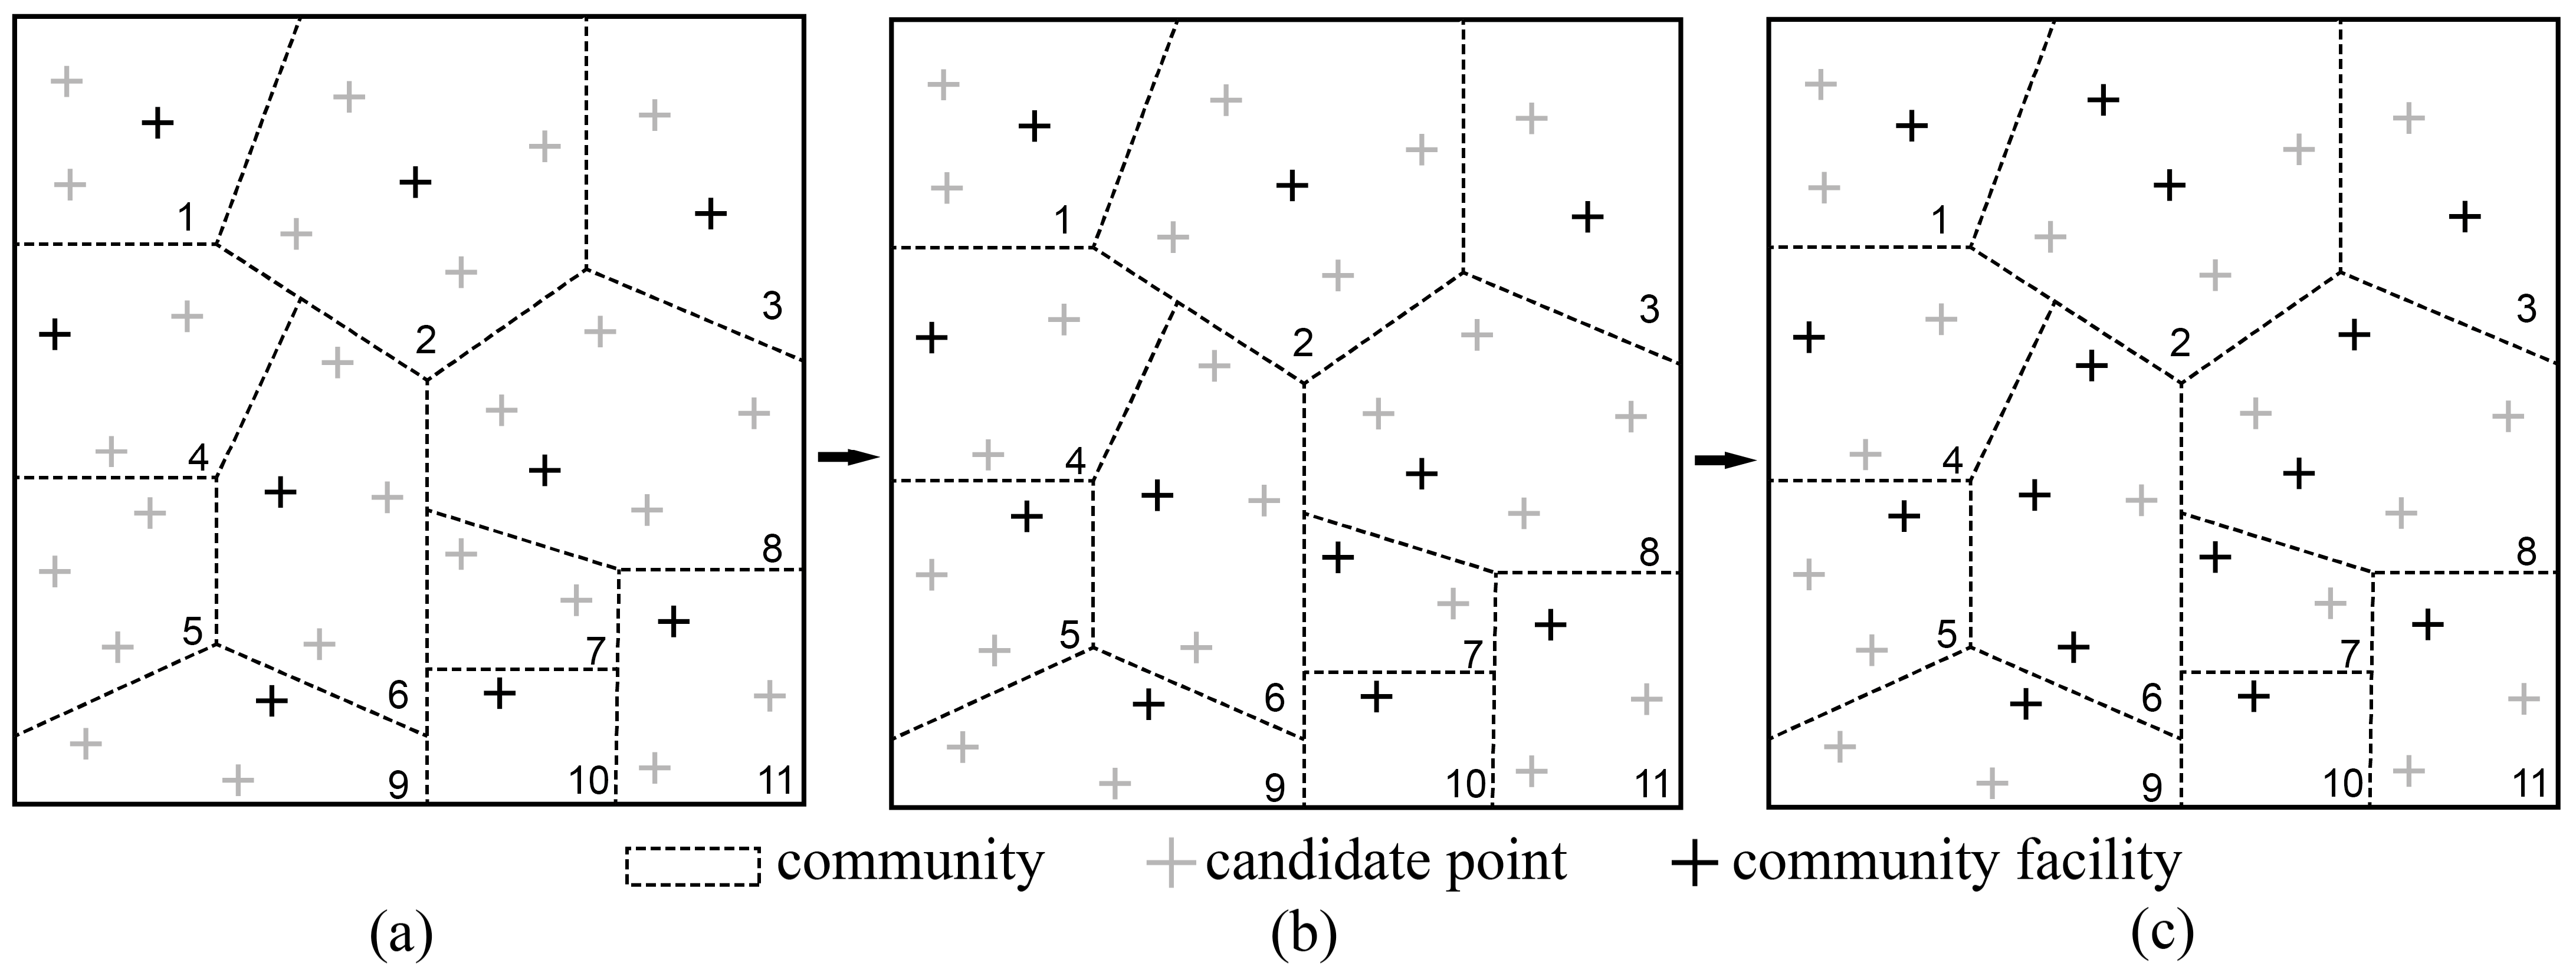
- This study establishes a dual dynamic model in both time and space dimensions (see Section 3.1) to address the incremental demand for community facilities in successive periods of facility allocation, as well as the need to adopt different facility-community allocation strategies as the number of facilities increases.
3. Model Development
3.1. Problem Description
3.2. Mathematical Model
3.2.1. Objective 1: Maximize Service Distribution Equity
3.2.2. Objective 2: Maximize Service Efficiency
3.3. Models for Comparative Analysis
3.4. Optimization Method
4. Empirical Study
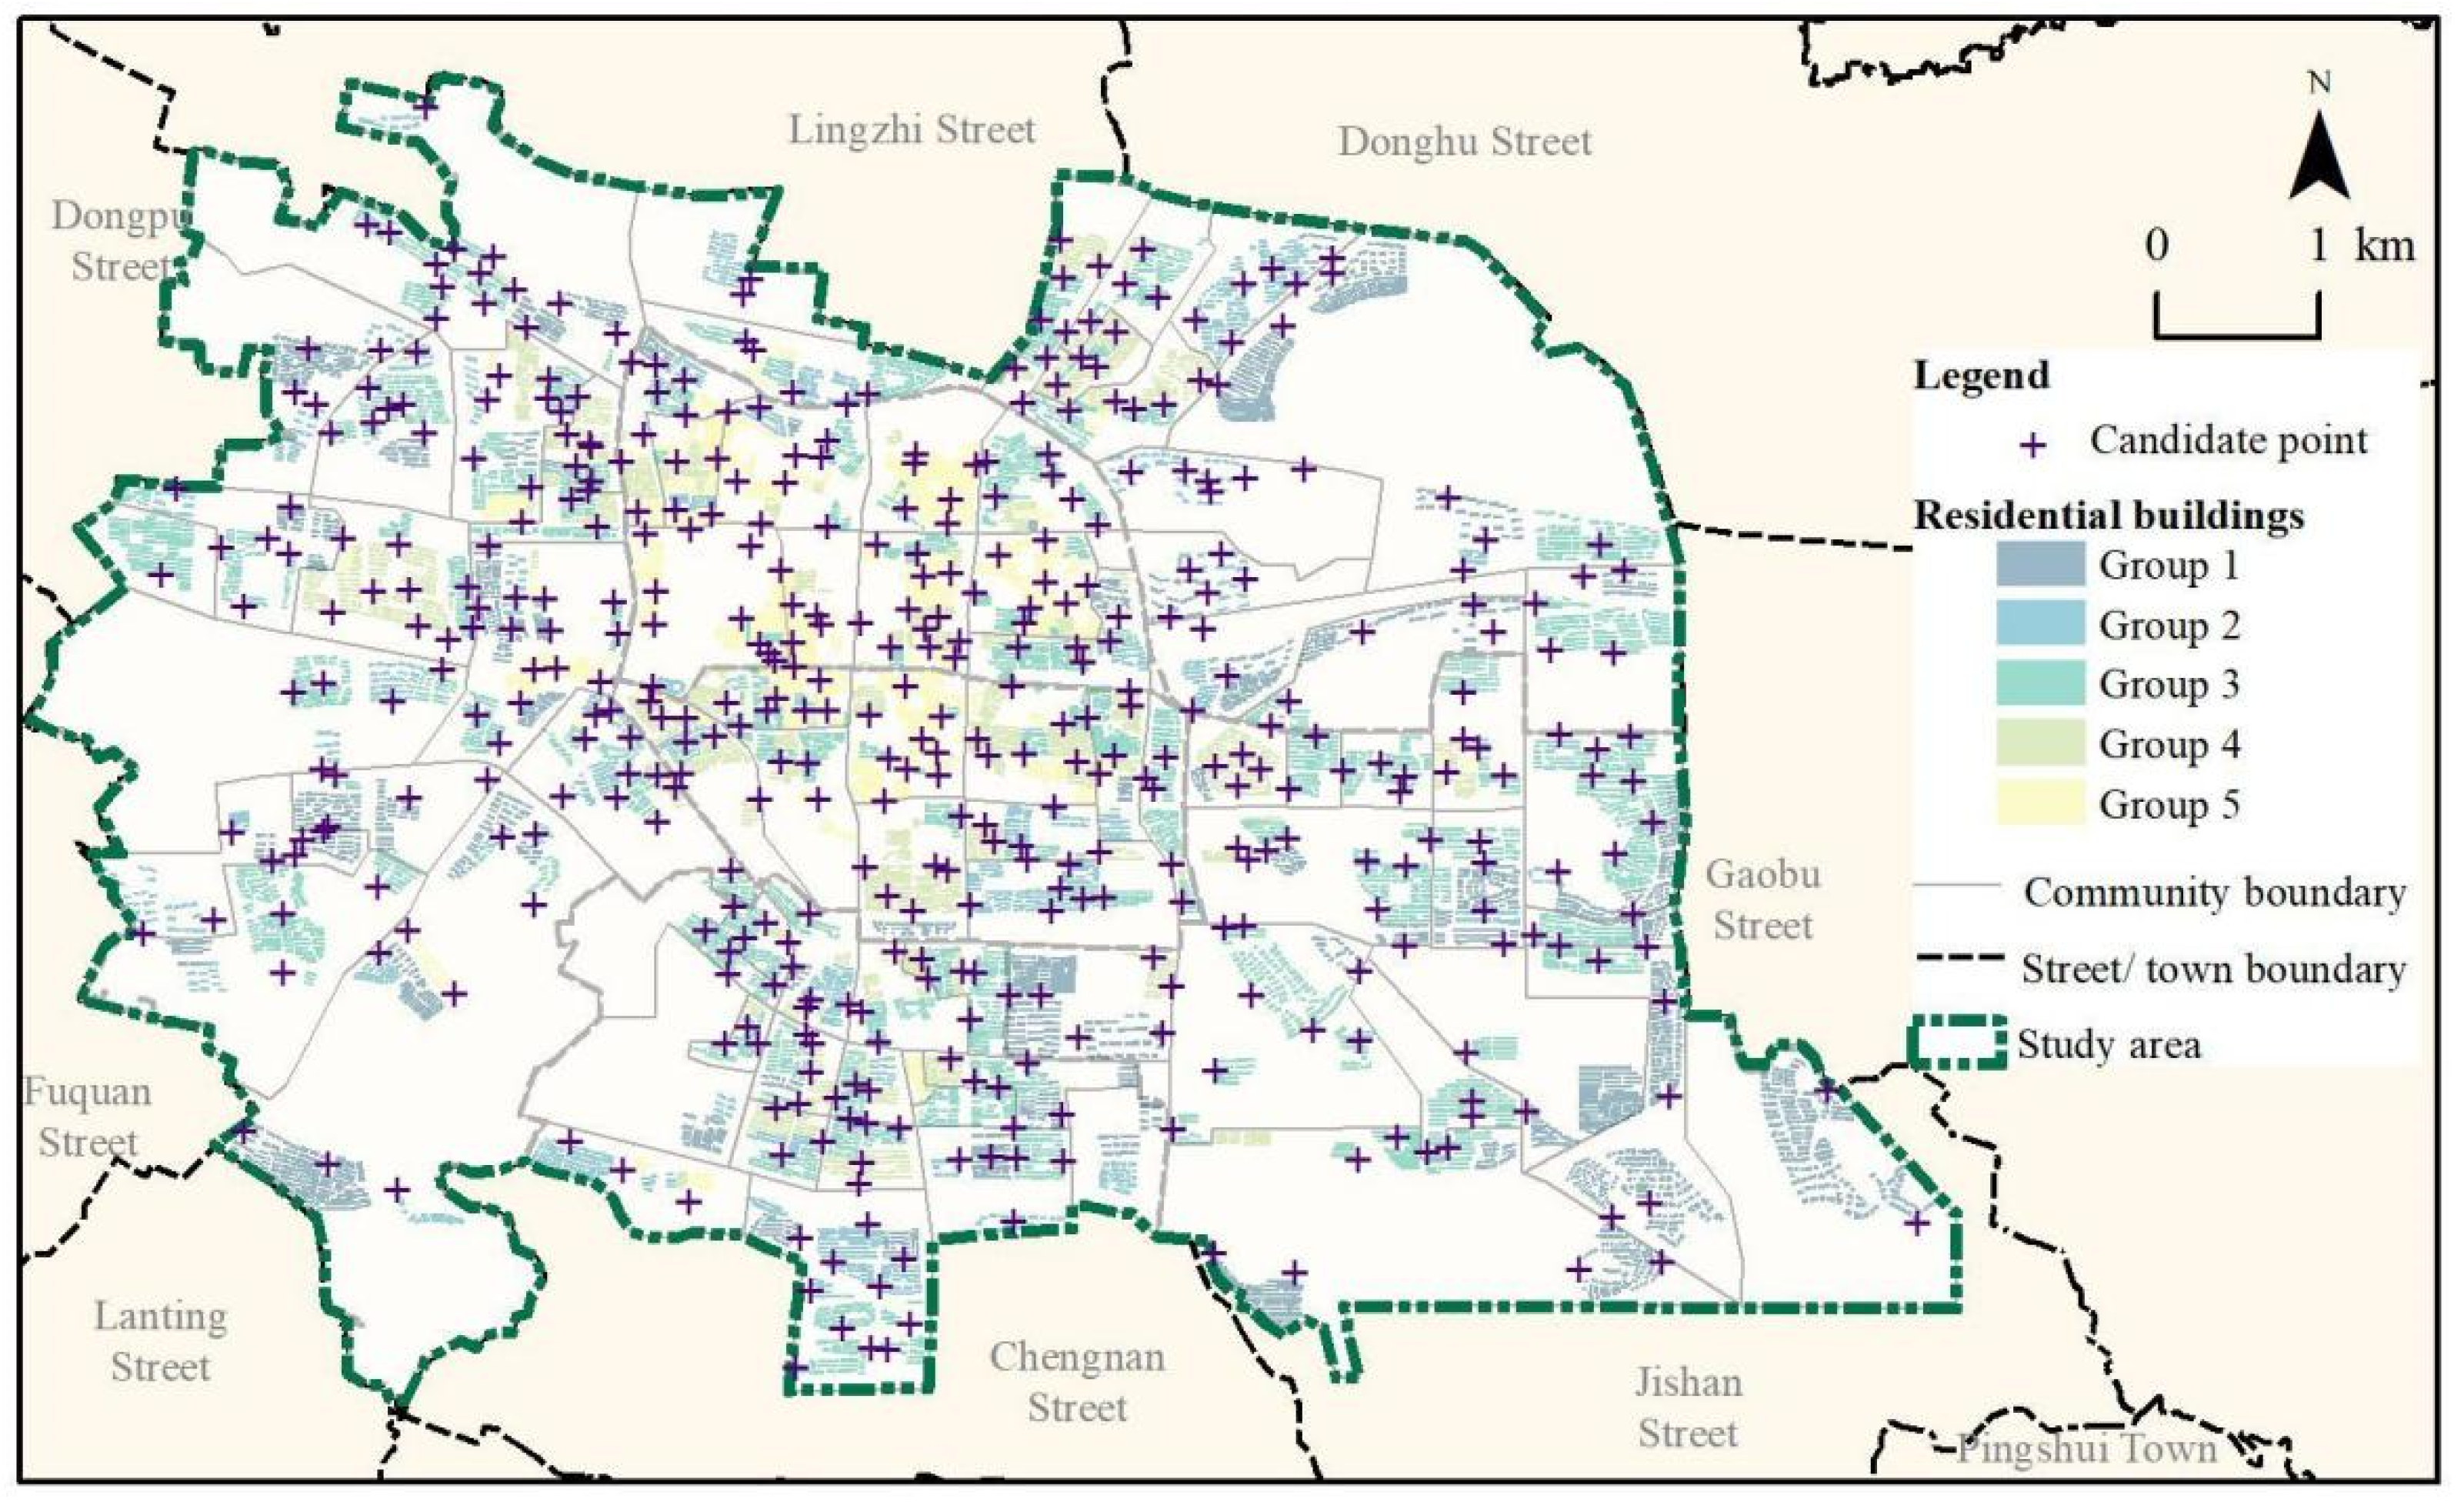
4.1. Study Area
4.2. Data Sourcing and Processing
4.2.1. Demand Points
4.2.2. Candidate Points
4.2.3. Travel Distances and Service Threshold Distance
5. Results
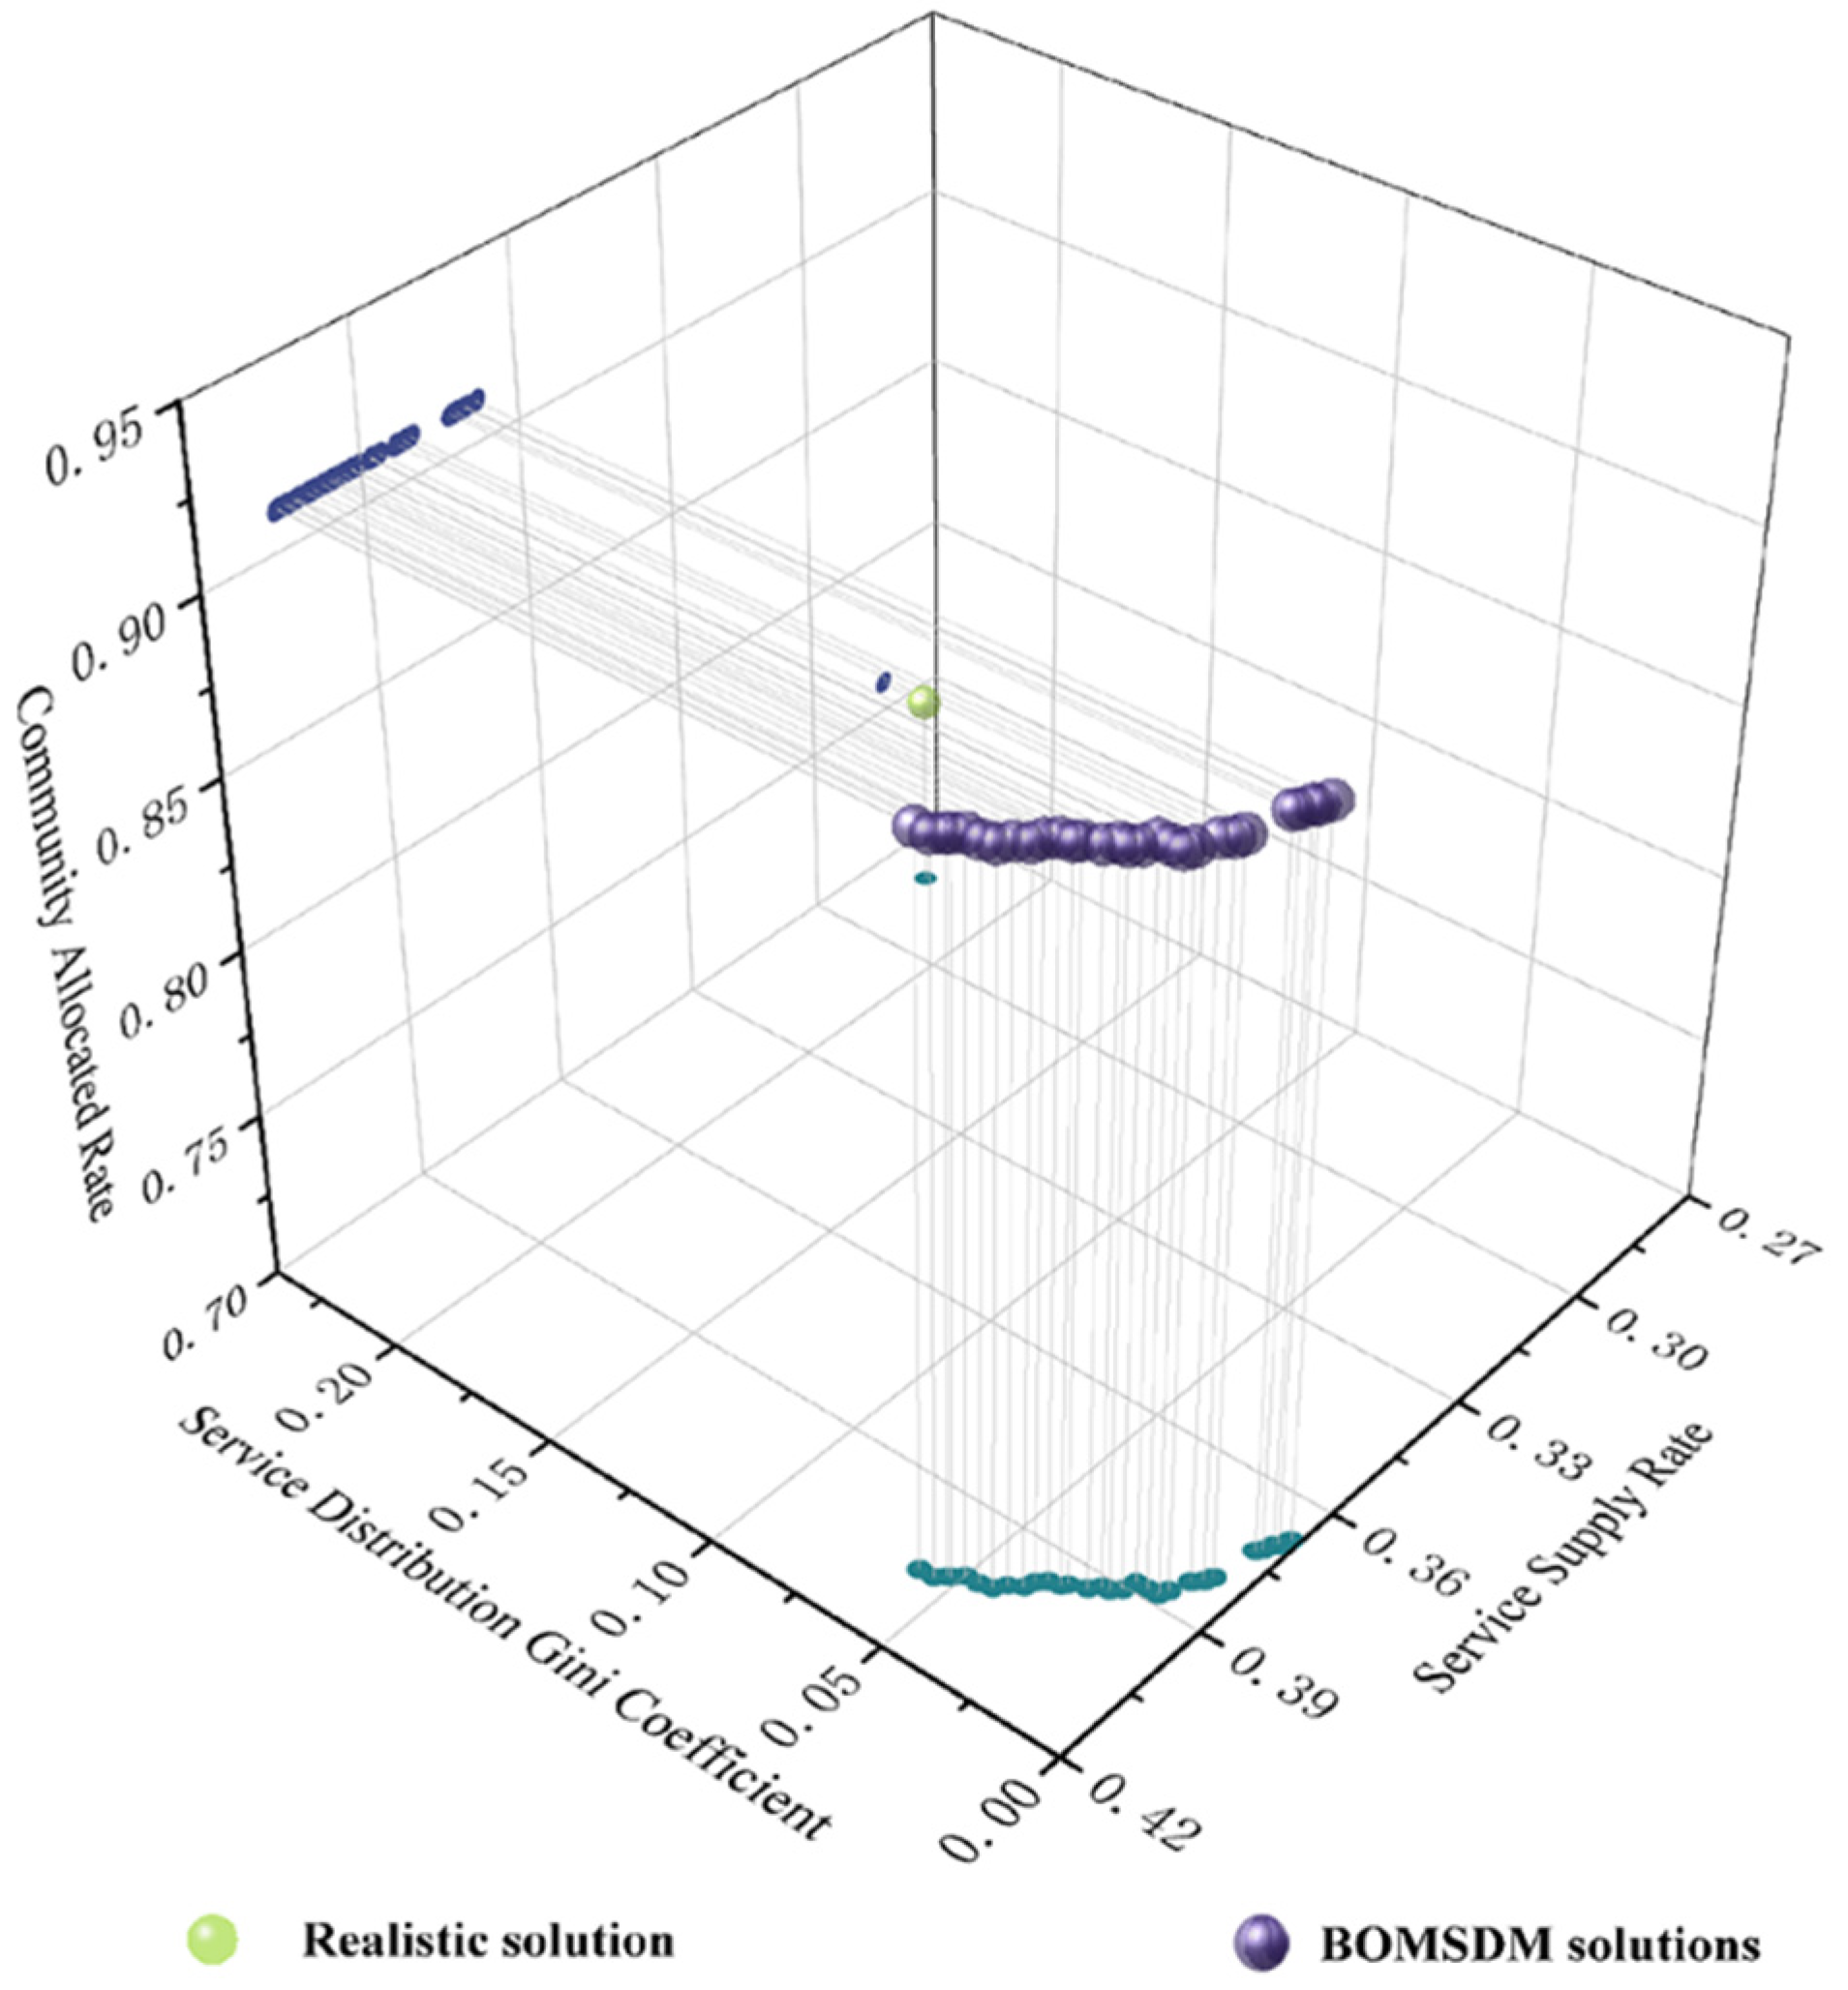
5.1. Comparison Between BOMSDM and the Realistic Solution
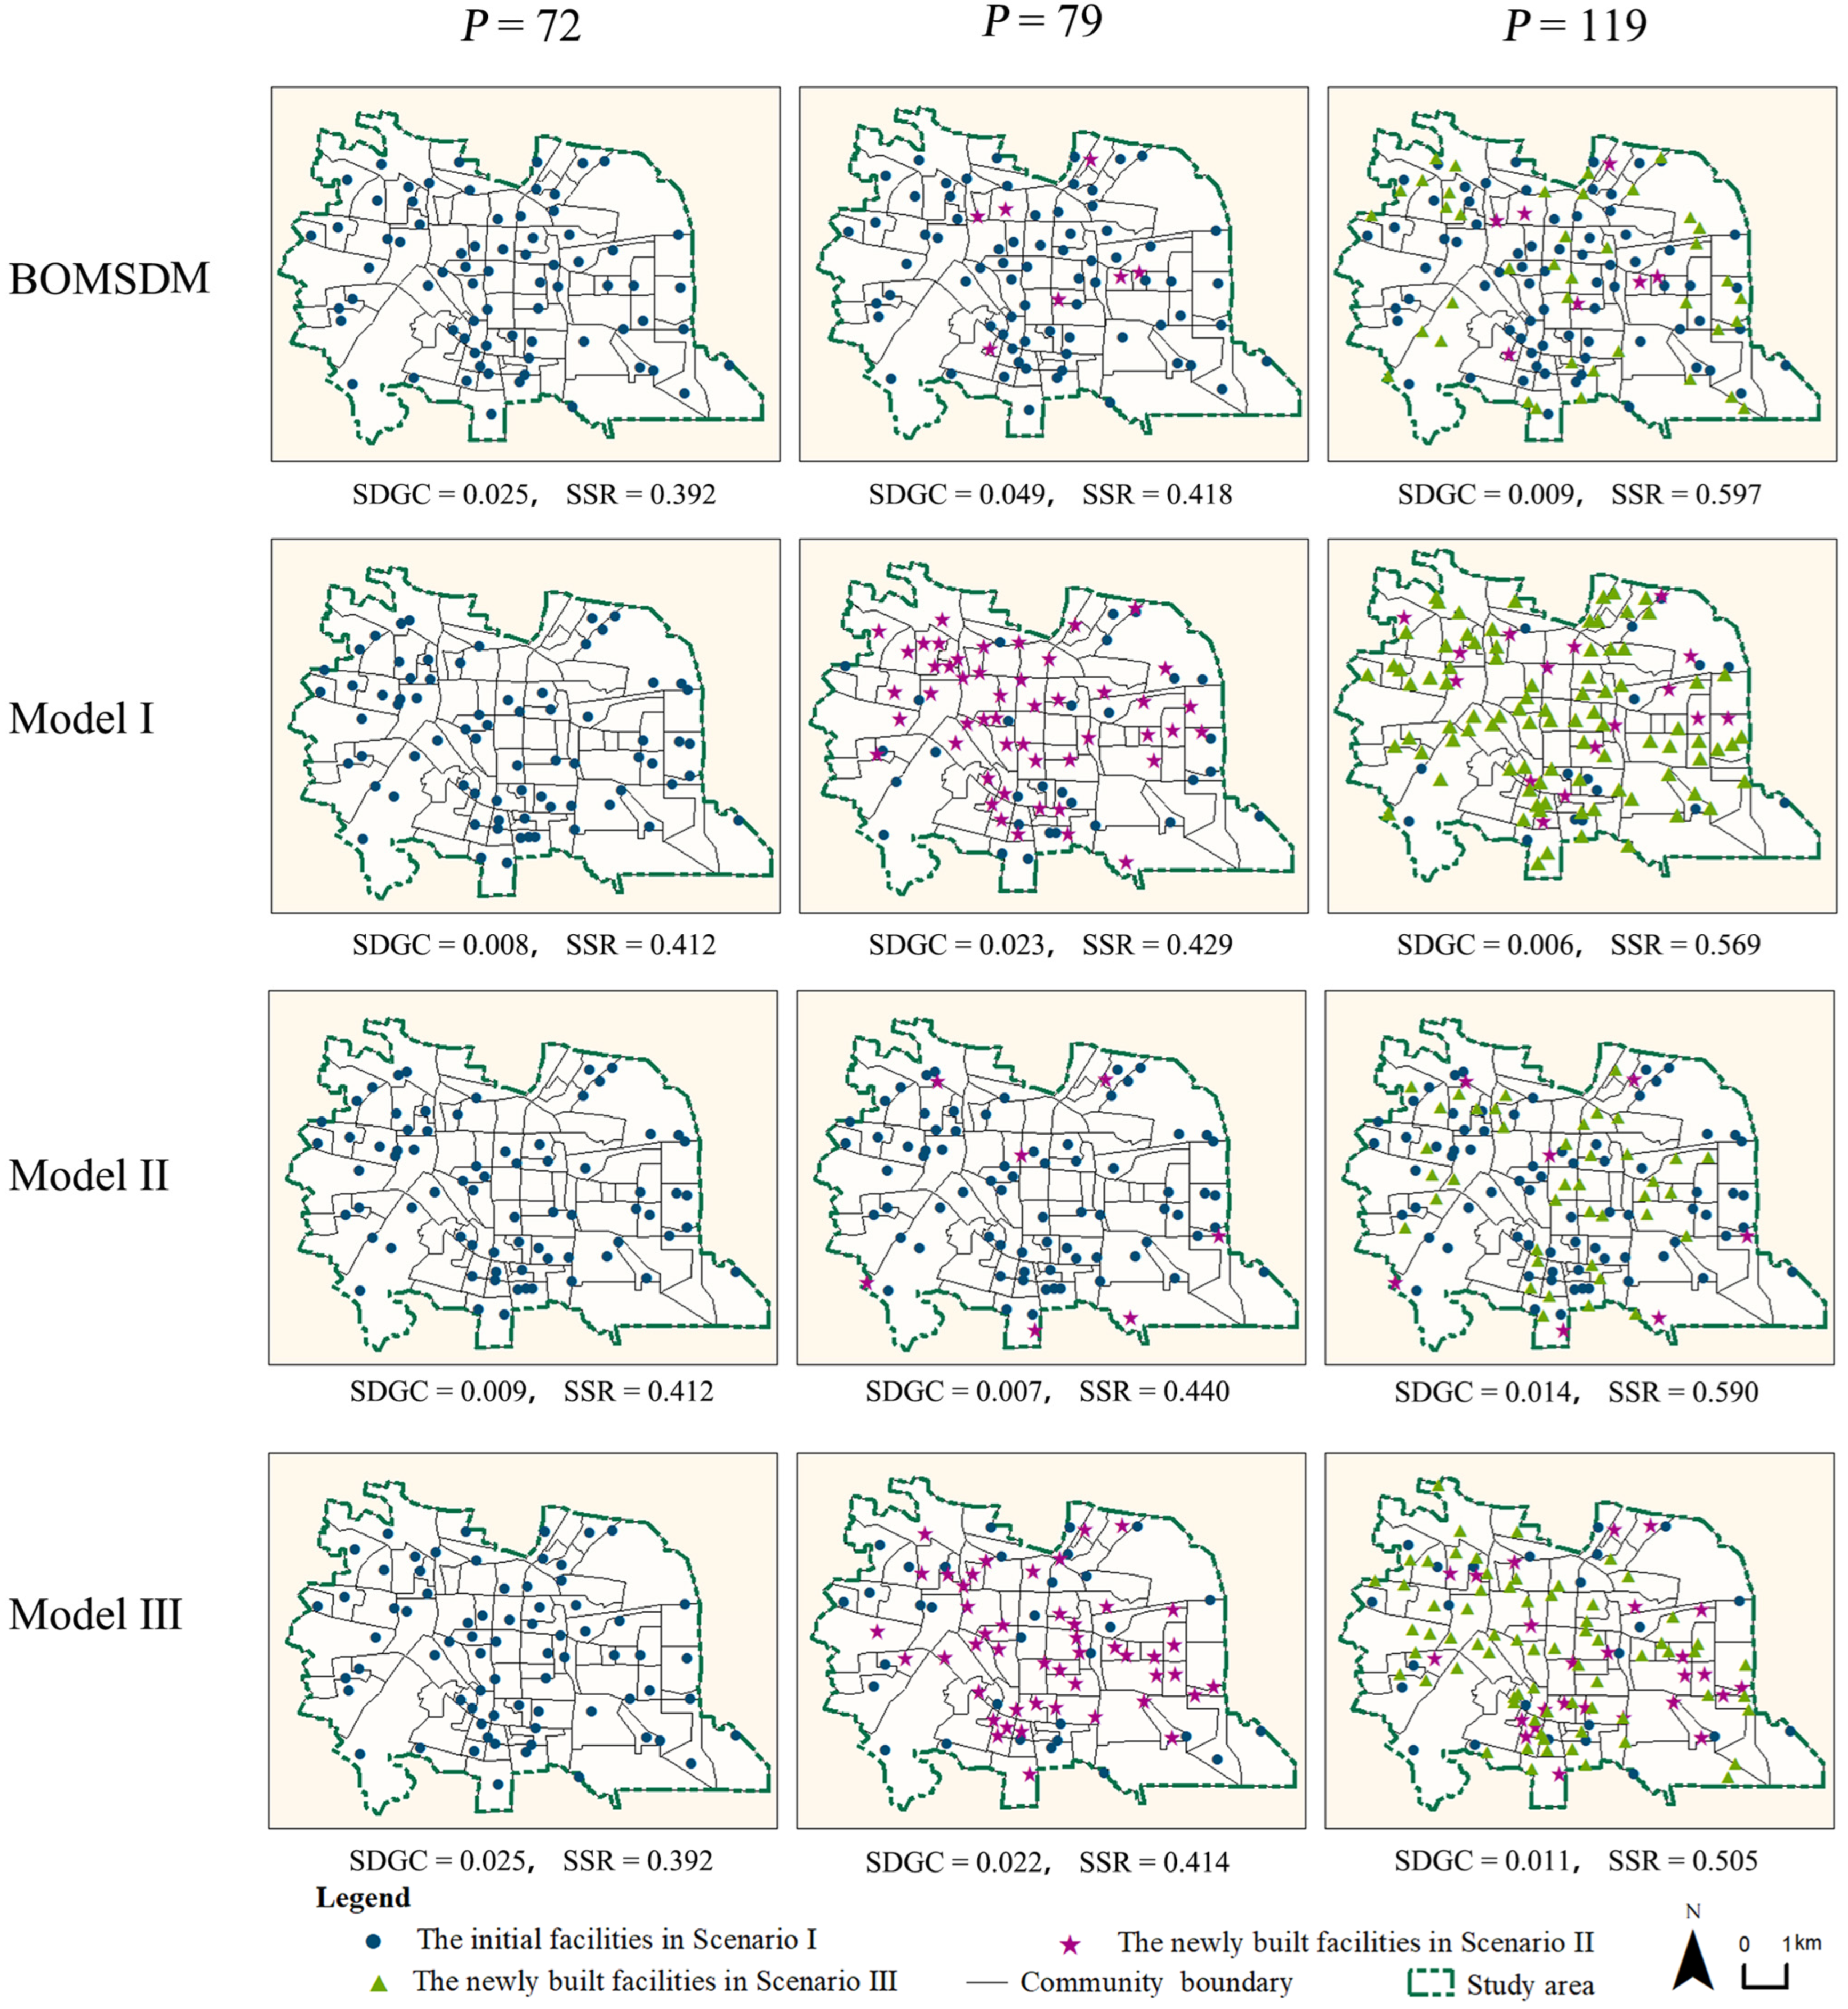
5.2. Results of Different Models
5.3. Sensitivity Analyses
6. Discussion
6.1. The Effectiveness of the BOMSDM
6.2. The Applicability of the BOMSDM
6.3. The Limitations of the BOMSDM
7. Conclusions
Supplementary Materials
Author Contributions
Funding
Institutional Review Board Statement
Informed Consent Statement
Data Availability Statement
Conflicts of Interest
Appendix A
| Algorithm A1: NSGA-II with Constraints |
|
References
- Farahani, R.Z.; SteadieSeifi, M.; Asgari, N. Multiple Criteria Facility Location Problems: A Survey. Appl. Math. Model. 2010, 34, 1689–1709. [Google Scholar] [CrossRef]
- Owen, S.H.; Daskin, M.S. Strategic Facility Location: A Review. Eur. J. Oper. Res. 1998, 111, 423–447. [Google Scholar] [CrossRef]
- New York City Mayor’s Office of Environment Coordination. City Environment Quality Review Technical Manual. Available online: https://www.nyc.gov/site/oec/environmental-quality-review/2014-technical-manual.page (accessed on 25 March 2024).
- The Government of Hong Kong Special Administrative Region Hong Kong Planning Standards and Guides. Available online: https://www.pland.gov.hk/pland_en/tech_doc/hkpsg/index.html (accessed on 25 March 2024).
- McShane, I.; Coffey, B. Rethinking Community Hubs: Community Facilities as Critical Infrastructure. Curr. Opin. Environ. Sustain. 2022, 54, 101149. [Google Scholar] [CrossRef]
- Engels, B. The Historical Rise and Fall of Community Facility Provision Standards in the Metropolitan Planning of Melbourne. Plan. Perspect. 2019, 34, 693–724. [Google Scholar] [CrossRef]
- Zhang, W.; Zhang, X.; Wu, G. The Network Governance of Urban Renewal: A Comparative Analysis of Two Cities in China. Land Use Policy 2021, 106, 105448. [Google Scholar] [CrossRef]
- Chand, S. Decision/Forecast Horizon Results for A Single Facility Dynamic Location/Relocation Problem. Oper. Res. Lett. 1988, 7, 247–251. [Google Scholar] [CrossRef]
- Thanh, P.N.; Bostel, N.; Péton, O. A Dynamic Model for Facility Location in the Design of Complex Supply Chains. Int. J. Prod. Econ. 2008, 113, 678–693. [Google Scholar] [CrossRef]
- Chandra Majhi, R.; Ranjitkar, P.; Sheng, M. Optimal Allocation of Dynamic Wireless Charging Facility for Electric Vehicles. Transp. Res. Part D Transp. Environ. 2022, 111, 103461. [Google Scholar] [CrossRef]
- Silva, A.; Aloise, D.; Coelho, L.C.; Rocha, C. Heuristics for the Dynamic Facility Location Problem with Modular Capacities. Eur. J. Oper. Res. 2021, 290, 435–452. [Google Scholar] [CrossRef]
- Arabani, A.B. Facility Location Dynamics: An Overview of Classifications and Applications. Ind. Eng. 2012, 62, 408–420. [Google Scholar] [CrossRef]
- Cheng, T.; Liu, C.; Yang, H.; Wang, N.; Liu, Y. From Service Capacity to Spatial Equity: Exploring a Multi-Stage Decision-Making Approach for Optimizing Elderly-Care Facility Distribution in the City Centre of Tianjin, China. Sustain. Cities Soc. 2022, 85, 104076. [Google Scholar] [CrossRef]
- Mirdar Harijani, A.; Mansour, S.; Karimi, B.; Lee, C.-G. Multi-Period Sustainable and Integrated Recycling Network for Municipal Solid Waste—A Case Study in Tehran. J. Clean. Prod. 2017, 151, 96–108. [Google Scholar] [CrossRef]
- Bakker, H.; Nickel, S. The Value of the Multi-Period Solution Revisited: When to Model Time in Capacitated Location Problems. Comput. Oper. Res. 2024, 161, 106428. [Google Scholar] [CrossRef]
- Erdoğan, G.; Stylianou, N.; Vasilakis, C. An open source decision support system for facility location analysis. Decis. Support Syst. 2019, 125, 113116. [Google Scholar] [CrossRef]
- Weber, A. Über Den Standort Der Industrien; JCB Mohr: Tübingen, Germany, 1922. [Google Scholar]
- Hakimi, S.L. Optimum Locations of Switching Centers and the Absolute Centers and Medians of a Graph. Oper. Res. 1964, 12, 450–459. [Google Scholar] [CrossRef]
- Hakimi, S.L. Optimum Distribution of Switching Centers in a Communication Network and Some Related Graph Theoretic Problems. Oper. Res. 1965, 13, 462–475. [Google Scholar] [CrossRef]
- Toregas, C.; Swain, R.; ReVelle, C.; Bergman, L. The Location of Emergency Service Facilities. Oper. Res. 1971, 19, 1363–1373. [Google Scholar] [CrossRef]
- Church, R.; Velle, C.R. The Maximal Covering Location Problem. Pap. Reg. Sci. 1974, 32, 101–118. [Google Scholar] [CrossRef]
- Sharma, G.; Patil, G.R. Spatial and Social Inequities for Educational Services Accessibility—A Case Study for Schools in Greater Mumbai. Cities 2022, 122, 103543. [Google Scholar] [CrossRef]
- Snyder, L.V. Facility Location under Uncertainty: A Review. IIE Trans. 2006, 38, 547–564. [Google Scholar] [CrossRef]
- Gülpınar, N.; Pachamanova, D.; Çanakoğlu, E. Robust Strategies for Facility Location under Uncertainty. Eur. J. Oper. Res. 2013, 225, 21–35. [Google Scholar] [CrossRef]
- Manzini, R.; Gebennini, E. Optimization Models for the Dynamic Facility Location and Allocation Problem. Int. J. Prod. Res. 2008, 46, 2061–2086. [Google Scholar] [CrossRef]
- Farahani, R.Z.; Fallah, S.; Ruiz, R.; Hosseini, S.; Asgari, N. OR Models in Urban Service Facility Location: A Critical Review of Applications and Future Developments. Eur. J. Oper. Res. 2019, 276, 1–27. [Google Scholar] [CrossRef]
- Revelle, C.S.; Eiselt, H.A.; Daskin, M.S. A Bibliography for Some Fundamental Problem Categories in Discrete Location Science. Eur. J. Oper. Res. 2008, 184, 817–848. [Google Scholar] [CrossRef]
- Melo, M.T.; Nickel, S.; Saldanha-Da-Gama, F. Facility Location and Supply Chain Management— Review. Eur. J. Oper. Res. 2009, 196, 401–412. [Google Scholar] [CrossRef]
- Turkoglu, D.C.; Genevois, M.E. A Comparative Survey of Service Facility Location Problems. Ann. Oper. Res. 2020, 292, 399–468. [Google Scholar] [CrossRef]
- Rossit, D.G.; Nesmachnow, S. Waste Bins Location Problem: A Review of Recent Advances in the Storage Stage of the Municipal Solid Waste Reverse Logistic Chain. J. Clean. Prod. 2022, 342, 130793. [Google Scholar] [CrossRef]
- Hagimoto, A.; Ishigaki, A.; Takashima, R. Facility Location Selection Considering Distance and Transportation Mode. In Proceedings of the 2022 12th International Congress on Advanced Applied Informatics (IIAI-AAI), Kanazawa, Japan, 2–7 July 2022; pp. 609–614. [Google Scholar]
- Mishra, S.; Sahu, P.K.; Sarkar, A.K.; Mehran, B.; Sharma, S. Geo-Spatial Site Suitability Analysis for Development of Health Care Units in Rural India: Effects on Habitation Accessibility, Facility Utilization and Zonal Equity in Facility Distribution. J. Transp. Geogr. 2019, 78, 135–149. [Google Scholar] [CrossRef]
- Redi, A.A.N.P.; Flame, R.R.F.; Redioka, A.A.N.A.; Winarno, W.; Kurniawan, A.C. Maximum Covering Location Problem to Select Facility Location for Operation Timbang in the City of Iloilo, Philippines. J. Sist. Dan Manaj. Ind. 2022, 6, 135–142. [Google Scholar] [CrossRef]
- Zhang, H.; Zhang, K.; Chen, Y.; Ma, L. Multi-Objective Two-Level Medical Facility Location Problem and Tabu Search Algorithm. Inf. Sci. 2022, 608, 734–756. [Google Scholar] [CrossRef]
- Zhuo, M.; Li, J.; Zhang, R. Redesigning Deployments of Community Hospitals with A Location-Allocation Model. IFAC-Pap. 2022, 55, 1272–1277. [Google Scholar] [CrossRef]
- Li, X.; Pan, Y.; Jiang, S.; Huang, Q.; Chen, Z.; Zhang, M.; Zhang, Z. Locate Vaccination Stations Considering Travel Distance, Operational Cost, and Work Schedule. Omega 2021, 101, 102236. [Google Scholar] [CrossRef]
- Song, L.; Liu, C.; Li, B. Optimal Selection of Location for Community Hospitals a Case of Huilongguan Region in Beijing. In Proceedings of the 2015 IEEE International Conference on Information and Automation, Lijiang, China, 8–10 August 2015; pp. 2803–2806. [Google Scholar]
- Khodaparasti, S.; Maleki, H.R.; Jahedi, S.; Bruni, M.E.; Beraldi, P. Enhancing Community Based Health Programs in Iran: A Multi-Objective Location-Allocation Model. Health Care Manag. Sci. 2017, 20, 485–499. [Google Scholar] [CrossRef]
- Tao, Z.; Cheng, Y.; Dai, T.; Rosenberg, M.W. Spatial Optimization of Residential Care Facility Locations in Beijing, China: Maximum Equity in Accessibility. Int. J. Health Geogr. 2014, 13, 33. [Google Scholar] [CrossRef]
- Jin, J.G.; Shen, Y.; Hu, H.; Fan, Y.; Yu, M. Optimizing Underground Shelter Location and Mass Pedestrian Evacuation in Urban Community Areas: A Case Study of Shanghai. Transp. Res. Part A Policy Pract. 2021, 149, 124–138. [Google Scholar] [CrossRef]
- Lee, Y.-H.; Keum, H.-J.; Han, K.-Y.; Hong, W.-H. A Hierarchical Flood Shelter Location Model for Walking Evacuation Planning. Environ. Hazards 2021, 20, 432–455. [Google Scholar] [CrossRef]
- Rossit, D.G.; Toutouh, J.; Nesmachnow, S. Exact and Heuristic Approaches for Multi-Objective Garbage Accumulation Points Location in Real Scenarios. Waste Manag. 2020, 105, 467–481. [Google Scholar] [CrossRef]
- Zhuo, Q.; Yan, W. Optimizing the Number and Location of Household Waste Collection Sites by Multi-Maximal Covering Location Model: An Empirical Study in Minamata City, Kumamoto Prefecture, Japan. J. Clean. Prod. 2022, 379, 134644. [Google Scholar] [CrossRef]
- Ma, Y.; Zou, G.; Shin, J.; Kang, Y.; Gao, S.; Siu, K.W.M.; Zhang, S. Locating Community-Based Comprehensive Service Facilities for Older Adults Using the GIS-NEMA Method in Harbin, China. J. Urban Plan. Dev. 2021, 147, 05021010. [Google Scholar] [CrossRef]
- Faghihinejad, F.; Zoghifard, M.; Amiri, A.M.; Monajem, S. Evaluating Social and Spatial Equity in Public Transport: A Case Study. Transp. Lett. 2023, 15, 1420–1429. [Google Scholar] [CrossRef]
- Ma, M. Challenges in Current Construction and Demolition Waste Recycling: A China Study. Waste Manag. 2020, 118, 610–625. [Google Scholar] [CrossRef] [PubMed]
- Sonmez, A.D.; Lim, G.J. A Decomposition Approach for Facility Location and Relocation Problem with Uncertain Number of Future Facilities. Eur. J. Oper. Res. 2012, 218, 327–338. [Google Scholar] [CrossRef]
- Cheng, C. Distributionally Robust Facility Location with Uncertain Facility Capacity and Customer Demand. Omega 2024, 122, 102959. [Google Scholar] [CrossRef]
- Nasrabadi, A.M. Considering Short-Term and Long-Term Uncertainties in Location and Capacity Planning of Public Healthcare Facilities. Eur. J. Oper. Res. 2020, 281, 152–173. [Google Scholar] [CrossRef]
- Cavdur, F.; Kose-Kucuk, M.; Sebatli, A. Allocation of Temporary Disaster Response Facilities under Demand Uncertainty: An Earthquake Case Study. Int. J. Disaster Risk Reduct. 2016, 19, 159–166. [Google Scholar] [CrossRef]
- Li, D.; Xiong, Q.; Huang, G.; Du, B.; Feng, H. How to Share Benefits of Old Community Renewal Project in China? An Improved Shapley Value Approach. Habitat Int. 2022, 126, 102611. [Google Scholar] [CrossRef]
- Wesolowsky, G.O. Dynamic Facility Location. Manag. Sci. 1973, 19, 1241–1248. [Google Scholar] [CrossRef]
- Current, J.; Ratick, S.; ReVelle, C. Dynamic Facility Location When the Total Number of Facilities Is Uncertain: A Decision Analysis Approach. Eur. J. Oper. Res. 1998, 110, 597–609. [Google Scholar] [CrossRef]
- Ashfari, H. Facility Location Decisions within Integrated Forward/Reverse Logistics under Uncertainty. Procedia CIRP 2014, 17, 606–610. [Google Scholar] [CrossRef]
- Maliki, F. A Multi-Objective Optimization Model for a Multi-Period Mobile Facility Location Problem with Environmental and Disruption Considerations. In Annals of Operations Research; Springer: Berlin/Heidelberg, Germany, 2012; pp. 1–26. [Google Scholar]
- Albareda-Sambola, M.; Fernández, E.; Hinojosa, Y.; Puerto, J. The Multi-Period Incremental Service Facility Location Problem. Comput. Oper. Res. 2009, 36, 1356–1375. [Google Scholar] [CrossRef]
- Arulselvan, A.; Maurer, O.; Skutella, M. An Incremental Algorithm for the Uncapacitated Facility Location Problem. Networks 2015, 65, 306–311. [Google Scholar] [CrossRef]
- Shi, J.; Chen, W.; Zhou, Z.; Zhang, G. A Bi-Objective Multi-Period Facility Location Problem for Household e-Waste Collection. Int. J. Prod. Res. 2020, 58, 526–545. [Google Scholar] [CrossRef]
- Kchaou Boujelben, M.; Boulaksil, Y. Modeling International Facility Location under Uncertainty: A Review, Analysis, and Insights. IISE Trans. 2018, 50, 535–551. [Google Scholar] [CrossRef]
- Pérez-Gosende, P.; Mula, J.; Díaz-Madroñero, M. Overview of Dynamic Facility Layout Planning as a Sustainability Strategy. Sustainability 2020, 12, 8277. [Google Scholar] [CrossRef]
- De Oliveira, P.B.; De Camargo, R.S.; De Miranda Júnior, G.; Martins, A.X. A computational study of a decomposition approach for the dynamic two-level uncapacitated facility location problem with single and multiple allocation. Comput. Ind. Eng. 2021, 151, 106964. [Google Scholar] [CrossRef]
- Fadda, E.; Manerba, D.; Tadei, R. How to Locate Services Optimizing Redundancy: A Comparative Analysis of K -Covering Facility Location Models. Socio-Econ. Plan. Sci. 2024, 94, 101938. [Google Scholar] [CrossRef]
- Monfared, M.S.; Monabbati, S.E.; Kafshgar, A.R. Pareto-Optimal Equilibrium Points in Non-Cooperative Multi-Objective Optimization Problems. Expert Syst. Appl. 2021, 178, 114995. [Google Scholar] [CrossRef]
- Wang, Z.; Rangaiah, G.P. Application and Analysis of Methods for Selecting an Optimal Solution from the Pareto-Optimal Front Obtained by Multiobjective Optimization. Ind. Eng. Chem. Res. 2017, 56, 560–574. [Google Scholar] [CrossRef]
- Gini, C. Measurement of Inequality of Incomes. Econ. J. 1921, 31, 124. [Google Scholar] [CrossRef]
- Rong, P.; Zheng, Z.; Kwan, M.-P.; Qin, Y. Evaluation of the Spatial Equity of Medical Facilities Based on Improved Potential Model and Map Service API: A Case Study in Zhengzhou, China. Appl. Geogr. 2020, 119, 102192. [Google Scholar] [CrossRef]
- Correa-Parra, J.; Vergara-Perucich, J.F.; Aguirre-Nuñez, C. Water Privatization and Inequality: Gini Coefficient for Water Resources in Chile. Water 2020, 12, 3369. [Google Scholar] [CrossRef]
- Dai, D. Racial/Ethnic and Socioeconomic Disparities in Urban Green Space Accessibility: Where to Intervene? Landsc. Urban Plan. 2011, 102, 234–244. [Google Scholar] [CrossRef]
- Hu, S.; Song, W.; Li, C.; Lu, J. A Multi-Mode Gaussian-Based Two-Step Floating Catchment Area Method for Measuring Accessibility of Urban Parks. Cities 2020, 105, 102815. [Google Scholar] [CrossRef]
- Deb, K.; Pratap, A.; Agarwal, S.; Meyarivan, T. A Fast and Elitist Multiobjective Genetic Algorithm: NSGA-II. IEEE Trans. Evol. Comput. 2002, 6, 182–197. [Google Scholar] [CrossRef]
- Turan, H.H.; Kahagalage, S.D.; Jalalvand, F.; El Sawah, S. A Multi-Objective Simulation–Optimization for a Joint Problem of Strategic Facility Location, Workforce Planning, and Capacity Allocation: A Case Study in the Royal Australian Navy. Expert Syst. Appl. 2021, 186, 115751. [Google Scholar] [CrossRef]
- Ma, H.; Zhang, Y.; Sun, S.; Liu, T.; Shan, Y. A Comprehensive Survey on NSGA-II for Multi-Objective Optimization and Applications. Artif. Intell. Rev. 2023, 56, 15217–15270. [Google Scholar] [CrossRef]
- Murugan, P.; Kannan, S.; Baskar, S. NSGA-II Algorithm for Multi-Objective Generation Expansion Planning Problem. Electr. Power Syst. Res. 2009, 79, 622–628. [Google Scholar] [CrossRef]
- Zhang, L.; Zhu, L.; Shi, D.; Hui, E.C. Urban Residential Space Differentiation and the Influence of Accessibility in Hangzhou, China. Habitat Int. 2022, 124, 102556. [Google Scholar] [CrossRef]
- Zhejiang Daily. The First Anniversary of Shaoxing’s Recycling of Renewable Resources: A Little “Sweet” a Little “Difficult”. Available online: https://baijiahao.baidu.com/s?id=1652425522227288025&wfr=spider&for=pc (accessed on 4 April 2024).
- Chung, H. Neighbourhood Redevelopment and the Making of a Housing Middle Class: Can Gentrification Explain China’s Spatial and Social Changes? GeoJournal 2021, 86, 1375–1388. [Google Scholar] [CrossRef]
- Song, W.; Huang, Q.; Gu, Y.; He, G. Unraveling the Multi-Scalar Residential Segregation and Socio-Spatial Differentiation in China: A Comparative Study Based on Nanjing and Hangzhou. J. Geogr. Sci. 2021, 31, 1757–1774. [Google Scholar] [CrossRef]
- Mandell, M.B. Modelling Effectiveness-Equity Trade-Offs in Public Service Delivery Systems. Manag. Sci. 1991, 37, 467–482. [Google Scholar] [CrossRef]
- McAllister, D.M. Equity and Efficiency in Public Facility Location. Geogr. Anal. 1976, 8, 47–63. [Google Scholar] [CrossRef]
- Tao, Z.; Zhao, M. Planning for Equal Transit-Based Accessibility of Healthcare Facilities: A Case Study of Shenzhen, China. Socio-Econ. Plan. Sci. 2023, 88, 101666. [Google Scholar] [CrossRef]
- Mohsenizadeh, M.; Tural, M.K.; Kentel, E. Municipal Solid Waste Management with Cost Minimization and Emission Control Objectives: A Case Study of Ankara. Sustain. Cities Soc. 2020, 52, 101807. [Google Scholar] [CrossRef]
- Slavík, J.; Dolejš, M.; Rybová, K. Mixed-Method Approach Incorporating Geographic Information System (GIS) Tools for Optimizing Collection Costs and Convenience of the Biowaste Separate Collection. Waste Manag. 2021, 134, 177–186. [Google Scholar] [CrossRef]
- Correia, I.; Melo, T. Integrated Facility Location and Capacity Planning under Uncertainty. Comput. Appl. Math. 2021, 40, 175. [Google Scholar] [CrossRef]
- Shavarani, S.M. Multi-Level Facility Location-Allocation Problem for Post-Disaster Humanitarian Relief Distribution: A Case Study. J. Humanit. Logist. Supply Chain Manag. 2019, 9, 70–81. [Google Scholar] [CrossRef]


| Study | Facility Type | MS | BO/MO | Objectives | Constraints |
|---|---|---|---|---|---|
| Mishra et al., 2019 [32] | CMHF | √ | accessibility, covering | N | |
| Redi et al., 2022 [33] | CMHF | covering | number of facilities | ||
| Zhang et al., 2022 [34] | CMHF | √ | accessibility, covering, cost | demand point-facility assignment, facility capacity, number of facilities | |
| Zhuo et al., 2022 [35] | CMHF | √ | travel distance | number of facilities, demand point-facility assignment | |
| Li et al., 2021 [36] | CMHF | √ | travel distance, cost | facility capacity, conditions of facility opening | |
| Song et al., 2015 [37] | CMHF | service supply amount | demand point-facility assignment, facility capacity, number of facilities | ||
| Khodaparasti et al., 2017 [38] | CMHF | √ | √ | distance between facilities, total travel time, input–output ratio | threshold distance, facility capacity, distance between facilities, number of facilities |
| Tao et al., 2014 [39] | CMHF | accessibility | N | ||
| Jin et al., 2021 [40] | CEF | √ | service supply amount, travel distance | facility capacity, number of facilities | |
| Lee et al., 2021 [41] | CEF | √ | accessibility, safety, travel distance | threshold distance, environmental element | |
| Rossit et al., 2020 [42] | WCF | √ | travel distance, cost, consecutive visit frequencies | facility capacity, demand point-facility assignment, threshold distance | |
| Zhuo & Yan, 2022 [43] | WCF | covering | number of facilities, demand point-facility assignment, facility capacity | ||
| Ma et al., 2021 [44] | CGF | √ | √ | covering, accessibility | N |
| This study | CGF | √ | √ | service distribution Gini coefficient, service supply rate | facility number, facility-community allocation strategies, facility increment strategies |
| Model | Facility-Community Allocation Strategies | Incremental Strategy | Subject to the Constraints Set Given by: |
|---|---|---|---|
| BOMSDM | Dynamic average and random allocation | √ | Equations (6)–(13) |
| Model I | Random allocation | × | Equations (6), (12) and (13) |
| Model II | Random allocation | √ | Equations (6) and (10)–(13) |
| Model III | Average allocation | × | Equations (6)–(8) and (11)–(14) |
| Scenario | Model | Iteration Number | Service Distribution Gini Coefficient | Service Supply Rate | Community Allocation Rate | ||||||
|---|---|---|---|---|---|---|---|---|---|---|---|
| Mean | Median | Minimum | Mean | Median | Maximum | Mean | Median | Maximum | |||
| BOMSDM/ Model III | 500 | 0.027 | 0.025 | 0.002 | 0.390 | 0.392 | 0.405 | 0.911 | 0.911 | 0.911 | |
| Model I/ Model II | 1000 | 0.008 | 0.009 | 0.001 | 0.412 | 0.412 | 0.415 | 0.609 | 0.614 | 0.620 | |
| BOMSDM | 300 | 0.047 | 0.049 | 0.036 | 0.418 | 0.418 | 0.419 | 1.000 | 1.000 | 1.000 | |
| Model I | 1500 | 0.020 | 0.023 | 0.001 | 0.428 | 0.429 | 0.432 | 0.722 | 0.722 | 0.734 | |
| Model II | 500 | 0.008 | 0.007 | 0.001 | 0.438 | 0.440 | 0.448 | 0.635 | 0.633 | 0.671 | |
| Model III | 1000 | 0.022 | 0.024 | 0.013 | 0.412 | 0.416 | 0.426 | 1.000 | 1.000 | 1.000 | |
| BOMSDM | 1000 | 0.009 | 0.010 | 0.000 | 0.591 | 0.595 | 0.597 | 1.000 | 1.000 | 1.000 | |
| Model I | 1500 | 0.006 | 0.006 | 0.000 | 0.562 | 0.567 | 0.571 | 0.822 | 0.823 | 0.835 | |
| Model II | 1000 | 0.016 | 0.014 | 0.002 | 0.590 | 0.590 | 0.595 | 0.807 | 0.810 | 0.823 | |
| Model III | 1500 | 0.012 | 0.011 | 0.002 | 0.503 | 0.505 | 0.510 | 1.000 | 1.000 | 1.000 | |
Disclaimer/Publisher’s Note: The statements, opinions and data contained in all publications are solely those of the individual author(s) and contributor(s) and not of MDPI and/or the editor(s). MDPI and/or the editor(s) disclaim responsibility for any injury to people or property resulting from any ideas, methods, instructions or products referred to in the content. |
© 2025 by the authors. Licensee MDPI, Basel, Switzerland. This article is an open access article distributed under the terms and conditions of the Creative Commons Attribution (CC BY) license (https://creativecommons.org/licenses/by/4.0/).
Share and Cite
Zhu, S.; Han, H.; Dai, A. A Dynamic Framework for Community-Facility Siting with Inter-Community Competition. Appl. Sci. 2025, 15, 402. https://doi.org/10.3390/app15010402
Zhu S, Han H, Dai A. A Dynamic Framework for Community-Facility Siting with Inter-Community Competition. Applied Sciences. 2025; 15(1):402. https://doi.org/10.3390/app15010402
Chicago/Turabian StyleZhu, Sisi, Haoying Han, and Anran Dai. 2025. "A Dynamic Framework for Community-Facility Siting with Inter-Community Competition" Applied Sciences 15, no. 1: 402. https://doi.org/10.3390/app15010402
APA StyleZhu, S., Han, H., & Dai, A. (2025). A Dynamic Framework for Community-Facility Siting with Inter-Community Competition. Applied Sciences, 15(1), 402. https://doi.org/10.3390/app15010402