1. Introduction
Efforts to detect unethical behaviors in online distance education exam environments are of great importance in terms of protecting the academic integrity of learners and the reputation of the relevant institutions. Behaviors such as cheating behaviors, plagiarism, plagiarism, dishonesty, lying, making excuses, etc. are contrary to the achievements targeted in the education and training processes and constitute a major problem for the relevant institutions. Analyzing online exams with artificial intelligence (AI) methods can reveal the academic honesty of learners studying in relevant educational institutions and provide a forward-looking prediction for institution administrators and educators.
Machine learning (ML), which aims to develop and evaluate models, is a science that extracts meaningful information from large amounts of data using algorithms and as a data analysis technique [
1]. Machine learning and deep learning (DL) are subsets of AI that reveal the perfect change in object detection and classification in video or images [
2]. By automatically analyzing this data, AI algorithms can identify complex patterns that may be difficult for humans to detect. ML models have undoubtedly made remarkable advances in various fields, demonstrating their ability to make accurate predictions and automate decision-making processes [
3]. ML offers flexible models for identifying patterns and relationships among complex distributions and making meaningful decisions from data. It can be categorized into supervised ML, which develops predictive models given training data whose answers are known in advance, and unsupervised ML, which aims to group observation data or create simplified representations of the main structures of data [
4]. It is the science that gives the ability of classification, prediction, and pattern recognition based on models emerging from existing data and without any programming; it is defined as the potential to select effective features on data. As a data analysis method, it produces appropriate outputs from data-centered modeling algorithms [
1].
DL is a broader term used to describe ML techniques based on multilayer neural networks (deep architectures). DL can be unsupervised, semi-supervised, or supervised [
5]. DL, a branch of AI and ML, is currently in the process of regaining its relevance of the last decade, with significant success in areas such as banking, transportation, life science, and entertainment [
6]. The use of useful learning architectures depends on increasing training data [
7]. For larger neural networks, their performance continues to improve as the algorithms are trained on larger amounts of data. Most other ML methods have reached their performance limit, as using larger amounts of data for training does not increase the speed of operation. DL also allows for scaling [
8]. DL provides methods that reinforce the learning of data representations across multiple layers of computational models. These methods have significantly advanced the state of the art in many different areas, such as object detection, visual object recognition, speech recognition, inference from data, and many more. DL discovers complex structures in large datasets by using the back-propagation algorithm and changes in the representation of internal parameters in the previous layer [
9]. DL offers an effective structure on its own and incorporates classification into the architecture. It also offers more realistic approaches to real-world problems by providing a non-linear structure to the training data with the power of activation functions [
10].
When the literature is examined, DL applications have been examined mostly in the fields of health and engineering. It has been seen that image separation and classification are widely used in the field of engineering. In the field of health, diagnosis is based on image, classification, and prediction. However, DL is a promising approach with many potential applications in industry and manufacturing [
11]. In recent years, the adoption of learner-centered approaches by educational institutions, changes in access to information, taking into account the interests and needs of individuals, social disasters such as COVID-19, and the increase in technological changes and transformations day by day have led to changes in the form of education, and as a result, distance education methods have been needed. Online exams allow learners to read questions on a technological screen, select and change answers with a mouse or keyboard, submit the exam at the end of the exam, and evaluate the exam results simultaneously [
12].
In the continuation of this section of the study, studies on the prediction and classification of online exam data using DL and ML algorithms in the literature are included.
In the literature, many deep learning and machine learning algorithms have been proposed to analyze online exam behaviors using online exam data, speech, images, mouse movements, etc. Good performances have been found from the proposed deep learning and machine learning models in studies that take into account mouse interaction such as clicking, scrolling, and keystrokes [
13,
14,
15]. Word studies such as bag of words and stop words have been analyzed using Ngrams, stemming algorithms, and natural language processing with good results in applications [
16,
17]. In studies aiming to detect cheating behavior by applying deep learning and machine learning models to students’ online exam activities through camera and speech-based tools, good success has been achieved with the proposed models [
18,
19,
20,
21]. Ozdamli et al. [
22,
23] designed a system that will support teachers in monitoring and managing student behavior in online exams by using deep learning algorithms and computer vision algorithms. During the development phase of the system, feedback was provided through semi-structured interviews, but deep learning algorithms were applied to the data obtained from the images, and although high accuracies were obtained, difficulties were encountered in real-time exam data. Analyzing non-real-time but face-to-face exam papers, Ramani et al. [
24] found that the XGBoost algorithm, one of the machine learning algorithms, performed with an accuracy rate of 94.8%. Alkan and Kumartas [
25] used reaction time, psychometric-based person fit statistics, and copy similarity measurement models to identify individuals who engaged in dishonest behavior in the test. K-nearest neighbor, naive Bayes, and random forest classification algorithms, which are among the supervised classification methods, were used. The Naive Bayes method achieved the best detection rate in identifying participants with a fraudulent behavior pattern with a sensitivity of 64%.
Online application data in education has become the new focus of deep learning and machine learning methods. Today, with deep learning and machine learning algorithms, it is now possible to predict and classify student achievement, academic integrity, and support, revealing unethical behavior patterns from online applications. There are not many studies in this field in the literature. The main purpose of our study is to reveal good performance models with deep learning and machine learning algorithms in regression and classification problems using online exam data. This is the focal point of our research in order to make a contribution to the literature.
2. Materials and Methods
Today’s learner-focused educational institutions carry out their education and training processes with innovative technologies by focusing on the individual as a need. Different distance education models have been implemented due to the nature of technology and the interests and needs of individuals and unexpected situations (epidemics, earthquakes, etc.). The technology that we have today and benefit from at the highest level is a threat that negatively affects the quality of education and training processes, making educational institutions and learners uneasy. Higher education institutions in particular must take the necessary measures to ensure academic honesty and academic integrity. The focus of our work is to intervene in education processes with engineering sciences and to make regression classifications by comparing the performances of deep learning and machine learning algorithms with improved optimal parameters.
In this part of the study, firstly, the models that give the best performance among DL and ML classifiers used in both regression and classification are focused on. Classification provides suitable models for estimating categorical values, while regression is recommended for estimating numerical and continuous variable target values. Regression expresses the connections between independent variables and target variables numerically. This provides a more detailed approach than classification in understanding how the model works and making predictions. In our study, while unethical behavior patterns with online exam data were classified as “copied” or “did not copy” with classification models, regression models can give unethical behavior patterns as a more detailed numerical value or a percentage rate. Brief information about DL and ML models is given, and brief information about regression and classification metrics used in the analysis of the models is given. In the second part of the study, detailed information about the data set prepared within the scope of the study and feature selection methods used on the data set are included. Data processing, data cleaning, data transformation, data normalization, and feature selection are performed, and maximum performance and time efficiency are aimed for by converting the data into formats suitable for analysis.
The block diagram of the experimental method used in the study is presented in
Figure 1.
2.1. Deep Artificial Neural Network (DNN)
DNN can be defined as an artificial neural network, which is a deep learning model with multiple hidden layers or tools used for different levels of problems using mathematical models that vary according to the underlying complexity of the application [
26]. A typical DNN should have at least three hidden layers, which can be considered a minimum in layer-based applications for training to be effective [
27]. DNN is similar to a multilayer perceptron (MLP) with its multilayer structure [
28]. The difference from MLP, which has three layers, is that it has an input layer, multiple hidden layers, and an output layer. Its performance can be improved by increasing the number of hidden layers to increase classification and prediction success. DNN layers create a new structure by both training the model and creating its architecture by transmitting the information received from the previous layer to the next layer thanks to neurons. In this study, DNN is proposed as both a regression and a classifier. The reason why deep neural networks were preferred among deep learning algorithms in this study is that they achieve good performance in the analysis of two-dimensional numerical data.
2.2. K-Nearest Neighbor (KNN)
KNN is an effective classifier from ML algorithms. It is one of the ML models used in regression and classification [
29,
30]. It is a simple supervised algorithm for product classification based on neighboring data points [
31]. When training the algorithm, a new data point is selected and its distance to the nearest data point is calculated. According to the calculated distance, the most optimal class is found for the data that have not yet been assigned to a class [
32,
33]. In the KNN algorithm, the first priority is to determine a K value [
34]. The number of neighboring points is determined by the K value. The main benefit of KNN is that new data points can be added, as it does not learn from the training data set. Here, choosing a K value is a critical task. The K nearest neighbors are determined through the necessary distance functions. The new values are assigned to the determined neighbor classes, and classification is performed. The KNN algorithm can be considered a better classifier than other algorithms in cases where new data arrives rapidly and the training set changes rapidly [
32]. In this study, KNN was preferred because it gives effective results on well-scaled and low-dimensional data.
2.3. Decision Trees (DT)
DT is a common machine learning classification method used to train simple decision rules. DT consists of a root node, branches, internal nodes, and leaves [
35]. The model starts from the root node and starts branching by comparing the root value with relevant attributes [
31]. Starting from the root, the decision node tests a division operation on the input attributes and reaches one of the relevant branches. The search and testing process ends when it accesses the leaves from the branches. Thus, it is decided to which class the new attribute belongs [
30]. DT is an appropriate algorithm for numerical and categorical data. Since the data used in this study are both categorical and numerical, this algorithm was preferred for flexible solutions.
2.4. Logistic Regression (LR)
LR is a statistical model that classifies target variables by using them together with more independent variables. It measures the relationship between two or more variables to obtain descriptive inferential statistics [
36]. At the same time, logistic regression is a method used to determine the cause-and-effect relationship with independent variables when the target variable has two or more categories [
37]. Logistic regression is a generalization of linear regression [
38]. Instead of modeling the output value directly in logistic regression, the probability of belonging to a class is modeled. Using the logistic function, the probability of belonging to a class has a value between 0 and 1 according to the attributes [
39]. LR is a linear model. This model was preferred because it showed successful performance in classifying data belonging to two or more classes.
2.5. Random Forest (RF)
RF, an efficient machine learning algorithm, consists of traditional decision trees. A random forest classifier can be defined as a collection of tree-type classification algorithms. Since it has more than one tree in its structure, it is a method that increases the correct class value [
31,
40]. According to the RF algorithm, firstly, a decision tree based on subsets is created with the training data. A feature subset is used within each node. Thus, the risk of overlearning is reduced. In the last stage, the prediction with the highest value belonging to the predicted class is selected [
30]. RF is preferred because it is a powerful model for detecting complex relationships between the target variable and the independent variable. It is also suitable for categorical and numerical data. RF has been proposed as a successful model in predicting human behavior, such as online exam data.
2.6. Extreme Gradient Boosting (XGBoost)
XGBoost is a supervised learning algorithm based on community trees for prediction and classification problems [
41]. This algorithm is based on tree-based learning methods and generally performs classification tasks successfully on large and complex datasets [
42]. XGBoost builds new models from previous model errors. It trains hierarchical trees using the boosting method, with the ensemble trees connected to each other, and by merging weak trees, more stable trees and complex data patterns are obtained. Compared to traditional machine learning methods, the advantages of XGBoost include regularization, parallel processing, high flexibility, handling missing values, and built-in cross-validation [
43]. XGBoost provides powerful and flexible solutions for both regression and classification problems. It was chosen in this study because it performs particularly well on organized and structured data.
2.7. Support Vector Machine (SVM)
SVM is a powerful machine learning tool for regression and classification problems. SVM can classify linear and non-linear data, but it usually tries to classify data linearly [
44]. The main task of SVM is to create planes that can separate appropriate classes from attributes. SVM performs a class separation by separating the points on the plane with a straight line. In this decomposition, a successful performance is achieved by using the “kernel trick” method for class problems that cannot be separated linearly and separating classes that cannot be separated linearly into linear classes [
45]. It gives successful results even in small data sets with a large number of independent variables. This model was preferred in our study because of the large number of independent variables and the small data set.
2.8. Regression Metrics
To evaluate the performance of the proposed methods for forecasting, three metrics were used: root mean square error (RMSE), mean absolute error (MAE), and correlation coefficient (R2). These metrics are often used for evaluation in time series forecasting.
Root mean square error (RMSE): Used to evaluate the performance of the model in regression problems. It is an error measure calculated by taking the square root of the Mean Squared Error (MSE). RMSE is used to evaluate the magnitude of the errors. It is a very common and reliable measure for evaluating the performance of the prediction.
Mean absolute error (MAE): It is an error measure that calculates the average of the absolute values of the differences between the actual values and the predicted values. A low MAE value indicates that the model is successful in predictions.
Correlation coefficient (R2): is a performance metric that measures how good a model’s predictions are. R2 shows how close the predicted values are to the true values and takes a value between 0 and 1.
R2 = 1: The model made excellent predictions.
R2 = 0: The model performed no better than predicting the average of the actual data.
R2 < 0: The model performed very poorly in predictions.
2.9. Classification Metrics
In binary classification, the confusion matrix is an important tool used to evaluate the prediction performance of the model.
Table 1 shows the confusion matrix for binary classification. In
Table 1, the confusion matrix for a two-class classification problem summarizes four different cases:
True positive (TP): The number of instances where the true class is positive and predicted as positive by the model.
True negative (TN): Number of instances where the true class is negative and the model predicts it to be negative.
False positive (FP): Number of instances where the true class is negative but predicted as positive by the model.
False negative (FN): Number of instances where the true class is positive but predicted as negative by the model.
In
Table 2, the confusion matrix for a three-class classification problem summarizes four different cases:
True A (TA), True B (TB), True C (TC): These cells represent the number of instances where the model correctly predicted each class.
False B as A (FBA), False C as A (FCA): These cells represent the cases where the model incorrectly predicted Class B and Class C instances as Class A.
False A as B (FAB), False C as B (FCB): These cells indicate cases where the model incorrectly predicts Class A and Class C instances as Class B.
False A as C (FAC), False B as C (FBC): These cells indicate cases where the model incorrectly predicts Class A and Class B instances as Class C.
The classification metrics used in the study are given below:
Accuracy: It is a performance metric that measures how accurately the model predicts in classification problems. It can give misleading results in unbalanced data sets where all classes are not equally represented. The accuracy value varies between 0 and 1.
1: The model made all its predictions correctly.
0: The model made all its predictions incorrectly. It is calculated by Formula (1).
Precision: Measures the proportion of instances predicted as a positive class that are actually positive. Precision ranges from 0 to 1.
1: All predicted positives are true.
0: None of the predicted positives are true.
It is calculated by Formula (2).
Sensitivity: It indicates the model’s ability to correctly recognize positive classes. A high recall value indicates that the model is good at avoiding false negatives. It is calculated by Formula (3).
F1-Score: It is calculated as the harmonic mean of precision and sensitivity. A high F1-Score indicates that the model has both high precision and recall, meaning that the model both correctly recognizes positive classes and minimizes false positives. The F1-Score value varies between 0 and 1.
1: Model performs perfectly.
0: Model fails.
It is calculated by Formula (4).
Specificity: Measures the rate of correctly detecting the negative class. It is especially useful in imbalanced data sets or when false positives are significant. When used with Recall, it provides more detailed information about the overall performance of the model. It is calculated by Formula (5).
Matthews correlation coefficient (MCC): It measures how well the model can distinguish between positive and negative classes and takes into account all classification errors. The value of MCC ranges from −1 to 1, with 1 indicating perfect classification, 0 indicating random prediction, and −1 indicating a completely opposite classification. It is calculated by Formula (9).
The dataset used in this study was obtained within the scope of the study titled ‘Development of a New Model for Detecting Undesirable Behavior in Online Exams,’ approved by the Ethics Principles and Ethics Committee of Bitlis Eren University (Bitlis, Turkey) with decision number 2022/15-19 and E.3165 (The Ethics Committee decision is provided in
Appendix A). The dataset consists of supervised and unsupervised exam data from 221 students, using both real and simulated exams conducted through the Academic Learning Management System (ALMS), the distance education system of Bitlis Eren University, for the Basic Information Technologies course. The data, transferred by the researcher into the Python/Pandas library in Excel format, include the participants’ departments, grades, their responses to the questions (A1, A2,..., A15), the number of correct and incorrect answers, the total time spent by students in the system, the time spent per question, the total time spent on solving questions, and the predicted variable (R_per) defined by the researcher.
2.10. Dataset and Data Cleaning
The dataset used in this study was obtained within the scope of the study titled “Development of a New Model for Detection of Unwanted Behavior in Online Exams”, which was approved by the decision numbered 2022/15-19 and E.3165 of the Bitlis Eren University Ethics Principles and Ethics Committee (the Ethics Committee decision is given in
Appendix A). The dataset consists of 221 student exam data, supervised and unsupervised, using real exam and artificial exam types consisting of 15 multiple-choice questions conducted through the Advancity Learning Management System (ALMS), Bitlis Eren University distance education system for the Basic Information Technologies course. The online exam was administered synchronously and asynchronously. Synchronous exams were administered in computer laboratories with an invigilator, while asynchronous exams were administered unsupervised at any time of the day. The data of the participants who took the exam were transferred to the Phyton/Pandas library in Excel format by the researchers.
Datasets obtained often contain missing values, making data cleaning a crucial step in the process. Multiple methods can be used to address missing values. These can include techniques such as coding the missing value with a certain value, using the average of other values for that feature, or assigning the most appropriate value based on the existing distribution. However, since demographic variables such as department, grade, and gender were registered in the system, no missing data were encountered in this study. Nevertheless, the absence of responses to questions caused significant issues in detecting question times, so missing data completion was not pursued in terms of data integrity. Before preprocessing, a total of 221 exam records were obtained, but due to missing responses, the records of participants with incomplete data were removed in Python to ensure data integrity. As a result, 162 exam records were obtained through the data cleaning method.
2.11. Data Conversion
After the data cleaning process, the attributes in the data set were labeled and the data values were classified. The attributes used in labeling and classification are given in
Table 3.
Table 3 shows the label values and descriptions of the attributes belonging to the data set.
2.12. Data Normalization
In this study, min–max and standardization normalization techniques were used. These two normalization techniques vary depending on deep learning models. With the min-max normalization technique, the original data are transformed into the 0–1 range through a linear transformation.
Standardization, also known as Z-score normalization, transforms the data by setting the standard deviation to 1 and the mean to 0. For values that deviate from the analysis, the Z-score outlier detection method was applied to the data. The Z-score indicates how many standard deviations a value is away from the mean. Typically, values where |z| > 3 are considered outliers. As a result of the analysis, 33 exam records identified as outliers were removed from the dataset. The final dataset consisted of 129 exam records.
2.13. Feature Selection and Correlation Matrix
Feature selection is the process of selecting the most effective variables (features) in the dataset to increase the accuracy of the model and reduce unnecessary information. The correlation matrix is used to analyze the linear relationship between variables. This is an important tool for both feature selection and understanding the relationships that may affect the performance of the model. Correlation expresses the direction and strength of the linear relationship between two variables and takes values between −1 and +1. Within the scope of the online dataset study, which consisted of 129 rows and 40 attributes, feature selection was made with the correlation matrix, and in the outputs realized in the Phyton/Pandas environment, the attributes with high relationship strength with the target variable were taken into account in the model performance analysis.
2.14. Determination of Target Variable and Threshold Value
The target variable “R_per” in the online data set consisting of 129 lines and 40 attributes was obtained by evaluating the time spent answering each question by the researchers and experts. The online exam questions were read by the researchers, two linguists, and a total of 10 experts from different disciplines, and the arithmetic average of the time spent per question was obtained. The 13th question of the Basic Information Technologies exam was given as an example within the scope of the exam.
“13- Which of the following is listed from largest to smallest in terms of speed?
- (a)
RAM-HARDDISK-CACHE
- (b)
HARDDISK-CACHE-RAM
- (c)
RAM-CACHE-HARDDISK
- (d)
CACHE-RAM-HARDDISK
- (e)
HARDDISK-RAM-CACHE”
The expert who read question 13 the fastest by understanding it took 15 s, while the expert who read the slowest took 23 s. When the arithmetic average of all experts was taken into account, it was determined that question 13 could be read in an average of 18 s, but when the expert who read the fastest was taken into account, the value of 15 s was accepted. Considering the students’ reading time for question 13, their prerequisite behaviors, academic achievements, and individual differences, the answering time for question 13 was accepted as 10 s as the critical value. Since students’ answering the 13th question in less than 10 s exceeded the critical value, it was considered either “cheating” behavior or “suspicious” behavior. The focus of the study is to determine threshold values and create scenarios based on this critical value. According to Scenario-1, the times answered below the critical values determined for each question were accepted as cheating behavior, and equal threshold times were given to each question. The threshold time was obtained by dividing 100 full points by the total number of questions. Thus, the numerical values obtained over 100 full points were used to create the target variable “R_per”, and regression analysis was performed. According to Scenario-2, times below the critical value for each question are considered as “cheating” behavior. For example, if the critical value of question 13 is 10 s and the student answers in 9 s, it is considered as “cheating” behavior. Thus, binary classification data are obtained. For Scenario-3, the times below the critical value for each question were considered as “suspicious” behavior if they were approaching the critical value and as “cheating” behavior if they were moving away from the critical value. For example, if the critical value of question 13 was 10 s and the student answered it in 9 s, it was considered as “suspicious” behavior, or “cheating” behavior if it was answered in 5 s. Thus, triple classification data are obtained. Since the scenarios were obtained from the students’ question answering times, the analysis was performed by removing the times from the data set.
2.15. Explainable Artificial Intelligence (XAI)
Deep learning and machine learning methods have shown great success in many fields. However, it remains unclear how the models used in these methods work and which attributes affect the model more [
46]. The field of explainable artificial intelligence (XAI) has emerged to transform these models, also called “Black Boxes,” into a more understandable form [
47]. SHAP is a technique used to explain individual estimates. It is based on the SHapley value in game theory. The goal of SHAP is to calculate and present the contribution of each feature to the estimate to explain the estimate. SHAP uses cooperative game theory to calculate the SHapley values. Local accuracy and interpretable representation are two key features of LIME. Local accuracy refers to the reliability or fidelity of the model’s performance near the predicted sample. Interpretability provides a qualitative understanding between the responses and the input variables. The term model-independent means that the explanatory algorithm can explain any model by treating the original model as a black-box model [
48]. As researchers, we obtained features that affect the performance of the models by using both SHAP and LIME techniques from descriptive analyses.
2.16. Scenarios Within the Scope of the Study
Within the scope of the study, three scenarios were prepared by the researchers for the descriptive statistics of the dependent variable “R_per” on the independent variables:
Scenario-1: It is the prediction of numerical values in the target variable with deep learning regression models.
Scenario-2: It is the classification of binary class values in the target variable with deep learning and machine learning classifiers. The binary classification label consists of the classes “cheated” for the label “0” and “did not cheat” for the label “1”.
Scenario-3: The target variable is the classification of triple class label values with deep learning and machine learning classifiers. The triple classification label values consist of the classes “cheated” for the label “0”, “dicey” for the label “1”, and “did not cheat” for the label “2”.
3. Results
In this part of the study, analyses were performed with DL models on the data set that was made suitable for analysis as a result of pre-processing; the performances of machine learning algorithms were compared, and ethical and unethical behaviors in online exams were determined as output. Thus, the best model suggestions were presented.
3.1. Experimental Study
In this study, seven classifiers and one regression model were trained and tested on a real online exam dataset. The data were trained and tested using the K-10 cross-validation method. The most successful predictions and classifiers were identified by comparing their performance metrics. In the final stage, the most successful classifiers were visualized using the SHAP and LIME algorithms.
3.2. Applications and Analysis
The data set was analyzed using the Python programming language and the Jupyter Notebook platform with Pandas, Numpy, Matplotlib, Scikit-learn, Keras, and other libraries on a personal computer with high speed, capacity, and performance of hardware components.
3.3. Deep Learning and Machine Learning Algorithms
Within the scope of the study, deep artificial neural network from deep learning algorithms and k-nearest neighbor, support vector machines, random forest, logistic regression, extreme gradient boosting, and decision tree algorithms from machine learning algorithms were proposed for regression and classification analysis. Regression analyses were performed with DNN, one of the deep learning algorithms. Classification analyses were performed with the DNN model and machine learning algorithms, one of the deep learning algorithms.
3.4. Analysis Findings for Scenario-1 Forecast Models
For prediction, the deep learning model DNN algorithm was used. The analysis was initiated with the parameters that provided the best performance model in the algorithm, using the K-10 cross-validation method and a multi-layer structure. The goal was to achieve the highest R
2 and the lowest values for regression performance metrics, namely MAE and RMSE. The findings related to the analysis are summarized in
Table 4.
In
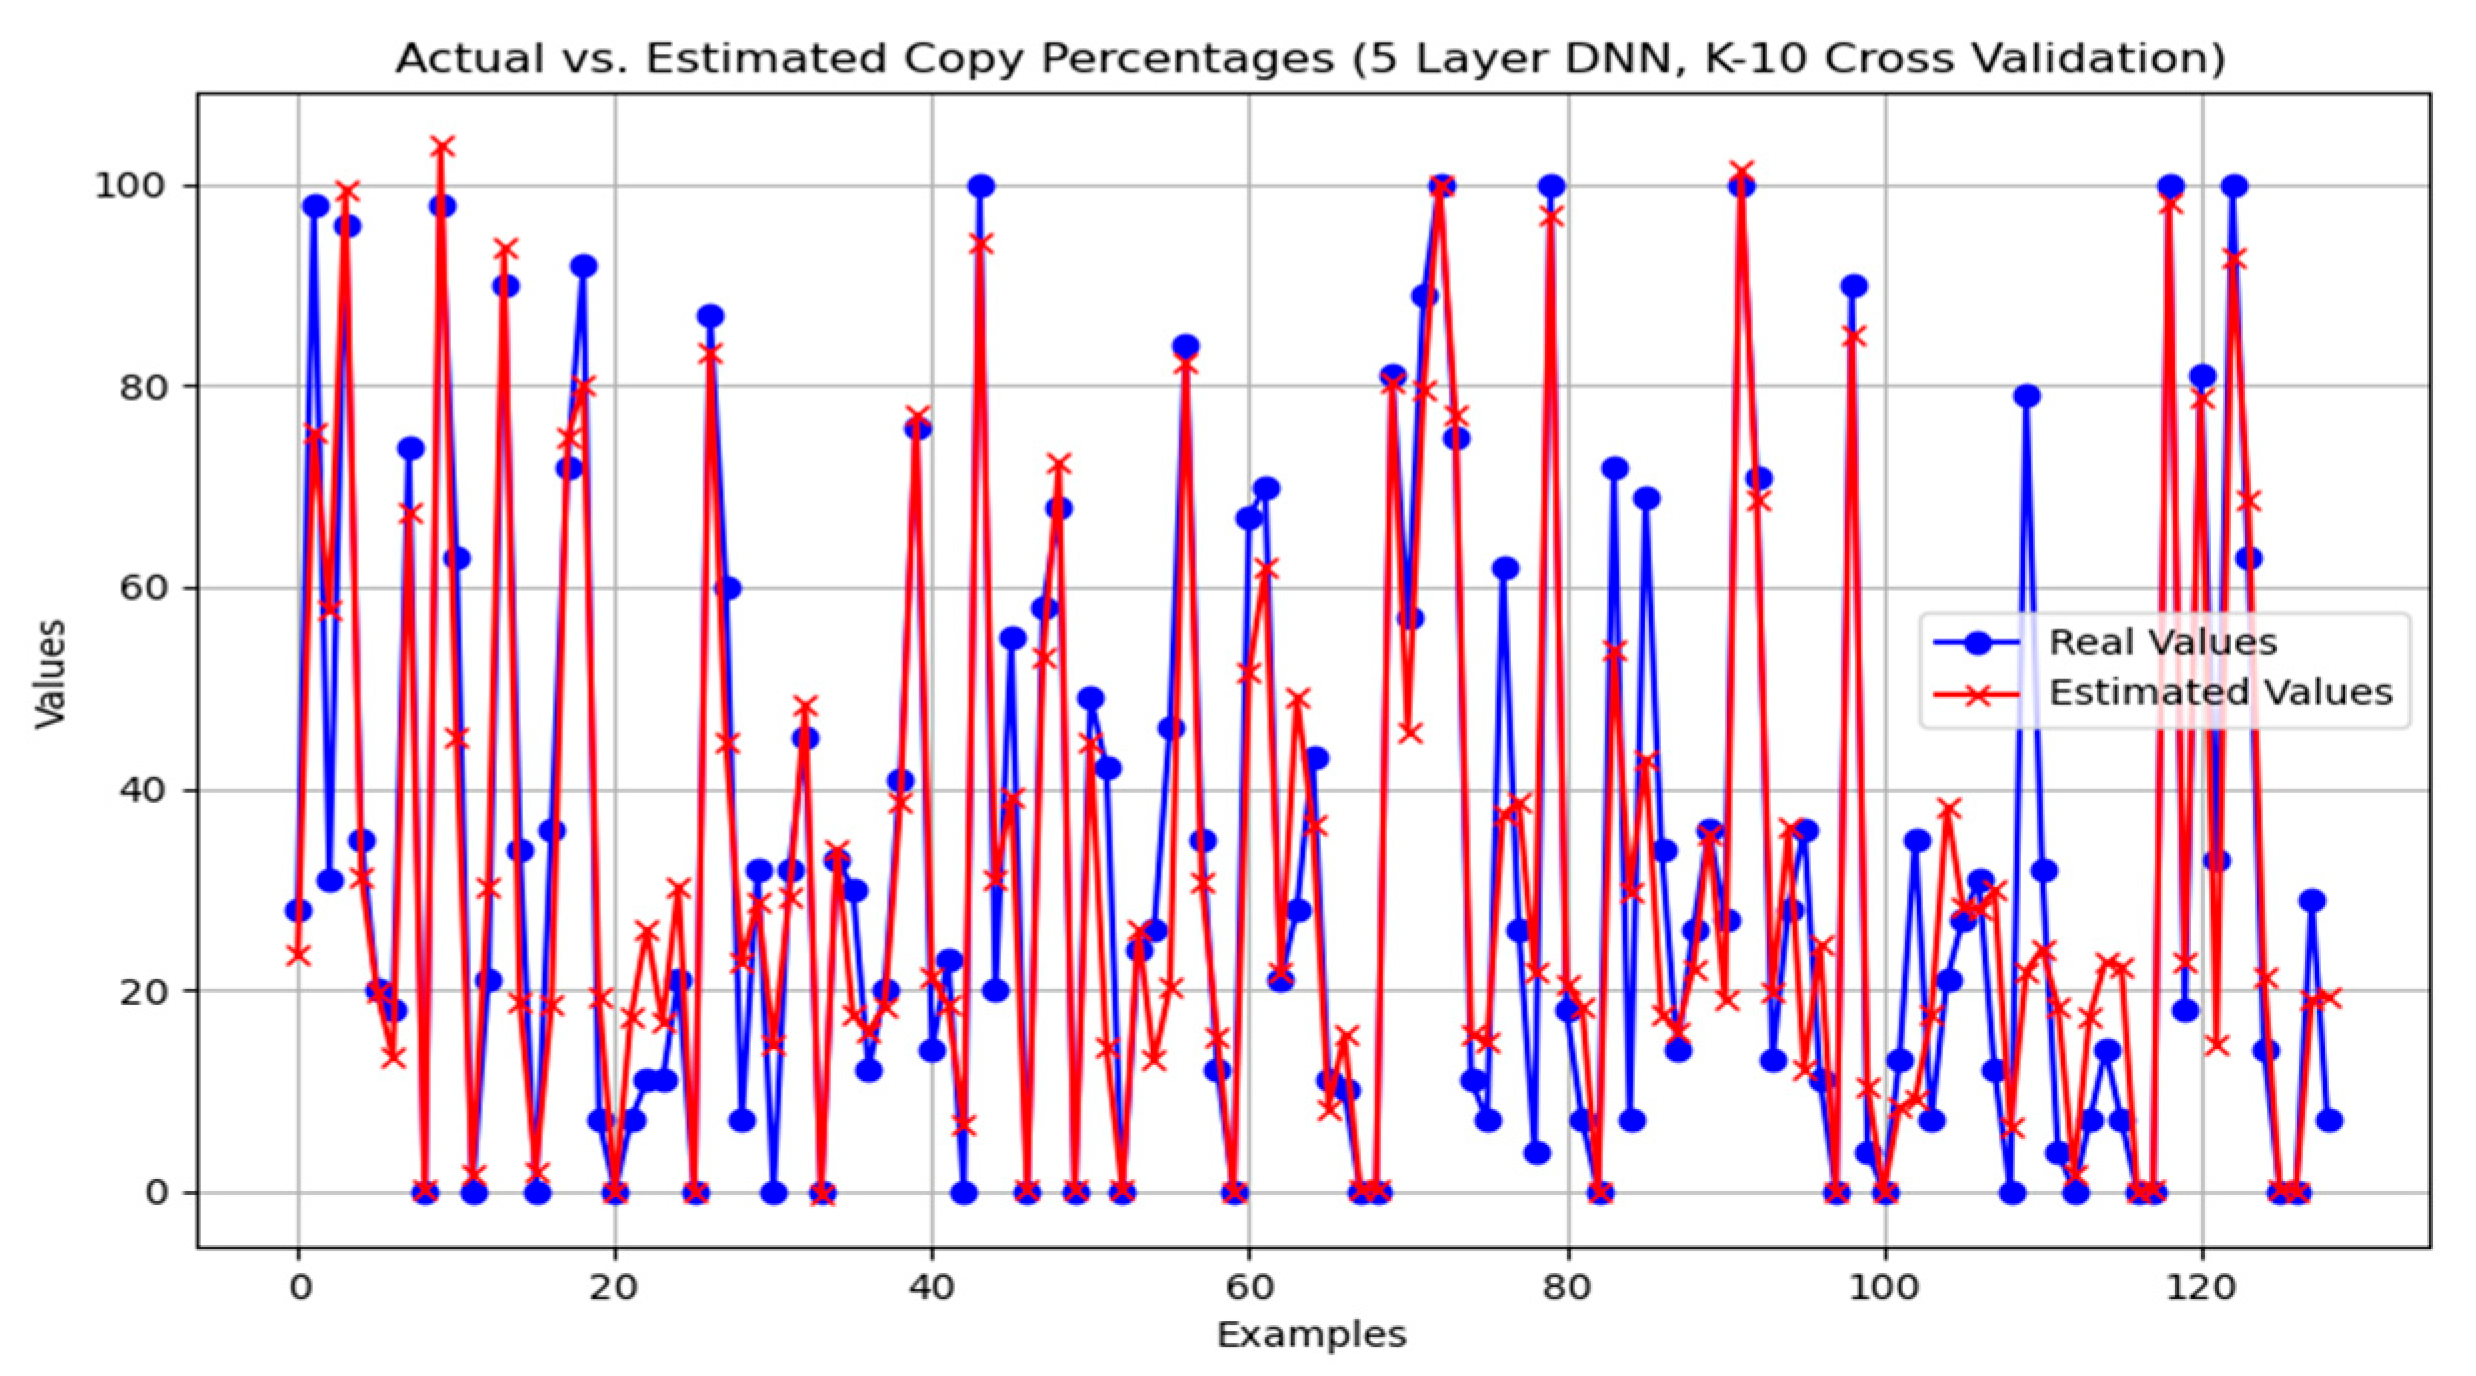
Table 4, the performance measurement values of the DNN model in regression analysis using the K-10 cross-validation method are shown. The model with the best performance was proposed using a 5-layer structure. The R
2 value of 0.809 on the test dataset for detecting students who cheated in online exams indicates that approximately 80.9% of the variance in the dependent variable can be explained by the independent variables. The high R
2 value for the model’s training performance suggests that the model explains the variability in the training data well. Overall, the test performance values of the DNN model with five and six layers have shown good results. It is observed that when the number of layers increases to seven or more, there is a decline in performance values. As the number of layers increases beyond five, MAE values start to rise, indicating that the model begins to make more errors in its predictions.
Figure 2 shows that the proposed model detects the cheating students well in the prediction analysis performed with a 5-layer DNN with K-10 cross-validation. The visualized form of the performance success of the 5-layer DNN model presented in
Table 4 is shown in
Figure 2.
The layers and parameters used in the 5-layer DNN model analysis, which gives the best prediction among the deep learning algorithms, are visualized and presented in
Table 5.
3.5. Analysis Findings for Scenario-2 Classification Models
The findings of the analyses conducted with deep learning and machine learning algorithms for the binary classification of “copied” behavior and “did not copy” behavior in the study are given in
Table 6. In
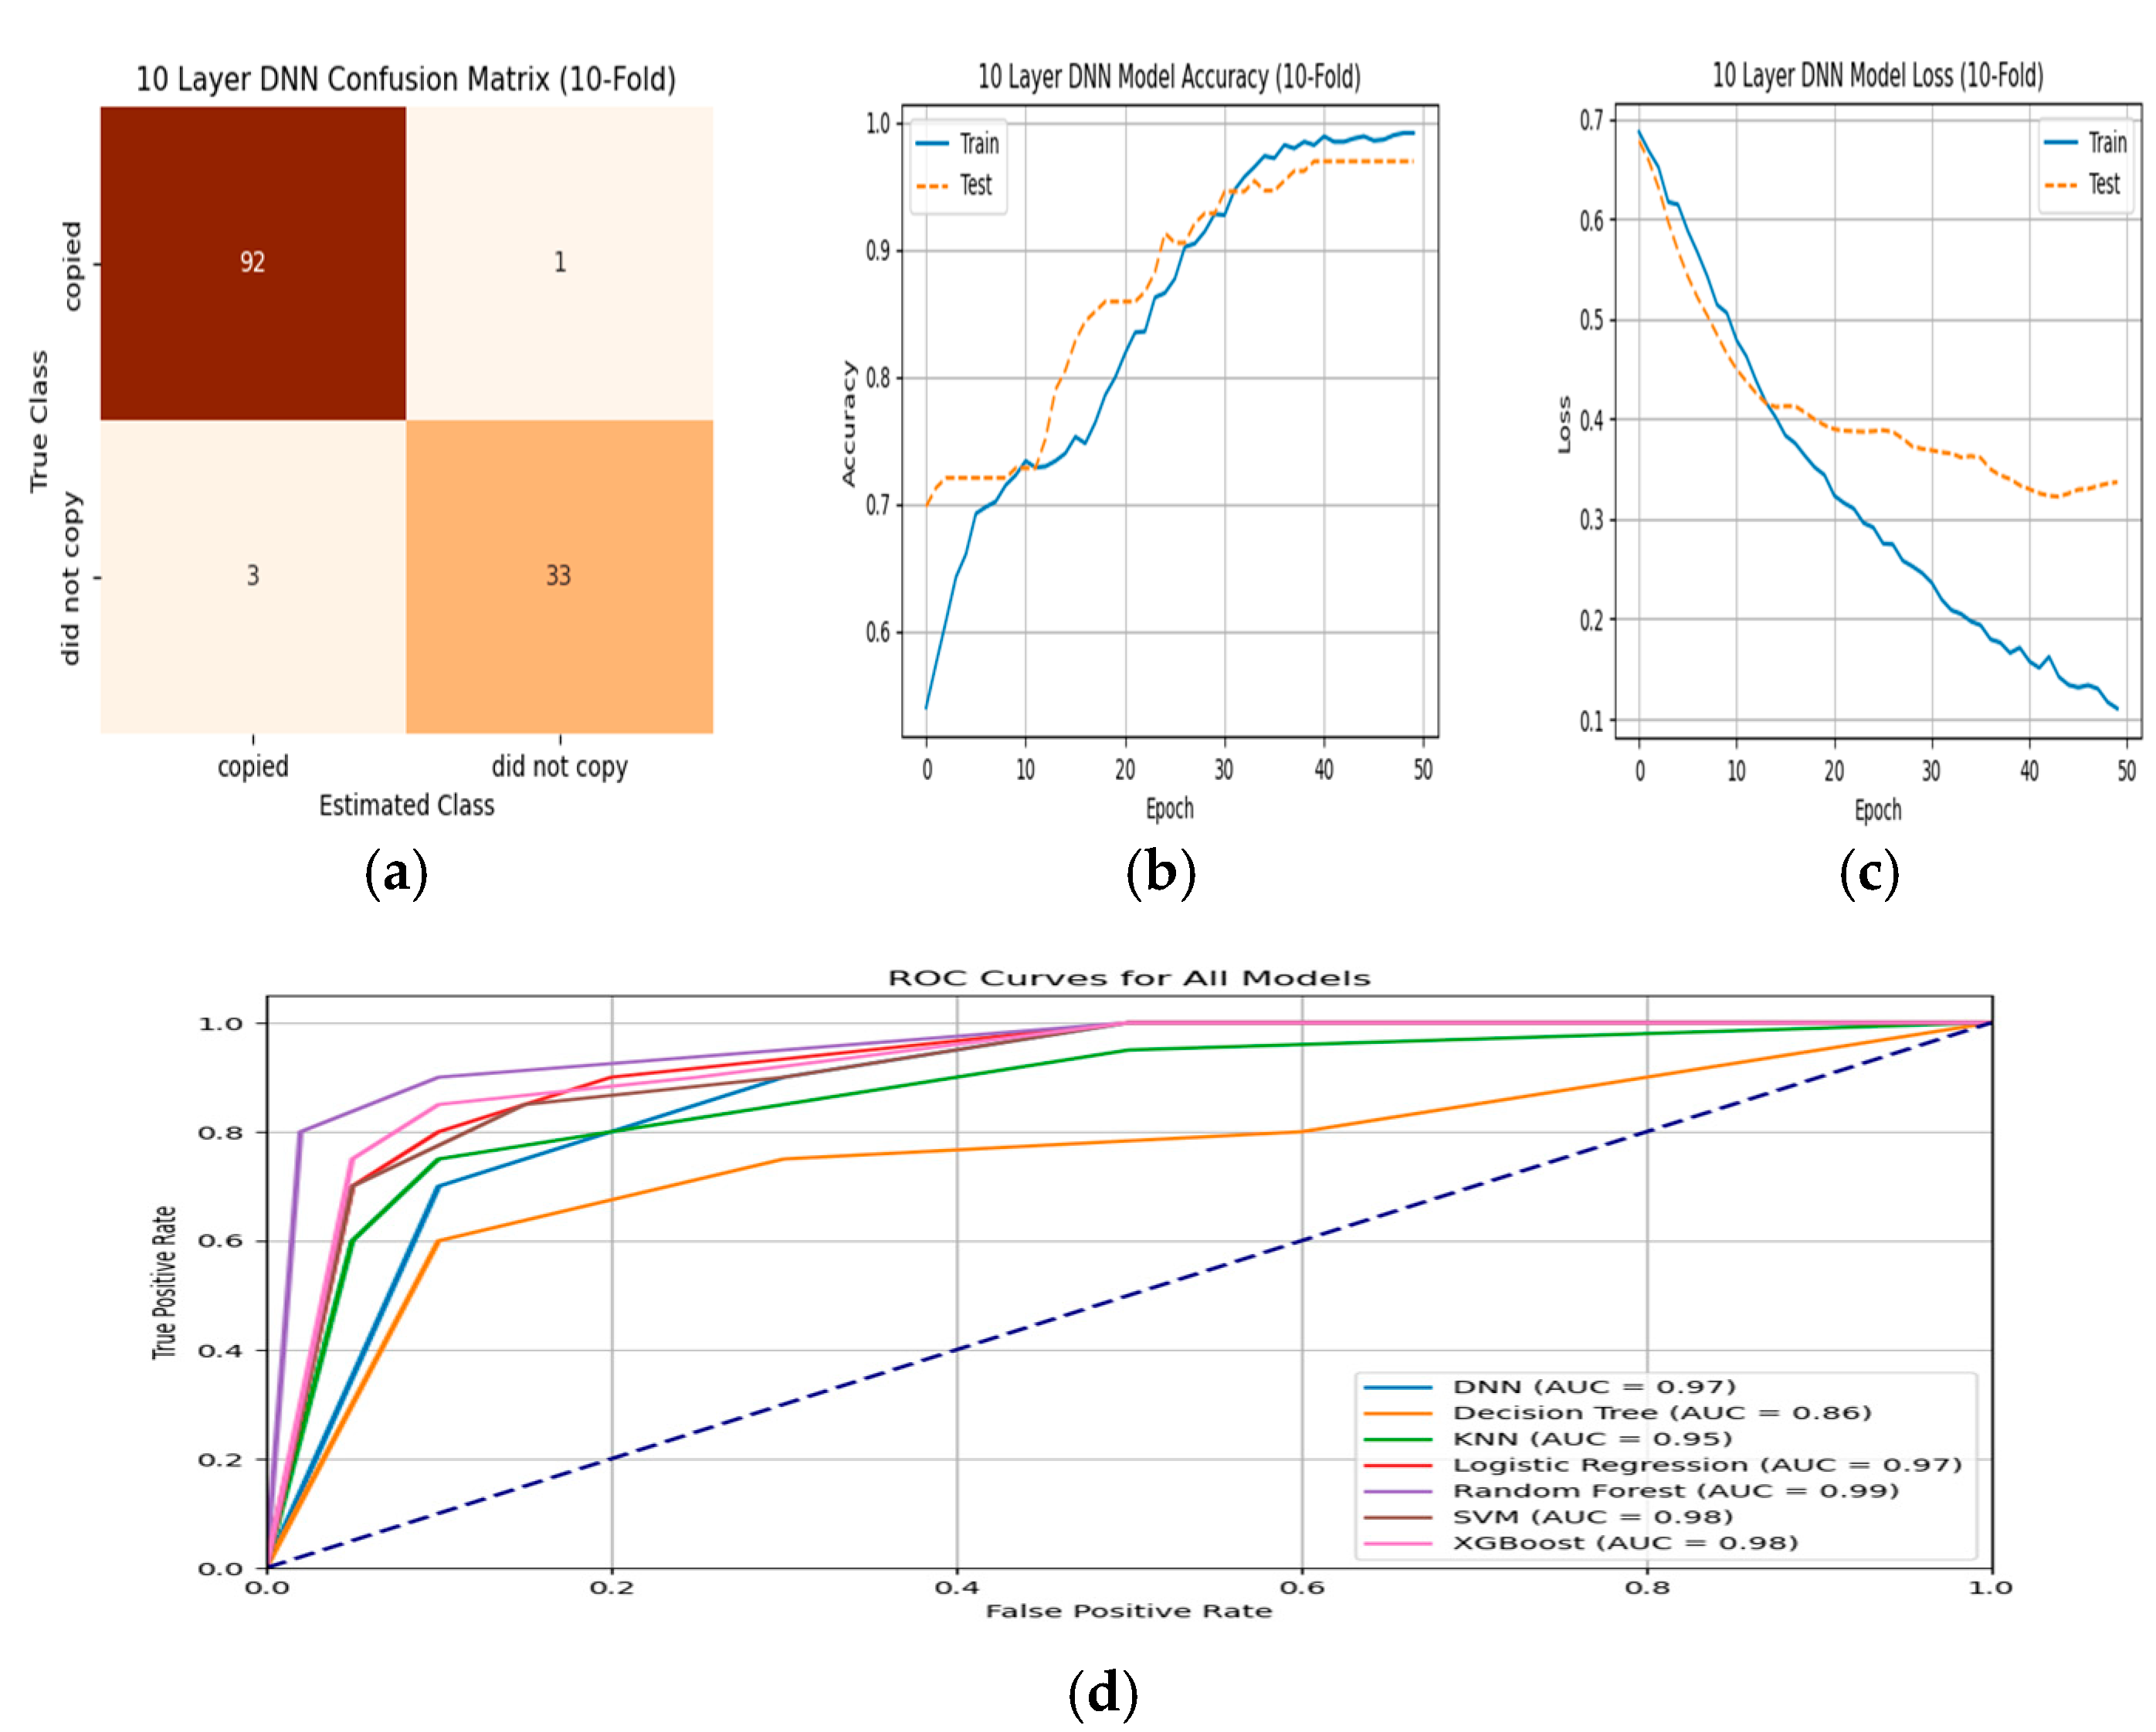
Table 6, among the deep learning models, the 10-layer DNN model has the highest accuracy rate of 96.9%. This shows that this model is quite powerful in terms of correctly classifying unethical behaviors in online exams. DT and LR have lower accuracy rates (0.885 and 0.907). The 10-layer DNN and XGBoost models have the highest sensitivity (0.948 and 0.900), indicating that these models capture positive classes well. The 10-layer DNN and SVM models have the highest F1 scores (0.956 and 0.909). This indicates that they have balanced performance in terms of both precision and sensitivity. The SVM model has the highest specificity rate (0.988), indicating that the model discriminates negative classes very well. The 10-layer DNN model has the highest MCC value (0.921), indicating that it generally performs well-balanced classification. The 10-layer DNN model has the lowest error rate, 3.1%, indicating that this model is more reliable in terms of overall performance. As a result, the model proposed within the scope of the study, a 10-layer DNN model, shows the best performance in general.
The training validation, loss validation, confusion matrix, and ROC curve of all models are given in
Figure 3.
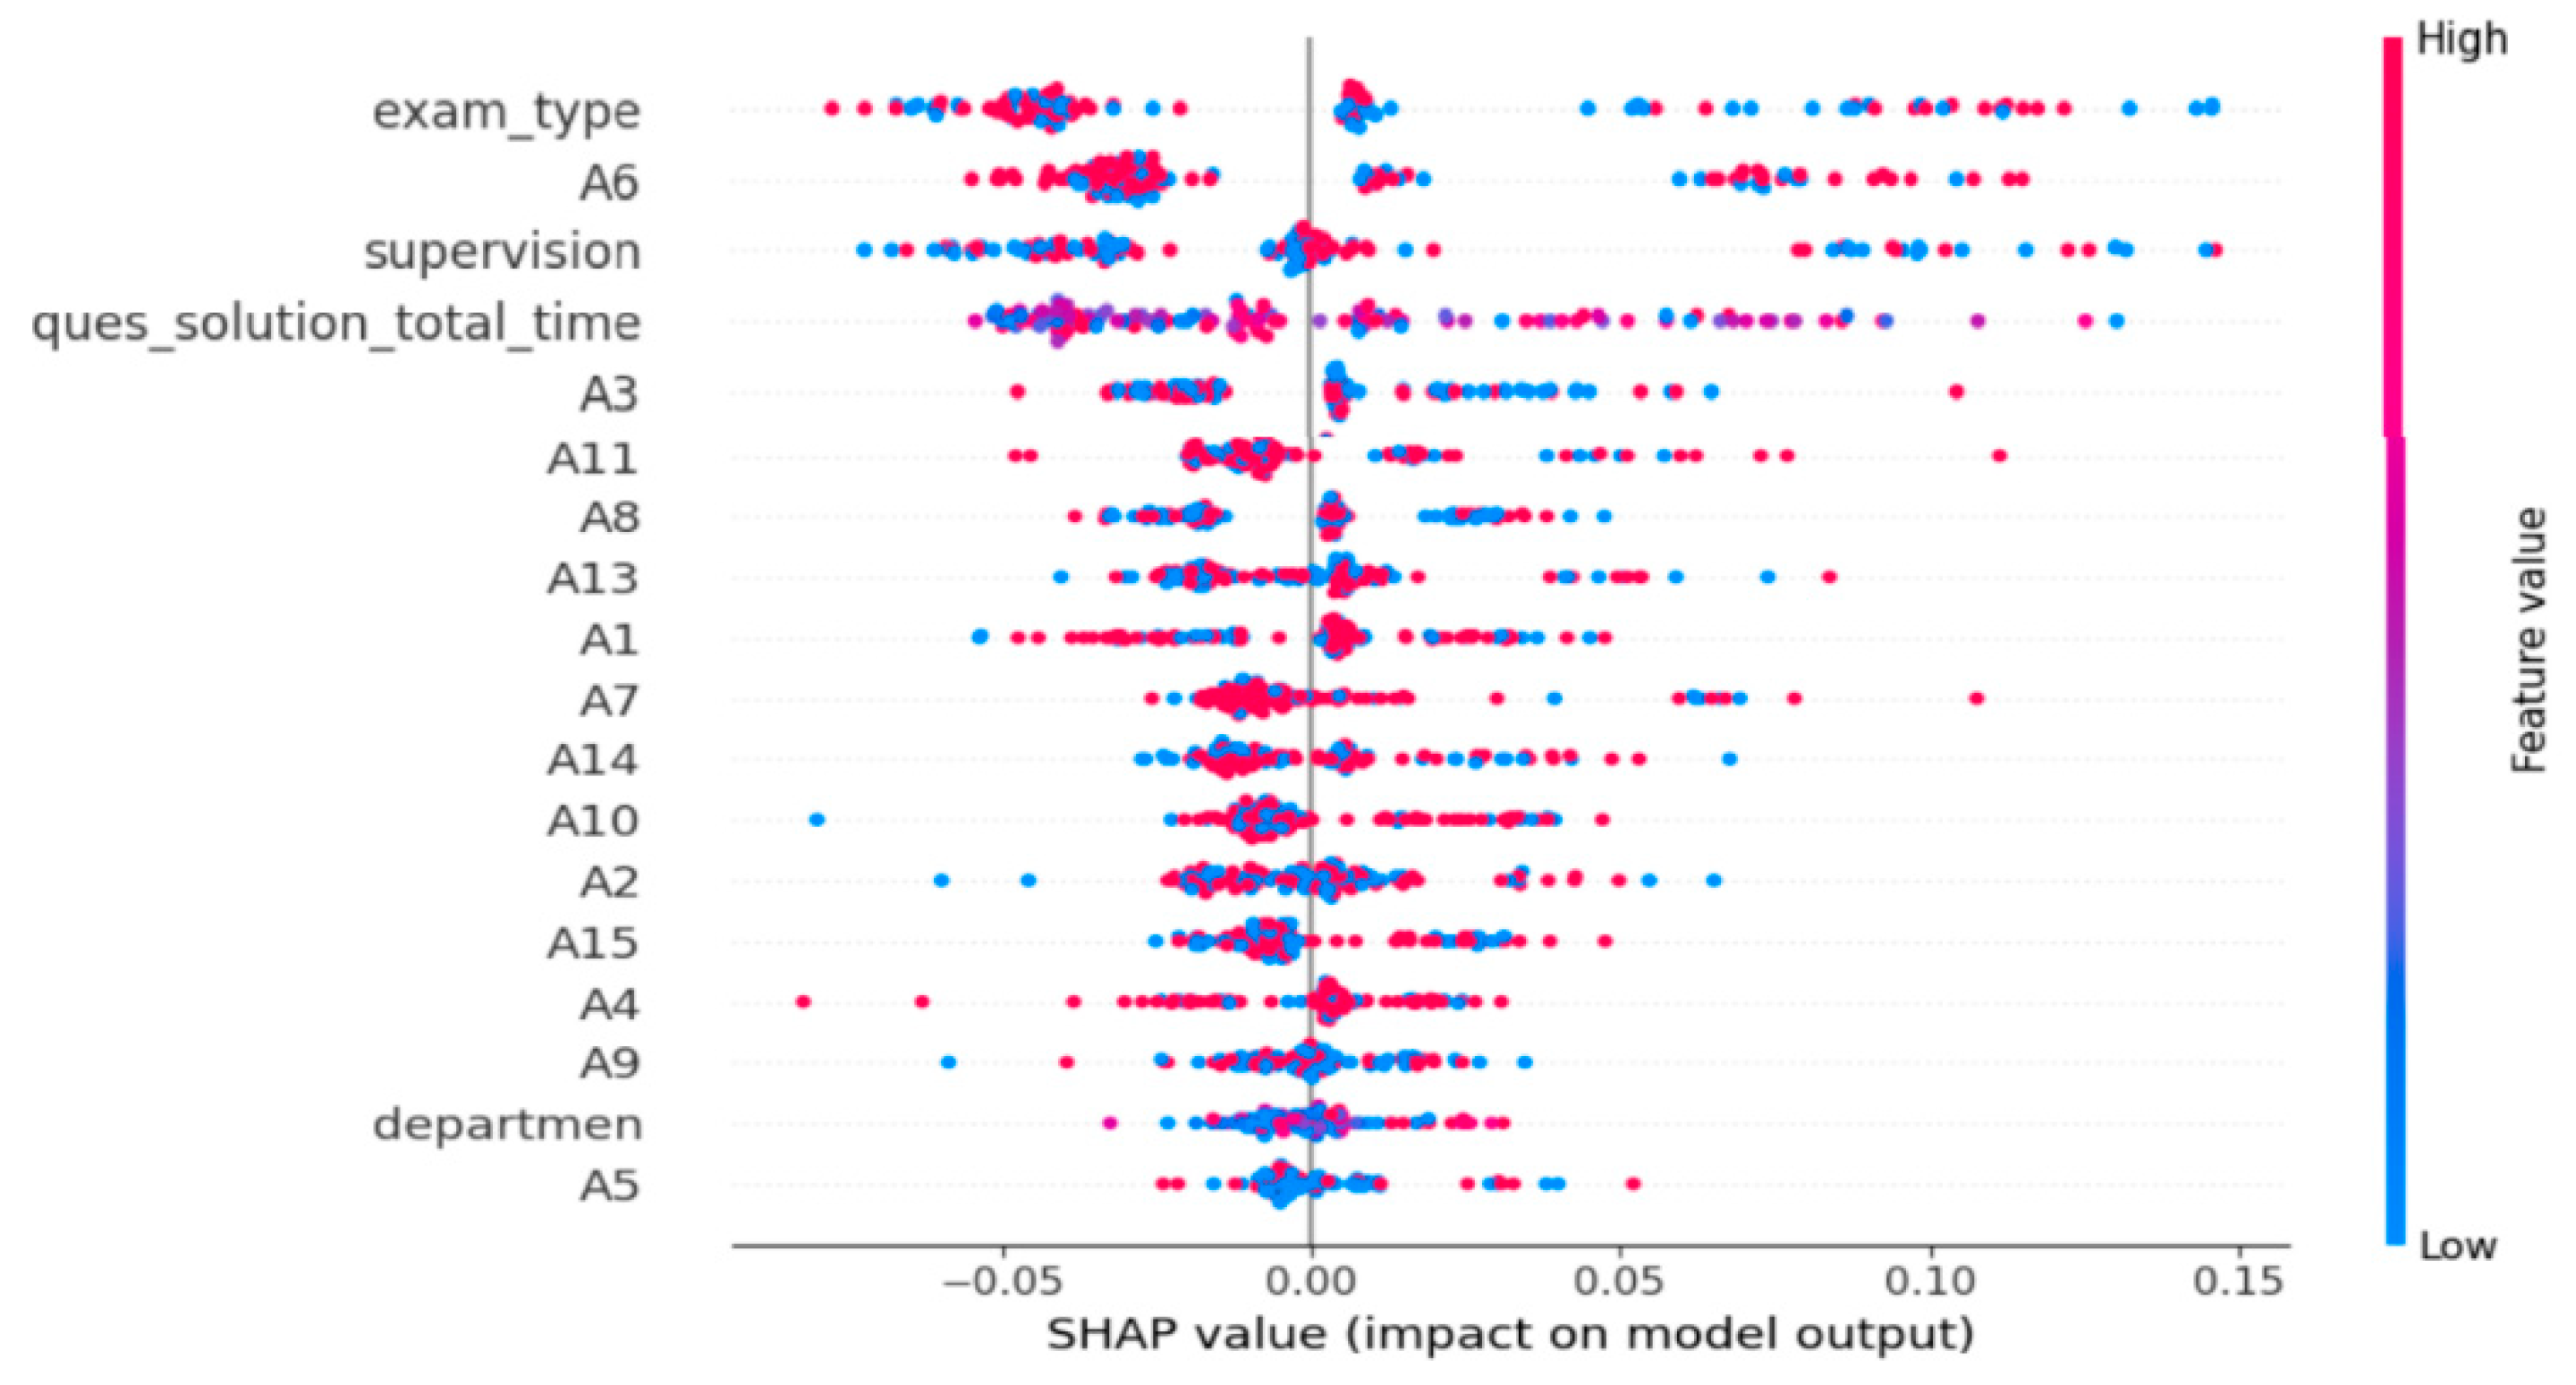
In
Figure 4, the attributes affecting the 10-layer DNN model in the SHAP analysis of the positive class (copied) and their influence values are given. It is understood that especially the ‘exam-type, A6, supervision, ques_solution_total_time’ attributes affect the prediction variable more positively.
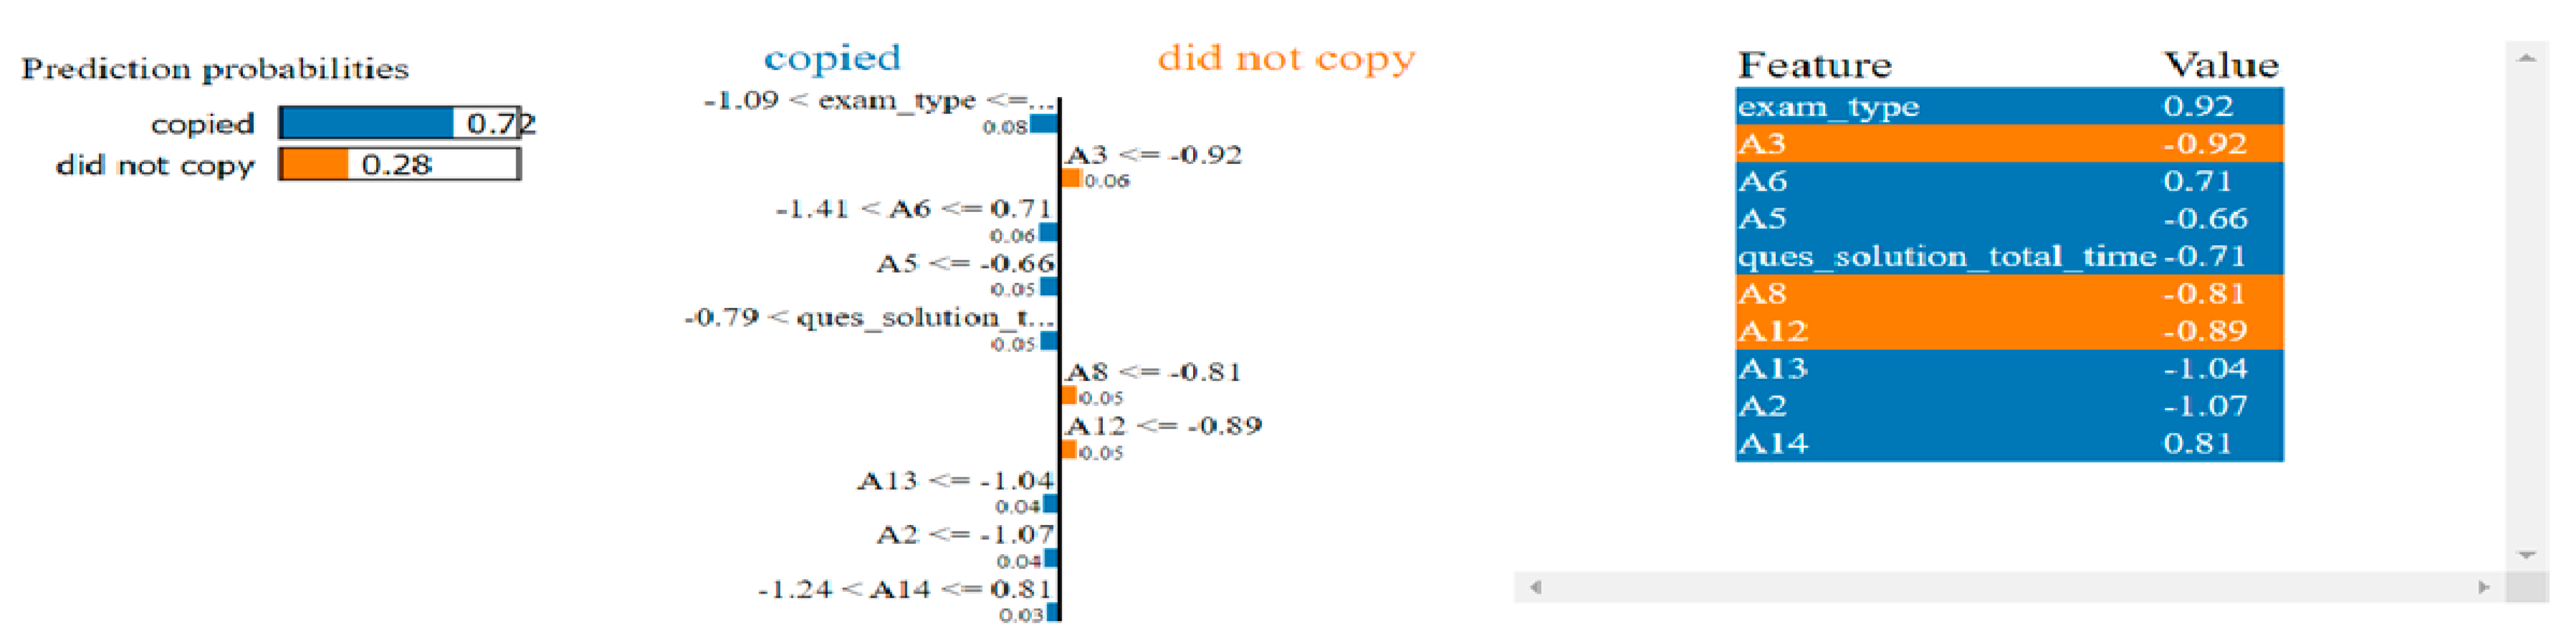
Figure 5 shows the results of the LIME analysis. The model predicted the positive class ‘cheated’ correctly 72% of the time, and the most effective attributes in this prediction were ‘exam_type, A6, A5’. The attributes ‘A3, A8 and A12’ were effective in predicting the negative class ‘did not cheat’. When the values of the attributes are analyzed, the ‘exam_type’ attribute contributed to the ‘copied’ class prediction with a value of 0.92 and a rate of 8%.
3.6. Analysis Findings for Scenario-3 Classification Models
The analysis results for the triple classifications made for “copied” behavior, “dicey” behavior, and “did not copy” behavior in the study are presented in
Table 7. In
Table 7, XGBoost is the most successful model proposal that detects ‘Copied’, ‘Dicey’, and ‘Did Not Copy’ class labels in terms of accuracy in the online exam with a rate of 97.7%. However, MCC performs close to 7-layer DNN, DT, and RF in terms of sensitivity and specificity. In addition, the KNN and RF models are also very strong and have high AUC values, indicating that their ability to discriminate between classes is also very good.
The confusion matrix, average loss curve, average accuracy curve, average ROC curves, and ROC curve of all models for the XGBoost model are given in
Figure 6.
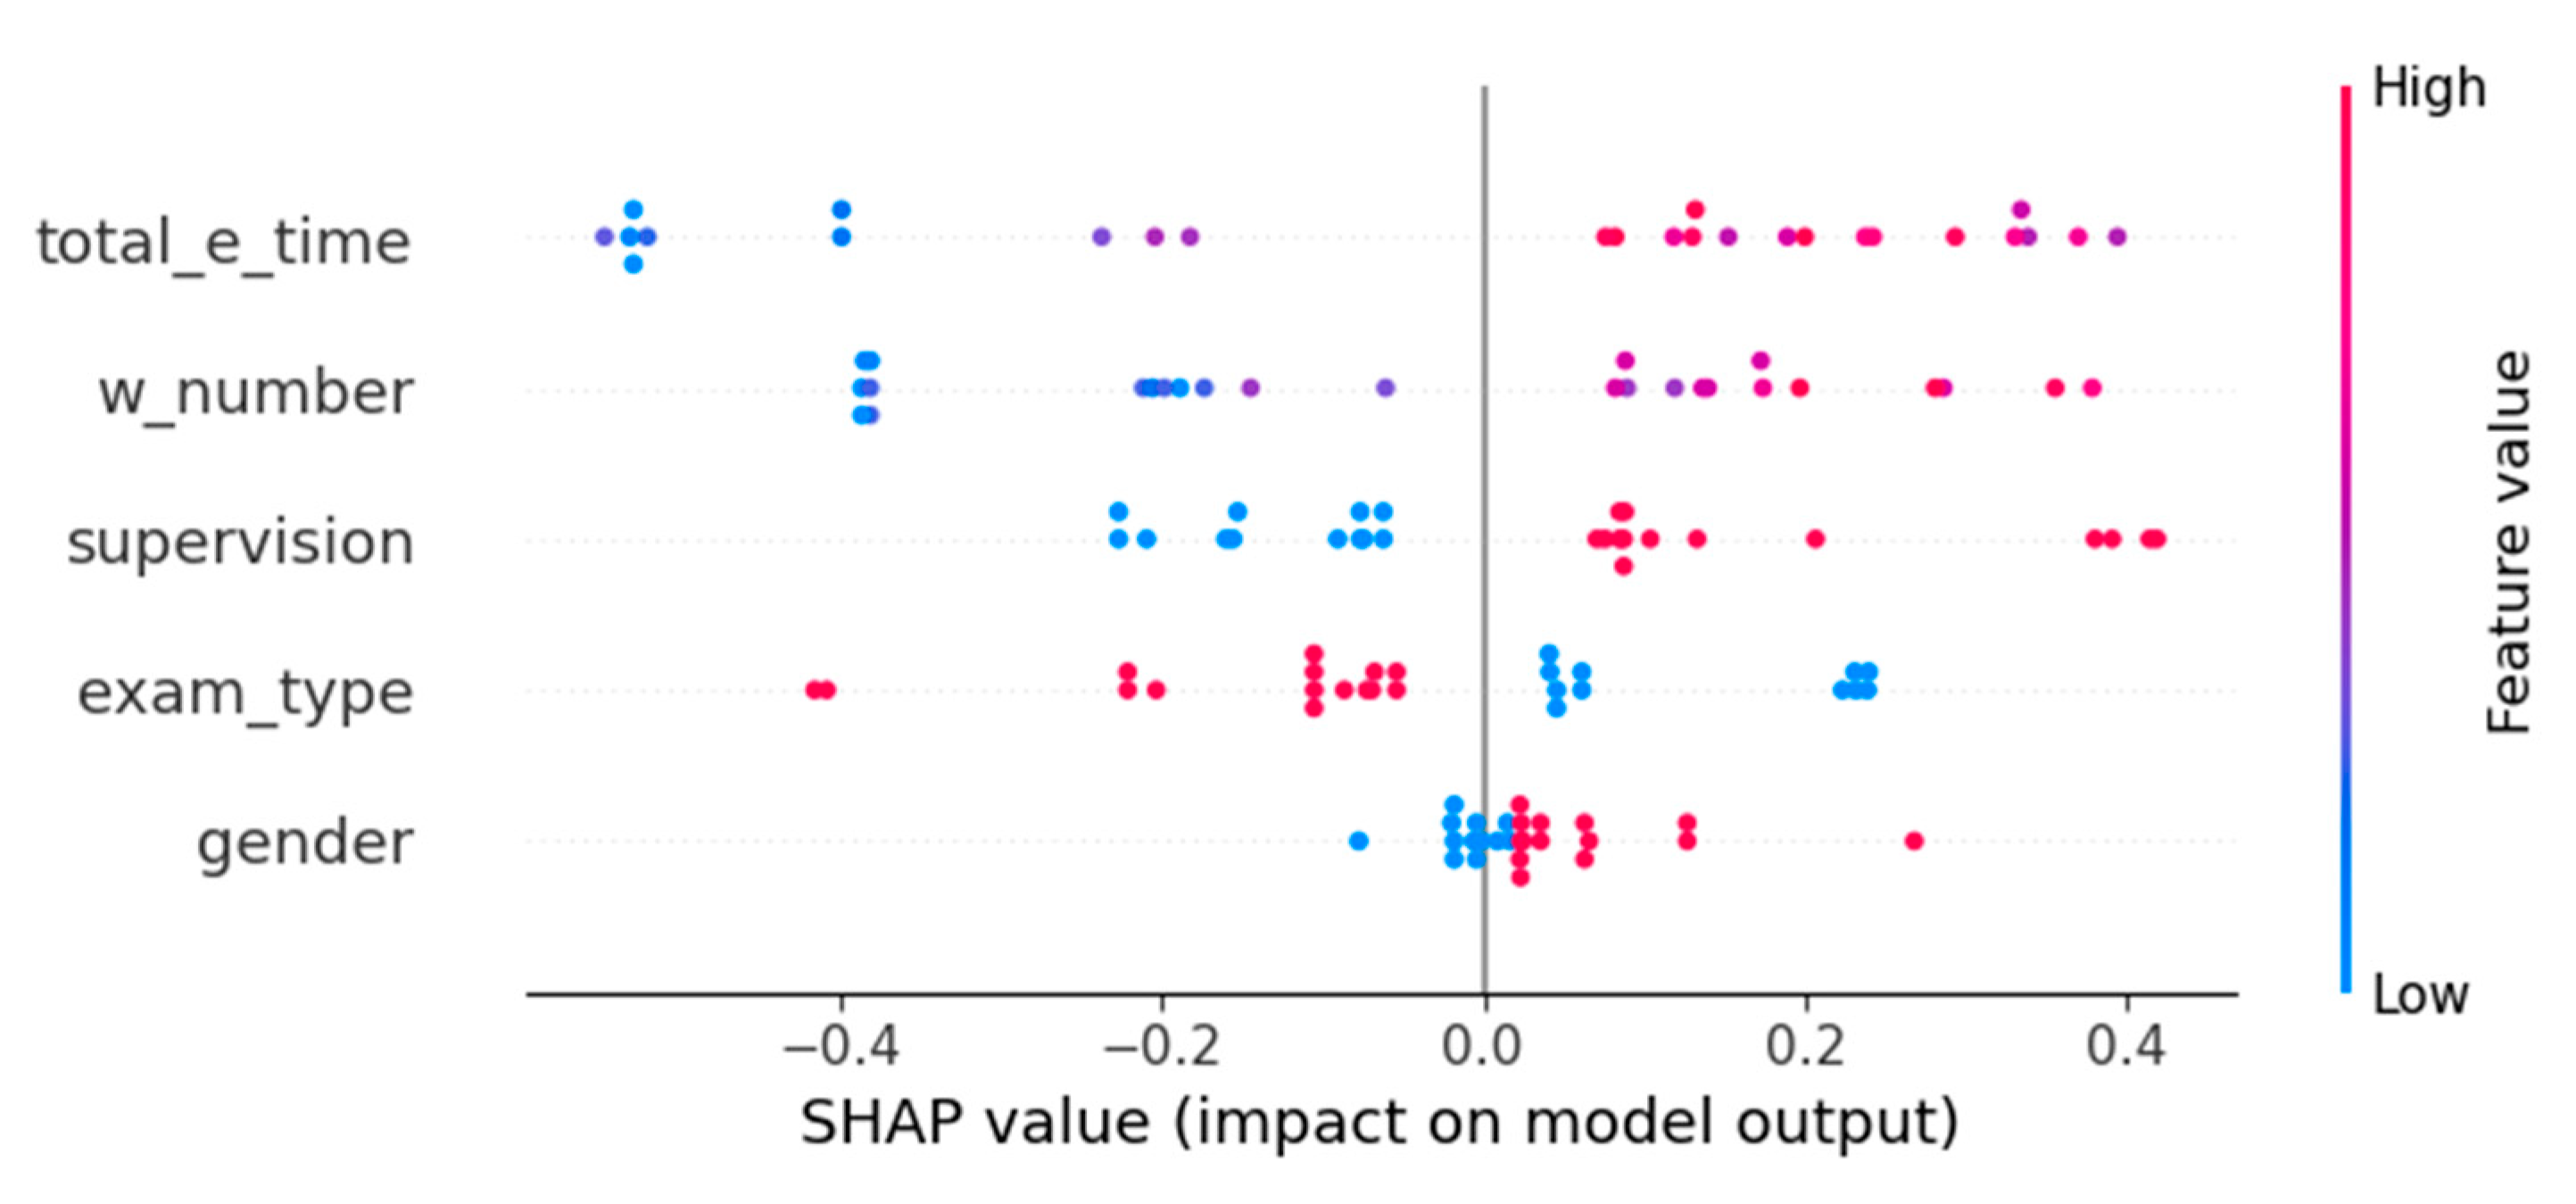
Figure 7 shows the attributes and their influence values that positively and negatively affect the prediction variable in the XGBoost model in the triple classification positive class (copied) shape analysis. It is understood that the ‘total_e_time’, ‘w_number’, and ‘supervision’ attributes contribute more to the model prediction.
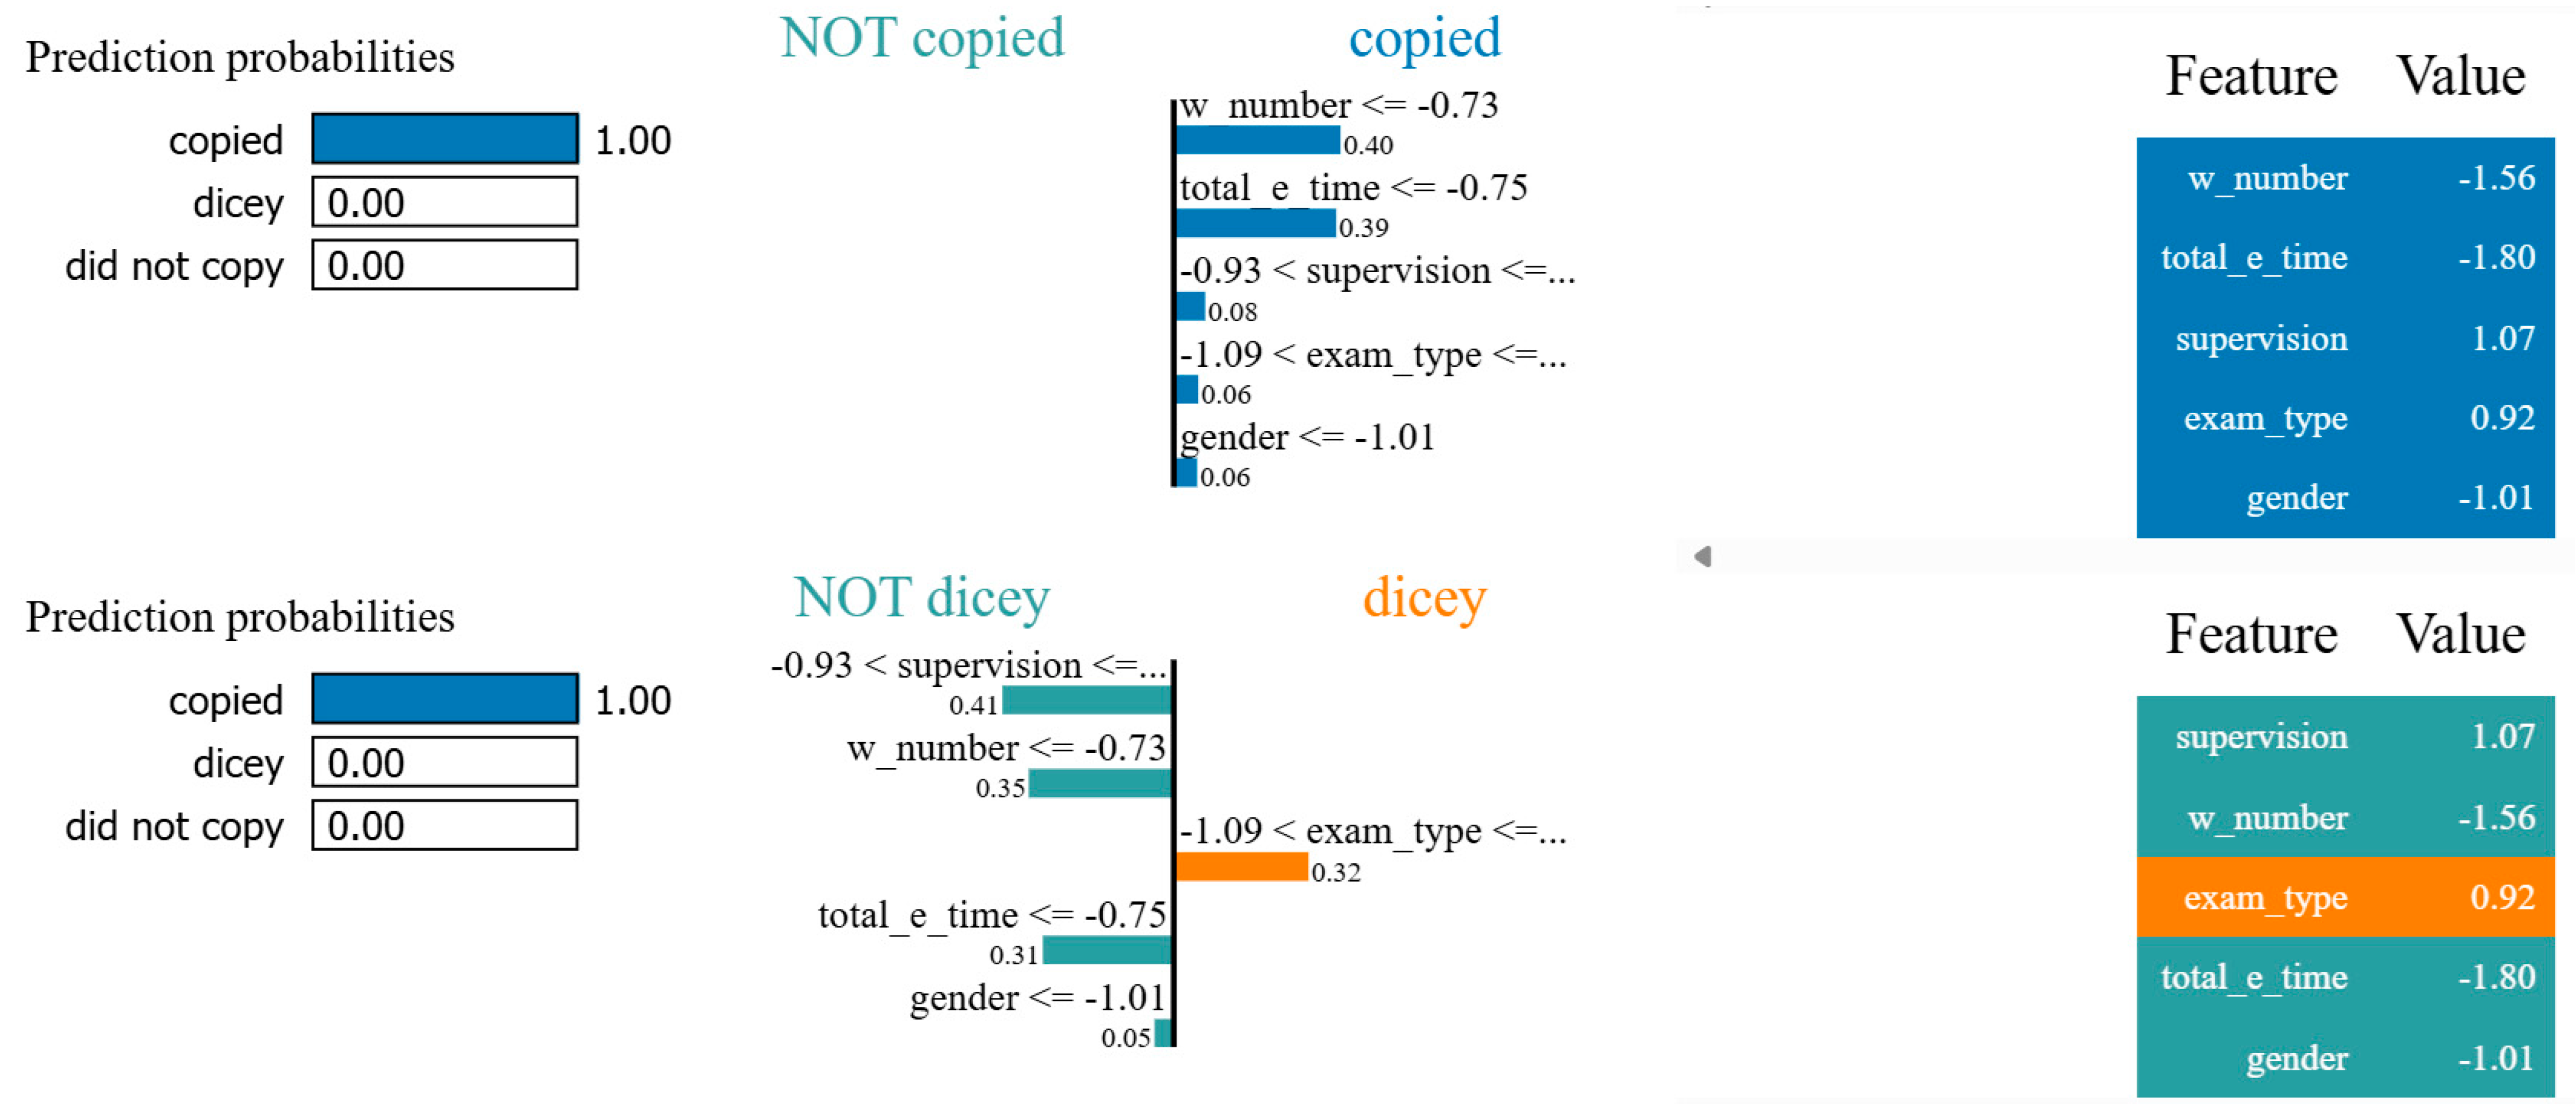
Figure 8 shows the classes and the attributes that are effective on the classes in the triple classification LIME analysis for the XGBoost model. In the analysis, while ‘w_number’ and ‘total_e_time’ attributes increase the prediction rate of the ‘copied’ class, ‘supervision’ and ‘exam-type’ attributes decrease it. In the analysis, the negative attribute values given for the ‘dicey’ class increase the class prediction, while the ‘exam_type’ attribute with a positive value decreases it.
4. Discussion
In this study, deep learning and machine learning-based algorithms were used to perform regression and classification of unethical behaviors in online distance education exams. The main objective of the article is to compare the performances of deep learning and machine learning algorithms using appropriate parameters and to observe the effects of attributes on performance through descriptive analysis. As a result of the literature review, similar methods and studies on the data used are presented in
Table A1 in the
Appendix A.
Table A1 compares the performance values of the proposed models since they have been studied with similar data sets in the literature. An article by Alkan and Kumartaş included data from 1636 exam participants, 10 demographic questions, 170 double-point item responses, and 170 Likert-type items. In the analyses performed, the same accuracy and specificity rates were obtained in all models. Naive Bayes has the highest sensitivity value with a rate of 64% [
14]. In their study, Stefanovic et al. aimed to detect online cheating behavior with 118 student data by proposing K-nearest neighbor, naive Bayes, and gradient boosting algorithms. For the classification of copying behavior, ChatGPT-generated responses and rephrased ChatGPT responses were detected. In the binary classification using the stop word list and stemming algorithm, Random Forest showed the highest performance with a rate of 87% [
17]. In a paper by Alsabhan using the open access 7WiseUp dataset, the performance of the LSTM model was observed to be 90% [
21].
There are few studies in the literature that propose models using deep learning and machine learning algorithms on real online exam data. The most important features that distinguish our study from many other studies are the use of both real exam data and structured exam data prepared by the researchers and the use of exam question answering times. In addition, the model we propose is more advantageous than the costly use of biometric devices that record student behavior and limit privacy [
49,
50,
51], as seen in many studies. In the regression analysis we conducted within the scope of Scenario-1, the best parameters of the 5-layer DNN model we proposed showed a good performance with a test performance value of R
2 = 0.809. This behavior of the model explains well the variance of the independent variables on the dependent variable [
52]. As the number of layers in the layered structure increased, the performance of the model increased linearly up to a certain layer, but too many layers started to decrease performance due to over-learning. In our study, in order to achieve the best performance, the dropout layer prevented the inclusion of randomly selected neurons in the training data. In
Table A1, the LSTM model proposed by Alsabhan was used for large data sets, although its success is high. The data set in our study is not effective in training the LSTM model because it is small [
21,
53,
54]. In our analysis with binary classification in Scenario-2, the 10-layer DNN model showed good performance with an accuracy value of 96.9%, and when other metrics are taken into account, it gives promising results compared to the models [
55]. In the triple classification analysis within the scope of Scenario-3, the XGBoost model that we recommended among the machine learning algorithms appears as the strongest model with 97.7% accuracy, 95.8% sensitivity, 98.5% specificity, and AUC = 1 performance values.
The main limitations of our study are the small number of online exam participants, the lack of always-available online access, and technical problems with access.
If the number of online exam participants is increased in the future, other algorithms of deep learning can be improved. Different exam scenarios can be created, and analyses can be made to detect cheating. By further developing the current study, the student tracking system can be made available to teachers.


