Featured Application
A database of damage patterns for 5 mm-thick glass plates was established. The damage limit velocity of glass impacted by 8 mm and 10 mm steel balls launched by a slingshot was determined. The damage patterns of cone cracks and perforated holes based on velocity were evaluated.
Abstract
Slingshots, traditionally viewed as children’s toys, have recently been modified for malicious purposes, including firing steel balls at building windows, causing significant damage. This misuse necessitates the development of methods to estimate impact velocity and launch point based on glass damage patterns at incident scenes. To achieve this, a comprehensive database correlating glass damage shapes with steel ball diameters is essential. This study conducted experiments to investigate the damage patterns of 5 mm thick glass upon impact with 8 mm and 10 mm steel balls. The damage limit velocities for 8 mm and 10 mm steel balls to cause damage to 5 mm glass were approximately 40 m/s and 21 m/s, respectively. Glass damage was categorized into two types: cone cracks and perforated holes. While cone crack patterns were similar for both 8 mm and 10 mm steel balls, perforation patterns exhibited distinct tendencies. Consequently, the impact velocity of each steel ball can be estimated based on the size of the perforated hole. However, determining the steel ball diameter solely from the size of the cone crack and perforated hole remains challenging.
1. Introduction
Slingshots have been used as weapons for hunting and warfare since ancient times, and many people still use them for hunting and recreational activities in modern times. Conventional slingshots have been commonly used as toys due to their ease of manufacture and the low kinetic energy of their projectiles, which are launched using the elasticity of rubber. However, property damage caused by slingshots (e.g., damage to windshields or glass windows in houses) has recently emerged as a social issue. According to Republic of Korea’s Act on the Safety Management of Guns, Swords, and Explosives [1], if the kinetic energy of a projectile (destructive power) exceeds 0.02 kg-meter, it is classified as a simulated gun and subject to regulations. Nevertheless, various unregistered and modified homemade slingshots have been involved in accidents. These slingshots, with significantly increased force, have raised the possibility of animal fatalities and human injuries (e.g., contusions, penetrations, and fractures) [2]. The kinetic energy of projectiles has significantly increased through the use of sights, high-elasticity rubber bands, and springs, while their accuracy has also improved considerably.
In certain instances, these modified slingshots have been employed for property damage rather than recreational purposes. Modifications to slingshots have included enhancements to increase the velocity of steel projectiles or to enable semi-automatic firing capabilities (Figure 1). Notably, incidents have occurred where steel balls propelled by slingshots have caused damage to glass windows in residential apartments and commercial establishments. In cases of window damage, identifying the specific type of slingshot used and pinpointing the exact location of the offense presents significant challenges. Investigating officers tasked with examining the crime scene face the challenge of estimating the slingshot’s position by analyzing the glass damage patterns. However, the current databases pertaining to such incidents are insufficient for comprehensive analysis.

Figure 1.
Cases of modified slingshots and glass damage by slingshots. (a) Enhanced slingshot (Republic of Korea, 2023); (b) semi-automatic slingshot (Republic of Korea, 2024); (c) criminal case (Republic of Korea, 2023). (Source: photographed by the authors.).
Previous studies have extensively examined the impact resistance and fracture mechanisms of glass. Previous research has explored various aspects of glass impact resistance and fracture mechanisms. Jang and Choi [3] developed an air rifle-type steel ball impact test device to investigate the surface impact resistance of soda glass plate specimens coated with fabric-type glass fiber/epoxy composites. Their study revealed the type and shape of surface cracks in composite glass relative to impact velocity. They observed that the propagation of radial cracks at impact velocities exceeding 100 m/s correlated with a rapid increase in maximum stress and absorption energy. Furthermore, they concluded that brittle materials coated with fabric-type glass fiber/epoxy composite film effectively mitigated surface damage.
Mun et al. [4] examined glass damage patterns, categorizing them into fire-related and external force-induced damage. Using plate glass specimens (300 mm × 300 mm × 5 mm), they identified curved patterns on the impact side for external force damage, with the impact direction discernible from the pattern orientation. Radial damage around the impact point was accompanied by side damage nearly perpendicular to the radiating surface, with debris size increasing proportionally to the distance from the impact point. Song et al. [5] investigated glass fracture patterns resulting from thermal and projectile impact stress for forensic analysis. They simulated thermal impact under fire conditions by varying flame positions and physical impact by altering projectile size and initial distance for slingshots and rifles. Their analysis of the glass surface’s punching part enabled the determination of the projectile’s incident angle. Harshey et al. [6] conducted a study using lead bullets fired from a 0.177″ (4.5 mm) caliber air rifle on glass windows of varying thicknesses (3, 4, and 5 mm), including both regular glass plates and those coated with thin Sun Control Film (SCF). Their findings revealed consistent damage-hole diameters across all glass types, ranging from 4.77 to 7.5 mm, as verified by the chi-square test. No significant differences were observed in fracture patterns between SCF-coated and uncoated plate glass, regardless of which surface received the impact. Tiwari et al. [7] examined multiple fracture patterns in glass plates of different thicknesses by vertically launching round nose pellets from an air rifle at a fixed range. Visual inspection revealed distinct chip patterns: circular for 3 mm glass, oval or triangular-edged for 4 mm glass (both transparent and privacy types), and irregular for 5 mm glass. Hole diameters ranged from 4.1 to 6.7 mm. The authors noted that hole patterns and glass shard characteristics varied significantly between standard firearms and air rifles, suggesting that weapon type could be inferred from analysis of hole diameters in damaged glass. Waghmare [8] examined the distinctive impact pattern of a glass plate collided with fully jacketed bullets fired by an AK-47/56. High-velocity bullets created clean, round holes with outward beveling on the exit side of glass sheets, while crack branching or bifurcation occurred only under sufficiently high applied stress. Abhyankar et al. [9] examined the fracture patterns created on window panes of varying thicknesses when struck by 0.177″ (4.5 mm) lead pellets with round nose and flat nose. The research revealed that both pellet shapes produce consistent hole diameters across the tested samples. Huang et al. [10] performed soft body pendulum impact tests and numerical simulation analyses to assess the structural safety of glass panels. The study uncovered that the flexural strength of the glass material marginally exceeded code specifications, while energy loss escalated with increasing release height until the glass panel fractured.
Despite the valuable insights provided by previous studies on glass fracture patterns caused by various projectiles, a significant research gap exists regarding the specific impact of steel balls fired from slingshots. Previous research has primarily focused on analyzing glass fracture patterns resulting from high-velocity projectile impacts, typically using gas compression systems or rifles. However, there is a notable gap in the literature regarding the fracture patterns of glass when subjected to low-velocity projectiles, such as those fired from slingshots. This gap is particularly crucial in the field of forensic engineering, where understanding the unique damage patterns caused by slingshots is essential for accurate crime scene analysis and reconstruction. To address this research gap, our study investigates glass damage patterns resulting from steel balls with diameters of 8 and 10 mm, which are commonly used in slingshots. By conducting approximately 30 controlled shots and analyzing the resulting damage patterns on 5 mm glass, we aim to generate valuable data for forensic investigators. Furthermore, we explore the potential for identifying collision velocity and steel ball diameter based on observed damage patterns. This research seeks to contribute to the expanding field of forensic ballistics and glass fractography, offering critical insights for law enforcement agencies and forensic experts handling cases involving slingshot-induced glass damage.
2. Experimental Program
2.1. Selection of Glass and Steel Ball
Double-layered low-emissivity (low-e) glass is presently the most prevalent type of glass in Korean apartments and commercial buildings. This configuration consists of two plates of low-e glass separated by an approximately 3 mm air gap. Low-e glass is characterized by its energy-efficient properties, achieved through the application of microscopically thin silver layers to the glass surface, which effectively reflect a significant portion of solar heat or heating energy [11]. For the purposes of this study, a single low-e glass plate with a nominal thickness of 5 mm was selected as the experimental target, representing one component of the commonly used double-layered system. The glass used in these tests had a measured thickness of 4.8 mm, moisture resistance of 0.3, and emissivity of 0.111.
The selection of steel ball sizes for this study was informed by accident investigation results reported by the National Forensic Service of Republic of Korea [12]. These findings indicated that steel balls with diameters of 6, 8, and 10 mm were most frequently encountered in slingshot-related incidents. Based on these data, steel balls with diameters of 8 and 10 mm were chosen for the present investigation to ensure relevance to actual scenarios. The measured mass of 8 mm and 10 mm steel balls ranged within 2.10~2.13 g and 4.14~4.18 g, respectively (Table 1).

Table 1.
Measured mass of 8 and 10 mm steel balls.
2.2. Test Procedure
Considering the house environment, the experiments were conducted in an indoor room where the temperature was maintained at 25 °C by air conditioning. Due to insufficient experimental data on slingshot impacts, this study designed an experiment where a steel ball would strike the glass surface perpendicularly. The experimental protocol was conducted in two distinct stages to determine the damage limit velocity and analyze the resulting damage patterns.
- Stage 1:
- Range determination of initial damage limit velocity—An exploratory experiment was performed to identify the approximate damage limit velocity. Given the unknown nature of the glass’s damage limit velocity, steel balls were propelled at the glass surface at 5 m/s velocity intervals. This systematic approach allowed for the identification of a preliminary damage limit velocity range.
- Stage 2:
- Refined analysis of damage limit velocity and pattern—Following the initial assessment from Stage 1, a more precise experiment was conducted to accurately determine the damage limit velocity and characterize the associated damage patterns. Multiple tests were performed within a ±10 m/s range of the preliminary damage limit velocity identified in Stage 1. This refined approach facilitated a comprehensive analysis of the damage patterns across a narrower velocity spectrum.
To quantify the glass damage patterns resulting from steel ball impacts, two primary features were measured: the cone crack and the perforated hole. The maximum and minimum dimensions of the cone crack were denoted as Cmax and Cmin, respectively. Similarly, the maximum and minimum dimensions of the perforated hole were designated as Pmax and Pmin (Figure 2). These measurements provided a standardized method for characterizing the extent and nature of the impact-induced damage.

Figure 2.
Cone crack and perforated hole of damage.
2.3. Experimental Apparatus
The experimental apparatus was designed to simulate the mechanics of an actual slingshot, utilizing the tension of a rubber strip (Figure 3). The setup comprised four primary components. The first component included a wire rewinder used to introduce tension into the rubber strip; the launch velocity was modulated by adjusting the wire pulling distance. The second component was the projectile launch device, consisting of a wire-connected mechanism and a small cart holding the rubber strip. Upon activation of the trigger, the small cart was released, propelling the steel ball forward. The third component was the velocity measurement system, which employed a commercially available laser velocity measurement to accurately measure projectile speed. The fourth component was a custom-fabricated glass specimen mounting frame, designed to replicate actual window installations. This frame measured 1000 × 1000 mm2, with a width of approximately 75 mm and a thickness of 50 mm, accommodating glass specimens of 850 × 850 mm2. Four push toggle clamps were installed at both the top and bottom of the frame to ensure secure fixation of the glass window. To ensure safety and contain glass fragments post-impact, a large protective shield was incorporated into the apparatus design, as shown in Figure 3.

Figure 3.
Experimental apparatus.
3. Test Results and Analysis
The collision tests between the 8 mm and 10 mm steel balls and glass were respectively performed 37 and 35 times. The test results for the 8 mm and 10 mm steel balls are shown in Table 2 and Table 3 (in ascending order for velocity), and representative experiment images are presented in Figure 4 and Figure 5. In this analysis, Cmax and Cmin represent the maximum and minimum diameters of the cone crack, with Cavg being their average. The ARC (aspect ratio of cone crack, Cmax/Cmin) indicates how close the cone crack is to a perfect circle. CAE and CIE are values obtained by dividing Cmax and Cmin by the kinetic energy of the steel ball, respectively, with CEavg as their average. Similarly, Pmax and Pmin denote the maximum and minimum diameters of the perforated hole, with Pavg as their average, and the ARP (aspect ratio of perforated hole, Pmax/Pmin) represents the circularity of the perforated hole. PAE and PIE are calculated by dividing Pmax and Pmin by the kinetic energy of the steel ball, with PEavg as their average.
Table 2.
Test results with 8 mm steel ball.
Table 3.
Test results with 10 mm steel ball.

Figure 4.
Selected damage pattern of glass under impact load with 8 mm steel ball.
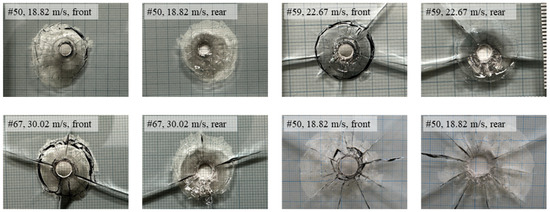
Figure 5.
Selected damage pattern of glass under impact load with 10 mm steel ball.
Damage limit velocity: The experimental results for the 8 mm steel ball collisions with glass revealed consistent damage occurrence at impact velocities of 38.69 m/s (Test No. 13 in Table 2) and above. For impact velocities of 38.31 m/s or less (Test No. 1 to 12 in Table 2), damage occurred with a probability of approximately 40%. No damage was observed in Test No. 1 and 2, with impact velocities of 34.31 and 34.37 m/s, respectively. These findings suggest that the minimum velocity required for an 8 mm steel ball to potentially damage 5 mm low-e glass is approximately 35 m/s. The velocity range of 35 to 39 m/s is considered the probabilistic damage limit velocity range for the 8 mm steel ball. Given that damage occurred in all experimental cases with collision velocities of 40 m/s or higher, 40 m/s is considered as the damage limit velocity.
For the 10 mm steel ball collisions, damage was observed in all cases at impact velocities of 21.05 m/s (Test No. 56 in Table 3) and above. In contrast, for impact velocities of 19.9 m/s or less (Test No. 38 to 55 in Table 3), damage occurred with a probability of approximately 22%. No damage was observed in Test No. 38 and 39, with impact velocities of 14.52 and 16.05 m/s, respectively. These results indicate that the minimum velocity required for a 10 mm steel ball to potentially damage 5 mm low-e glass is approximately 16.05 m/s. Consequently, the velocity range of 16 to 20 m/s is considered the probabilistic damage limit velocity range for the 10 mm steel ball. As damage occurred in all experimental cases with collision velocities of 21 m/s or higher, 21 m/s is considered as the damage limit velocity for the 10 mm steel ball.
Cone crack: The aspect ratio of cone cracks (ARC) was calculated by dividing Cmax by Cmin, with results presented in Figure 6. For the ARC of 8 mm steel balls, the average, variance, and standard deviation were 1.18, 0.008, and 0.092, respectively. For the ARC of 10 mm steel balls, the average, variance, and standard deviation were 1.16, 0.010, and 0.098, respectively. These results indicate similar elliptical geometries regardless of steel ball size. Figure 7 illustrates the relationship between Cavg (average of Cmax and Cmin) and kinetic energy. Although Cavg exhibited an increasing trend with kinetic energy for both 8 mm and 10 mm steel balls, the wide dispersion of data made it challenging to identify clear tendencies. Consequently, the relationship between CEavg and kinetic energy was analyzed and is presented in Figure 8. The results for both 8 mm and 10 mm experiments were found to follow an exponential function (y = a/xn + b), suggesting that distinguishing between 8 mm and 10 mm steel ball impacts based solely on measured cone crack size is difficult. However, when comparing instances where Cavg values were identical for 8 mm and 10 mm steel balls (Figure 7), it was observed that the 10 mm steel ball produced similar results to the 8 mm steel ball at lower kinetic energies.
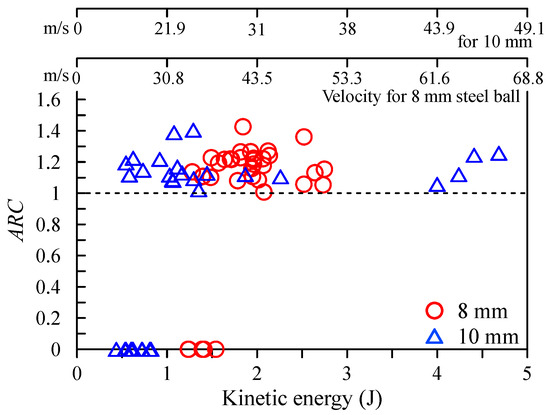
Figure 6.
Relation of ARC and kinetic energy.
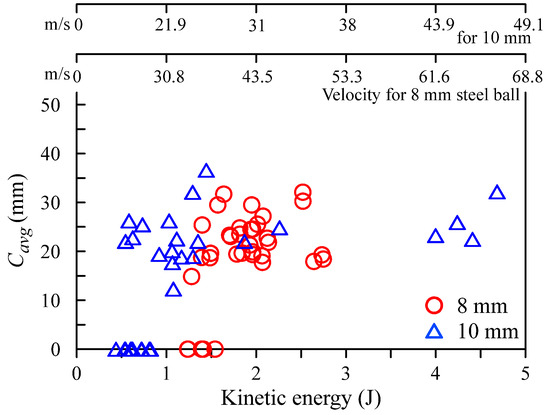
Figure 7.
Relation of Cavg and kinetic energy.

Figure 8.
Relation of CEavg and kinetic energy.
Perforated hole: The aspect ratio of the perforated hole (ARP) was calculated by dividing Pmax by Pmin, with results presented in Figure 9. For the ARP of 8 mm steel balls, the average, variance, and standard deviation were 1.02, 0.01, and 0.07, respectively. For the ARP of 10 mm steel balls, the average, variance, and standard deviation were 1.0, 0.004, and 0.06, respectively. These results indicate similar elliptical geometries regardless of steel ball size. These results indicate similar elliptical geometries regardless of steel ball size. Compared to the cone crack, a relatively circular fracture geometry was observed. Figure 10 illustrates the relationship between Pavg and kinetic energy, revealing a proportional relationship for both 8 mm and 10 mm steel balls. Similar to the cone crack analysis, the same Pavg occurred at lower kinetic energies for the 10 mm steel ball, suggesting that mass has a more significant impact on damage despite equivalent kinetic energies. Figure 11 depicts the relationship between PEavg and kinetic energy. As observed with the cone cracks, PEavg decreased in the form of a convergence curve as kinetic energy increased. While both 8 mm and 10 mm steel ball results exhibited exponential function forms (y = a/xn + b) for the cone cracks, the perforated holes demonstrated distinct patterns depending on steel ball size. The exponent in the exponential function appears to be larger for the 8 mm steel ball. Notably, PEavg values predominantly remained below 4 in the kinetic energy range of 1.5 to 3 J, with only three cases from the 10 mm steel ball experiments falling within this range. This observation suggests that analysis of perforated holes may be more effective in determining the impact velocity of steel balls from glass window damage at accident scenes.
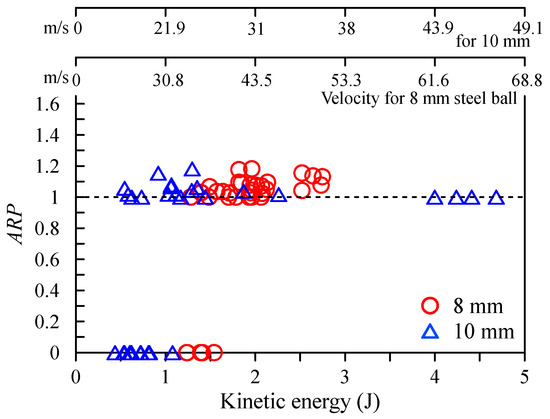
Figure 9.
Relation of ARP and kinetic energy.
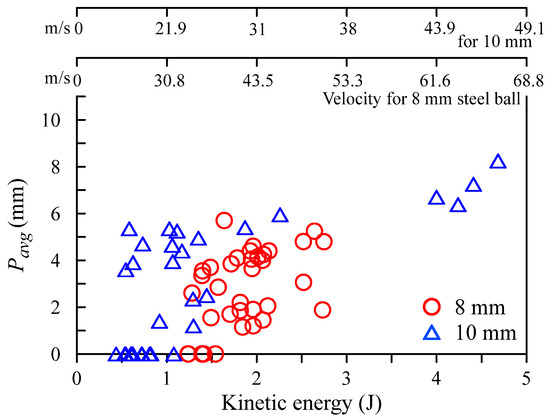
Figure 10.
Relation of Pavg and kinetic energy.

Figure 11.
Relation of PEavg and kinetic energy.
4. Discussion and Conclusions
In this study, impact tests were conducted to identify glass damage patterns caused by slingshots and establish a comprehensive database. The experiments involved launching 8 and 10 mm steel balls at various velocities using a test setup simulating a slingshot, targeting 5 mm thick low-emissivity (low-e) glass. Subsequent analysis focused on the cone cracks and perforated holes generated in the glass upon impact.
The damage limit velocities for 8 and 10 mm steel balls were determined to be 40 and 21 m/s, respectively. For the 8 mm steel ball, a probabilistic damage limit velocity range of 25–39 m/s was identified, with damage occurring at approximately 40% probability within this range. The 10 mm steel ball exhibited a probabilistic damage limit velocity range of 15–20 m/s, with damage occurring at approximately 22% probability.
Analysis of damage patterns involved dividing the maximum and minimum diameters of cone cracks and perforated holes by kinetic energy. The relationship between CEavg and kinetic energy revealed similar exponential functions for both 8 and 10 mm steel ball collisions. However, the relationship between PEavg and kinetic energy demonstrated distinct exponential functions, with the 8 mm steel ball exhibiting a relatively larger exponent, resulting in a flatter curve.
The study revealed significant differences in perforated hole damage patterns between 8 and 10 mm steel balls, while cone crack patterns showed minimal variation. The magnitude of damage caused by kinetic energy varied considerably, likely due to the brittle nature of glass. The distinct relationship between PEavg and kinetic energy for different steel ball diameters suggests that impact velocity can be estimated based on perforated hole size measured at accident scenes. However, distinguishing between 8 and 10 mm steel balls remains challenging based solely on perforation or cone crack diameters within the simulated slingshot power range.
The reason for the relatively consistent size of cone cracks is attributed to the interplay between the steel ball diameter and the glass plate’s thickness and material properties. In all damaged specimens, cone cracks manifested at the rear of the impact point. According to scabbing theory, the rear face failure is induced by tension-controlled shear stress resulting from the impact force (Kim and Kang [13]; Society of Material Science of Japan [14]). Given constant glass thickness and material composition, the impact force required to initiate rear face damage—specifically, cone crack formation in this study—shows relatively low variation. It is hypothesized that a portion of the steel ball’s kinetic energy is initially consumed in the scabbing process, with the surplus energy contributing to glass penetration. As a result, it is considered that the size of the perforated hole exhibits a tendency to increase with rising impact velocity, while cone crack dimensions show relatively minimal variation.
From a forensic science perspective, our experimental results can be utilized to narrow down the velocity range of projectiles. When investigating property damage caused by slingshots to identify suspects, determining the firing location is crucial for tracking the perpetrator. The majority of cases investigated by the National Forensic Service of Korea have involved 8 mm and 10 mm steel balls. If steel balls are retrieved from the crime scene, their diameter and the resulting fracture pattern can be used to estimate the collision velocity, which in turn helps identify the firing location. In cases where no steel balls are retrieved, collision velocities can be estimated based on the assumption of 8 mm and 10 mm steel balls being used. We believe that the findings of this study can significantly contribute to predicting firing locations based on these estimated velocities, thereby enhancing the efficacy of forensic investigations.
The derived minimum damage velocities for each steel ball diameter and impact velocity data based on perforation size are expected to contribute to narrowing the maximum range and expected launch range in parabolic motion analysis. To enhance the applicability of these findings, future research should focus on collecting additional experimental data for various steel ball diameters (6–15 mm), collision angles (0–80°), diverse temperature–humidity conditions, and high-impact velocities (up to 150 m/s). In particular, sufficient data acquisition through repeated experiments under identical collision conditions is necessary. After securing a large amount of experimental data, follow-up research should analyze results using cutting-edge tools such as machine learning algorithms. These advancements will contribute to more accurate forensic assessments in cases involving projectile impacts, providing a comprehensive understanding of glass damage patterns across a wide range of variables and conditions.
Author Contributions
Conceptualization, S.K. and S.H.; methodology, S.K.; software, S.K., S.P. and S.H.; validation, J.-H.M. and S.H.; formal analysis, J.-H.M.; investigation, S.K., S.P. and C.C.; resources, S.K., S.P. and C.C.; data curation, J.-H.M.; writing—original draft preparation, S.K., J.-H.M. and S.H.; writing—review and editing, S.K. and S.H.; visualization, S.K. and S.H.; supervision, S.K. and S.H.; project administration, S.K.; funding acquisition, S.K., S.P. and C.C. All authors have read and agreed to the published version of the manuscript.
Funding
This work was supported by National Forensic Service (NFS2024SAF02) and National Research Foundation of Korea (NRF) Grant (NRF-2023R1A2C2006400).
Institutional Review Board Statement
Not applicable.
Informed Consent Statement
Not applicable.
Data Availability Statement
The original contributions presented in the study are included in the article and further inquiries can be directed to the corresponding author.
Conflicts of Interest
The authors declare no conflicts of interest.
References
- Ministry of Government Legislation. Control of Firearms, Knives, Swords, Explosives, Etc. (ACT No. 17689). 2020. Available online: https://elaw.klri.re.kr/kor_service/lawView.do?hseq=55744&lang=KOR (accessed on 4 November 2024).
- Vinuthinee, N.; Azreen-Redzal, A.; Juanarita, J.; Zunaina, E. Gunshot-like Wound Caused by Sling Shot Injury—A Case Report. Int. Med. Case Rep. J. 2015, 8, 47–50. [Google Scholar] [CrossRef] [PubMed]
- Chang, J.Y.; Choi, N.S. Surface Fracture Behaviors of Unidirectional and Cross Ply Glass Fiber/Epoxy Lamina-Coated Glass Plates under a Small-Diameter Steel Ball Impact. Compos. Res. 2009, 22, 33–40. (In Korean) [Google Scholar] [CrossRef]
- Mun, Y.S.; Sa, S.Y.; Choi, M.S.; Choi, J.H.; Kim, Y.S. A study on the identification of the causes according to the broken plane types of glass. J. Korean Inst. Fire Investig. 2003, 3, 12–15. (In Korean) [Google Scholar]
- Song, J.Y.; Sa, S.H.; Nam, J.W.; Kim, D.H.; Choi, Y.W.; Kim, J.P.; Goh, J.M.; Park, N.K. Forensic Scientific Analysis for Glass Breakdown Patterns. J. Korean Soc. Saf. 2012, 27, 28–35. (In Korean) [Google Scholar] [CrossRef]
- Harshey, A.; Srivastava, A.; Yadav, V.K.; Nigam, K.; Kumar, A.; Das, T. Analysis of glass fracture pattern made by .177″ (4.5 mm) Caliber air rifle. Egypt. J. Forensic Sci. 2017, 7, 20. [Google Scholar] [CrossRef]
- Tiwari, N.; Harshey, A.; Das, T.; Abhyankar, S.; Yadav, V.K.; Nigam, K.; Anand, V.R.; Srivastava, A. Evidential significance of multiple fracture patterns on the glass in forensic ballistics. Egypt. J. Forensic Sci. 2019, 9, 22. [Google Scholar] [CrossRef]
- Waghmare, N.P. Distinctive Impact Pattern of Ak 47/56 Projectile on Glass Fracture. J. Forensic Sci. Crim. Investig. 2018, 8, 555746. [Google Scholar] [CrossRef]
- Abhyankar, S.; Srivastava, A.; Yadav, V.K.; Nigam, K.; Harshey, A. Glass Fractures Made from Different Pellet Shapes—A Preliminary Stduy. J. Forensic Sci. Crim. Investig. 2018, 8, 555739. [Google Scholar] [CrossRef]
- Huang, B.; Hu, W.; Xu, K.; Guan, X.; Lu, W. Experimental and Numerical Investigation on Glass Panel Subjected to Pendulum Impact. Int. J. Impact Eng. 2023, 173, 104457. [Google Scholar] [CrossRef]
- Bocchese, F.; Brown, I.; Cornil, D.; Moskovkin, P.; Muller, J.; Kenny, S.D.; Smith, R.; Lucas, S. Low-E Glass Improvement by the understanding and Control of the Ag Growth. Appl. Surf. Sci. 2023, 611, 155600. [Google Scholar] [CrossRef]
- Park, S.; Jeon, S.; Seo, H.; Lee, J.; Choi, C.; Kim, S. Assessment of the Kinetic Energy and Human Safety Risks Associated with Steel Balls Fired from Slingshots. KCSI Mag. 2023, 21, 5–6. (In Korean) [Google Scholar]
- Kim, S.; Kang, T.H.-K. Development of Energy-Based Impact Formula-Part II: Scabbing Depth, Scabbing Limit, and Perforation Limit. Appl. Sci. 2020, 10, 5481. [Google Scholar] [CrossRef]
- Society of Material Science of Japan. Impact Engineering; Nikkan Kogyo Shimbun Ltd.: Tokyo, Japan, 1998. (In Japanese) [Google Scholar]
Disclaimer/Publisher’s Note: The statements, opinions and data contained in all publications are solely those of the individual author(s) and contributor(s) and not of MDPI and/or the editor(s). MDPI and/or the editor(s) disclaim responsibility for any injury to people or property resulting from any ideas, methods, instructions or products referred to in the content. |
© 2025 by the authors. Licensee MDPI, Basel, Switzerland. This article is an open access article distributed under the terms and conditions of the Creative Commons Attribution (CC BY) license (https://creativecommons.org/licenses/by/4.0/).