1. Introduction
The tunnel lining is a permanent structural component essential for maintaining tunnel stability, with rebar serving as its core material. This reinforcement plays a crucial role in ensuring the stability and safety of the tunnel. Rebar not only enhances the load-bearing capacity of the lining structure but also significantly reduces its self-weight, thereby creating a tunnel that is both lighter and structurally robust. Consequently, rebar is indispensable in tunnel construction, and its inspection plays a critical role in assessing tunnel lining quality. For scenarios where sampling and direct inspection are challenging, non-destructive testing techniques are commonly applied [
1]. Ground-penetrating radar (GPR) technology, in particular, has significantly enhanced both the quality and efficiency of engineering assessments [
2,
3]. In conventional GPR-based quality inspections, hyperbolic features within radar grayscale images are manually interpreted, or alternatively, signal features are processed to facilitate rebar identification. Recently, deep learning methods [
4] have gained prominence for their ability to extract detailed features from radar gray images, thus enabling accurate detection of targets within tunnel linings.
The data processing method identifies rebar by utilizing raw radar data, performing data preprocessing and signal feature analysis. This approach effectively leverages the unique imaging principles of GPR and maximizes the advantages inherent in the data. Wang Yanhui et al. [
5] proposed an algorithm based on a genetic algorithm for automatic multi-target detection in tunnel lining radar profile data. This method collects all local maxima in one-dimensional time waveform (A-Scan) GPR data to generate a binary image. It then searches for the optimal fitting hyperbola at each potential location within the binary image, matching it to the target’s reflection signal according to predefined matching criteria. This approach successfully identifies rebar in both simulated and measured data. Li Chuan et al. [
6] identified rebar by analyzing the propagation characteristics of electromagnetic waves within concrete. They determined the peak points associated with rebar in the one-dimensional time waveform (A-Scan). Based on these peak points, they reconstructed the hyperbolic shape of rebar in the two-dimensional time waveform (B-Scan), facilitating accurate rebar identification.
The current popular deep learning approach involves feature extraction from radar-generated images, enabling the identification of targets such as rebar within tunnel linings, as well as the detection of subsurface defects. This method is highly efficient and allows for the direct processing of radar images. In recent years, deep learning-based target detection methods have emerged as a major research focus. Z. Xiang et al. [
7] introduced AlexNet as an effective solution for automatic rebar detection in GPR data. Compared to traditional CNNs, AlexNet demonstrates higher accuracy in identifying rebar in real-world construction scenarios. P. Asadi et al. [
8] proposed a computer vision-based method for automatic rebar detection in complex GPR images of highly deteriorated concrete bridge decks. W. Lei et al. [
9] employed Faster R-CNN along with data augmentation strategies to identify hyperbolic features in GPR B-Scan images. This approach not only detects the presence of buried objects in B-Scans but also accurately identifies candidate hyperbolic regions. Y.C. Zhang et al. [
10] proposed an SSD model-based approach for the automatic detection of corrosion-prone environments in bridge deck GPR data. This method comprises data preprocessing, automatic rebar extraction, and corrosion environment mapping, significantly enhancing detection accuracy in corrosive environments. F. Cui et al. [
11] developed a Faster R-CNN-based framework for automatic recognition and tracking of highway-layer interfaces. This framework facilitates end-to-end, real-time detection, achieving an accuracy of 98.30% through extensive experimentation on highway GPR datasets. O. Apaydın et al. [
12] utilized three deep learning techniques to detect objects with diverse geometric shapes in GPR images. They employed Faster R-CNN, YOLOv5, and SSD algorithms to identify parabolic structures within GPR images and classify objects based on geometric characteristics. Z. Fang et al. [
13] proposed an automatic defect detection solution using GPR systems in combination with Faster R-CNN for detecting subgrade voids and similar anomalies.
This study employs a Faster R-CNN [
14] model specifically designed to focus on hyperbolic features, facilitating accurate rebar identification within GPR B-Scan images. Initially, a DAS self-attention mechanism is employed to enhance the model’s focus on hyperbolic features within the feature map. Subsequently, an HAT module is integrated into the model to further improve the detection of rebar-specific hyperbolic features. The model was trained using GprMax-simulated [
15,
16] radar images alongside field-collected GPR images, enabling rebar identification within radar images of tunnel linings. This approach provides a targeted method for rebar detection in tunnel structures, focusing specifically on hyperbolic features.
2. Materials and Methods
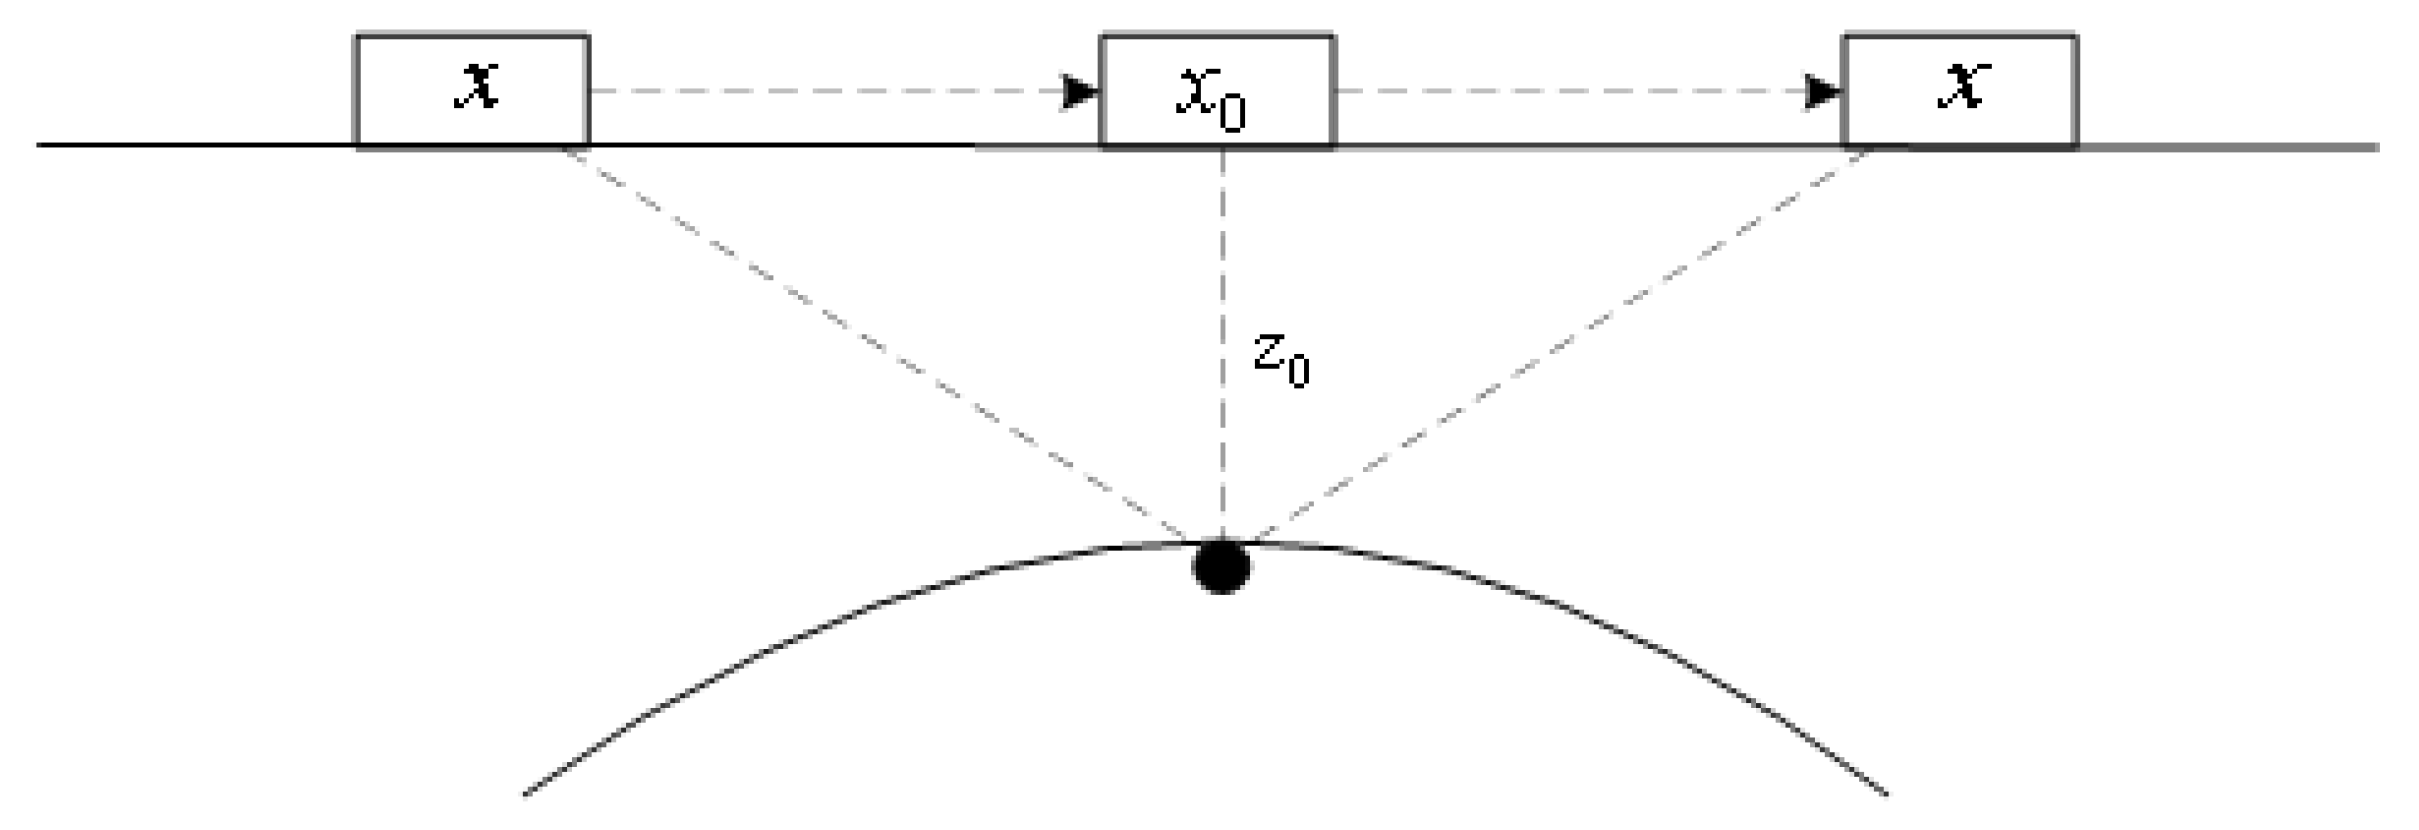
In ground-penetrating radar (GPR) images, subsurface targets like rebar typically manifest as hyperbolic shapes. This occurs due to the electromagnetic waves emitted by the GPR, which reflect back to the receiver at varying times upon encountering underground objects. The propagation time of electromagnetic waves emitted by the GPR is related to the distance between the GPR antenna and the target object, and this relationship can be expressed as
where
v denotes the propagation speed of electromagnetic waves within the medium. As the GPR antenna moves, the reflection points at different positions vary over time, generating a hyperbolic trajectory.
Specifically, if the radar antenna emits electromagnetic waves and receives a reflected signal at position
x, the hyperbolic trajectory of the target in the image can be expressed as
In this equation,
represents the coordinates of the target object.
Figure 1 illustrates the appearance of rebar as a hyperbolic curve in the radar image.
Multiple reflections of radar waves from the rebar and its surrounding environment result in the appearance of hyperbolic curves in the radar image. These curves represent the reflection signals of radar waves traveling along different paths. A single hyperbolic curve is typically associated with the reflection from a single rebar, where the radar waves are reflected at various angles and times depending on the rebar’s position relative to the radar transmitter and receiver. In the case of multiple rebars, each rebar produces a distinct hyperbolic curve, leading to the presence of several overlapping or separate hyperbolic patterns in the radar image. This phenomenon occurs due to the varying reflection paths and times of the radar waves as they interact with multiple rebars located at different positions within the structure.
A Convolutional Neural Network (CNN) is highly effective in image processing, particularly in extracting local features. In radar images, the hyperbolic patterns representing rebar can be detected through CNN operations, allowing for the extraction of local features such as edges and corner points. In GPR images, the hyperbolic features of rebar are represented as changes in local characteristics, specifically as variations in amplitude. This study integrates A DAS that utilizes Deformable Convolution (DC) and Depthwise Separable Convolution (DSC), enabling the model to better adapt to the diversity and complexity of rebar reflection features in radar images. The DAS [
17] mechanism dynamically adjusts the attention area, focusing on capturing prominent hyperbolic reflection information. This significantly enhances the recognition capability for multiple hyperbolic reflections of rebar. Building upon the work in [
18] and the concept of self-attention mechanisms, this paper introduces a hyperbolic attention mechanism designed to enhance the model’s ability to focus specifically on hyperbolic shapes in radar images, such as those formed by rebar.
In the Faster R-CNN model based on multi-hyperbolic attention, the Convolutional Neural Network (CNN) extracts deep features from the image through multiple layers of convolution and pooling operations, particularly capturing the hyperbolic features exhibited by rebar. The extraction of these features provides abundant information for the subsequent Region Proposal Network (RPN). The RPN slides a window over the feature map to generate candidate regions, classifying them and performing bounding box regression to rapidly screen areas likely to contain rebar. Finally, the classifier evaluates each candidate region to determine if it contains rebar, also performing bounding box regression to precisely adjust the position and size of the candidate boxes, thus improving detection accuracy and spatial Precision.
The algorithm framework of this study is illustrated in
Figure 2. Faster R-CNN is a deep learning algorithm for object detection, consisting of two main components: the Region Proposal Network (RPN) and the detection network. First, the input image is processed by a Convolutional Neural Network (CNN) to extract a feature map. The RPN then generates candidate regions on this feature map, computing scores and performing bounding box regression for each region. Subsequently, these candidate regions are fed into the detection network for classification and precise bounding box adjustments, ultimately producing the class and location of each target. Faster R-CNN improves detection accuracy through end-to-end training.
This paper presents three modifications to the Faster R-CNN framework. Firstly, ResNet50 was selected as the baseline of the backbone due to its proven balance of performance and computational efficiency, as demonstrated in object detection tasks on challenging datasets like MS COCO. Specifically, ResNet50 combined with the Deformable Attention to Capture Salient Information (DAS) mechanism served as the feature extraction module for ground-penetrating radar (GPR) images. According to previous evaluations [
17], in object detection experiments using the Faster R-CNN model on the MS COCO dataset, the ResNet50+DAS model surpasses other backbones, such as ResNet-101, SENet-50, CBAM-50, and Triplet Attention-50, in terms of metrics like
,
,
,
, and
, while maintaining a lower parameter count compared to larger models (e.g., ResNet-101). The DAS mechanism integrated Depthwise Separable Convolution (DSC) and Deformable Convolution (DC) to enhance attention on salient regions and compute dense pixel-directional attention weights. The structure of the feature extraction module is shown in
Figure 3. In each residual block of ResNet50, the DAS attention mechanism was incorporated to focus on significant image regions, thereby enhancing convolutional performance and training efficacy.
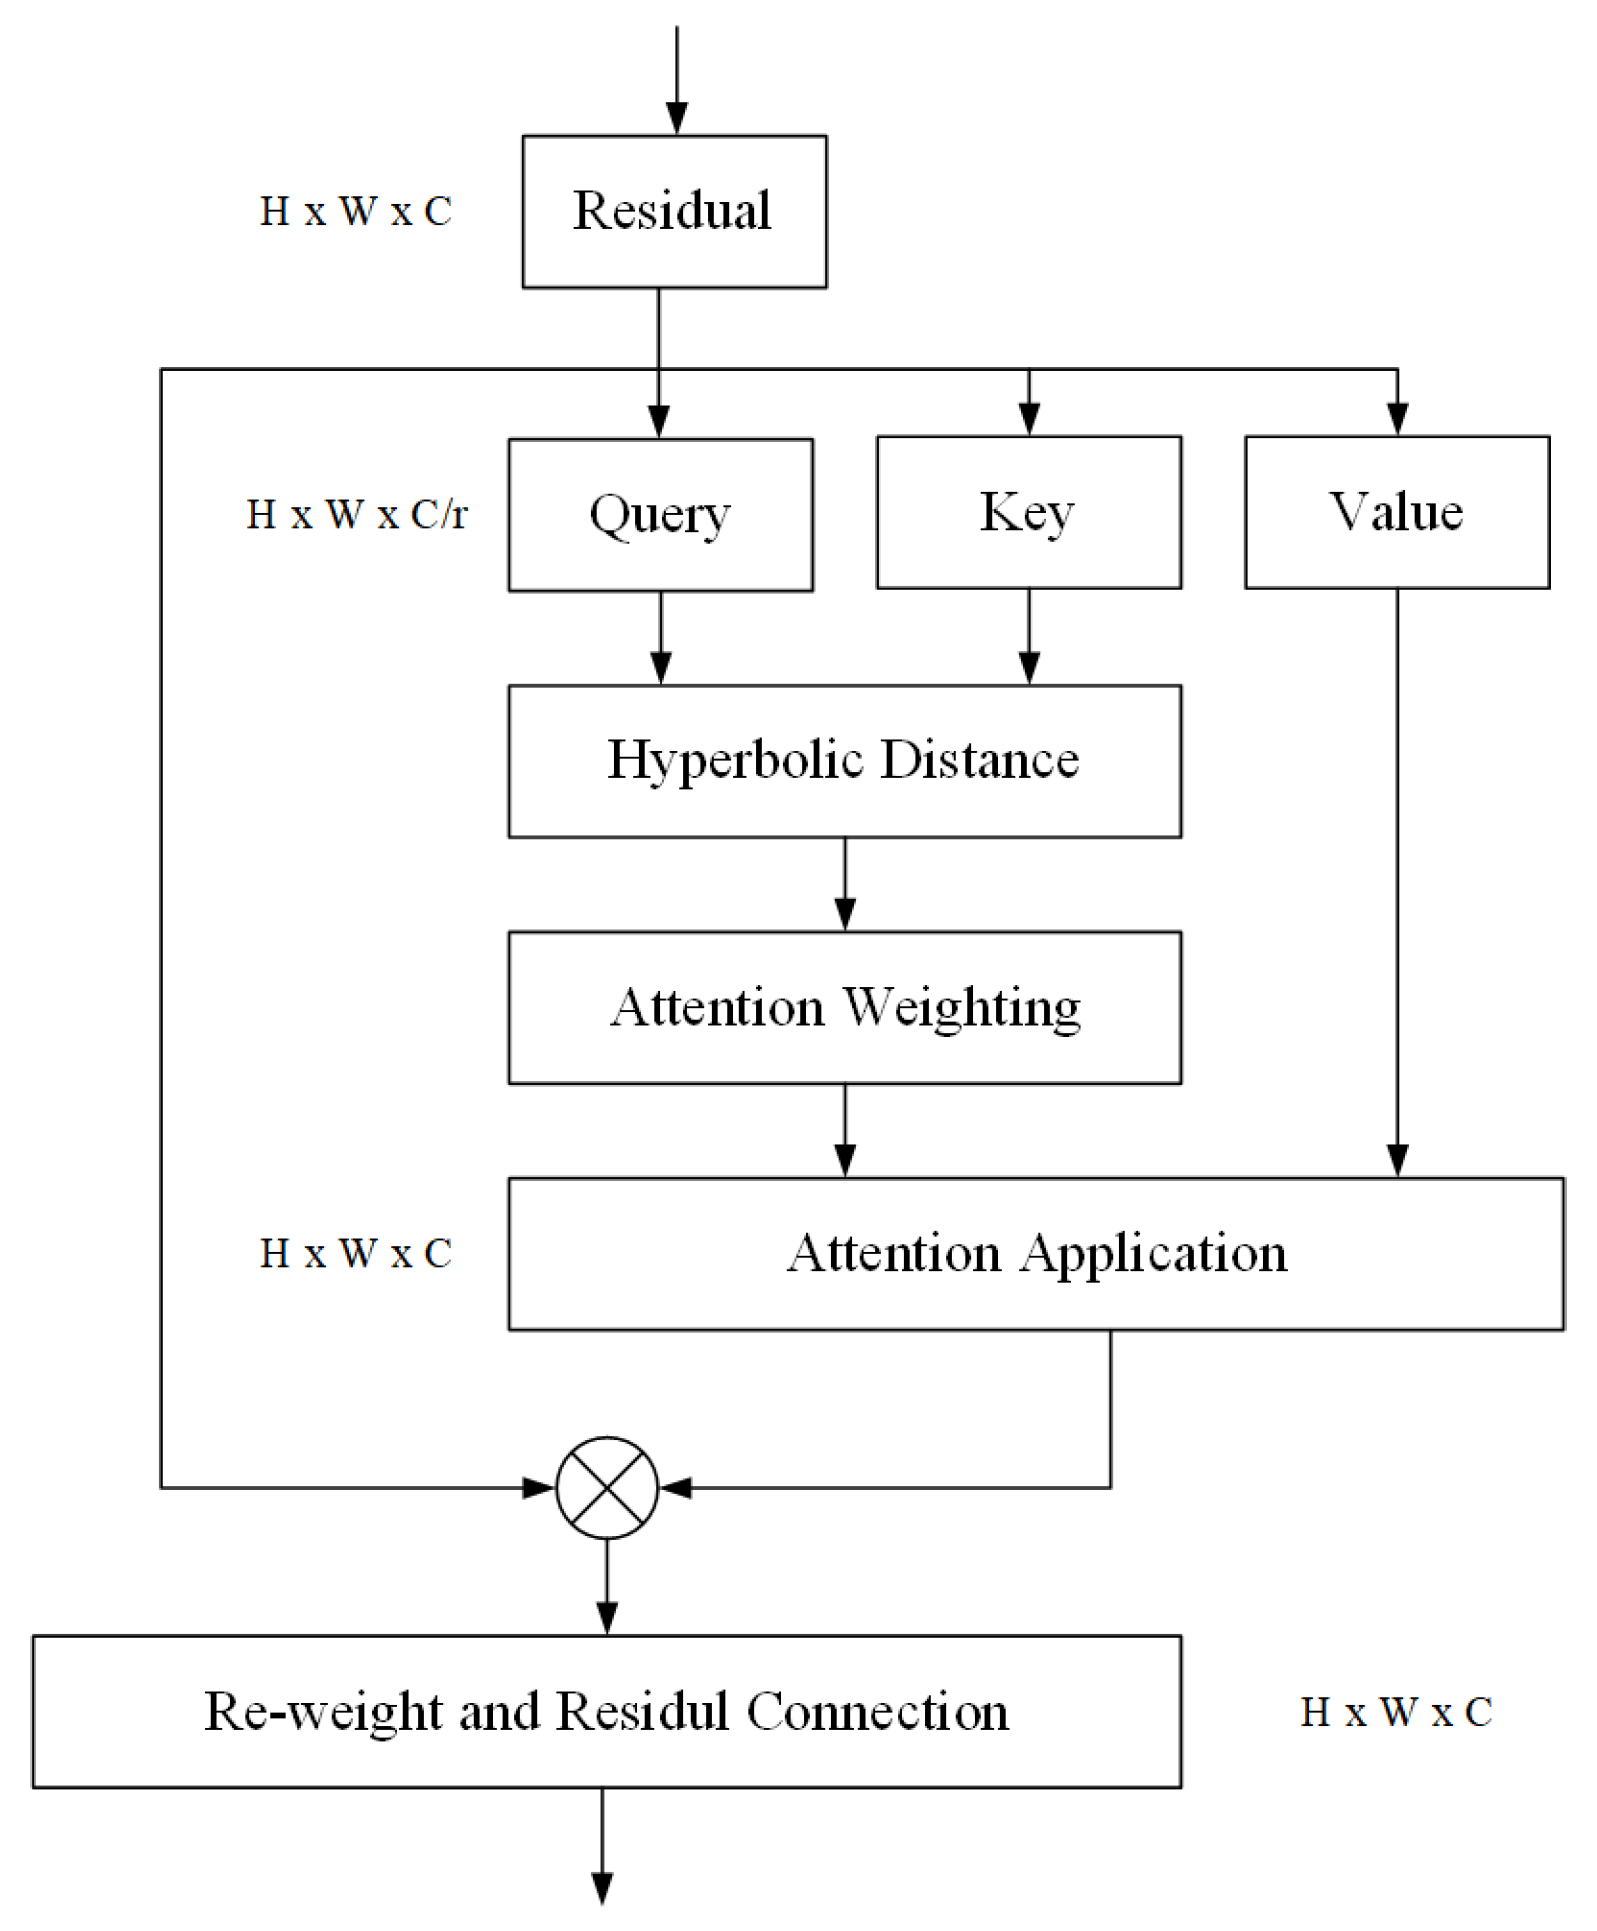
Secondly, a hyperbolic attention transformer (HAT) module was introduced before the Region Proposal Network (RPN) and region of interest (ROI) pooling. The structure of the HAT module is shown in
Figure 4. The
H,
W, and
C represent the height, width, and channels of the feature map. This module leveraged the properties of hyperbolic space to more effectively capture and represent hyperbolic patterns within images, enhancing the accuracy of rebar identification. The HAT module computed hyperbolic distances by applying hyperbolic geometry, specifically the widely used Poincaré model in machine learning. In the Poincaré disk model, the hyperbolic distance between two points can be calculated as
In this equation, and represent the Euclidean distances to the origin, and it is imperative to ensure that both points q and k reside within hyperbolic space (i.e., their norms are less than 1).
The dataset utilized in the present study was predominantly derived from GPR detection images obtained from the Husa Tunnel along the Tengchong to Longchuan Expressway. Data acquisition was performed by utilizing a commercial ground-penetrating radar system, specifically the SIR3000, which operates at a central frequency of 400 MHz. In order to ensure that the reflected waves accurately represent the rebar, this study implemented a procedure for the removal of DC offset from the acquired data. The process of DC offset removal can be mathematically expressed as
In this equation, denotes the sampled data prior to processing, represents the sampled data post-processing, n is the number of samples in the A-Scan, and N signifies the total number of samples within each A-Scan.
Additionally, a portion of the images was derived from a simulated public dataset [
19]. The final dataset comprised 499 images of real data and 130 images from the simulated public dataset, with a total of 2849 rebar targets, including 1150 simulated rebar targets and 1699 real rebar targets. A total of 566 images (90%) were selected for a 9:1 division, resulting in 509 images designated as the training set and 57 images as the validation set, while an additional 63 images (10%) were allocated as the test set. To ensure the efficacy of model training and application performance, as well as to guarantee the stability and reliability of the model under varying environments and conditions, the training, validation, and test sets each included 105, 12, and 13 images (20%), respectively, maintaining the same ratio of real to simulated data as in the dataset.
Furthermore, the radar images within the dataset were sampled and classified to generate image samples. The ground-penetrating radar images lacked inherent labels and semantics; therefore, annotation was necessary for training purposes. The dataset was formatted in the Pascal VOC format. It was recommended that qualified personnel verify the image samples and subsequently utilize LabelImg software(version 1.8.6) for the manual annotation of the dataset images, categorizing the sample dataset and creating corresponding labels.
The dataset defined the target labels and bounding boxes for each input ground-penetrating radar image. Subsequently, both the bounding box regression network and the bounding box classification network performed image classification and bounding box prediction on these features. The model loss comprises two main components: the RPN loss and the ROI loss. Specifically, the RPN loss aims to optimize anchor boxes through network-generated scores and regression outputs, leading to the generation of high-quality proposals. The RPN loss function comprises two key components: the classification loss and the regression loss, as follows:
In this equation, denotes the probability that an anchor is classified as a target, whereas signifies the corresponding ground truth. and denote the predicted and ground truth bounding box coordinates, respectively.
The ROI loss also consists of classification loss and regression loss. The output of the classification layer is the probability distribution
for each bounding box in relation to the background and rebar. The bounding box regression network outputs the parameters of the bounding box location, denoted as
, where
K represents the class. The bounding box regression network and the bounding box classification network were trained jointly using a combined loss function, as follows:
In this equation, represents the classification loss, and denotes the regression loss for bounding box coordinates. The activation of occurs exclusively when the region of interest aligns with the annotated target within the image.
The final model’s loss integrates four key components: the RPN classification loss, RPN regression loss, ROI classification loss, and ROI regression loss, expressed as
In this equation,
a,
b,
c and
d represent the hyperparameters for loss weights, commonly initialized to a default value of 1.
To evaluate the performance of the trained model in object recognition and classification tasks, the evaluation metrics included Precision, Recall,
score, and Average Precision (
) under varying Intersection over Union (
) thresholds. The mathematical formulations for each of these metrics are provided as
where True Positive (
) represents the number of samples labeled as the target of detection and detected as the target, which is called the true class; False Positive (
) represents the number of samples marked as non-target and detected as target; and False Negative (
) represents the number of samples marked as targets and detected as non-targets.
where
is a
curve drawn using Precision and Recall.
3. Experimental Study
During the training phase of the Faster R-CNN model based on the hyperbolic attention mechanism, the Adam optimization strategy was employed, with a maximum learning rate set at 0.0001 and a minimum learning rate at 0.01 of the maximum learning rate. The input images were segmented into 38x38 grids, with each grid containing 9 anchor boxes of varying sizes. In the RPN, the length, width, and aspect ratios of the true bounding boxes of the target images in the dataset were analyzed to establish three different anchors with base scales of 8, 16, and 32, and aspect ratios of 1:0.5, 1:1, and 1:2. For the classification and regression network of the model, the condition for an ROI to be classified as reinforcing bars is that its IoU with the ground truth box is ≥0.5, with all other regions designated as background.
Given that this network contains a relatively large number of parameters while the dataset is relatively small, transfer learning was employed to train the model in order to mitigate the risk of overfitting, which is particularly crucial for small datasets. A pre-trained model from VOC2007 ImageNet [
20] was utilized to initialize the model parameters. Subsequently, the ground-penetrating radar dataset was applied for further fine-tuning of the model.
During the generation of target candidate boxes, it is necessary to calculate the degree of overlap between all proposed boxes and the ground truth boxes, followed by filtering. If the overlap degree between a specific ground truth box and a proposed box exceeds 0.5, the proposed box is classified as a positive sample; conversely, if the overlap is less than 0.5, it is classified as a negative sample. Subsequently, non-maximum suppression (NMS) is applied to reduce overlapping regions generated by the Region Proposal Network (RPN). All generated candidate boxes are ranked based on their object scores, ultimately resulting in the recommended candidate regions.
The model is trained and evaluated using radar images obtained from both field collection and simulation data. To validate the effectiveness of the model, comparative experiments were conducted, with
Table 1 summarizing the training results of various models, including SSD, YOLOv5, and Faster R-CNN, in terms of their
scores and
values. In object detection tasks, Precision refers to the proportion of correctly identified rebar among all detected instances, while Recall measures the proportion of correctly identified rebar among all actual rebar present in the image. Since the goal in this study is to ensure that all rebar is detected, even at the expense of some false positives, we prioritized Recall over Precision. Consequently, Faster R-CNN, which achieved the highest Recall, was selected as the baseline for this work. Additionally, Faster R-CNN demonstrated competitive
scores and
values, further confirming its effectiveness for rebar detection.
Furthermore, to substantiate the efficacy of the DAS and HAT modules in enhancing the Faster R-CNN model’s ability to identify the hyperbolic features of steel bars within images, ablation experiments were conducted. Specifically, we evaluated three configurations: the first involved adding the DAS module solely to the feature extraction module, the second involved incorporating the HAT module into the network, and the third assessed the combined effect of both modules. The results, as delineated in
Table 2, indicate that the incorporation of the DAS and HAT modules individually resulted in an increase in
values of 1.19% and 1.82%, respectively. Moreover, the simultaneous addition of both modules yielded a cumulative increase of 3.23% in the
value.
In addition, to evaluate the influence of different loss weight configurations on the performance of our Faster R-CNN model, we conducted a series of comparative experiments based on Formula (
7). Besides the default settings, six different loss weight configurations were compared, as detailed in
Table 3. The aim of this experiment was to investigate the impact of varying the emphasis on the classification and regression loss of the RPN and ROI on model performance. According to the results in the second group of
Table 3, increasing the classification loss weight while decreasing the regression loss weight improves the model’s performance. Appropriate tuning of these hyperparameters can enhance the model’s classification and localization capabilities for hyperbolic features in GPR images.
5. Discussion and Conclusions
This study employs a Faster R-CNN object detection algorithm based on a multi-hyperbolic attention mechanism to locate and identify the rebar hyperbolic features within ground-penetrating radar images. Experimental validation was conducted using a ground-penetrating radar image dataset constructed from a simulated tunnel lining public dataset and real data from the Husa Tunnel. The following are the conclusions drawn from this research:
(1) By refining the feature extraction module to focus the model’s attention on hyperbolic patterns, the model’s improved by 1.37%, enhancing its capability to recognize hyperbolic features associated with rebar.
(2) Incorporating hyperbolic distance into the model enables more effective differentiation of hyperbolic patterns across various targets. This adjustment increased the model’s by 1.82%, further enhancing its ability to isolate rebar-specific hyperbolic patterns within complex image data.
(3) In this model, attention is first directed toward hyperbolic features, followed by the integration of hyperbolic distance. This combined approach resulted in an overall increase of 3.14%, providing a hyperbolic feature-focused method for rebar detection in tunnel structures.
(4) Reducing the regression loss weight while magnifying the classification loss weight results in a 1.41% increase in the model’s AP, demonstrating an improved recognition of rebar hyperbolas.
Although the proposed model exhibited promising performance in this study, the varied real-world conditions of tunnels, including differences in shape, materials, and noise levels in radar images, could substantially impact its effectiveness. Consequently, the model might benefit from a more diverse dataset to enhance its adaptability to different environmental conditions. Moreover, given that the training time for this model exceeds that of single-stage models, practical implementation must consider computational resources and time limitations. Future research could explore the use of three-dimensional ground-penetrating radar to gather reflection data from various tunnel linings, thus improving the accuracy of identifying embedded objects, such as rebar. Additionally, integrating advanced data processing algorithms and deep learning techniques to minimize computational costs and boost efficiency could enable future research to achieve intelligent recognition and automated analysis in complex underground settings. These advancements would greatly facilitate real-time monitoring of tunnel health, allowing for the prompt identification of potential issues and ensuring the safe operation of these critical infrastructures.


