1. Introduction
Optimizing drilling performance in rock formations is crucial for enhancing the efficiency and cost-effectiveness of petroleum engineering operations. Important factors in assessing and improving drilling efficiency include torque, mechanical specific energy (MSE), and rate of penetration (ROP). Prior research has emphasized the significance of these parameters in evaluating drilling efficacy and comprehending the interactions between bits and rocks [
1,
2,
3].
Pilot holes, or pre-cored smaller diameter holes, are shown to impact drilling efficiency significantly. These effects are primarily observed through torque, ROP, and MSE changes, and they are crucial for bit performance optimization [
4,
5,
6]. For example, much research has been done on using polycrystalline diamond compact (PDC) bits, which are well-known for their efficiency and durability, to understand how they function under different circumstances [
4,
7]. Furthermore, technological advancements have made new techniques to improve drilling efficiency possible. For example, control engineering systems have been used to monitor bit wear and mechanical specific energy in real time, and hydraulic parameters for two-stage PDC bits in deep formations have been optimized [
8,
9]. Despite extensive research on various aspects of drilling, there needs to be more understanding of the specific impact of pre-cored pilot holes on drilling performance. Detailed investigations on how different pilot hole diameters influence drilling parameters, such as torque, rate of penetration (ROP), and Mechanical Specific Energy (MSE), are limited. By conducting controlled laboratory experiments to examine the effects of multiple-diameter pilot holes on drilling performance and effective rock strength, this study seeks to close this knowledge gap [
4,
10,
11,
12,
13,
14,
15].
Understanding bit performance and drilling efficiency based on earlier research. By utilizing indices of rock drill ability, cuttings removal, and bit wear, Warren and Armagost [
4] and Mazen et al. [
13] offered insights into PDC bit performance and the prediction of penetration rates. Our understanding in this field was enhanced by studies on drag bit wear [
8] and the assessment of bit performance under high-speed and high-wear conditions [
10]. Furthermore, the field has benefited from the work of Al-Sudani [
9] on real-time monitoring, and the empirical models created by de Moura et al. [
16].
The relationship between coring parameters and formation representation, as well as drilling performance through bit cutter reconfigurations and micro-fractures initiation, have been studied in recent years by researchers like Abugharara et al. [
10]. These studies have contributed significantly to our understanding of drilling performance improvement strategies, as have those by Roohi et al. [
11] and Quan et al. [
17].
This study offers insights for improving drilling operations by analyzing the relationship between drilling parameters and pilot hole diameters. The findings of this research have the potential to lead to reduced costs, minimized environmental impact, and enhanced overall drilling performance, paving the way for improved drilling practices in real-world scenarios. This study incorporates an analysis of mechanical specific energy (MSE), a crucial parameter for evaluating drilling efficiency. By understanding the relationship between pilot hole diameter and MSE, this research aims to contribute to developing energy-efficient drilling techniques, further enhancing the sustainability of drilling operations.
2. Research and Experimental Procedure
This study investigates the intricate relationship between bit–rock interactions and drilling parameters, focusing on the effect of pre-cored pilot holes on rock-effective strength and drilling performance, such as torque, Rate of Penetration (ROP), and Mechanical Specific Energy (MSE). The research was conducted in two stages, each building on the other, to provide a comprehensive understanding of the phenomenon.
Stage 1 laid the foundation for understanding the influence of pre-drilling on drilling performance (
Table 1). By comparing the drilling efficiency of a 2-cutter PDC bit (designed for un-per drilling) with a 4-cutter PDC coring bit (designed for pre-drilling), this study revealed a significant increase in the Rate of Penetration (ROP) when using pre-cored holes.
Building upon these initial findings, Stage 2 expanded the investigation by exploring the impact of multiple-diameter pilot holes on drilling performance (
Table 2). By varying the diameter of the pre-cored holes (0.5″, 1.0″, and 1.5″) and conducting main drilling operations with a 5-cutter PDC bit, this study aimed to determine the relationship between drilling parameters (ROP, torque, Mechanical Specific Energy—MSE) and bit–rock interactions under different pre-cored hole geometries.
This two-stage research approach allowed for a gradual progression from basic observations to more detailed investigations, ultimately providing a deeper understanding of the complex interactions between drilling parameters, bit–rock interactions, and pre-cored hole geometries. The findings from these experiments are expected to contribute significantly to understanding drilling performance under varying geological conditions.
In addition, the type of rock is gabbro, which was used in the experiments to investigate further the pre-drilling effect on drilling performance in different rock types. Drilling in was performed to assess the impact of weaker formations on drilling parameter responses compared to stronger formations like gabbro (
Table 3). Samples 6 inches (15.24 cm) in diameter and 12 inches (30.48 cm) in length, cored from the rock blocks with thorough characterization reported in de Moura, were used in this study [
16]. The experimental setup is shown in
Figure 1. It involved three main stages.
2.1. Experiment Stage 1: Variation in PDC Bits
The experiment’s first step involves evaluating the drilling performance of a 4-cutter PDC coring bit (6.35 cm diameter) designed to extract core samples and a 2-cutter PDC bit (3.24 cm diameter) for un-drilling.
Using a staged approach, it was possible to compare the drilling performance achieved with various PDC bit configurations and provide insight into their respective effectiveness in bit–rock interactions. The goal was to compare the un-drilling phase with the 2-cutter PDC bit to the drilling performance and efficiency of the 4-cutter PDC coring bit.
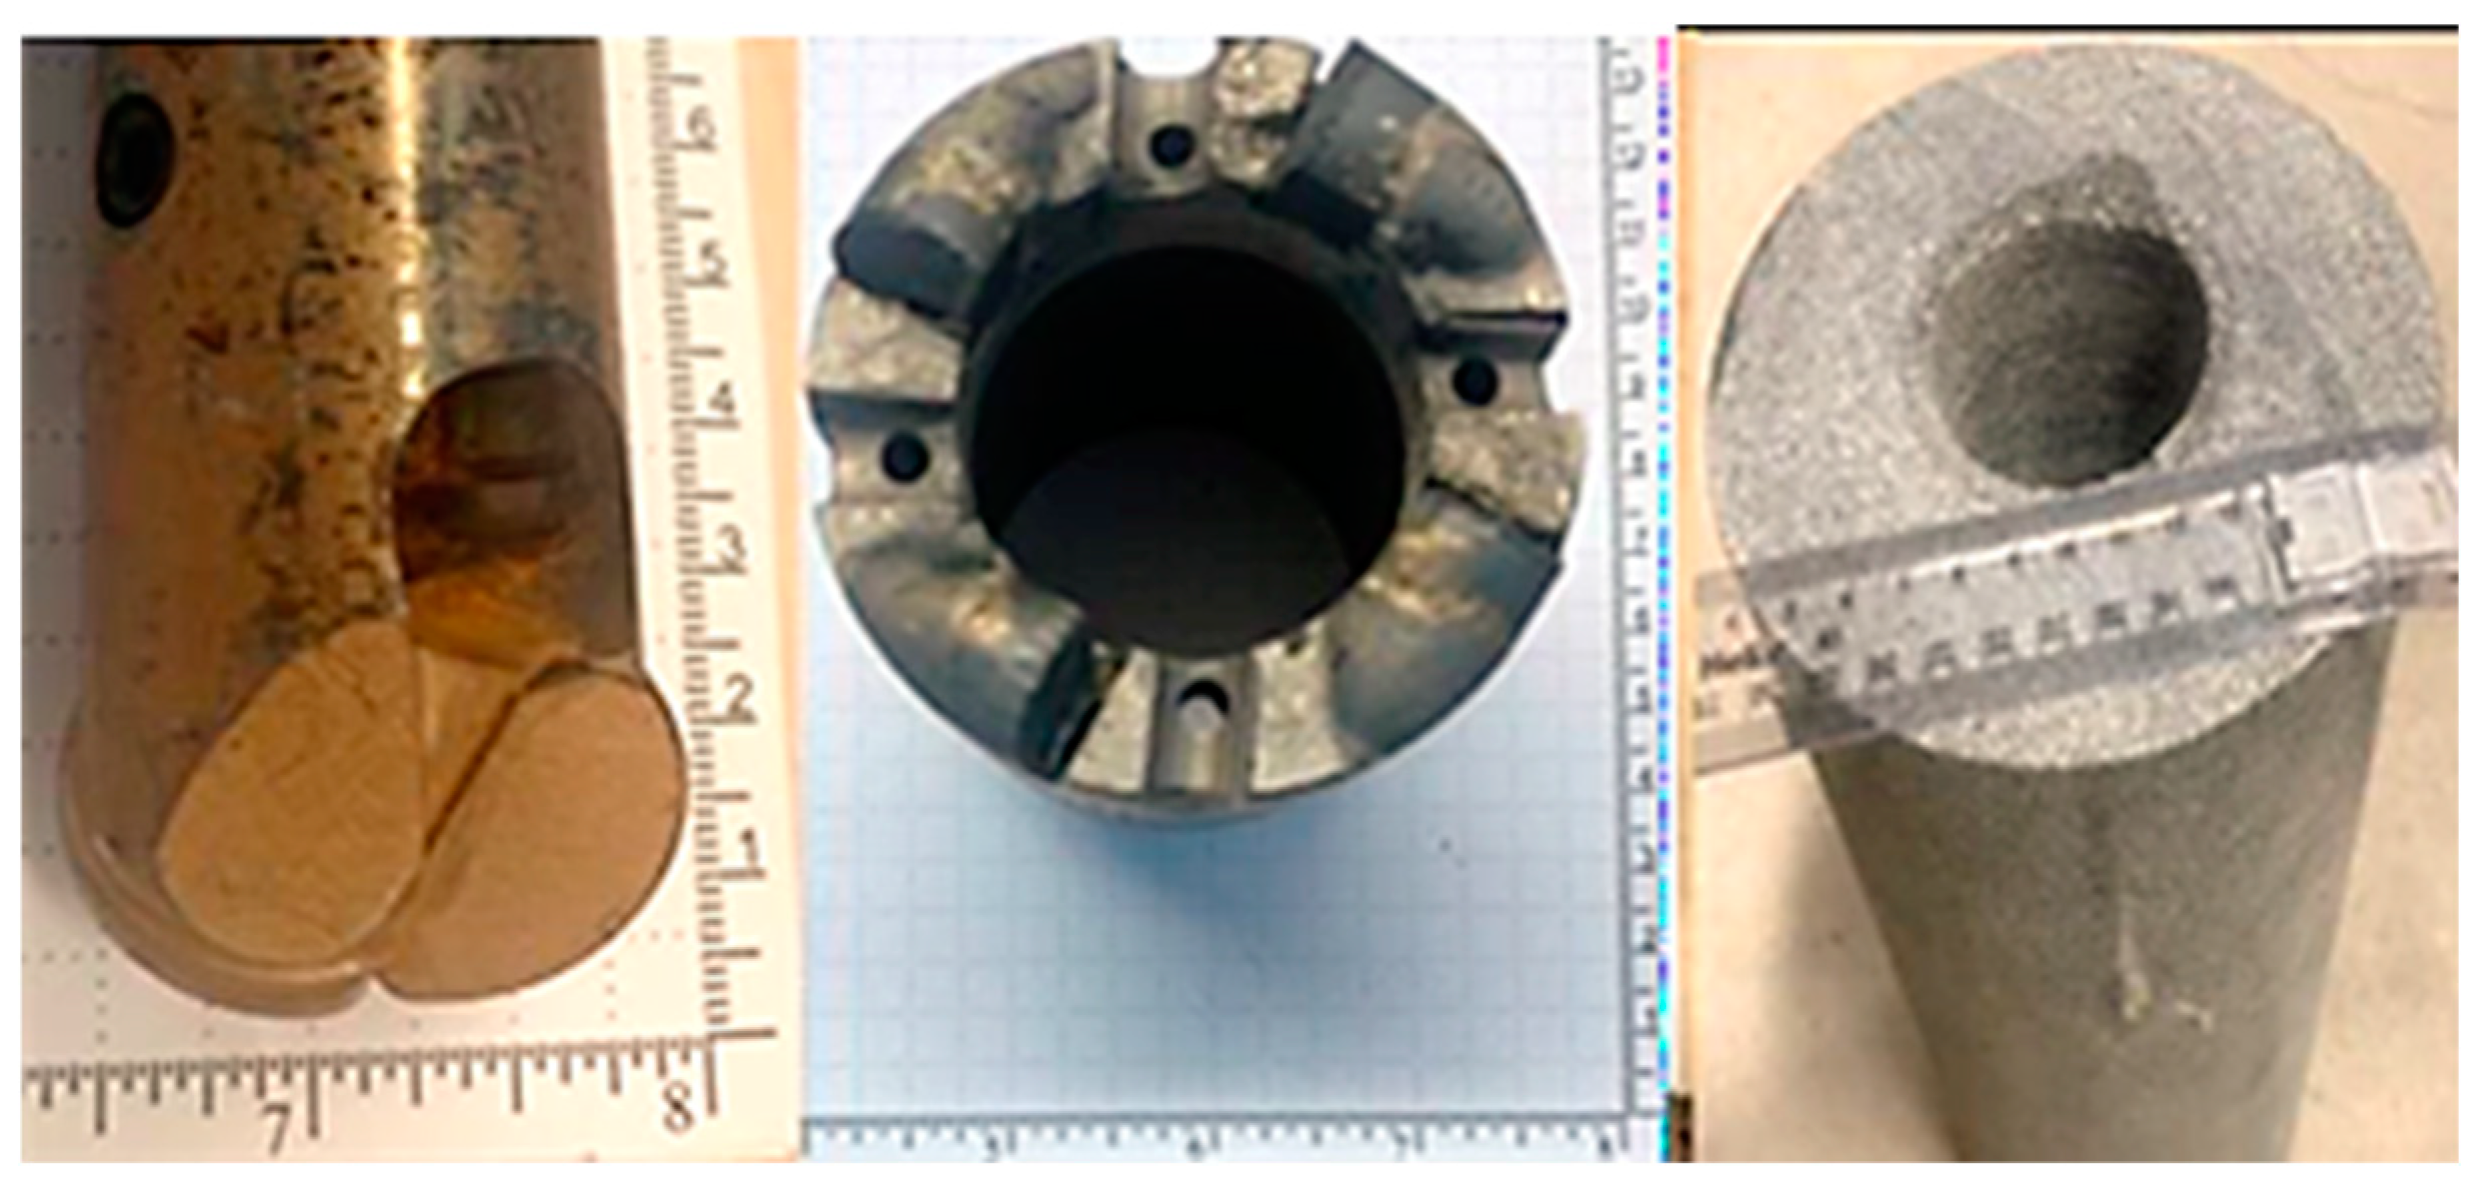
Un-per-drilling with 2-cutter PDC Bit: As seen in
Figure 2, the experiment’s initial phase involved pre-drilling operations using a specific 2-cutter PDC bit made just for this purpose. Un-per drilling is the first step in preparing the rock formation for further drilling or coring operations by making a small hole.
Coring with 4-Cutter PDC Coring Bit: Following the un-per-drilling phase, a 4-cutter PDC coring bit optimized for core sample extraction from hard rock formations was used in the experiment’s coring operations. A cylindrical core sample is extracted by drilling further into the rock formation.
Drilling parameters such as Weight on Bit (WOB), Revolution per Minute (RPM), and Flow Rate (FR) were controlled, regulated and kept constant during Stage 1. This made the experimental conditions consistent and repeatable, enabling a methodical comparison of the drilling performance with various PDC bit configurations.
Assessing the efficacy, suitability, and efficiency of different PDC bit configurations for pre-drilling and coring operations in hard rock formations was the aim of Stage 1. Stage 1 gave important insights into optimizing drilling operations and choosing the best bit configurations for drilling scenarios by evaluating the performance of various PDC bits under controlled conditions.
2.2. Experiment Stage 2: Varied Hole Geometry Preparation
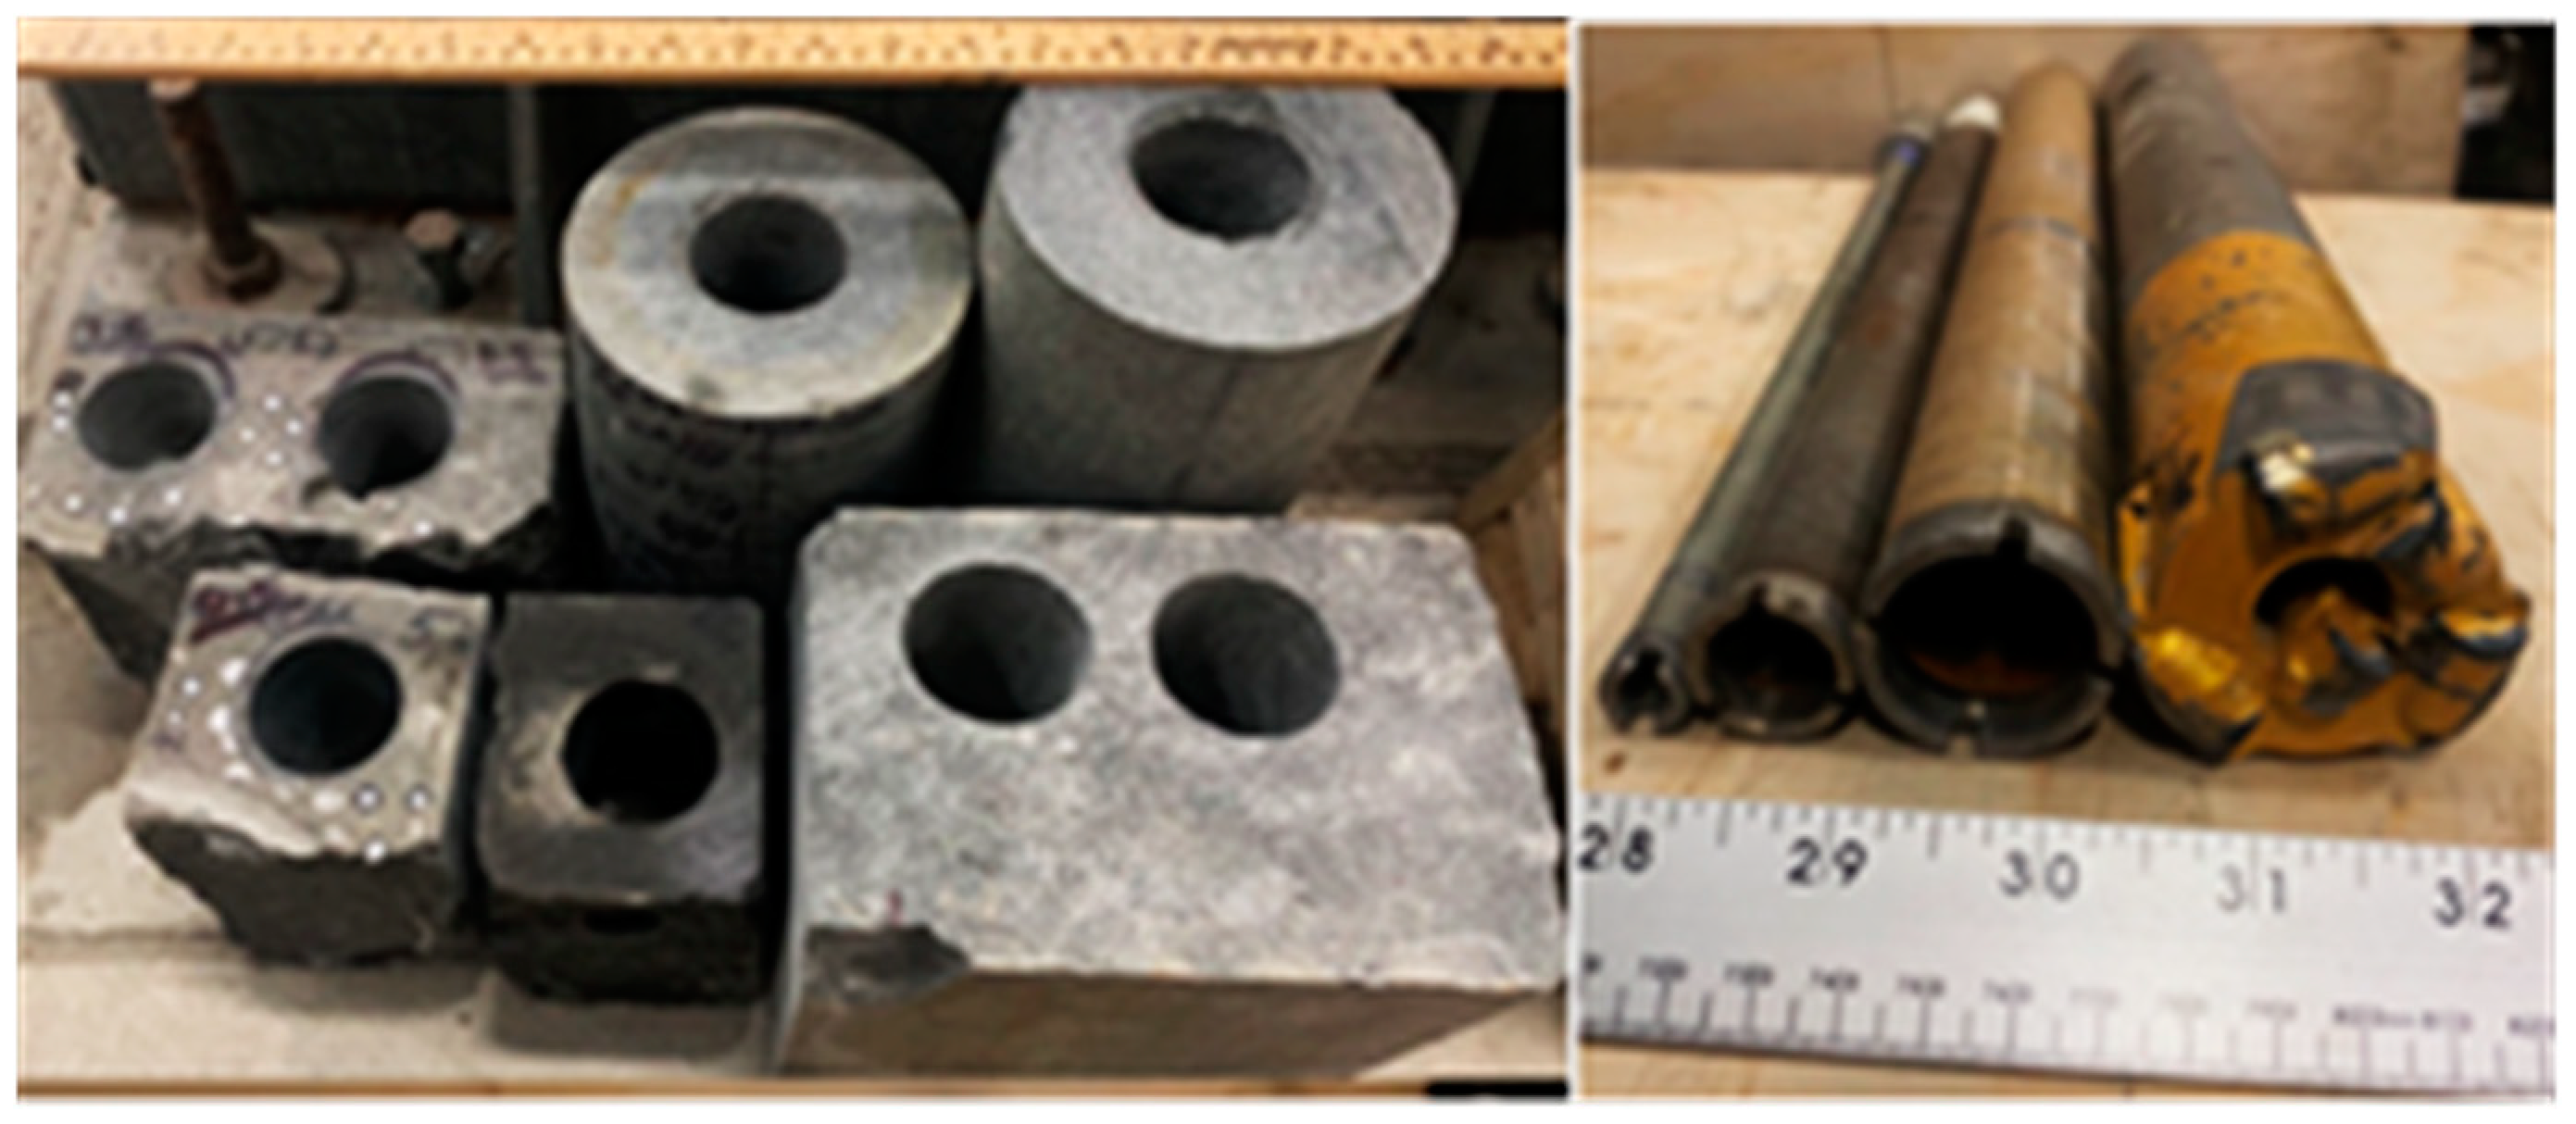
In the second stage of this study, a thorough protocol was developed to track the drilling parameters’ reactions amid diverse bit–rock interactions in a laboratory setting, as shown in
Figure 3, which displays gabbro samples of various sizes and shapes chosen for the primary drilling tests. These samples (to the left of
Figure 3) are cut from the same larger gabbro block to guarantee consistency in material properties and characteristics. During the drilling process, cuttings were collected using the chosen gabbro samples. Rock fragments, known as cuttings, are created during the drilling process. They are crucial for deciphering the bit–rock interactions and assessing the drilling performance. The gabbro samples are prepared for multiple diameter holes using three coring bits. The drilling locations for the ensuing examinations and experiments are these holes. The coring bits are chosen according to their outer diameters to create holes of varied sizes and depths. After the multi-diameter holes are prepared, drilling tests are conducted with a 5-cutter Polycrystalline Diamond Compact (PDC) bit (to the right of
Figure 3).
This procedure involved several key steps:
Preparation of Seat: A shallow depth was drilled into the gabbro sample to create a stable base or seat using a 5-cutter Polycrystalline Diamond Compact (PDC) bit. This step aims to guarantee the appropriate centralization of the ensuing drilling operations, as seen in
Figure 4. The PDC bit had a diameter of 2.25 inches (57.15 mm) and could provide stability and accuracy while drilling.
Drilling of Central Holes: Within the gabbro sample, central holes of various depths were subsequently prepared. This was accomplished with 0.5 inches (12.7 mm), 1.0 inches (25.4 mm), and 1.5 inches (38.1 mm) in diameter natural diamond-impregnated (NDI) coring bits. As seen in
Figure 4, these coring bits were chosen to produce holes of many sizes, enabling the exploration of various hole geometries in the drilling experiments.
Main Drilling Operation: After the central holes were prepared, the 5-cutter PDC bit with a diameter of 2.25 inches (57.15 mm) was used for the main drilling operation. Depths below the un-cored formation and through the pre-cored depths were reached during this drilling process. This step aimed to evaluate drilling performance in various conditions and simulate drilling operations in a range of hole geometries.
Maintaining Constant Parameters: Weight on Bit (WOB), Revolution per Minute (RPM), and Flow Rate (FR) were precisely kept constant during the whole drilling process. Ensuring consistency and repeatability in the experimental results was crucial. Researchers could distinguish the impact of hole geometry on drilling performance and precisely evaluate the influence of other variables by holding these parameters constant.
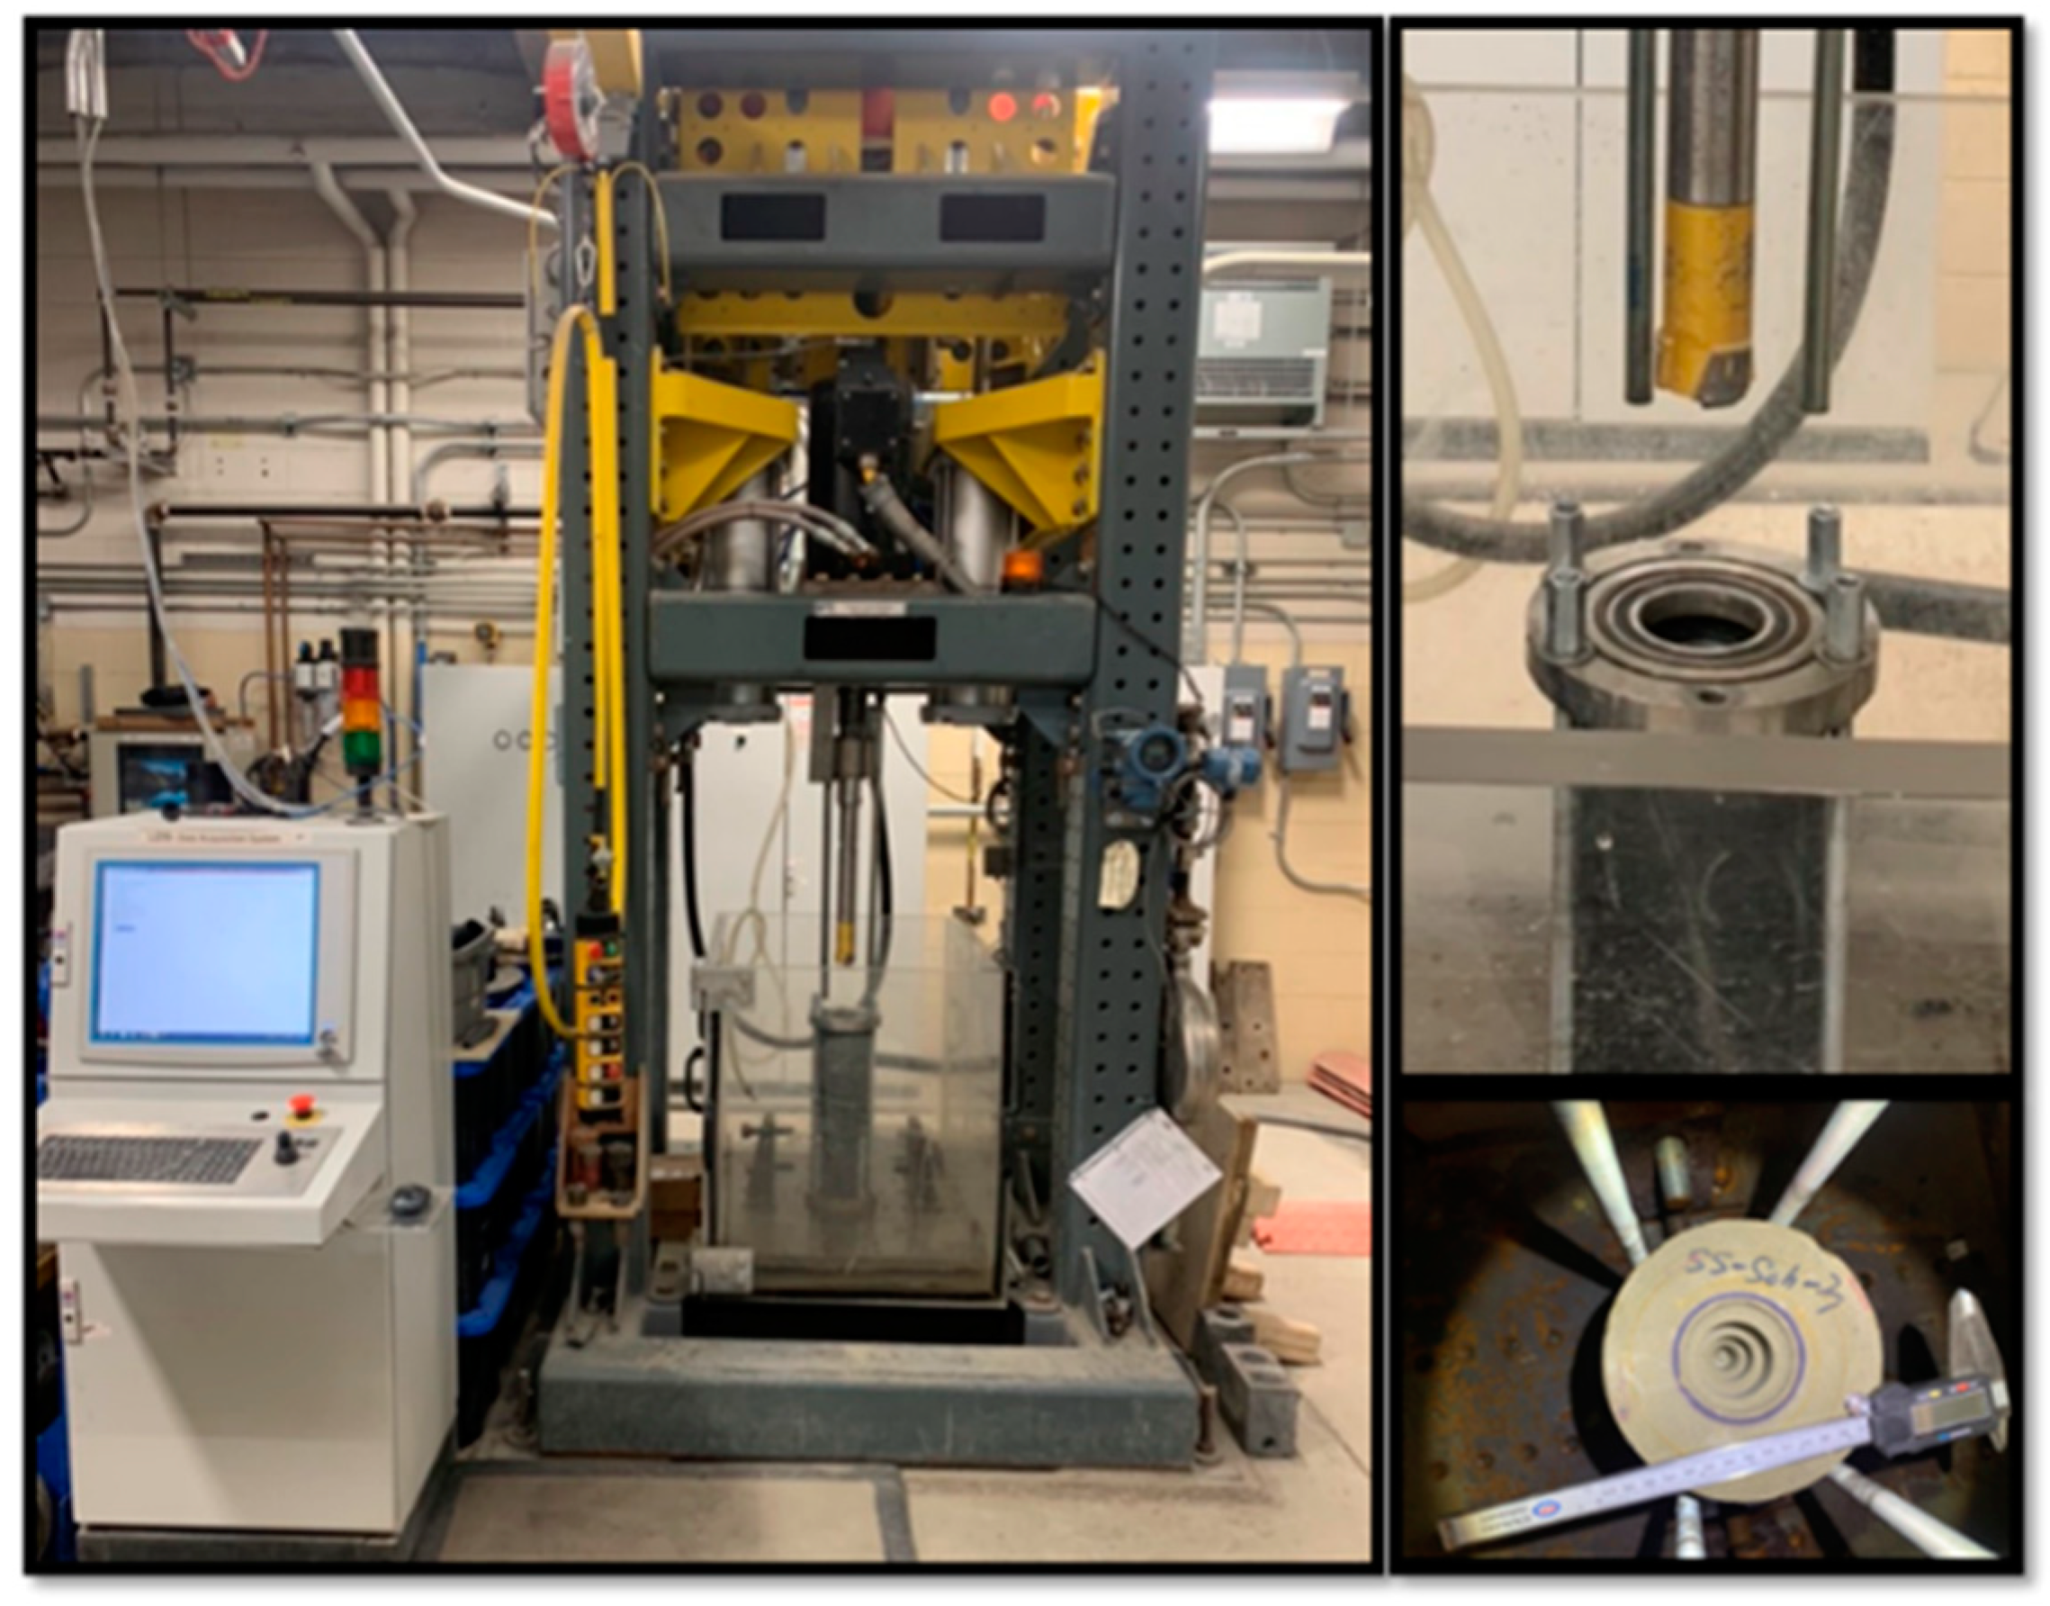
The experiments were conducted using the Large Drilling Simulator (LDS) at the Drilling Technology Laboratory, Memorial University of Newfoundland, which was used for all pre-cored holes and drilling experiments. This simulator allowed for the methodical testing of various drilling parameters, providing insights into the Rate of Penetration (ROP) and other performance metrics.
Figure 5 shows the LDS setup, which consists of the multi-diameter geometry before drilling in the formation (bottom right), the Data Acquisition System (DAQ-Sys), the LDS drilling frame, and the sample holder containing gabbro formation (top right).
The LDS is an advanced laboratory system replicating real-world drilling conditions under controlled parameters. It features a power system to drive a high-torque rotary motor capable of operating at speeds ranging from 0 to 1000 RPM, with a maximum torque capacity of 1100 Nm. Calculate the torque from a large drilling simulation machine mastered using Equation (1) for the Electric Motor Torque Formula [
10].
The hoisting system incorporates two pneumatic cylinders and a hydraulic servo-actuator, allowing precise application of Weight on Bit (WOB) up to 60 KN. A high-precision load cell monitors the applied axial load, ensuring consistent WOB application. The rotary system is coupled with a cutting-edge pumping system that circulates water at high pressure to remove rock cuttings and stabilize the drilling interface. Real-time data are captured using a LabVIEW (v.5.0)-based Data Acquisition System (DAQ), which records parameters such as WOB, rotational speed, torque, and displacement at a frequency of 100 Hz, providing high-resolution measurements for detailed analysis.
3. Results and Discussion
This section provides a comprehensive analysis of the effect of pre-cored holes on rock weakening and penetration rates, as well as the influence of drilling parameters during bit–rock interactions. Combining analysis of stages 1 and 2 suggests insightful information about the complex interactions between these variables, highlighting important mechanisms influencing drilling efficiency.
3.1. Drilling Data Analysis
Stage 1: Two central areas of study were determined for each sample, and both were cored under identical conditions using the PDC cutter coring bit. The top section of each region was parallel to an immediate pre-cored hole created by the 2-cutter PDC bit, while the bottom section was cored parallel to an un-pre-cored section. Testing repeatability was important for all experiments in this research to ensure the data were consistent and accurate. Each test was repeated thrice under the same conditions and parameters. Using this method, researchers could minimize the effects of variability and confirm the results.
Figure 6 shows the cutter position versus time during drilling operations. The data were obtained from the position sensors within the Large Drilling Simulator (LDS), which continuously monitored the axial displacement of the cutter. The purpose of
Figure 6 is to validate the repeatability of the experimental conditions and establish a basis for analyzing drilling performance like Rate of Penetration (ROP). While the linear relationship may seem obvious given constant Weight on Bit (WOB) and rotation rates, it is important to ensure that no external factors, such as fluctuations in the Weight on Bit (WOB), rotation rate, or irregularities in the drilling setup, influence the experiments.
3.2. Impact of Pre-Cored Holes on Drilling Performance
We begin by examining the influence of pre-cored holes on drilling performance, comparing data obtained from pre-cored and un-pre-cored sections, repeated thrice. The analysis focuses on torque and Rate of Penetration (ROP) as key indicators of drilling efficiency.
Table 4 compares the Rate of Penetration (ROP) between pre-cored and un-pre-cored sections of the rock sample under the same drilling conditions. The finding emphasizes a significant difference in drilling performance, where the ROP is consistently higher in the pre-cored sections than in the un-pre-cored sections. This result suggests that a pre-cored pilot hole significantly enhances drilling efficiency by reducing resistance at the bit–rock interface, which is an important feature of drilling performance: the torque difference between drilling the pre-cored and un-pre-cored sections. In particular, a different response to the drilling conditions in each scenario is suggested by the increased torque measured during the drilling of the top section (pre-cored h1) compared to the bottom section (un-pre-cored h1).
Traditionally, torque is an important indicator of drilling performance, providing insight into the design of the bit, conditions, and overall downhole drilling efficiency when considering the corresponding Rate of Penetration (ROP) data.
However, it is important to remember that other drilling parameters—bit design, bit type, cutter type and orientation—and applied parameters remain constant in our research. Therefore, the structural distinctions between the pre-cored and un-pre-cored formations are the only reason for any variances in torque and Rate of Penetration (ROP). The discrepancy between torque and ROP suggests that the structural properties of the drilled formation have a major impact on drilling success. The structural properties of the drilled formation, such as rock strength, fracture density, and mineral composition, significantly impact drilling success due to their influence on bit–rock interactions. High-strength formations require greater energy for penetration, which can lead to increased torque and slower ROP. Conversely, pre-existing fractures or weaker material integrity in pre-cored formations reduce resistance, enhancing the Rate of Penetration (ROP) while introducing complexities in torque response. These structural differences dictate the Mechanical Specific Energy (MSE) required for drilling, affecting efficiency and tool wear. Understanding these properties is crucial for improving drilling strategies, as they govern how effectively the drill bit interacts with the rock.
In addition to analyzing drilling parameters, such as Rate of Penetration (ROP) and torque, the Mechanical Specific Energy (MSE) is evaluated to measure the energy efficiency of our drilling process by using pilot holes. Inspired by Teale’s seminal work in 1965, we utilized Teale’s equation to calculate MSE (pilot holes) for our rotary drilling system.
The Mechanical Specific Energy (MSE) was calculated by using Equation (2), which offers valuable information about the mechanical work required to excavate a unit volume of rock during drilling. Teale’s equation enables a comprehensive assessment of energy efficiency in the drilling process.
By including MSE analysis in our experiment, our objective was to improve our understanding of the energy efficiency of drilling operations. This enhanced the knowledge we obtained from traditional drilling parameters, like Rate of Penetration (ROP) and torque, by enabling us to assess the effectiveness and performance of our rotary drilling system from a wider angle.
The Mechanical Specific Energy (MSE) values in
Table 4 show the mechanical energy used in drilling for both pre-cored and un-pre-cored formations at 60 revolutions per minute. Drilling through pre-cored intervals may require more energy because the MSE values in the pre-cored formation are substantially higher than in the un-pre-cored formation [
17]. This observation may be explained by the fact that more energy was used due to the extra effort needed to penetrate the pre-cored sections.
An essential component of drilling operations, the Depth of Cut (DOC) indicates the thickness or depth of material the drill bit removes with each revolution. DOC was computed in this investigation using experimental data to determine how quickly the drill bit penetrates rock under specific drilling conditions.
Drilling performance as a whole and Depth of Cut (DOC) can be understood from the collected ROP values. Greater Depth of Cut usually correlates with higher ROP values, indicating faster drilling progress. As a result, examining ROP in addition to Depth of Cut (DOC) enables a thorough evaluation of drilling performance and efficiency.
3.3. Validation of Drilling Performance Through Increased Rotational Speed
During this research stage, we aim to add the rotating speed (RPM) as a new parameter to validate and further confirm the drilling performance observed in Stage 1. This step was performed to verify the consistency of the data and examine any discrepancies in drilling performance under different drilling conditions. The same technique was used, except raising the RPM to 300 while drilling hole number two (h2). The same equipment configuration and characteristics, such as a constant applied weight on bit (WOB) of 6 KN, were used for the drilling experiments.
The ROP and torque results from drilling gabbro formation at 300 RPM are shown in
Table 5. The data analysis indicated a clear trend: when drilling the top section parallel to the pre-cored formation, the torque was always higher than when drilling the bottom section parallel to the un-pre-cored formation. The observed torque variation resulted from the top section’s higher Rate of Penetration (ROP) than the bottom section.
The steady torque is consistent, which validates earlier conclusions and provides further information on how formation properties impact drilling results. Greater drilling resistance is indicated by the increasing torque values at the top portion, which results from variations in the formation’s properties. These results highlight the consistency of the observed drilling performance by confirming the patterns seen in the photographs.
The comparison shows that raising the rotary speed from 60 RPM to 300 RPM increases the Mechanical Specific Energy (MSE) values in both pre-cored and un-pre-cored forms, as seen in
Table 5. This indicates that drilling at a faster rotational speed takes more energy, whether the formation is pre-cored or not. Furthermore, the MSE values are consistently greater in the pre-cored formation than in the un-pre-cored formation, implying that drilling through pre-cored intervals requires more energy.
4. Analyzing the Impact of Pilot Hole Diameter on Drilling Efficiency
The impact of pilot hole diameter on drilling efficiency in gabbro is a key factor in optimizing drilling operations. Understanding the relationship between pilot hole diameter and drilling parameters like rate of penetration (ROP) and torque can reveal insights into the mechanisms influencing drilling performance in this specific rock type.
This section examines the relationship between pilot hole diameter and drilling efficiency in gabbro rock using the data in
Figure 7 and
Figure 8 to analyze the variations in ROP and torque across different pre-cored hole diameters.
Data relevant to drilling operations are shown in
Figure 7, which includes parameters like position (in cm) and time (in seconds). These data calculate the Rate of Penetration (ROP) using the position and time parameters. Instead of horizontal lines, as in
Figure 8, dashed red vertical lines indicate different sections. The data collected from these experiments provided valuable insights into optimizing drilling operations in complex geological formations.
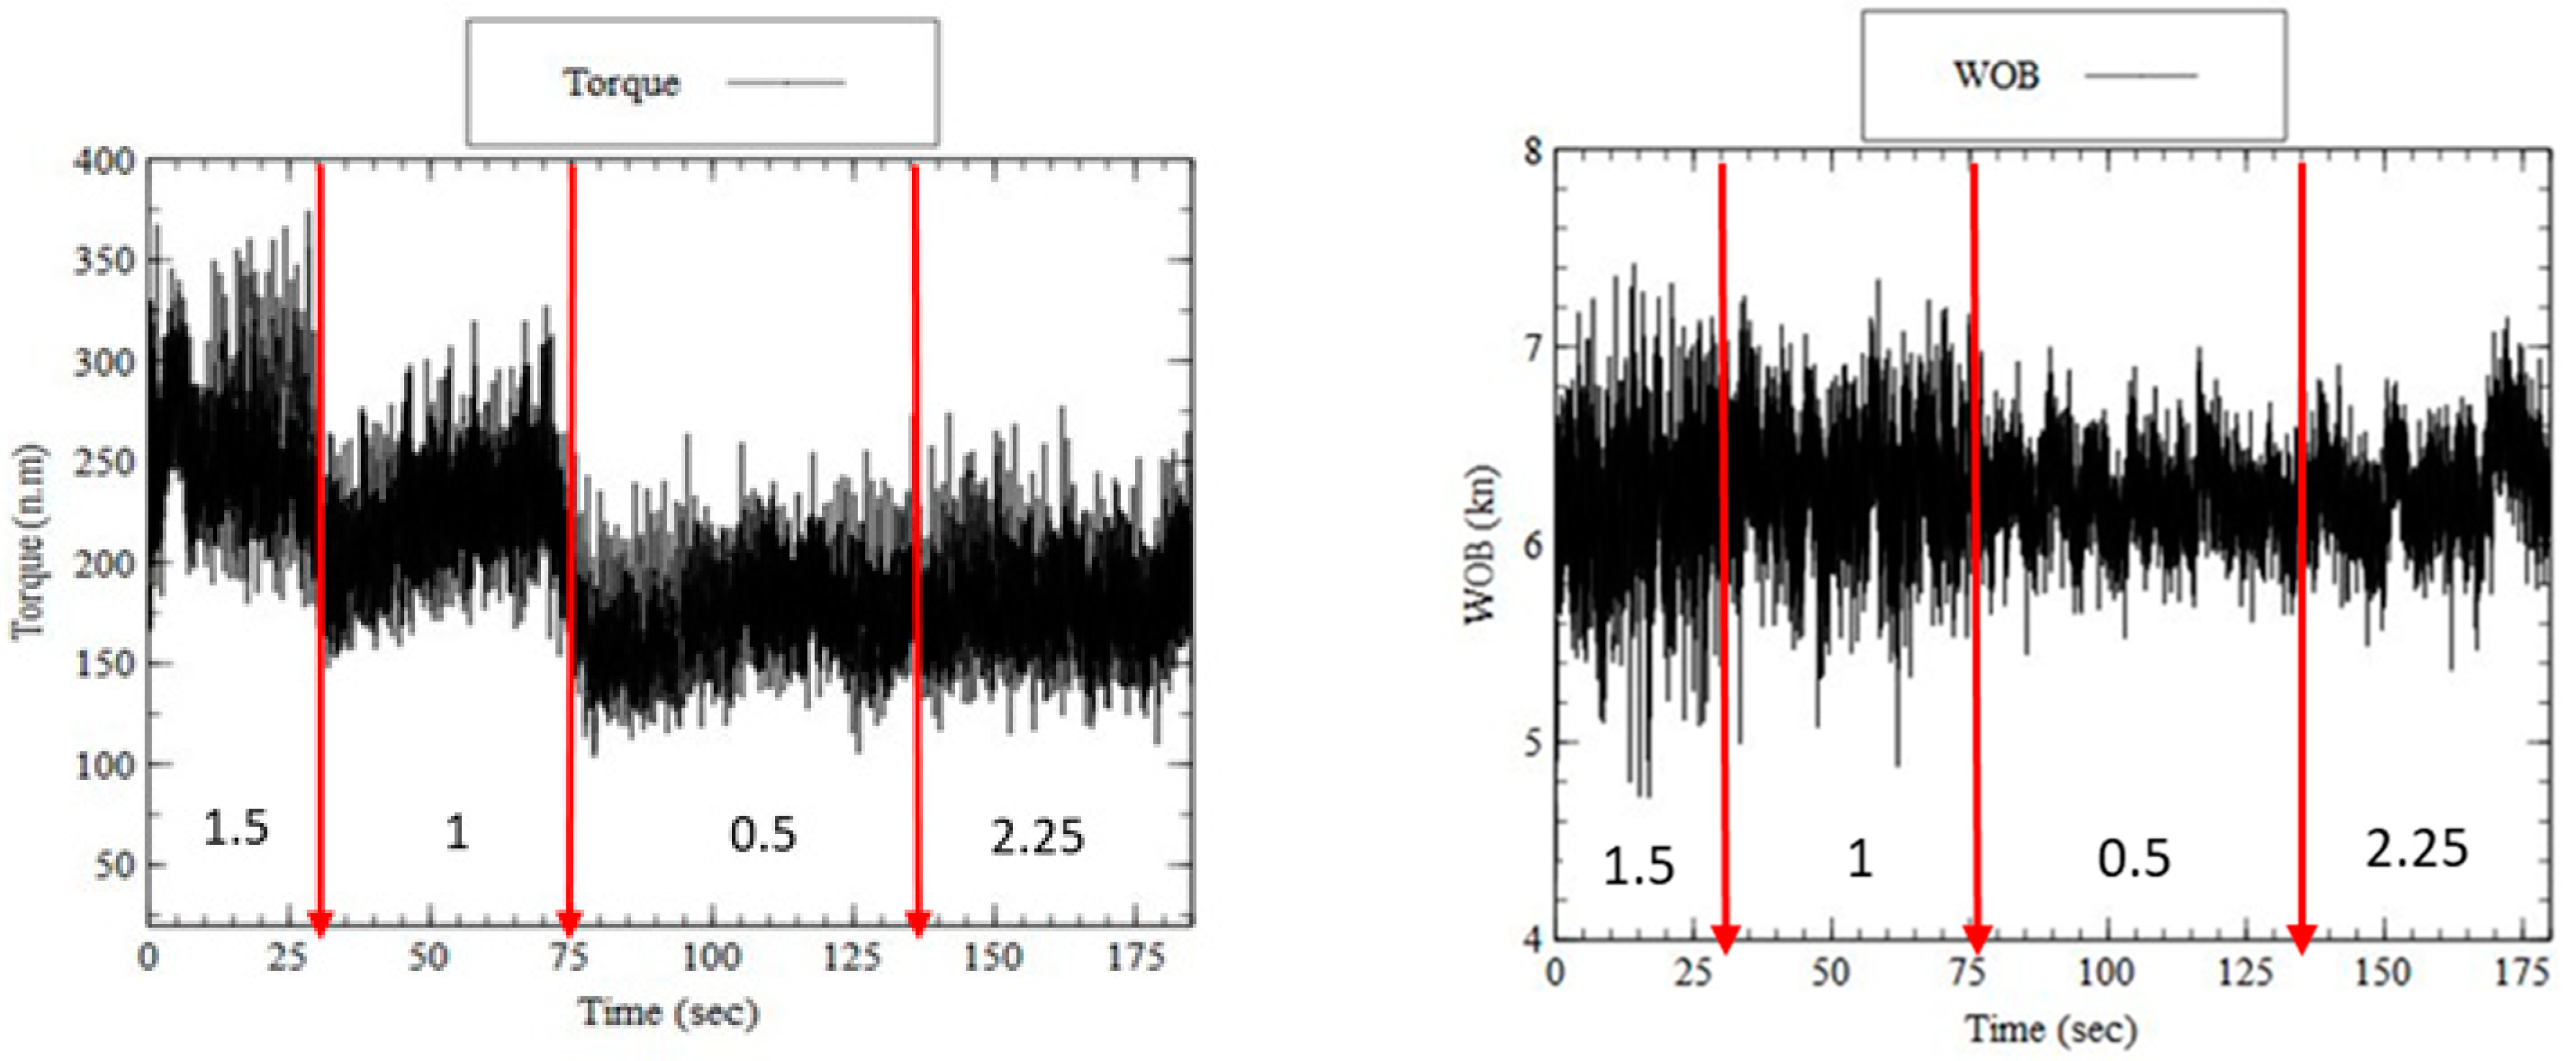
Figure 8 shows the drilling data for various pre-cored intervals with different bit sizes, all conducted at a constant Weight on Bit (WOB) of 6 KN and 60 RPM. The data reveal a clear trend that larger pilot hole diameters result in higher ROP and lower torque values.
The Weight on Bit (WOB) amplitudes exhibit the observed variations, indicating that the WOB influences the interaction between the rock formation and the drilling bit. WOB amplitudes are higher when the bit–rock interaction is lower (i.e., less bit–rock interaction) and lower when the bit–rock interaction is higher (i.e., more bit–rock interaction).
Additionally, in stronger formations, like gabbro, the signals produced by the drilling process are more noticeable and distinct when drilling holes of different diameters. This suggests that more powerful formations generate signals with greater clarity than weaker formations, better representing various drilled regions.
These findings underscore the importance of a nuanced understanding of how pilot hole diameter affects drilling efficiency in gabbro. To optimize drilling operations, adaptive techniques are needed that can accommodate variations in rock properties and ensure efficient penetration. This can be achieved by implementing real-time monitoring systems to track drilling parameters, carefully selecting suitable drilling tools, and dynamic adjusting of drilling parameters based on the observed data. By embracing this adaptive approach, operators can make more informed decisions during drilling operations, enhancing project success and maximizing resource extraction efficiency in gabbro formations.
The impact of drilling parameters, such as bit–rock interactions area, on drilling performance was then investigated. This analysis sheds light on the relationships between drilling parameters by examining variations in Rate of Penetration (ROP) and torque across various pre-cored hole diameters. A thorough examination of the ROP and torque data from drilling into multidiameter pre-cored holes at various applied Weights on Bit (WOB) and constant rotating speed (RPM) is seen in
Figure 9 and
Figure 10.
Figure 9 presents the ROP achieved for four configurations: drilling with a full-face bit in pre-cored holes (HO) of 1.5, 1.0, and 0.5 inches in diameter, as well as drilling without a pre-cored hole (full-face). The results indicate a consistent trend of increasing ROP with increasing Weight on Bit (WOB) across all configurations. Notably, in both rock types, the ROP is higher for larger pre-cored holes (HO) (1.5 and 1.0 inches) than for smaller holes (0.5 inches) and the full-face configuration. This suggests that pre-coring can significantly enhance drilling efficiency. However, the Rate of Penetration (ROP) increase is not always consistent or proportional to the increase in hole diameter, suggesting that other factors might also play a role in multi-diameter hole drilling performance.
The relationship between torque and the Rate of Penetration (ROP) observed during the drilling process is highlighted in the text excerpt. It states that in
Figure 10, the torque data are proportionate to the ROP data. In particular, all pre-cored multi-diameter holes exhibit an increasing trend in torque and ROP as the Weight on Bit (WOB) increases. This finding implies a strong correlation between these drilling parameters by showing that variations in WOB consistently affect ROP and torque in gabbro rock.
The idea is to replicate various downhole conditions and see how they affect torque and ROP. Therefore, the formation’s diameter was changed while maintaining other parameters. This technique allows for investigating how drilling reactions alter when transitioning between different diameters by simulating various conditions in actual drilling operations. Those situations could involve drilling through formations already weakened by concurrent drilling or coring operations, which could cause micro-cracks and undermine the formation, or drilling through distinct lithology with differing strength properties. Additionally, this study aimed to assess the impact of worn teeth on the drill bit, which could lead to an increase in the bit–rock interaction (BRI) area and a decrease in the ROP. Surprisingly, this study found that torque did not increase as predicted by the BRI area, while ROP decreased as the bit–rock interaction (BRI) area increased. Further research is necessary to comprehend the relationship between torque, ROP, and BRI in light of this discrepancy.
The Mechanical Specific Energy (MSE) calculation has become an essential technique for assessing drilling performance. It provides valuable information about bit performance enhancement and drilling efficiency. MSE values are widely used for pore pressure prediction, problem diagnosis, and drilling optimization in the drilling industry.
Equation (2)’s real-time drilling parameters, used to calculate MSE, were used in this investigation.
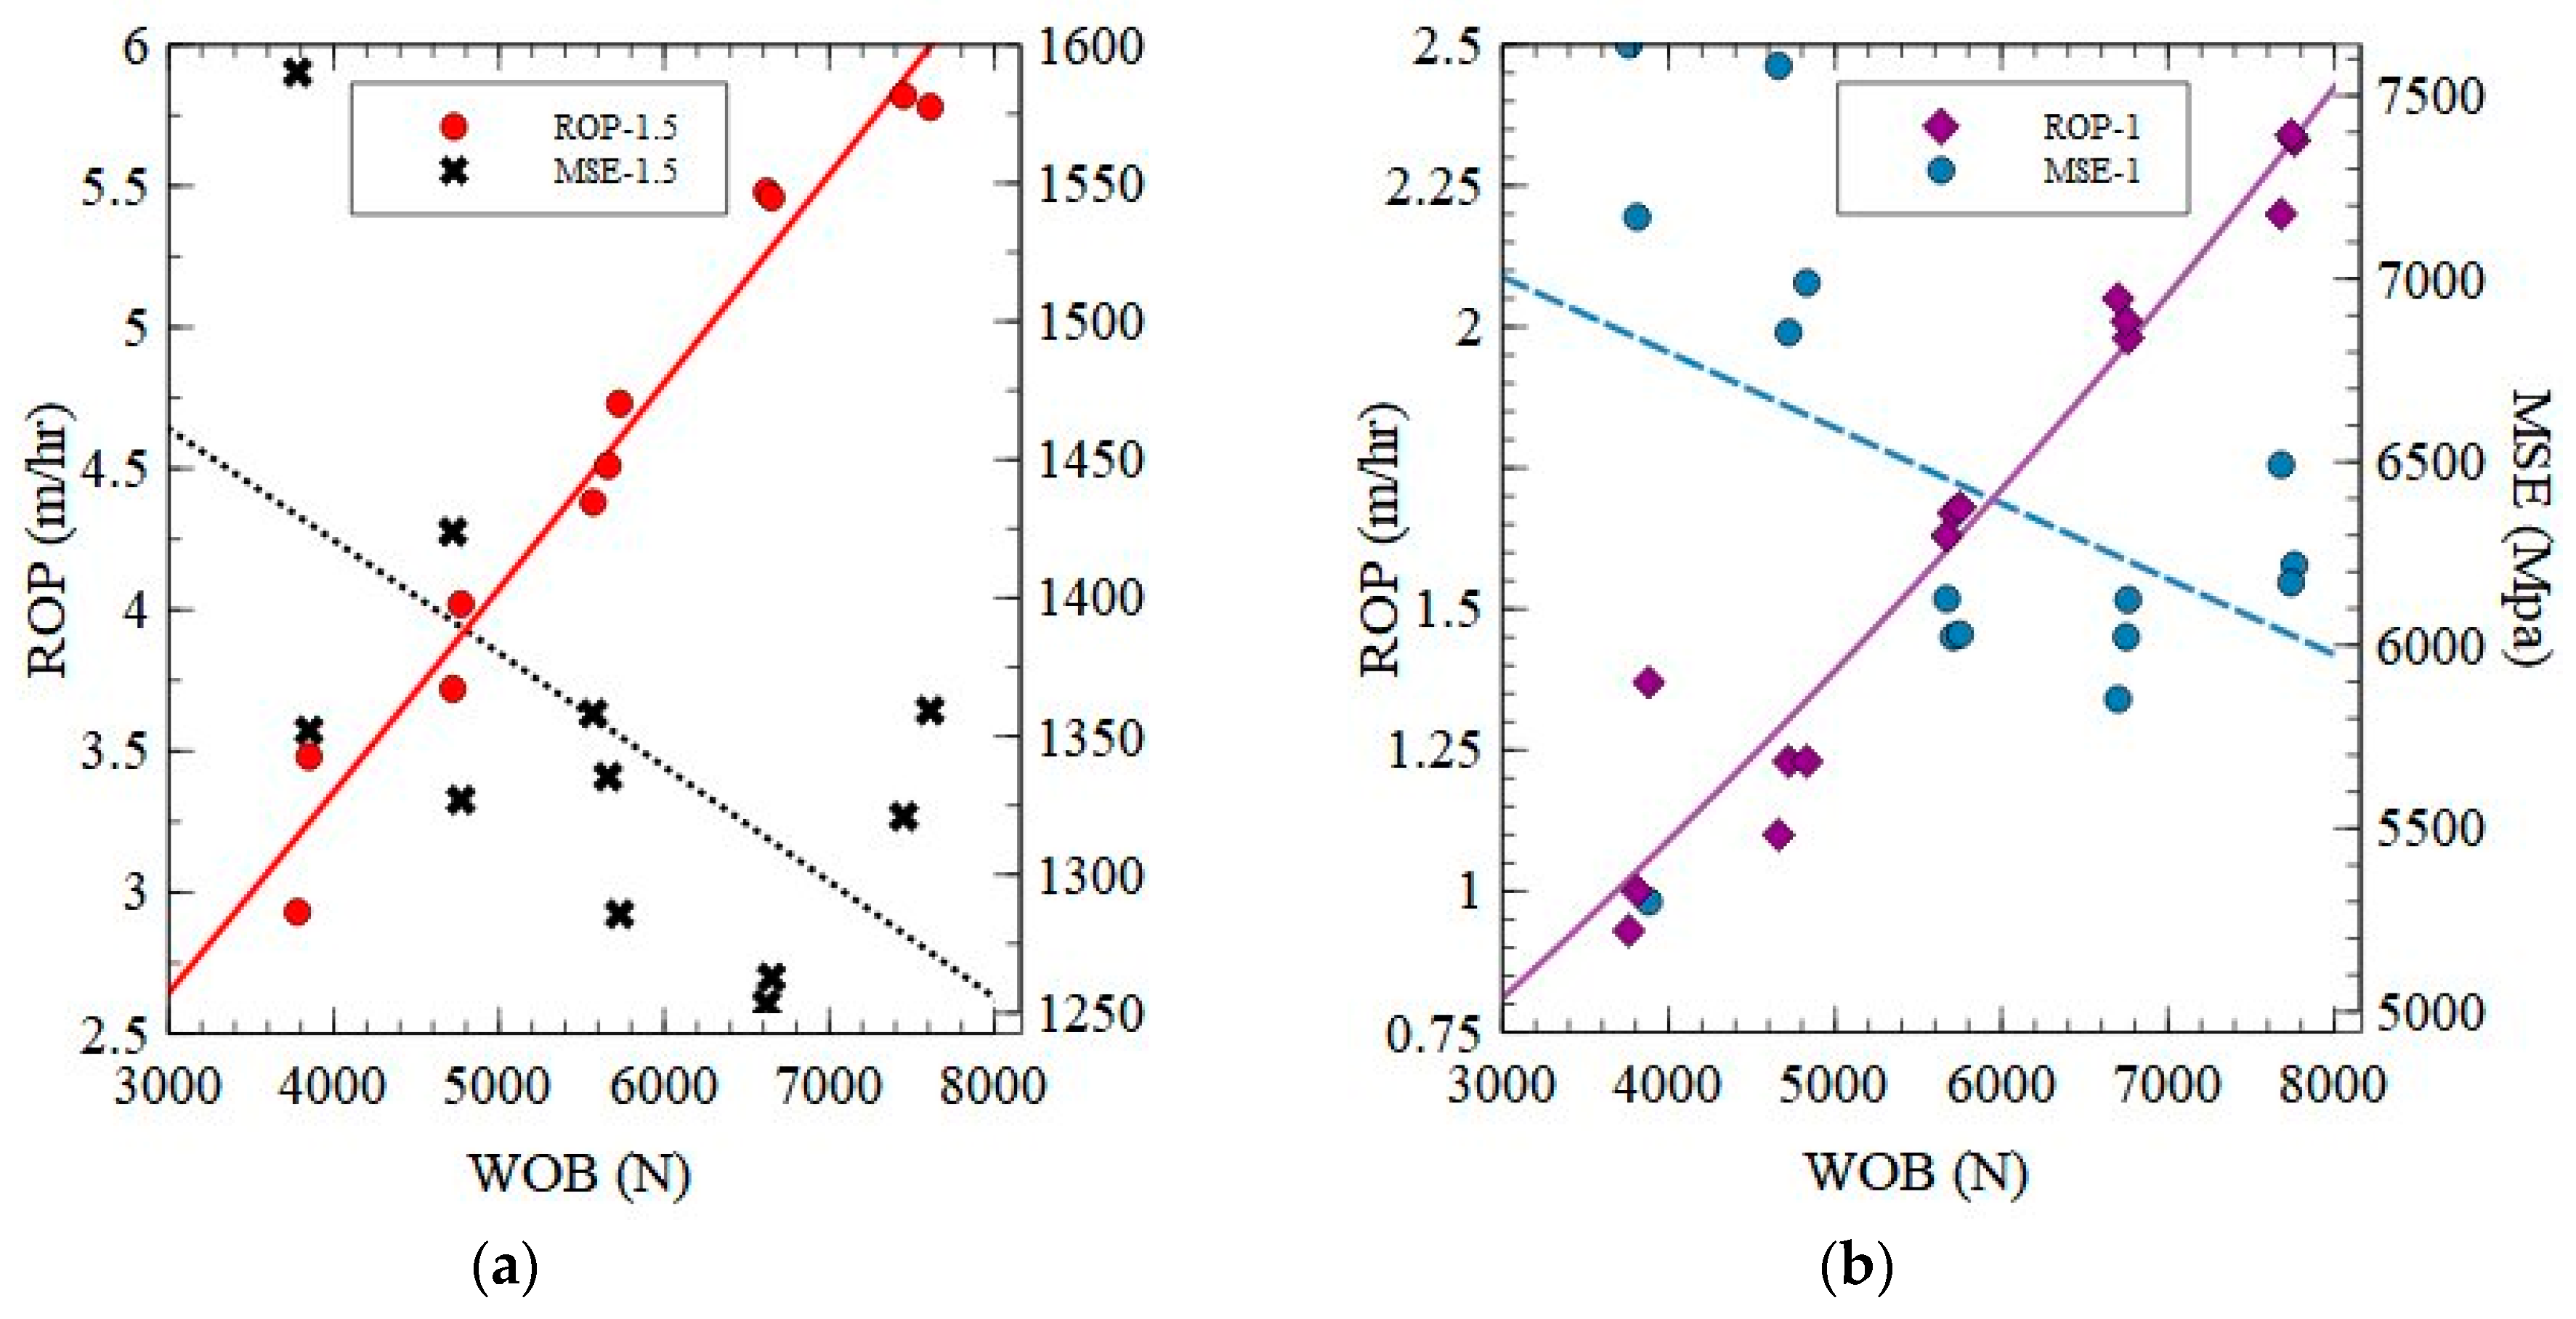
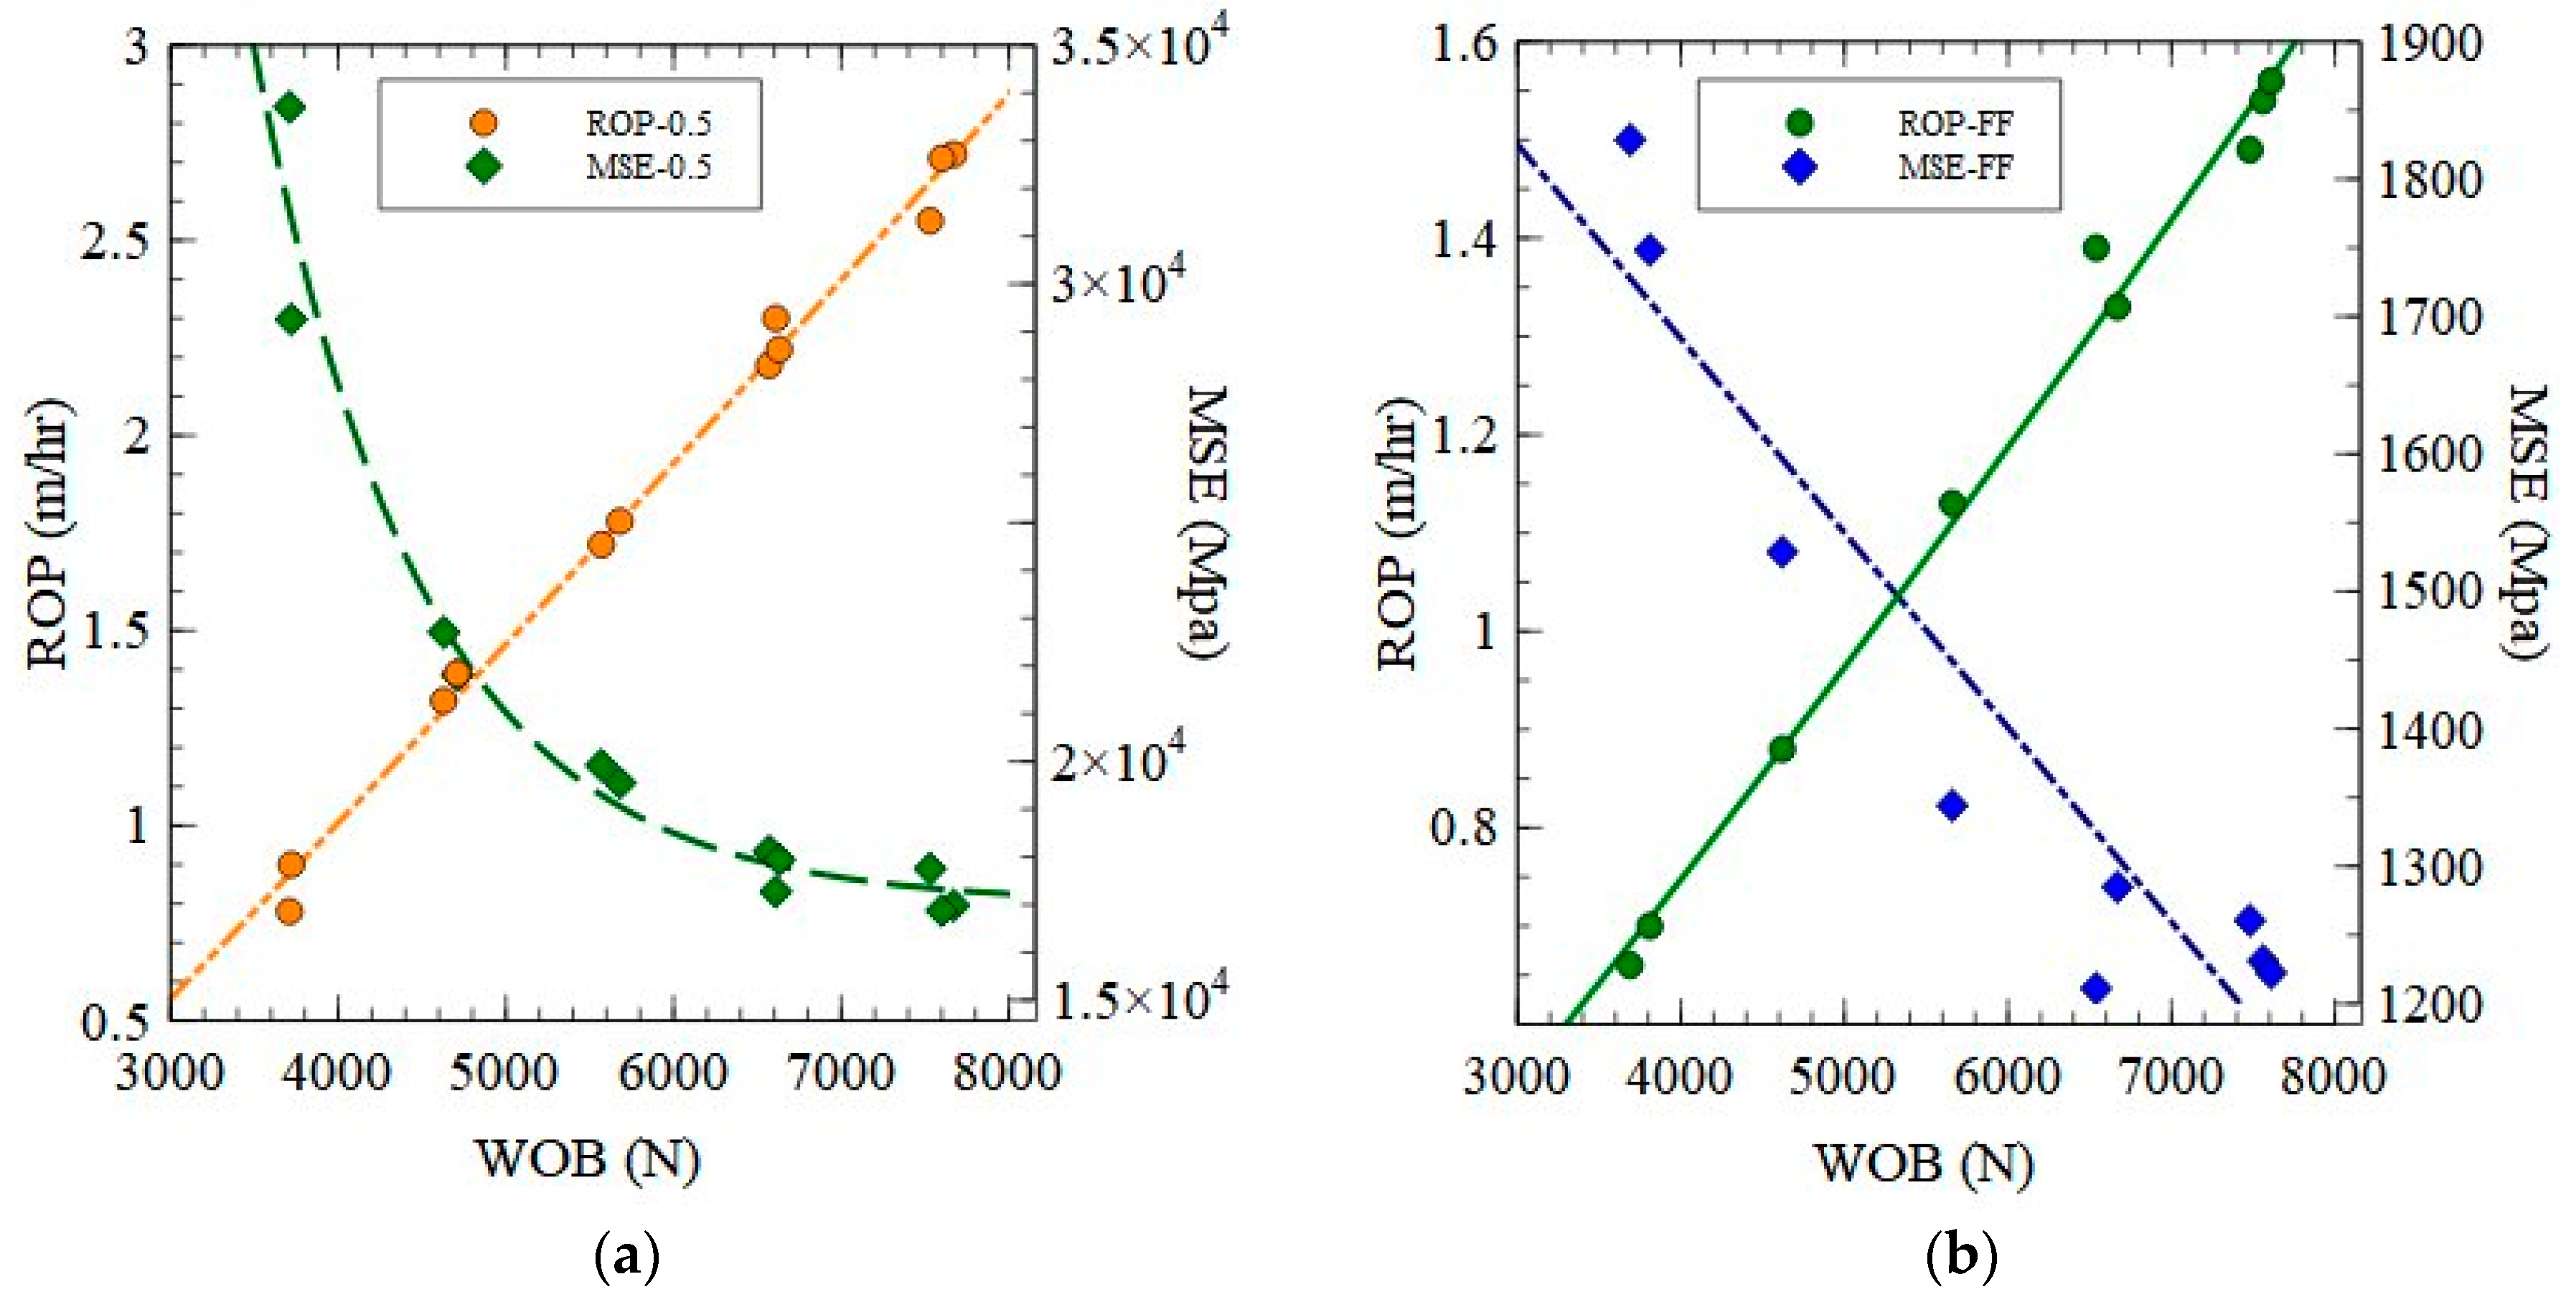
Figure 11 and
Figure 12 illustrate the Mechanical Specific Energy (MSE) results for various gabbro rock full-face (FF) and pilot hole diameters. The MSE values tend to rise for gabbro rocks as the diameter of the pilot hole decreases, indicating more difficult drilling conditions as smaller pilot holes require more energy to drill. Full-face (FF) has the highest MSE values, indicating that drilling without pilot holes uses the most power and emphasizes how challenging it is to penetrate the rock. Larger pilot holes (HO-1.5 and HO-1.0, for example) in gabbro rock produce lower MSE values, which denote more effective drilling. This pattern is more noticeable because the MSE decreases more noticeably as the diameter of the pilot hole grows. The diameter of the pilot hole and MSE values correlate negatively; larger pilot holes indicate lower MSE, which suggests higher drilling efficiency. This trend holds for gabbro rock, so utilizing larger pilot holes to improve drilling performance is a widely applicable strategy. In conclusion, this shows that larger pilot holes in gabbro and rocks increase drilling efficiency by lowering the MSE. The trends and correlations that have been observed highlight how crucial it is to optimize pilot hole size to maximize drilling efficiency, reduce energy consumption, and decrease wear on equipment, resulting in significant energy savings and lower operational costs.
5. Evaluating the Influence of Pilot Hole Diameter on Effective Rock Strength
The modified Maurer (1962) model is a useful tool for determining the effective rock strength (S) based on the drilling rate (ROP) data obtained under different pilot hole diameters [
18]. The calibrated model can be used in Equation (3) to estimate effective rock strength (S) for other pilot hole diameters.
Plotting Rate of Penetration (ROP) data against Weight on Bit (WOB) for every pilot hole diameter is the first step in the process. Next, the data are fitted to the modified Maurer equation, holding K and in constant, and only S is varied to determine the best fit. The S value for each diameter represents the effective rock strength for a given pilot hole size.
The equation relates ROP to these factors, showing that drilling performance depends on the balance between the force applied to the drill bit and the rock’s resistance. Experimental data are first calibrated at a specific pilot hole diameter to use the model, allowing for determining the calibration constants K and n, and the effective rock strength for that scenario.
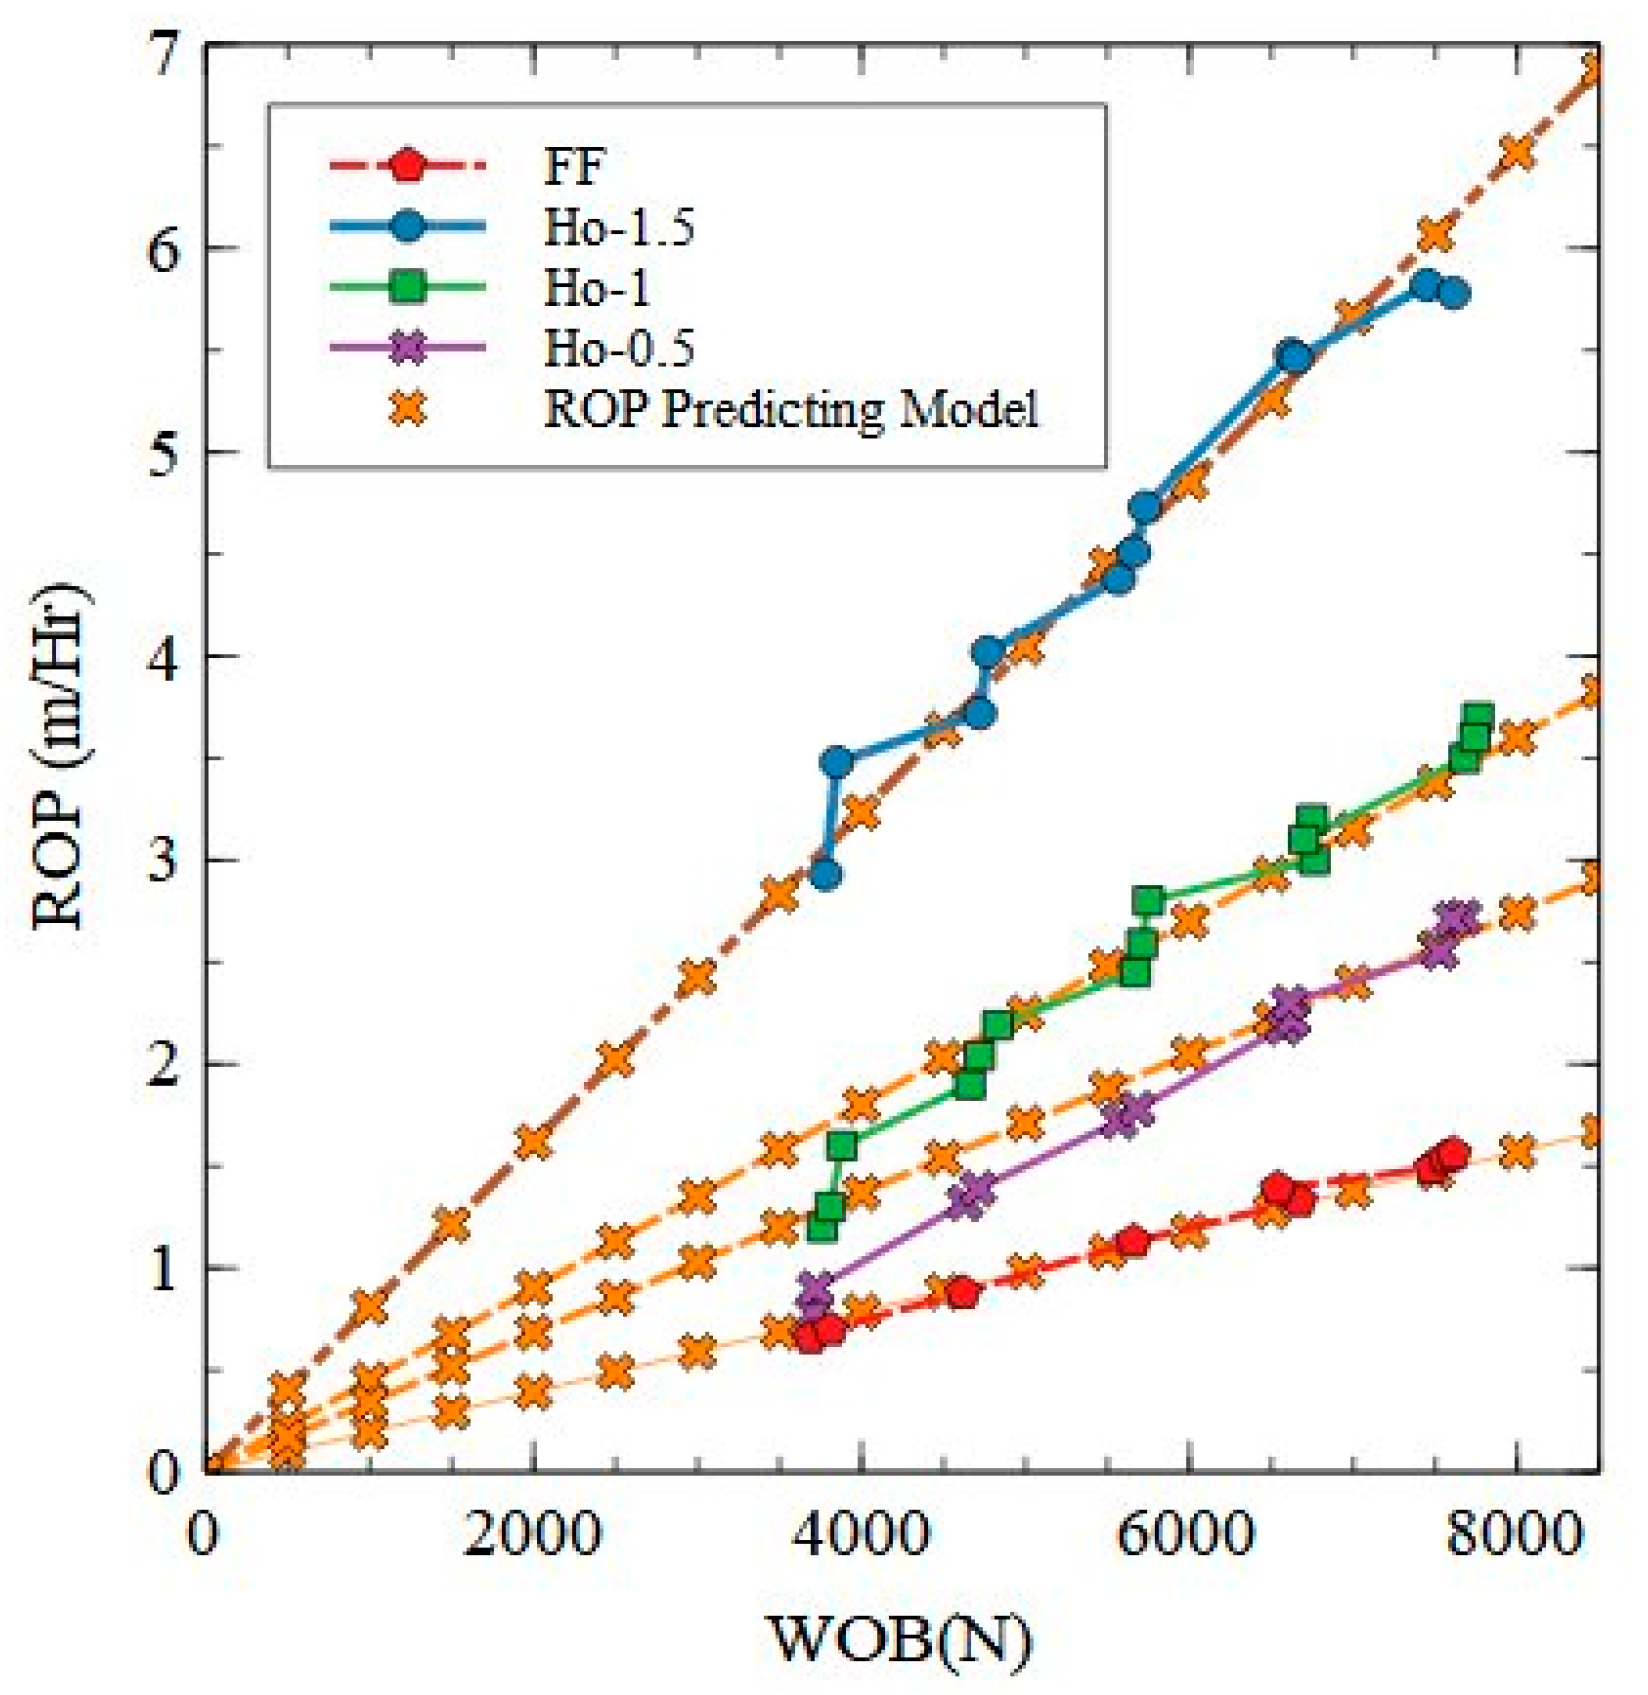
Using the modified Maurer model with a WOB exponent n = 1 and the calibration constant K = 3.15 ∗ 10
−6, simplifies the relationship between the rate of penetration (ROP) and the other variables, such as the weight on bit (WOB), effective rock strength (S), and bit diameters (Do and Di). The value n = 1 suggests a linear relationship between the WOB and ROP, as shown in
Figure 13, meaning that increasing the weight on the bit directly increases the penetration rate in a straightforward, proportional manner. Meanwhile, the calibration constant K = 3.15 asterisk operator 10 to the minus six ends superscripts derived from experimental data helps adjust the model to match the specific conditions of the studied drilling scenario. With these values, the model becomes more practical, assuming that no complex nonlinear scaling of the WOB is needed and that calibration constant (K) provides the necessary correction factor for the rock type and drilling conditions under investigation. This allows for the effective estimation of rock strength and performance for different pilot hole diameters with reasonable accuracy, especially when using the same drilling setup or similar rock formations. Overall, the modified Maurer model provides valuable insights into drilling performance but must be applied carefully, considering its limitations.
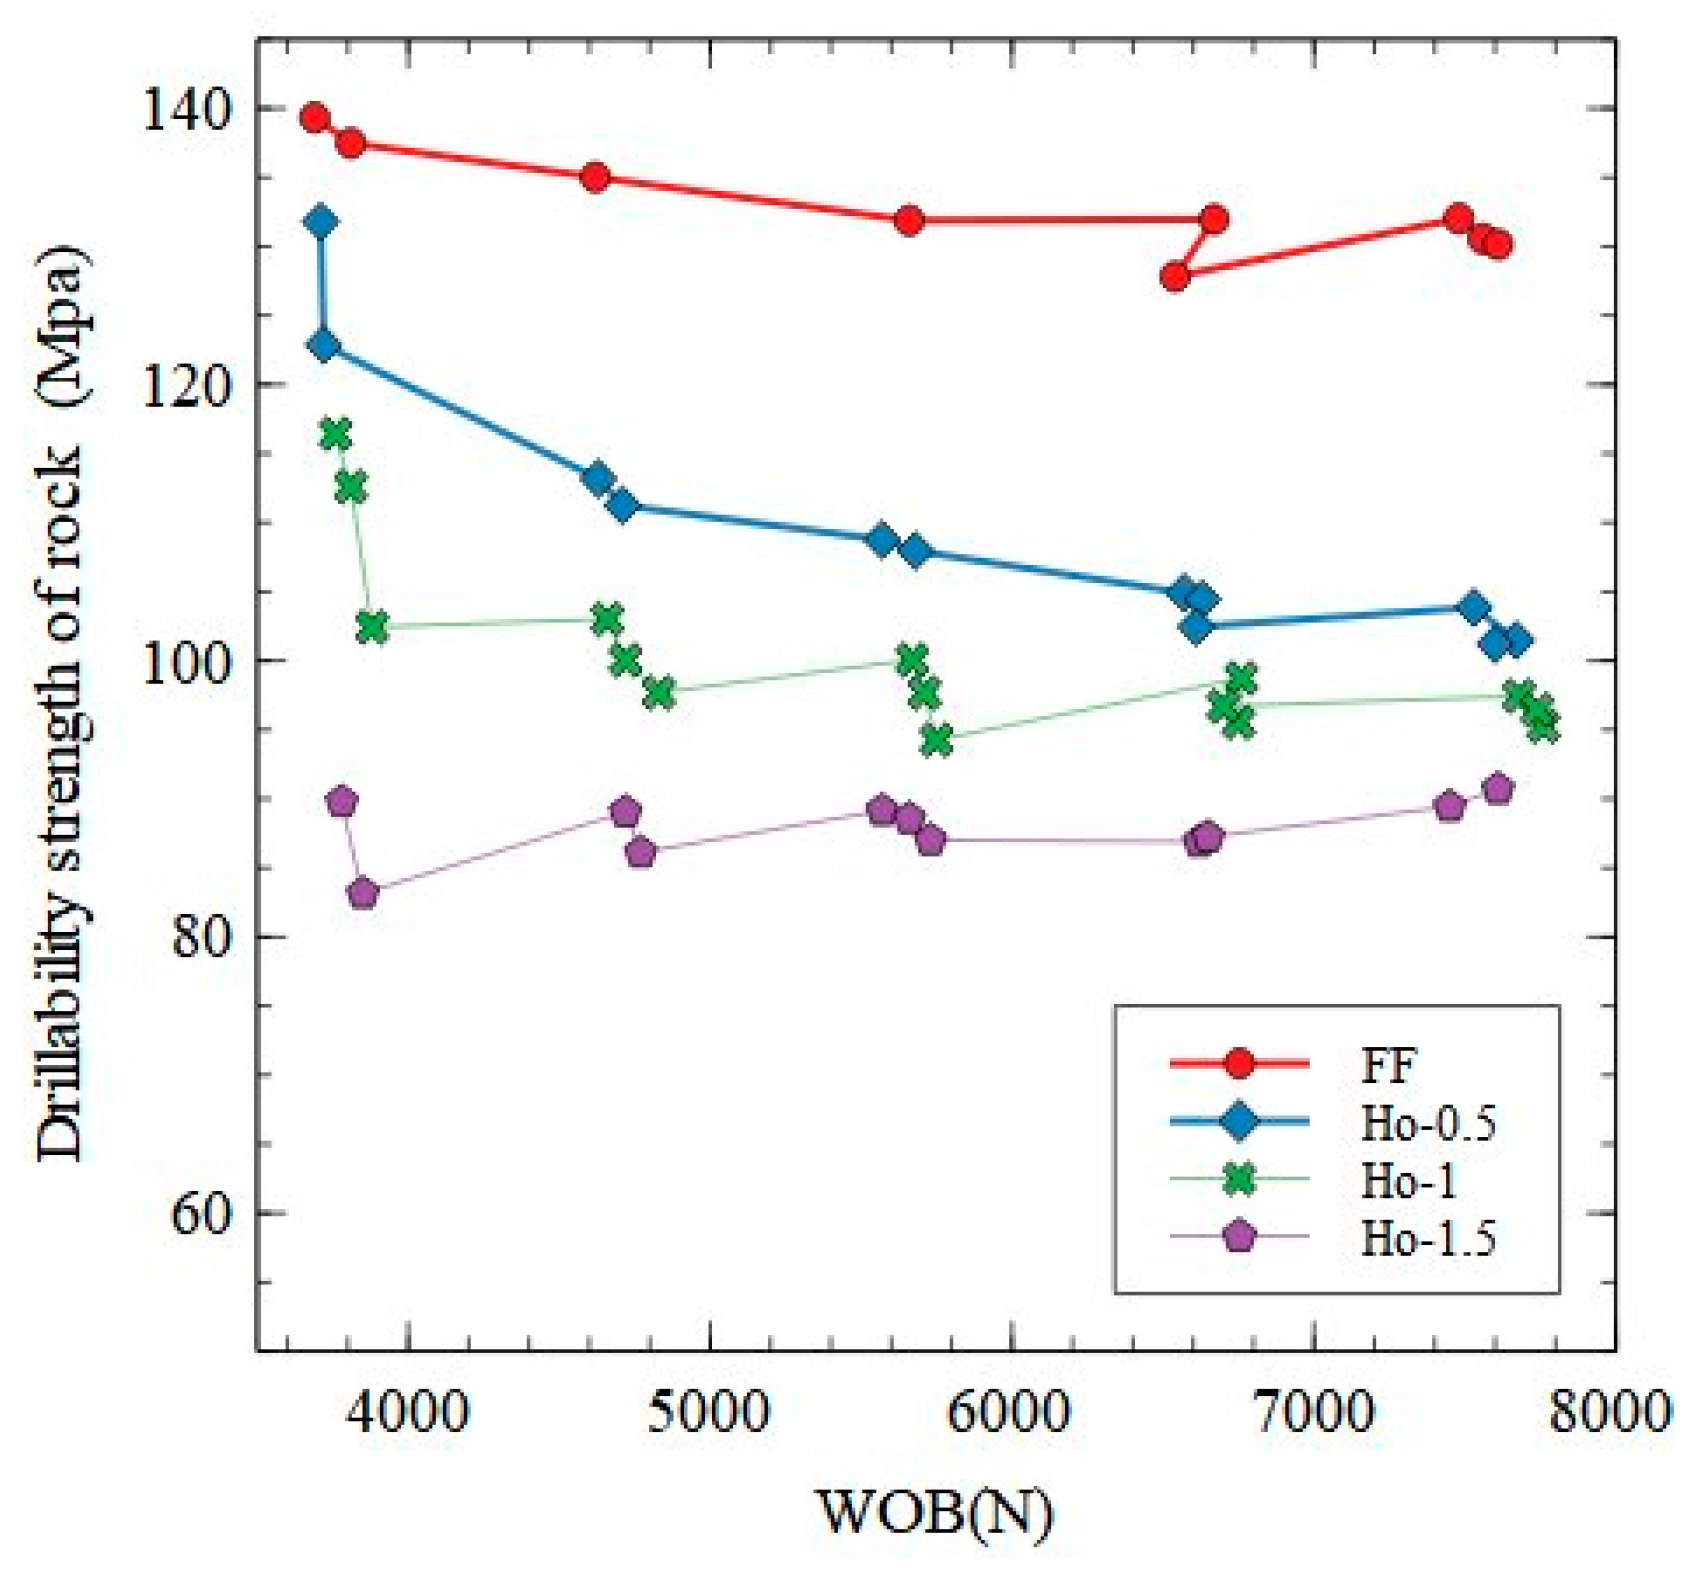
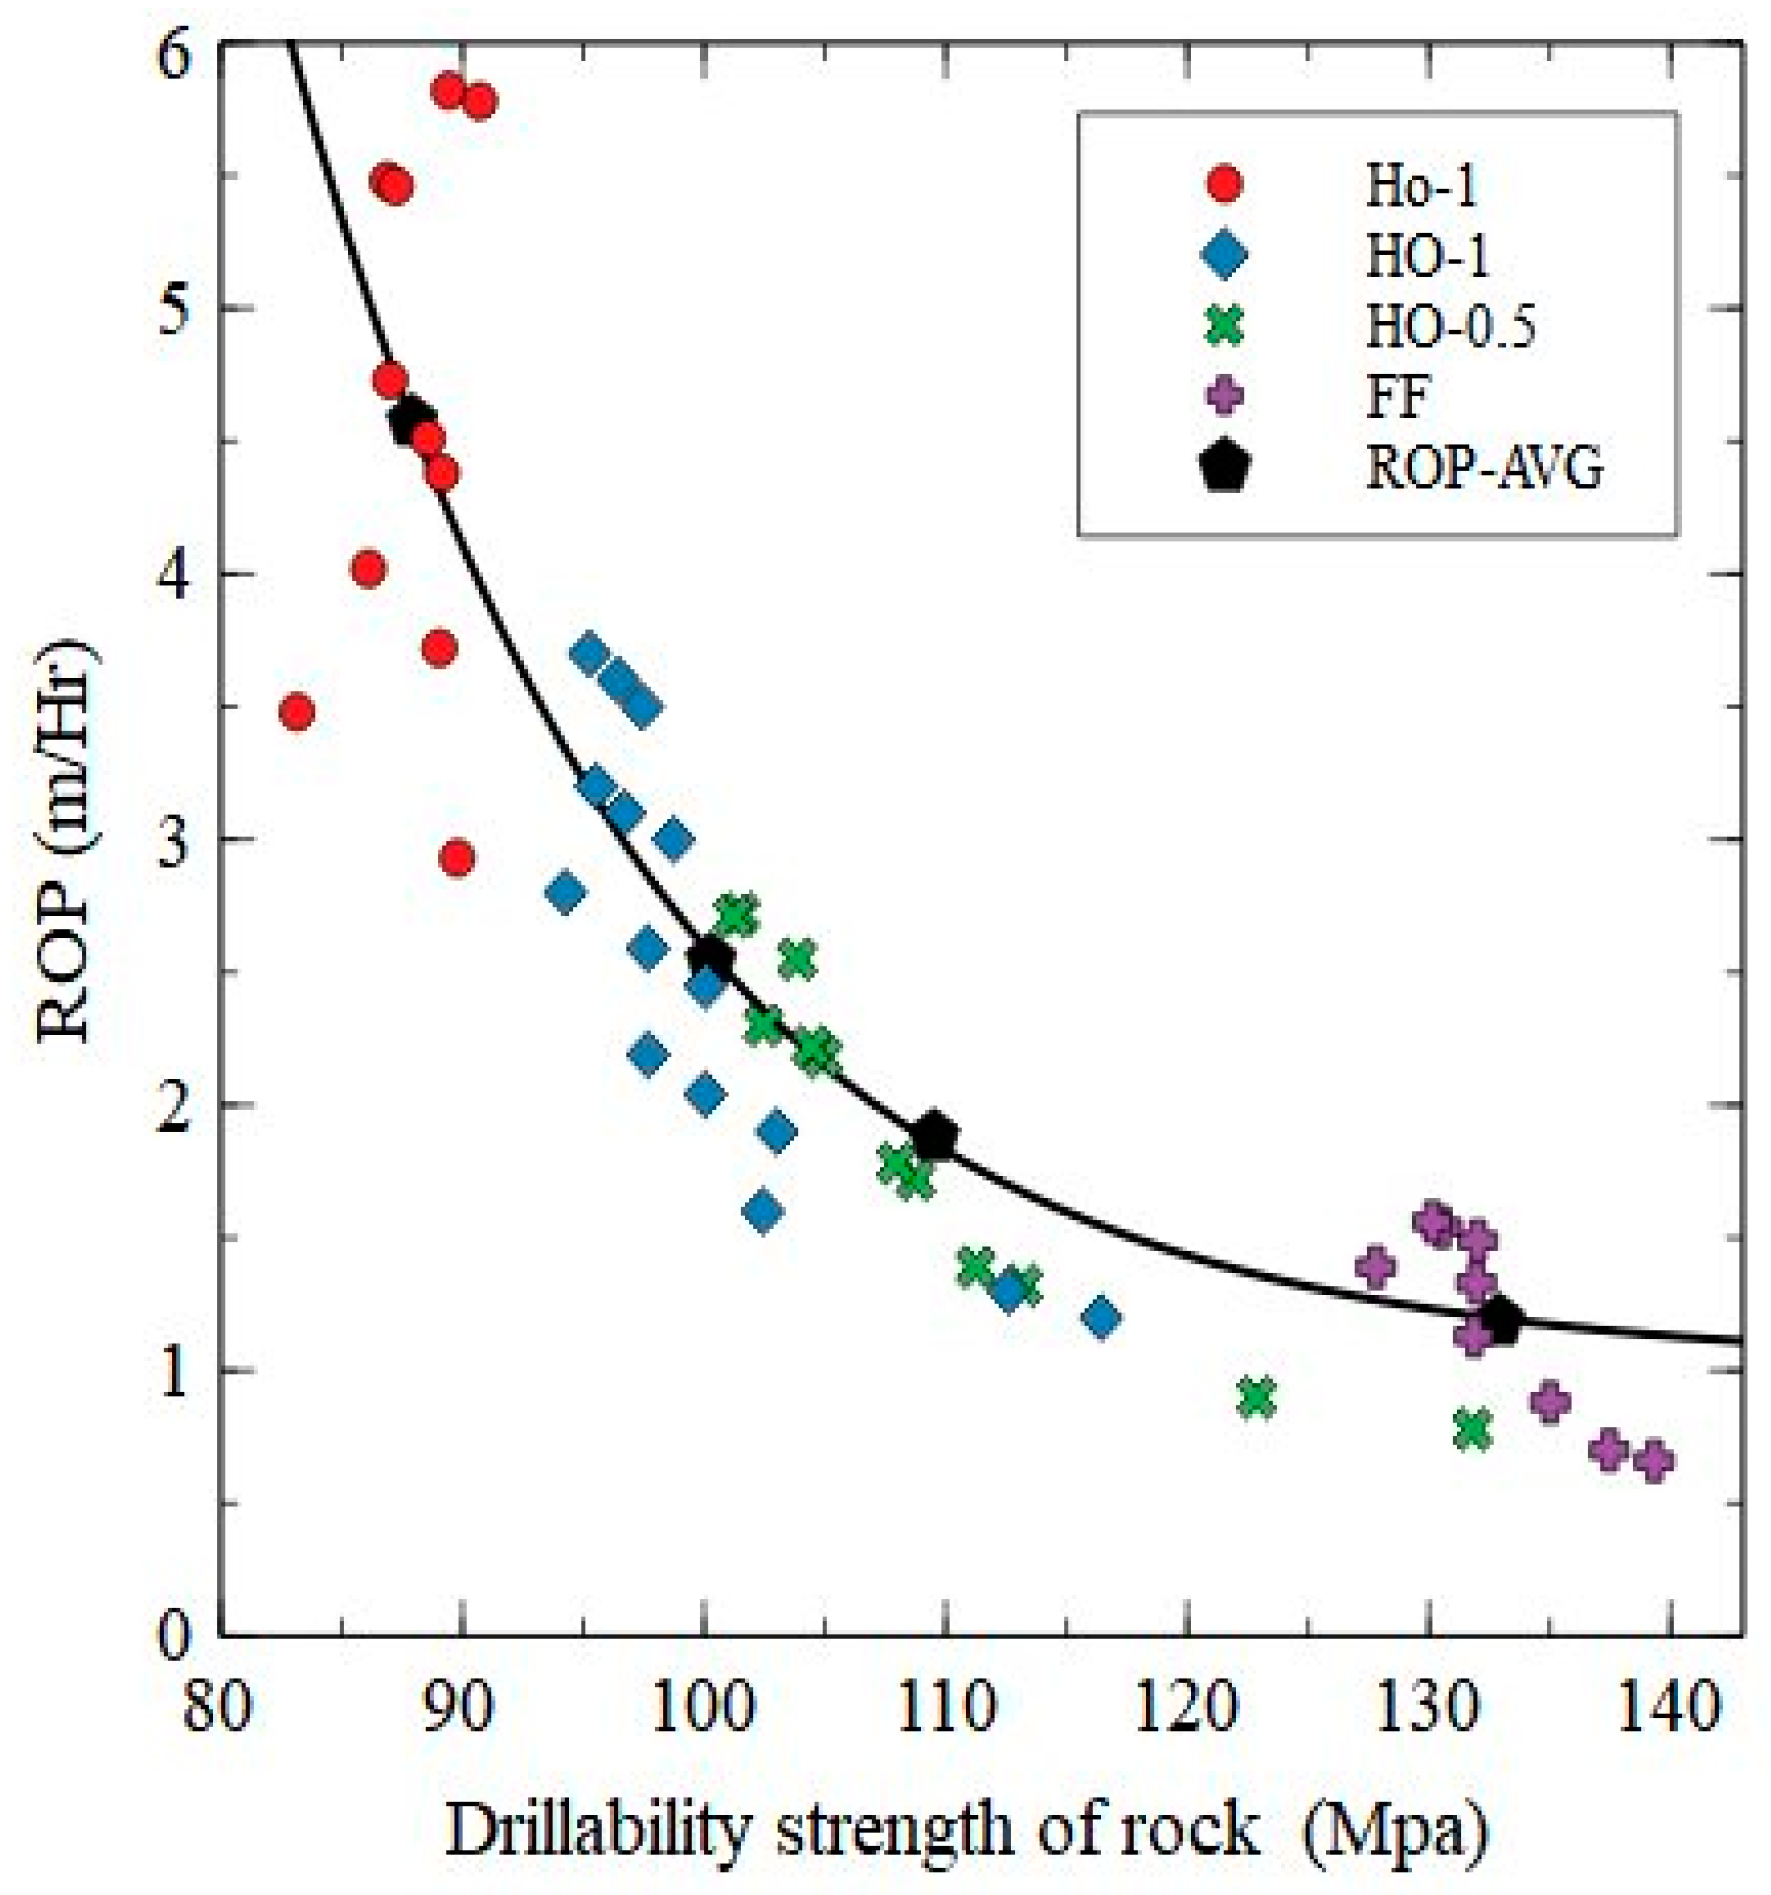
The drill ability strength of the rock is shown in
Figure 14 and
Figure 15, along with Weight on Bit (WOB) and Rate of Penetration (ROP) results (in N-m) for various configurations (HO-1.5, HO-1.0, HO-0.5, and full-face (FF) in gabbro rock.
Figure 14 shows that the drill ability strength decreases with increasing WOB for both gabbro. The full-face bit exhibits the steepest decline, indicating lower drilling efficiency. Larger pilot holes, like 1.5 and 1 inches, maintain greater drilling efficiency, which shows less abrupt drops. The 1.5-inch pilot hole lowers resistance and guarantees more steady and reliable drilling. In both types of rock,
Figure 15 demonstrates that larger pilot holes are correlated with higher ROP, with the full-face configuration showing the lowest ROP. With the highest ROP, the 1.5-inch pilot hole configuration makes it easier to penetrate the rock, uses less energy, and improves drilling performance overall. Reduced rock resistance, improved bit stability, optimized cutting efficiency, and successful debris removal are the reasons for the increased efficiency of the 1.5-inch pilot hole, which results in considerable energy savings and lower operating costs.
6. Discussion
Drilling efficiency benefits from larger pilot holes for several important reasons. Reducing the amount of rock the drill bit must cut through lowers overall resistance and makes it easier for the bit to penetrate, while using less energy to remove rock. Greater bit stability from larger pilot holes also helps to maintain a constant drilling pressure and direction by minimizing wobble and deviation. Lower energy consumption and more effective cutting are the results of this stability. Furthermore, bigger pilot holes maximize the area in contact with the rock for the drill bit, improving cutting effectiveness and lowering the Mechanical Specific Energy (MSE) needed for drilling. Additionally, they help remove debris more effectively, avoid clogging, and lessen bit wear and damage. This enhanced debris removal further increases drilling efficiency. Larger pilot holes also minimize mechanical stress on the drill bit and other equipment during drilling, which reduces wear and tear, extending equipment lifespan and lowering maintenance costs. Significant energy savings are achieved through decreased rock resistance, increased bit stability, improved cutting efficiency, better debris removal, and reduced equipment wear. These savings translate into lower operating costs and better drilling performance overall.
This study provides a valuable understanding of the effects of pilot holes on drilling performance and effective rock strength. However, several limitations need to be acknowledged. The experiments were conducted using a single rock type (high-strength gabbro), which may not fully represent the variety of geological formations encountered in real-world scenarios. Additionally, while the Large-scale Drilling Simulator (LDS) closely replicates field conditions, it cannot fully capture the complexity of downhole environments, including variations in pressure, temperature, and fluid interactions. Furthermore, the analysis focused on a limited range of pilot hole diameters, excluding configurations, such as varying depths or asymmetrical geometries, that could provide deeper insights. Tool wear and long-term effects were not considered, leaving gaps in evaluating the sustainability and cost-effectiveness of drilling practices over extended periods. Finally, the role of drilling fluids, essential for cooling, lubrication, and debris removal, was not thoroughly analyzed. These factors indicate areas where additional study is needed to improve the understanding and applicability of the results.
7. Conclusions
This study investigated the effects of pre-cored pilot holes on drilling performance and effective rock strength in multiple-diameter hole drilling scenarios. Many carefully thought-out experiments at Memorial University of Newfoundland’s Drilling Technology Laboratory have produced valuable insights into bit–rock interactions and drilling parameters. The principal findings of the investigation are as follows:
Drilling through pre-cored sections significantly improved the Rate of Penetration (ROP). For instance, the ROP in pre-cored sections was approximately 47% higher than in un-pre-cored sections under the same Weight on Bit (WOB) and rotational speed. This enhancement underscores the effectiveness of pilot holes in reducing resistance at the bit–rock interface.
Despite the increased ROP in pre-cored sections, torque values were consistently higher than in un-pre-cored sections. For example, the torque in pre-cored sections was approximately 10% greater than in un-pre-cored sections, indicating a complex interplay between the bit–rock interaction areas and drilling efficiencies in pre-cored intervals was approximately 28% higher than in un-pre-cored sections at 60 RPM, indicating increased energy consumption despite enhanced penetration rates.
Drilling with a 1.5-inch diameter pilot hole resulted in an approximately 45% higher ROP and 20% lower torque than the full-face (FF) configuration. A 1.0-inch pilot hole achieved a 25% higher ROP and 12% lower torque than FF drilling.
Larger pilot hole diameters, such as 1.5 inches, demonstrated a 35% lower Mechanical Specific Energy (MSE) than full-face (FF) drilling, reflecting improved energy efficiency. The 1.0-inch pilot hole configuration reduced MSE by 20% compared to full-face (FF) drilling, emphasizing the energy-saving potential of optimized pilot hole sizes.
The effective rock strength for a 1.5-inch pilot hole was approximately 30% lower than for FF drilling, indicating that larger pilot holes facilitate easier rock penetration by minimizing the rock’s resistance to the applied Weight on Bit.
The findings of this study highlight the necessity of a thorough approach to drilling performance analysis that considers not only conventional parameters like torque and ROP but also effective rock strength and MSE. Operators can make better decisions about drilling strategies, tool selection, and parameter optimization to increase efficiency and lower costs by considering the effects of pre-cored holes, bit–rock interactions, and the influence of formation strength on drilling parameters.
8. Future Research
Based on the interesting results obtained from this research, further investigations are planned to explore the relationship between pilot holes and the influenced drilling parameters. This includes more diverse pilot hole configurations, such as varying depths and asymmetrical geometries, as well as various rock formations and bit types, like Stinger. This will further enhance the understanding of pilot hole effects.
Evaluating drilling penetration mechanisms using 3D Distinct Element Modelling (DEM) e.g., for evidence of micro cracks.
Optimizing drilling performance by using different tools, e.g., Vibration-Assisted Rotary Drilling (pVARD) tools.
Analyzing additional parameters, cutting size distribution, and microscopic analysis of the drilled formations will provide a more comprehensive understanding. Furthermore, the role of drilling fluids should be explored in greater detail to account for their cooling, lubrication, and debris removal effects.


 ,
, 


