Abstract
The presence of isolated stones in the soil layers of engineering sites has significantly increased. Currently, the existing methods for dealing with isolated stones are inadequate to meet engineering needs. This paper combines pile-planting technology with isolated stones to incorporate them into the load-bearing system, resulting in a new type of pre-drilled composite pile suitable for isolated stone sites. A visualization testing system for pile-soil deformation is developed using Particle Image Velocimetry (PIV) technology and transparent soil, conducting non-intrusive model tests on pile-planting and boulder-capped piles under different uplift load conditions, and comparing the results with a discrete-continuous coupled three-dimensional numerical model analysis. The results indicate that when an isolated stone with a cross-sectional area four times that of the pile exists at the pile tip, the ultimate pullout bearing capacity of the pile increases by a factor of two. Regarding the distribution of internal and external side friction resistances of the core and outer concrete of the piles, the internal friction resistance of piles without isolated stones is approximately 1.47 times that of the external friction resistance and about 0.8 times the ratio of the diameters of the pile and core. For piles with isolated stones at the tip, the internal friction resistance is approximately 1.37 times that of the external friction resistance. Under the ultimate load, the displacement field around the pile without an isolated stone exhibits an “inverted triangular” distribution; the displacement field around the pile with an isolated stone at the tip exhibits a “trapezoidal” distribution. This study investigates the bearing capacity and load transfer mechanisms of the new pre-drilled composite piles in isolated stone engineering sites, and the research findings may provide new solutions for similar construction projects involving rubble reclamation.
1. Introduction
With the increasing number of high-rise buildings, the tightening of construction land, and the growing complexity of construction conditions, the requirements for pile foundation construction technology have become increasingly stringent [1,2,3,4,5]. Planted pile is a composite foundation type formed by pouring concrete or cement mortar into pre-drilled holes and then inserting precast pipe piles into the concrete or mortar; currently, piling technology is relatively mature, with sufficient theoretical and practical references available [6,7,8].
As construction land becomes scarcer and related projects such as land reclamation and rock dumping emerge, the prevalence of isolated stones within the soil layer has significantly increased, greatly impacting engineering projects. To prevent the occurrence of an isolated stone within the designed length area of the project’s pile foundation, past measures often included avoidance, excavation, blasting, and the consolidation of multiple piles [9,10,11]. However, isolated stones are characterized by widespread distribution, density, and random shapes; thus, implementing these measures not only fails to resolve the problem completely, but also consumes a substantial number of resources and amount of time.
To address these issues, composite piles have been widely used, with researchers both domestically and internationally conducting multifaceted theoretical and experimental studies on the load-bearing capacity of composite piles, exploring their bearing performance [12,13,14], load transfer mechanisms [15,16,17], failure modes, and settlement characteristics [18,19]. Kobayashi et al. [20] conducted an in-depth study on the construction techniques of composite piles formed by bamboo and concrete piles, suggesting that an expanded drilling method can be applied to the lower half of the pile body to increase the cross-sectional area of the concrete pile, thereby enhancing the load-bearing capacity of the composite pile. Yu et al. [21], in their study of T-shaped deep cement mixing piles, developed calculation methods for reinforcing ground consolidation settlement and its consolidation process. Through theoretical and parameter analyses compared with existing solutions, they found that enlarging the pile cap leads to a faster dissipation of excess pore water pressure while increasing the height and area replacement ratio of the pile cap significantly reduces ground consolidation settlement. Voottipruex et al. [22] utilized numerical simulations to analyze the horizontal and vertical bearing performance of composite piles, investigating the effects of different core pile areas and insertion depths on the load-bearing capacity of concrete-deep mixing composite piles (DCM piles). They concluded that the destruction simulation of pile foundations is influenced by the insertion depth of the core pile, with varying insertion depths leading to different failure modes of the DCM pile. Jamsawang et al. [23] conducted large-scale field tests to investigate the impact of core pile area and pile length on the ultimate load-bearing capacity of composite piles. They found that as the area of the core pile and the length of the core pile increase, the ultimate load-bearing capacity of the composite pile also improves, with the increase in core pile length contributing more significantly to this enhancement. Zhou et al. [24] compared the compressive load-bearing capacities of static drilling planted piles and bored concrete piles through field static load tests and numerical simulations, concluding that static drilling piles exhibit greater load-bearing capacity than bored concrete piles, with the load of composite piles primarily borne by the core pile. Similar composite pile foundations have been extensively studied domestically; however, they remain unsuitable for large isolated stones and stone clusters, which still require manual removal.
The rock-embedded piles and enlarged base piles of the pre-drilled piles primarily introduce an additional load-bearing system at the pile base or increase the cross-sectional area of the pile base to enhance the load-bearing capacity and stability of the pile foundation. Mary et al. [25] conducted experimental studies on the uplift behavior of enlarged base piles in layered strata using a semi-infinite small-scale 1 g model and Particle Image Velocimetry (PIV) technology. Anchoring the pile base into deeper and stronger strata is beneficial for enhancing the pile’s uplift capacity. Yang et al. [26] utilized the Material Point Method (MPM) to simulate centrifuge uplift tests of enlarged base piles in sand soil. The results indicate that piles with expanded bases exhibit good compressive and uplift load-bearing capacities. The aforementioned methods effectively enhance the pile’s load-bearing capacity; however, the randomness of boulder distribution in the construction site was not considered during pile installation.
To further mitigate the impact of isolated stones on construction, targeted pre-treatment based on preliminary detection results is employed in conjunction with pile planting technology by first creating a hole and then inserting high-strength concrete prefabricated piles; additionally, drilling is performed in the core area of the isolated stone, integrating it into the bearing system so that the isolated stone and the planted pile function collectively as a unified support, thus forming a novel pre-drilled composite planted pile suited for isolated stone strata.
In summary, this research addresses the gap in the study of load-bearing capacity and load transfer mechanisms of a new type of pre-drilled composite pile, which combines the advantages of expanded base piles and composite piles suitable for isolated rock formations. This study conducts static pullout tests based on transparent soil technology, comparing the pullout resistance characteristics of planted piles and planted piles with isolated stone at the pile tip. Furthermore, the load transfer mechanism, deformation displacements, side friction resistance of the planted piles, and interaction between the piles and surrounding soil are analyzed. Additionally, a discrete-continuous coupled three-dimensional numerical model is also established, allowing for comparative analysis with the uplift static load tests of the planted piles to clarify the detailed load characteristics of the strata and structures. This study could provide valuable insights for managing large isolated stones in fill stone strata.
2. Design of the Planted Pile Foundation Model Test Based on Transparent Soil
Transparent soil possesses physical and mechanical properties similar to those of natural soil, has stable chemical properties, and features unique transparency, which makes it valuable for geotechnical testing. By integrating laser speckle technology, we conducted uplift tests on piles and pile shafts with isolated stones in transparent soil to explore the load transfer mechanism under various uplift loads and the interactions between the pile and the surrounding soil.
2.1. Planted Pile Foundation Model Test Apparatus
The model test device for the uplift bearing capacity of planted pile foundations based on transparent soil is shown in Figure 1a. The model was prepared to avoid the effects of size, referencing literature [27], which demonstrates that the influence range of static pile loading on surrounding soil is 8R (where R is the pile radius); additionally, considering the maximum transparency of the transparent soil, the internal dimensions of the box are selected as length × width × height = 400 mm × 200 mm × 450 mm, with the model box made from 5 mm thick transparent acrylic sheets. The testing load system consists of a reaction frame, pulling ropes, fixed pulleys, weight trays, and weights. Two fixed pulleys are secured to the reaction frame (one positioned at the center point of the model box, with distances of 200 mm and 100 mm from the edges of the box). One end of the pulling rope is connected to the top of the pile, while the other end passes around the pulley to connect to the weights tray. The upward load is applied to the pile top by incrementally increasing the weights on the weights tray. The pile foundation is located at the center point of the model box, with distances of 200 mm and 100 mm from the length and width edges, respectively. A displacement gauge with a range of 20 mm is placed at the bottom of the weight tray to measure the vertical displacement of the top of the pile under each level of loading. Figure 1b displays the physical diagram of the test apparatus, where the test system primarily consists of an optical platform, model box, laser, loading system, data acquisition system, digital camera, and post-processing system.
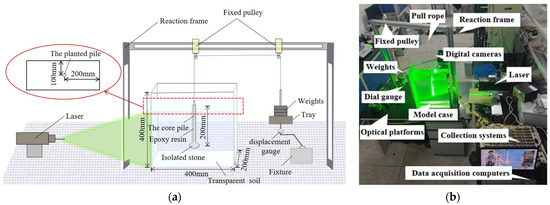
Figure 1.
Transparent soil model test device for planted piles; they should be listed as: (a) schematic diagram of the test apparatus and (b) physical diagram of the test apparatus.
2.2. Preparation of Transparent Soil and Planted Pile Foundation Model
Transparent soil is mainly composed of skeleton particle material and pore fluid with the same refractive index as the skeleton material. To better simulate natural sandy soil tests, fused quartz sand with a particle size range of 0.1 to 1.0 mm is selected as the skeleton material for the transparent soil. At room temperature (22 °C), n-dodecane and #15 white oil are mixed in an approximate volume ratio of 1:8 to create a pore solution. Once the solution is thoroughly mixed, its refractive index is measured using an Abbe refractometer. The ratio of the two liquids is slightly adjusted based on the refractive index of the mixed solution until it reaches 1.4585 (the same as that of quartz sand). After preparation, the pore solution is poured into the model box lined with quartz sand. Following thorough mixing, vacuum treatment is conducted for approximately 30 min. Once completed, the model box is placed in a constant temperature chamber at 22 °C for 1 day to allow the soil particles to fully consolidate, making it ready for subsequent experiments.
To investigate the uplift bearing capacity of the pile foundation and the effect of the presence of isolated stones on this capacity, the current transparent soil model test simulates pile foundations with isolated stones at the pile tip. The test conditions are detailed in Table 1.

Table 1.
Model test plan.
Pile foundations typically consist of tubular piles and surrounding concrete. In the model test, the core pile of the foundation is made of hollow aluminum tubes, while the outer concrete is represented using epoxy resin, with a layer of quartz sand wrapped around the external surface to simulate the real pile formation effect, according to the referenced engineering and similarity ratio of the tests.
The models are similarity systems constructed based on prototypes, which exhibit a proportional relationship in geometric features and physical quantities. This relationship allows us to infer the corresponding physical quantities of the prototype system by measuring the physical quantities in the model system, which is referred to as the similarity condition. Under elastic conditions, the similarity equations are as follows [28]:
In Equation (1), represents the unit weight similarity ratio; , the geometric similarity ratio; , the stress similarity ratio; , the strain similarity ratio; , the displacement similarity ratio; and , the elastic modulus similarity ratio.
To mitigate the impact of size effects and to account for the maximum transparency of the transparent soil, the geometric similarity ratio () was established at 0.01, the unit weight similarity ratio () of the soil at 1, and the elastic modulus similarity ratio () at 0.01. Consequently, the similarity ratio of the stress fields () between the prototype and the model is 0.01, the strain similarity ratio () of the soil is 1, and the displacement similarity ratio () of the soil is 0.01.
The diameter of the field prototype pipe pile is 1.2 m (with a wall thickness of 0.25 m), while the diameter of the planted pile is 1.8 m, and its length is 20 m. According to the geometric similarity ratio of 1:100, the diameter of the model pipe pile is 12 mm (with a wall thickness of 2.5 mm), and its length is 200 mm. The diameter of the model planted pile is 18 mm. In the model tests, the core pile of the planted pile is made of a hollow aluminum tube, while the outer concrete of the planted pile is made of epoxy resin. The elastic modulus of aluminum is 70 GPa, while the elastic modulus of the prototype pipe pile is 38 GPa; thus, the constant of the similarity ratio of the elastic modulus of the pipe piles does not conform to theoretical predictions. Adjustments to the wall thickness of the model core pile were made to ensure that the model pile, surrounding concrete, and the soil at the pile base satisfy the principle of equal relative compressive stiffness:
In Equation (2), is the elastic modulus of the pipe pile, is the elastic modulus of the concrete, is the elastic modulus of the soil, is the cross-sectional area of the pipe pile, is the cross-sectional area of the concrete, and is the cross-sectional area of the soil at the end of the root pile. The modulus of elasticity of the model pile was measured by a uniaxial compression test.
Finally, the model was adjusted to have a diameter of 18 mm, with a core pile outer diameter of 10 mm and a wall thickness of 1.5 mm, as depicted in Figure 2a. To ensure that the pile foundation is fully embedded in the soil and meets experimental requirements, a length of 20 cm is chosen for the pile. Additionally, black paint is sprayed on the surface of the aluminum tube to prevent laser reflections that might affect image quality. The model of the pile foundation is shown in Figure 2b.
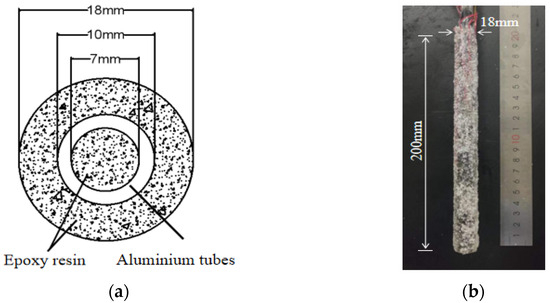
Figure 2.
Planted pile model; they should be listed as: (a) cross-section of planted piles and (b) physical drawing of planted pile model.
The strain gauges used in this experiment are model 120-1AA micro strain gauges, which have a range of 20,000 microstrains. These strain gauges are mounted within epoxy resin and protected with plastic sheets, as shown in Figure 3a. Seven monitoring sections were arranged along the longitudinal direction from the bottom of the pile on the outer surface of the aluminum tube and in the epoxy resin, with a spacing of 3 cm, and strain gauges were attached to obtain the strain of the pile at those sections. The distribution of the core pile strain gauges is illustrated in Figure 3b. There exists a certain relationship between the strain () of the pile and the load (), as well as the cross-section area () of the pile. By using this relationship (), the axial force of the pile is calculated, allowing for the determination of the axial force distribution in both the core pile and the surrounding concrete.
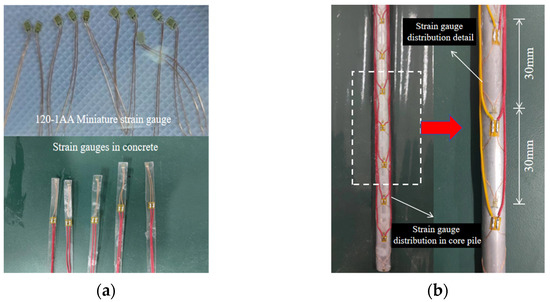
Figure 3.
Strain gauge arrangement; they should be listed as: (a) strain gauge and (b) strain gauge arrangement detail.
As shown in Figure 4a, the isolated stone is ellipsoidal (with the lengths of the major axis, minor axis, and thickness being 22.5 mm, 15.0 mm, and 30.0 mm, respectively). A cylindrical hole with a diameter of 18 mm and a depth of 15 mm is retained on the surface of the isolated stone for inserting the model pile. To avoid the impact of laser reflections on image analysis, the model isolated stone is made of transparent resin material using 3D printing. The isolated stone-supported pile foundation model is illustrated in Figure 4b.
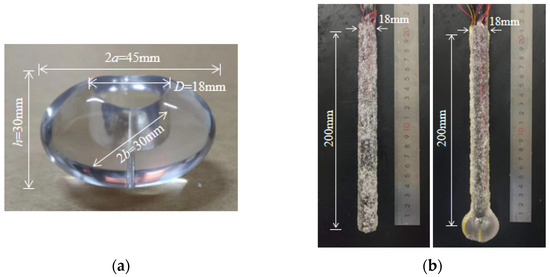
Figure 4.
Isolated stone model and single pile model; they should be listed as: (a) isolated stone model and (b) planted pile model.
2.3. Experimental Conditions for the Planted Pile Model
To obtain the Q-S curve, strain gauges are arranged on the outer surface of a hollow aluminum tube to measure the axial force in different parts of the pile during loading. Loading is conducted by incrementally adding weights to the top of the pile. Loading increases to the next level only when the pile settlement is less than 0.01 mm within 20 min and the axial force stabilizes. If the settlement at the pile head under one level of loading exceeds twice that of the previous loading level, or if a significant inflection point appears on the Q-S curve under that loading, the loading will be terminated. During the loading of the transparent soil experiment, photographs are taken of the core area near the model pile for analysis with PIVLab software (R2022a), enabling the understanding of the displacement field around the pile body.
3. The Numerical Model for Planted Pile
3.1. Discrete-Continuous Coupled Three-Dimensional Numerical Calculation Method
To further investigate the detailed load-bearing characteristics of the soil layer and structure, a discrete-continuous coupled three-dimensional numerical model based on FLAC3D and PFC3D is employed for analysis, with results compared against the experimental results.
The coupling of the continuous region in FLAC3D and the discrete region in PFC3D requires the creation of independent coupled domains at the boundary regions of both FLAC3D and PFC3D. The coupled domains facilitate the interaction between structural elements such as spheres and clusters with solid elements, utilizing wall elements as the medium for interaction in this simulation. In the coupling analysis, the mesh of the wall elements is consistent with that of the solid and structural elements, with the basic unit being triangular mesh elements.
3.2. Constitutive Model and Material Parameters
The dimensions of the numerical simulation model are consistent with those of the experimental model, measuring 400 mm in length, 200 mm in width, and 400 mm in height; the coupled model is shown in Figure 5. The numerical coupling model primarily consists of two modules: the pile and the soil. The pile structure uses solid elements from FLAC3D, while the soil employs sphere elements from PFC3D, and the isolated stone is modeled using rigid clusters in PFC3D. After extensive trials, matching particle and wall parameters are selected to form the numerical model. Sand is formed from particles; to improve computational efficiency, the particle diameter in the soil model is set to 3–5 mm. Using the distribute method [29], particles with a porosity of 0.4 are generated in the specified region, resulting in a total of 160,000 particle spheres, with a friction coefficient of 0.4 between the particles. The friction coefficient between the particles and wall elements is set to 0.1 to reduce the friction force exerted by the wall elements on the particle units during equilibrium, thereby minimizing boundary effects.
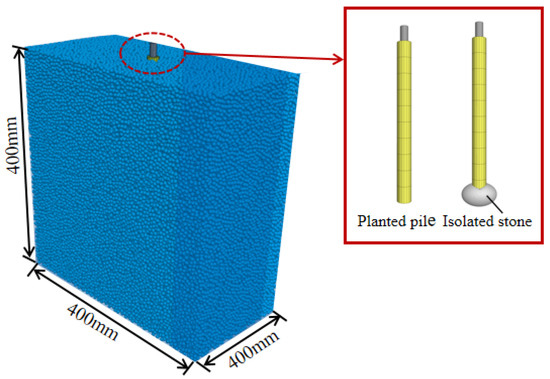
Figure 5.
FLAC3D–PFC3D coupled numerical calculation model.
The contact model for soil elements utilizes the linear model from PFC3D, which can transmit contact forces, but cannot resist rotation, making it suitable for simulating the mechanical behavior of cohesionless sand. The key parameters are presented in Table 2.
Table 2.
PFC3D linear contact parameters.
By specifying the magnitude of the initial earth stress, preloading is applied to the spherical elements until it reaches the initial stress level, resulting in the formation of a free-field model. Subsequently, the isolated stone model and the planted pile model are added. Particles located at the positions of the isolated stone and planted pile in the free-field model are removed. Rigid cluster elements in PFC3D simulate the isolated stone, while solid elements in FLAC3D simulate the planted pile. Coupling interfaces (wall units) consistent with the planted pile are generated on the outer surface, and after rebalancing, the model prior to loading is obtained, resulting in a final total of 150,000 particles. The elastic modulus of the simulated pile model is consistent with that of the experimental pile simulation, both determined through uniaxial compressive tests. The Poisson’s ratio is referenced based on the studies of other scholars [30]. The constitutive model and parameters for the planted pile model are shown in Table 3.
Table 3.
FLAC3D model parameters.
The simulation for the pullout bearing capacity of the planted pile involves first removing the wall units at the top, placing the model’s front, back, left, and right sides in a sliding constraint state, while no constraints are set at the top to simulate the actual pullout condition. Displacements of the soil model and the isolated stone model are reset to zero before applying the load, ensuring that the initial state of the experiment starts at zero displacement. Finally, tensile stress is applied to the surface of the planted pile model to simulate the stress conditions during the pullout process.
4. Results
4.1. Q-S Curve Analysis
The loading forces and pile head displacements of the model tests and numerical models are recorded, resulting in the experimental Q-S curve for different pile models, as shown in Figure 6.
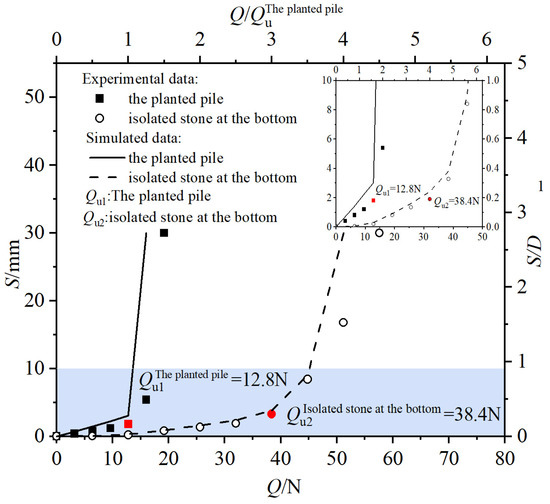
Figure 6.
Load-displacement curve.
Figure 6 shows that the trends and slope variations of the Q-S curve obtained from the simulation calculations are generally consistent with those obtained from model tests. The Q-S curve of the planted pile exhibits a steep increase with a noticeable inflection point (The points highlighted in red in Figure 6). Before the inflection point appears, the pile head displacement increases slowly with increasing load, but after the inflection point, the displacement of the pile head experiences a sudden change, causing the pile body to rapidly pull out as it reaches its ultimate state; the load at the inflection point can be considered the ultimate pullout load. The load at the inflection point for the planted pile without an isolated stone is 12.8 N, with a corresponding displacement of 2 mm, whereas for the planted pile with an isolated stone, the load at the inflection point is 38.4 N, with a corresponding displacement of 3.5 mm. The Q-S curve for the planted pile with an isolated stone at the base is less steep compared to that without the stone; under the same load of 12.8 N, the pullout displacement of the planted pile with an isolated stone is very small, while the planted pile without the stone has already reached the ultimate pullout displacement of 2 mm. When the pullout displacements are equal, the planted pile with the isolated stone at the bottom bears a greater pullout load. This may be attributed to the presence of the isolated stone, which increases the cross-sectional area, enhancing the vertical support provided by the overlying soil, thus allowing the planted pile foundation to support a larger pullout load.
To facilitate the comparative analysis between tests, the scale on the right side of the chart is nondimensionalized using the core pile diameter D (10 mm), while the scale on the top axis of the chart is nondimensionalized based on the ultimate pullout bearing capacity of the planted pile (12.8 N). The ultimate loads and pile head displacements for the planted piles with and without isolated stones are shown in Table 4. It is evident that the ultimate pullout bearing capacity of the pile with an isolated stone at the base (38.4 N) is approximately three times that of the pile without an isolated stone (12.8 N). The corresponding pile head displacement (3.5 mm) is about 1.75 times greater than that of the planted pile without the isolated stone (2 mm). Thus, compared to planted piles without an isolated stone, planted piles with an isolated stone at the base can provide greater bearing capacity, and correspondingly, they also exhibit higher side friction resistance.
Table 4.
Comparison and analysis of experimental results for piles with and without isolated stone.
4.2. Analysis of Axial Force Transfer in the Pile Body
Microstrain gauges embedded in the core pile are used to obtain the strain at each cross-section, followed by calculating the changes in axial force at each cross-section of the core pile and further analyzing the load transfer situation of the core pile. The changes in axial force at the cross-sections of the core pile under different levels of pile head loading in the model tests and numerical models are illustrated in Figure 7.
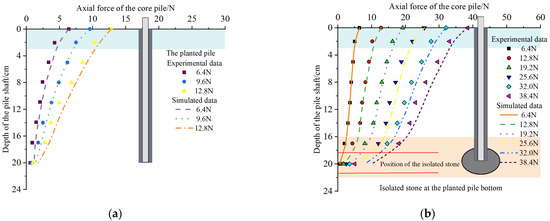
Figure 7.
Core pile axial force diagram; they should be listed as: (a) axial force diagram of core pile for planted pile without an isolated stone and (b) axial force diagram of core pile for planted pile with an isolated stone.
Figure 7 shows that the axial force distribution in the core pile derived from the simulation calculations closely matches that obtained from the model tests. Figure 7a displays the axial force distribution for a core pile without an isolated stone. It is evident that the axial force in the planted core pile decreases with depth, which can be attributed to the downward frictional resistance from the outer concrete acting to hinder the upward pull of the core pile. The axial force curve shows varying rates of decrease at different positions along the pile body. The slope of the axial force curve reflects the magnitude of frictional resistance. Within a 3 cm range from the pile head, the rate of decrease in the axial force curve is highest for the core pile head. This may be due to the greatest displacement difference between the core pile and the outer concrete at the pile head. As the depth increases, the displacement difference between the core pile and the outer concrete gradually decreases, and the internal frictional resistance between the core pile and the outer concrete also decreases and stabilizes. Therefore, the maximum internal frictional resistance for the planted pile occurs at the pile head. This indicates that the deformation of the planted core pile is approximately coordinated with that of the outer concrete. When the load is 6.4 N, the axial force in the lower section of the pile approaches zero, indicating that the end resistance of the core pile is nearly zero, with the load on the core pile primarily borne by side friction resistance. As the load increases, the side friction resistance becomes more pronounced, resulting in an increase in axial force along the pile body, gradually generating axial force in the lower section. Under the applied load, the upper core pile is the first part to engage. As the load progressively transfers down the pile body, it also gradually disperses through the outer concrete of the core pile into the surrounding soil. This creates a dual-layer load diffusion pattern: The load spreads from the core pile to the outer concrete and from the outer concrete to the surrounding soil.
Figure 7b shows the axial force distribution for the core pile of the planted pile with the isolated stone at the tip. The axial force distribution in the upper portion of the planted core pile resembles that of the planted pile without the isolated stone. Under the same upward pull load, the axial force of the core pile gradually decreases with increasing depth. At the same cross-section of the pile body, the larger the upward pull load, the greater the axial force. The slope of the axial force curve for the core pile reflects the magnitude of side friction resistance, which gradually decreases with depth, but suddenly increases within the range of the isolated stone. The significant internal friction resistance at the pile head within a 3 cm range can be attributed to the largest displacement occurring between the core pile and the outer concrete under external loading. As depth increases, the displacement difference gradually decreases and stabilizes, leading to a corresponding reduction inside friction resistance along the pile body. Within the range of 18.5 cm to 20 cm depth in the pile body, the presence of the isolated stone increases the cross-sectional diameter to a maximum of 45 mm, which is 2.5 times the diameter of the planted pile (18 mm). This enlargement of the contact area between the planted pile and surrounding soil results in an increase inside friction resistance for the planted pile, causing a notable weakening of the axial force in the core pile in that region. This indicates that the upper load is transferred downward along the pile body and through the concrete to the surrounding soil while also being transferred to the isolated stone via the outer concrete, ultimately conveyed to the surrounding soil by the isolated stone, thereby achieving three-layer load diffusion. Concurrently, the planted pile with the isolated stone at the end provides more side friction resistance due to its increased surface area, resulting in a greater pullout load required to fully activate the side friction resistance compared to piles without an isolated stone. This means that the pullout bearing capacity of the planted pile with an isolated stone (38.4 N) exceeds that of the planted pile without the stone (12.8 N). Therefore, the presence of the isolated stone enhances the pathways for load diffusion, significantly contributing to the pullout bearing capacity of the planted pile.
4.3. Analysis of Vertical Forces in the Outer Concrete
Due to the small load of the pullout test, accurate data on the axial forces of the outer concrete with depth variation in the model tests could not be obtained. Figure 8 shows the distribution of axial forces in the outer concrete along the pile stem obtained from numerical simulations.
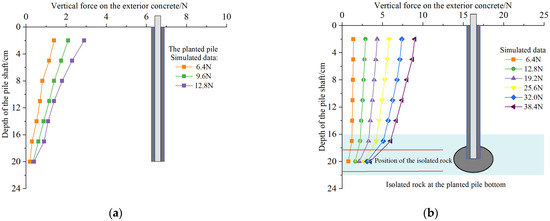
Figure 8.
Distribution diagram of axial forces in the outer concrete; they should be listed as: (a) axial forces in the outer concrete for planted pile without an isolated stone and (b) axial forces in the outer concrete for planted pile with an isolated stone.
As shown in Figure 8, the axial forces in the outer concrete of the planted piles resemble the distribution of axial forces in the core piles and decrease with depth along the stem, indicating that when subjected to upward loads, the core and concrete piles deform cooperatively to share the load. At the same depth along the pile stem, the axial force in the outer concrete increases with the ascending load at the pile top. Under the same load level, the axial force in the outer concrete is significantly smaller than that in the core pile (Figure 8), indicating that the load is primarily carried by the higher-strength core pile, while the outer concrete mainly serves to transfer the load. In Figure 8a, for the outer concrete of the planted pile without an isolated stone, the maximum rate of decay of the axial force occurs within a distance of 3 cm from the pile top, and this decay rate decreases with depth, attributed to the relatively large relative displacement of the surface soil, where friction is fully mobilized. In Figure 8b, the distribution pattern of vertical forces in the outer concrete at the pile end with the isolated stone is consistent with that of the core pile, with the axial force decreasing with depth. Within a range of 3 cm from the pile top and depths of 18.5 cm to 20 cm, the vertical force in the concrete sharply decreases due to the large relative displacement of the surface soil and the presence of the isolated stone, which increases the contact area between the planted pile and the surrounding soil, consequently enhancing the lateral friction resistance at that location. Under the final load conditions, the axial force at the pile end can account for approximately 50% of the total load at the pile top, primarily attributed to the contribution of the isolated stone at the pile end.
4.4. Analysis of Lateral Friction Resistance of the Pile Body
When a planted pile is under tension, the stress conditions at the core axial load, the core–concrete interface, and the concrete–surrounding soil interface are complex. The applied top-of-pile load is first transferred to the concrete through surface friction at the core–concrete interface and then to the surrounding soil through the cement–soil interface [31,32]. Defining the frictional resistance due to relative displacement at the interface between the core column and the outer concrete ring as the internal frictional resistance, while the friction at the interface between the exterior concrete and the surrounding soil is defined as external friction. Figure 9 illustrates the force analysis of the core pile and the outer concrete micro-elements. represents internal friction; represents external friction; and and represent the axial forces in the core pile and outer concrete at the section , respectively.
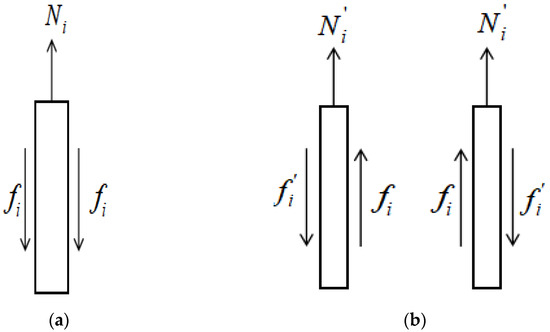
Figure 9.
Stress analysis of micro-units of the core pile and outer concrete; they should be listed as: (a) schematic diagram of the stress distribution in the core pile micro-unit and (b) schematic diagram of the stress distribution in the outer concrete micro-unit.
Based on the force balance of the pile body, balance equations for the core pile and outer concrete can be derived:
Here, is the diameter of the core pile; is the diameter of the planted pile; and is the length between section and section .
Although the length of each section interval is the same, the frictional resistance of each section is different because the normal force acting on the pile surface varies with increasing pile depth. The axial forces in the core pile and outer concrete obtained through numerical simulations allow for the calculation of internal and external friction forces at section using Equations (3) and (4). The distribution of internal and external lateral friction forces along the pile stem for planted piles without an isolated stone and those with an isolated stone at the pile bottom is illustrated in Figure 10 and Figure 11 (due to the influence of the isolated stone, the lateral friction force for piles with an isolated stone is only calculated up to 17 cm into the pile body).
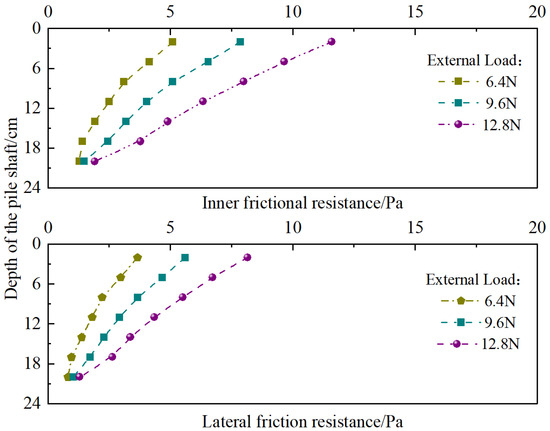
Figure 10.
Distribution diagram of internal and external friction forces along the stem for planted piles without an isolated stone.
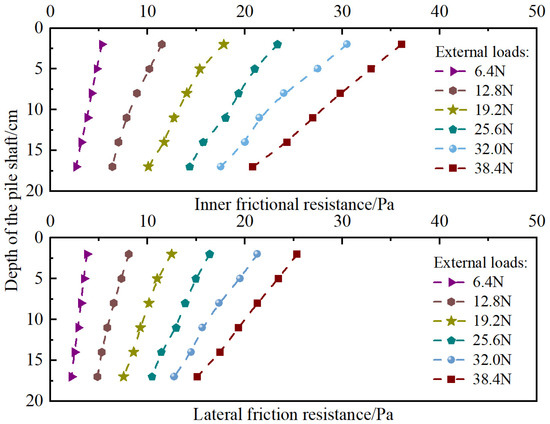
Figure 11.
Distribution diagram of internal and external friction forces along the stem for planted piles with an isolated stone.
As shown in Figure 10 and Figure 11, the distribution patterns of internal and external friction forces along the pile stem are similar. The mobilization of lateral friction resistance is related to the magnitude of the upward load applied at the pile top, which increases with the ascending load. The friction in the upper soil layer is mobilized first; when the upward load is relatively small, the lateral friction in the upper soil layer is not fully mobilized, and the lower soil layer friction has no effect. As the load level increases, the lateral friction in the upper soil layer reaches its limit before the lower soil layer friction starts to mobilize.
Using an external load of 12.8 N shown in Figure 10 as an example, the internal and external friction forces along the stem of the planted pile without an isolated stone gradually decrease. At a load of 12.8 N, the lateral friction force decreases rapidly with increasing depth, indicating that the lateral soil friction is fully mobilized, suggesting that the load of 12.8 N is the ultimate bearing capacity of the planted pile. Additionally, it can be observed from the figures that the internal friction force is greater than the external friction force, with the internal friction being approximately 1.47 times larger than the external friction, which is about 0.8 times the ratio of the diameters of the planted pile to the core pile (). Therefore, the outer concrete in the planted pile primarily serves to transfer the load.
As shown in Figure 10, the internal and external friction forces along the pile stem for planted piles with an isolated stone at the bottom also gradually decrease. When the load is 38.4 N, the lateral friction decreases rapidly with increasing depth, confirming that the lateral soil friction is fully mobilized, suggesting that the load of 38.4 N is the ultimate bearing capacity of the planted pile. Furthermore, from the figures, the internal friction force is greater than the external friction force, with the internal friction approximately 1.37 times that of the external friction. The ratio of internal to external friction in planted piles with an isolated stone is less than that in piles without an isolated stone, possibly due to the presence of the isolated stone, which enhances the mobilization of lateral friction and simultaneously increases the pathways of load dispersal, allowing for the adoption of more external loads.
4.5. Analysis of Soil Displacement Field
Figure 12 and Figure 13 present the soil displacement vector maps and contour maps for planted piles with and without isolated stone. In the figures, X and Y represent the horizontal distance from the center point at the pile top and the embedding depth, both of which have been normalized using the diameter D of the core pile.
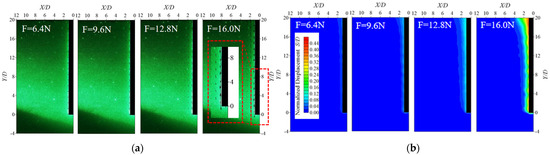
Figure 12.
Vector map and contour map of soil displacement for planted pile without an isolated stone; they should be listed as: (a) vector map of soil displacement for planted pile without an isolated stone and (b) contour map of soil displacement for planted pile without an isolated stone.
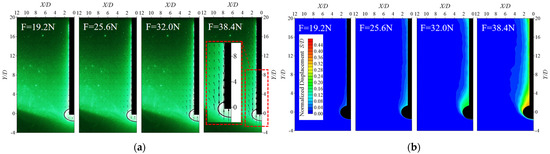
Figure 13.
Vector map and contour map of soil displacement for planted pile with an isolated stone; they should be listed as: (a) vector map of soil displacement for planted pile with an isolated stone and (b) contour map of soil displacement for planted pile with an isolated stone.
As seen in Figure 12a, with the increase of upward loads, the model piles gradually exhibit upward displacement, and the surrounding soil also tends to move upwards. As the load reaches 16.0 N, the soil around the pile end begins to exhibit downward movement, attributed to the noticeable displacement of the model pile at that point, creating a void area, leading to the re-distribution of the surrounding soil to fill that void. It can also be observed that soil displacement decreases gradually in the direction away from the planted pile, with the maximum soil displacement occurring at the pile top and gradually decreasing downward along the pile stem. With the increase in load, the displacement of the soil surrounding the pile increases, thereby expanding the affected area of the surrounding soil. As shown in Figure 12b, the displacement field of the soil surrounding the pile exhibits an overall “inverted triangular” distribution [33], with the maximum displacement occurring at the pile top and the area of influence being largest there. As the load increases, the affected areas of the surrounding soil in both horizontal and vertical directions gradually expand. The horizontal soil displacement decreases progressively in the direction away from the planted pile, with the maximum displacement of the surrounding soil occurring at the pile top and gradually decreasing down the stem.
Figure 13a,b present the soil displacement vector maps and contour maps for planted piles with an isolated stone at the pile end. Figure 13 indicates that the direction of displacement in the soil surrounding the pile shows no significant difference compared to piles without an isolated stone. As the load at the pile top gradually increases, the pile body moves upward, and so does the displacement of the surrounding soil, gradually expanding its area of influence. The interaction between the isolated stone and the surrounding soil is evident in the pronounced changes in soil displacement around the isolated stone. The presence of the isolated stone increases the contact area between the pile tip and the soil. Since the simulated isolated stone is elliptical, it causes greater compression at the interface, leading to an increase in the horizontal displacement component of the soil beneath the isolated stone, thereby enlarging the area of influence on the soil at the pile end. When the upward load is relatively small, the isolated stone does not exert a significant influence on the soil. However, as the load increases, the effect of the isolated stone becomes more pronounced, and the area of soil displacement around the pile end expands considerably. When the upward load reaches 38.4 N, significant displacements occur in the soil at the pile end, indicating a noticeable overall displacement of the planted pile, which has reached its ultimate pullout bearing capacity. When the upward load at the pile top is small, a plastic zone first appears at the interface between the constant cross-section and the isolated stone section. As the uplift load increases, the distribution of the plastic zone gradually expands to encompass the entire isolated stone area, ultimately leading to the failure of the planted pile as the surrounding soil enters this plastic zone and fails under compression.
By comparing Figure 12 and Figure 13, it is evident that a larger upward load is required for planted piles with isolated stones to produce noticeable displacements. The contour map of soil displacement for planted piles with an isolated stone at the bottom shifts from an “inverted triangle” (Figure 12b) to a trapezoidal distribution that is wider at the bottom and narrower at the top due to the influence of the isolated stone.
Figure 14 illustrates the affected range of the soil layer under the ultimate pullout load. For planted piles without isolated stone at the ultimate load (12.8 N), the affected area of the soil at the pile end exhibits a triangular shape, with a horizontal influence range of 4.0 D. The affected range of soil at the pile end is relatively small, with a maximum influence width of approximately 2.0 D. For planted piles with an isolated stone at the bottom under the ultimate load (38.4 N), the affected area of soil at the pile end expands to 12.0 D vertically and 5.0 D horizontally, with the maximum influence width of the soil at the pile top measuring 4.0 D.
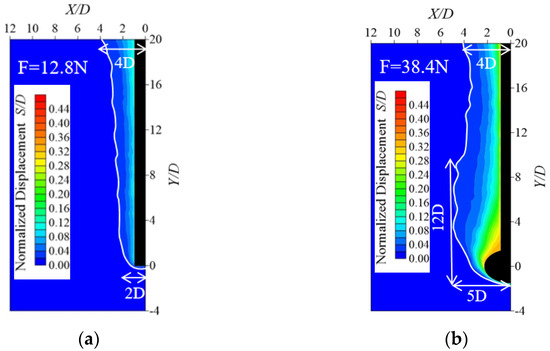
Figure 14.
Affected range of the soil layer under the ultimate pullout load for planted pile; they should be listed as: (a) affected range of the soil layer for planted pile without an isolated stone and (b) affected range of the soil layer for planted pile with an isolated stone.
5. Conclusions
This study utilizes transparent soil technology to conduct non-intrusive model tests on planted piles and planted piles with isolated stones at the end under various tensile loading conditions. Furthermore, it performs a comparative analysis with a discrete-continuous coupled three-dimensional numerical model to evaluate the bearing capacity, load transfer mechanisms, and the interactions between the piles and the surrounding soil. The conclusions are as follows.
- (1)
- The upper load on the planted piles is mainly borne by the high-strength prestressed pipe core piles, which not only transmit the load downwards, but also disperse it through the concrete surrounding the pipes into the surrounding soil. In areas where isolated stone is present, the load diffuses from the outer concrete layer to the isolated stone and then into the surrounding soil, creating a three-layered diffusion pattern. This effectively transmits the upper load to a larger affected area than that of planted piles without isolated stone, resulting in superior bearing capacity and doubling the ultimate pullout bearing capacity of the test piles.
- (2)
- The deformation of the planted piles is primarily controlled by the core piles, with the core and outer concrete layers deforming in a coordinated manner. The axial force in the core pile decreases with depth, and the vertical force in the outer concrete layer also decreases with depth. In planted piles with an isolated stone at the end, the axial force of the core pile and the vertical force in the outer concrete layer show a sudden decrease in the isolated stone region due to the larger contact area formed with the surrounding soil, which enhances the lateral frictional resistance in that area.
- (3)
- The distribution patterns of internal and external friction forces along the pile stem decrease gradually. The internal friction of the planted pile is approximately 1.47 times that of the external friction and about 0.8 times the ratio of the diameters of the planted pile and the core pile. The internal friction of planted piles with an isolated stone at the end is approximately 1.37 times that of the external friction.
- (4)
- The presence of the isolated stone enhances the soil-bearing capacity and also expands the area of stress distribution around the pile. Under ultimate loading conditions, the displacement field of the surrounding soil for planted piles without isolated stones is distributed in an “inverted triangle,” with a maximum width of 4.0 D at the pile top and about 2.0 D at the pile end. For planted piles with an isolated stone at the end, the displacement field of the surrounding soil exhibits a trapezoidal distribution that is wider at the bottom and narrower at the top, with the influenced area reaching 12.0 D vertically and 5.0 D horizontally at the pile end, and the maximum impact width of the soil at the pile top measuring 4.0 D.
- (5)
- Overall, the presence of isolated stones at the base of the pile can provide additional support, enhancing the load transfer pathways and the influence range of the surrounding soil. This indicates that the incorporation of isolated stones into the load-bearing system of the pile can not only mitigate the effects of the stones on the pile foundation, but also effectively enhance the overall load-bearing capacity of the pile.
Author Contributions
Conceptualization, Q.C., W.L. and H.L.; methodology, Q.C., W.L. and H.L.; software, H.L. and W.L.; validation, X.G., J.Z. and S.S.; formal analysis, W.L., H.L. and X.G.; investigation, Q.C., H.L., J.Z., S.S., X.G. and W.L.; resources, Q.C., J.Z., X.G. and S.S.; data curation, W.L., H.L., X.G. and S.S.; writing—original draft preparation, W.L. and X.G.; supervision, Q.C., X.G., J.Z. and S.S.; project administration, Q.C., X.G. and J.Z.; funding acquisition, Q.C. All authors have read and agreed to the published version of the manuscript.
Funding
This project was financially supported by the National Natural Science Foundation of China (No. 52378342, 52308400) and the Funds of Scientific and Technological Plan of Fujian Province (No. 2022Y4015).
Institutional Review Board Statement
Not applicable.
Informed Consent Statement
Not applicable.
Data Availability Statement
The raw data supporting the conclusions of this article will be made available by the authors on request.
Conflicts of Interest
The author declares that there are no conflicts of interest.
References
- Doi, T.; Murono, Y.; Zhang, F.; Hirayama, Y. In-situ horizontal cyclic loading tests on composite foundation composed of soilbags and piles. Soils Found. 2023, 63, 101327. [Google Scholar] [CrossRef]
- Li, C.; Lu, X.; Wang, P. An analytical solution for the consolidation of a composite foundation reinforced by vertical drains and high replacement ratio gravel piles by considering the radial flow within gravel piles. Soils Found. 2023, 63, 101393. [Google Scholar] [CrossRef]
- He, Z.; Ye, A.; Wang, X. Local scour effects on seismic behavior of pile-group foundations in cohesionless soils: Insights from quasi-static tests. Ocean. Eng. 2024, 311, 118886. [Google Scholar] [CrossRef]
- Honda, T.; Hirai, Y.; Sato, E. Uplift capacity of belled and multi-belled piles in dense sand. Soils Found. 2011, 51, 483–496. [Google Scholar] [CrossRef]
- Karkee, M.B.; Kanai, S.; Horiguchi, T. Quality Assurance in bored PHC nodular piles through control of design capacity based on loading test data. In Proceedings of the 7th International Conference and Exhibition, Piling and Deep Foundations, Vienna, Austria, 15–17 June 1998. [Google Scholar]
- Ping, Y.; Li, Q. Study on the construction technology and load-bearing behavior of composite piles with rigid core embedded in hard bearing layer through strong mixing soil. Chin. J. Geotech. Eng. 2013, 35, 1033–1036. [Google Scholar]
- Lou, Y.; Fang, P.; Xie, X.; Zhang, R.; Chong, C.S.; Wang, Z.; Zhu, D. Experimental study on thermo-mechanical responses of pre-bored grouted planted piles with different restraint conditions. Energy Build. 2022, 268, 112232. [Google Scholar] [CrossRef]
- Zhang, Y.; Li, Z.; Mao, Y.; Zhao, W. Studies on applications of precast pile planting method. In Smart Geotechnics for Smart Societies; CRC Press: Boca Raton, FL, USA, 2023. [Google Scholar]
- Aizebeokhai, A.P.; Olayinka, A.I.; Singh, V.S. Application of 2D and 3D geoelectrical resistivity imaging for engineering site investigation in a crystalline basement terrain, southwestern Nigeria. Environ. Earth Sci. 2010, 61, 1481–1492. [Google Scholar] [CrossRef]
- Hasan, M.; Shang, Y.; Meng, H.; Yi, X.; Shao, P. A novel approach to determine rock mechanical parameters using non-invasive geophysical methods. Int. J. Rock Mech. Min. Sci. 2022, 160, 105260. [Google Scholar] [CrossRef]
- Li, B.; Wu, L.; Xu, C.; Zuo, Q.; Wu, S.; Zhu, B. The detection of the ns in metro tunneling in granite strata using a shield tunneling method and a new method of coping with boulders. Geotech. Geol. Eng. 2016, 34, 1155–1169. [Google Scholar] [CrossRef]
- Lv, Y.; Liu, H.; Ding, X.; Kong, G. Field tests on bearing characteristics of X-Section pile composite foundation. J. Perform. Constr. Facil. 2012, 26, 180–189. [Google Scholar] [CrossRef]
- Ma, T.; Zhu, Y.; Yang, X. Calculation of bearing capacity and deformation of composite pile foundation with long and short piles in loess areas. Adv. Civ. Eng. 2020, 2020, 8829779. [Google Scholar] [CrossRef]
- Chen, Q.; Zhao, M.; Zhou, G.; Zhang, Z. Bearing capacity and mechanical behavior of CFG pile composite foundation. J. Cent. South Univ. Technol. 2008, 15 (Suppl. S2), 45–49. [Google Scholar] [CrossRef]
- Guades, E.; Aravinthan, T.; Islam, M.; Manalo, A. A review on the driving performance of FRP composite piles. Compos. Struct. 2012, 94, 1932–1942. [Google Scholar] [CrossRef]
- Li, H.L.; Ren, L.W.; Zheng, H.; Xiao, Y.Z. Study on the load transfer mechanism of high jet grouting and insert core composite piles through full-scale model tests. Rock Soil Mech. 2010, 31, 1395–1401. [Google Scholar]
- Li, J.C.; Zhang, Y.G.; Deng, Y.G.; Hua, X.L. Study on the load transfer mechanism of composite piles composed of pipe piles and cement-soil. J. Rock Mech. Eng. 2014, 33, 3068–3076. [Google Scholar]
- Gao, S.; Chen, C.; Jiang, X.; Zhu, S.; Cai, H.; Li, W. Transformer-based settlement prediction model of pile composite foundation under embankment loading. Comput. Geotech. 2024, 176, 106783. [Google Scholar] [CrossRef]
- Shao, W.; Sun, Q.; Xu, X.; Yue, W.; Shi, D. Durability life prediction and horizontal bearing characteristics of CFRP composite piles in marine environments. Constr. Build. Mater. 2023, 367, 130116. [Google Scholar] [CrossRef]
- Kobayashi, K.; Ogura, H. Vertical bearing capacity of bored pre-cast pile with enlarged base considering diameter of the enlarged excavation around pile toe. In Advances in Deep Foundations; CRC Press: Boca Raton, FL, USA, 2007; pp. 277–283. [Google Scholar]
- Yu, X.; Wang, L.; Xu, Y.; Huang, J.; Zhang, H. Consolidation of unsaturated composite foundation reinforced by T-shaped deep cement mixing piles. Comput. Geotech. 2024, 175, 106656. [Google Scholar] [CrossRef]
- Voottipruex, P.; Suksawat, T.; Bergado, D.T.; Jamsawang, P. Numerical simulations and parametric study of SDCM and DCM piles under full scale axial and lateral loads. Comput. Geotech. 2011, 38, 318–329. [Google Scholar] [CrossRef]
- Jamsawang, P.; Bergado, D.T.; Voottipruex, P. Field behaviour of stiffened deep cement mixing piles. Ground Improv. 2011, 164, 33–49. [Google Scholar] [CrossRef]
- Jiajin, Z.; Wang, K.; Gong, X.; Zhang, R. Study on the bearing capacity and load transfer mechanism of static drill rooted nodular piles. Rock Soil Mech. 2014, 14, 1367–1376. [Google Scholar]
- Schafer, M.; Madabhushi, S.P.G. Uplift Resistance of Enlarged Base Pile Foundations. Indian Geotech. Soc. 2019, 50, 426–441. [Google Scholar] [CrossRef]
- Yang, Y.S.; Qiu, L.C. MPM simulation of uplift resistance of enlarged base piles in sand. Soils Found. 2020, 60, 1322–1330. [Google Scholar] [CrossRef]
- Zhaohu, C.; Wang, L.; Zhang, J.; Jia, H.; Pan, J. Model test study on soil displacement field during pile driving process based on PIV technology. Eng. Mech. 2014, 31, 168–174. [Google Scholar]
- Junjie, Y. Similarity Theory and Structural Model Testing; Wuhan University of Technology Press: Wuhan, China, 2005. [Google Scholar]
- Jiang, M.J.; Konrad, J.M.; Leroueil, S. An efficient technique for generating homogeneous specimens for DEM studies. Comput. Geotech. 2003, 30, 579–597. [Google Scholar] [CrossRef]
- Liu, R.; Liang, C. Study of the Bearing Capacity at the Variable Cross-Section of a Riser-Surface Casing Composite Pile. China Ocean. Eng. 2021, 35, 262–271. [Google Scholar] [CrossRef]
- Jiajin, Z.; Gong, X.; Zhang, R.; El Naggar, M.H.; Wang, K. Field behavior of pre-bored grouted planted nodular pile embedded in deep clayey soil. Acta Geotech. 2020, 15, 1847–1857. [Google Scholar]
- Jiajin, Z.; Yu, J.; Gong, X.; El Naggar, M.H.; Zhang, R. The effect of cemented soil strength on the frictional capacity of precast concrete pile-cemented soil interface. Acta Geotech. 2020, 15, 3271–3282. [Google Scholar]
- Wang, W.; Wu, J.; Wang, X. Analysis of the uplift behavior and deformation characteristics of enlarged base piles based on ultimate load Tests. Chin. J. Geotech. Eng. 2016, 38, 1330–1338. [Google Scholar]
Disclaimer/Publisher’s Note: The statements, opinions and data contained in all publications are solely those of the individual author(s) and contributor(s) and not of MDPI and/or the editor(s). MDPI and/or the editor(s) disclaim responsibility for any injury to people or property resulting from any ideas, methods, instructions or products referred to in the content. |
© 2024 by the authors. Licensee MDPI, Basel, Switzerland. This article is an open access article distributed under the terms and conditions of the Creative Commons Attribution (CC BY) license (https://creativecommons.org/licenses/by/4.0/).