Article

Geometric Detail-Preserved Point Cloud Upsampling via a Feature Enhanced Self-Supervised Network

1
School of Computer Science and Technology, Zhejiang University of Water Resources and Electric Power, Hangzhou 310018, China
2
Zhejiang Provincial Innovation Center of Advanced Textile Technology, Shaoxing 312000, China
3
School of Information Engineering, Huzhou University, Huzhou 313000, China
4
College of Mathematics and Computer Science, Zhejiang A & F University, Hangzhou 311300, China
5
School of Computer Science and Technology, Zhejiang Sci-Tech University, Hangzhou 310018, China
*
Author to whom correspondence should be addressed.
Appl. Sci. 2025, 15(1), 174; https://doi.org/10.3390/app15010174
Submission received: 13 November 2024 / Revised: 16 December 2024 / Accepted: 26 December 2024 / Published: 28 December 2024
(This article belongs to the Special Issue Application of Artificial Intelligence in Visual Processing)

Abstract

:
The upsampling of point clouds is a common task to increase the expressiveness and richness of the details. The quality of upsampled point clouds is crucial for downstream tasks, such as mesh reconstruction. With the rapid development of deep learning technology, many neural network-based methods have been proposed for point cloud upsampling. However, there are common challenges among these methods such as blurring sharper points (e.g., corner or edge points) and producing points gathered together. These problems are caused by similar feature replication or insufficient supervised information. To address these concerns, we present SSPU-FENet, a self-supervised network consisting of two modules specifically designed for geometric detail-preserved point cloud upsampling. The first module, called the feature enhancement module (FEM), aims to prevent feature blurring. This module retains important features such as edges and corners by using non-artificial encoding methods and learning mechanisms to avoid the creation of blurred points. The second module, called the 3D noise perturbation module (NPM), focuses on high-dimensional feature processing and addresses the challenges of feature similarity. This module adjusts the spacing of reconstructed points, ensuring that they are neither too close nor too far apart, thus maintaining point uniformity. In addition, SSPU-FENet proposes self-supervised loss functions that emphasize global shape consistency and local geometric structure consistency. These loss functions enable efficient network training, leading to superior upsampling results. Experimental results on various datasets show that the upsampling results of the SSPU-FENet are comparable to those of supervised learning methods and close to the ground truth (GT) point clouds. Furthermore, our evaluation metrics, such as the chamfer distance (CD, 0.0991), outperform the best methods (CD, 0.0998) in the case of 16 × upsampling with 2048-point input.

1. Introduction

The fields of robotics, autonomous driving, and the digital industry increasingly depend on point clouds captured by 3D sensors to represent 3D data. However, the current 3D sensors often produce sparse and noisy point clouds, especially when dealing with smaller objects, which presents significant challenges in processing. Point cloud super-resolution has become a crucial research area, focusing on converting sparse and noisy inputs into dense and clear outputs [1,2,3].
Deep learning methods, which have been successful in image super-resolution [4,5], have also inspired advancements in point cloud super-resolution. Mainstream deep learning techniques for point cloud upsampling typically involve three key steps: local feature extraction, high-dimensional feature expansion, and supervised feature learning. However, these methods have limitations, such as feature homogenization, especially for sparse point clouds, and the blurring of non-flat region information (such as corner points and edge points). Additionally, supervised learning upsampling methods often show limited generalization capabilities when faced with a diverse range of 3D point cloud models [6,7,8,9].
The reasons why current methods do not work well for point cloud upsampling are twofold. First, existing networks, which learn from point coordinates, often produce features without sufficient discrimination. This results in higher similarity or homogeneity, which leads to closely spaced points during coordinate reconstruction. Second, the current supervised or self-supervised learning methods primarily focus on the relationship between the dense output and the sparse input (or dataset labels), neglecting to fully exploit the structural (both global and local) properties of the output point clouds [10,11,12].
To this end, we introduce a novel end-to-end self-supervised deep learning network, SSPU-FENet, designed for geometric detail-preserved point cloud upsampling. First, we propose a feature enhancement module (FEM) that effectively distinguishes sharp feature points (i.e., corner points and edge points in the non-flat regions) from other flat regions using a unique descriptor rooted in local geometry information. Second, the geometry reconstruction with a 3D noise perturbation module (NPM) uses high-dimensional feature distances to prevent the generated points from being too close due to feature similarity. Finally, we introduce a comprehensive joint loss function tailored for self-supervised learning, which not only considers the global shape relationship between the dense and sparse point clouds but also exploits the similarity of local geometric structures within the dense point cloud, thereby enabling the generation of dense point clouds.
  • Contributions. Our contributions are summarized as follows.
    • We design feature enhancement and geometric coordinate reconstruction modules that effectively preserve geometric details of output dense point clouds, such as non-flat regions, which outperforms existing methods in upsampling and related downstream tasks.
    • Our end-to-end self-supervised network model considers the relationships between dense and sparse point clouds, including both global shapes and similar local geometric structures. This allows us to obtain more geometric information-rich dense point clouds, as validated by our experiments.

2. Related Works

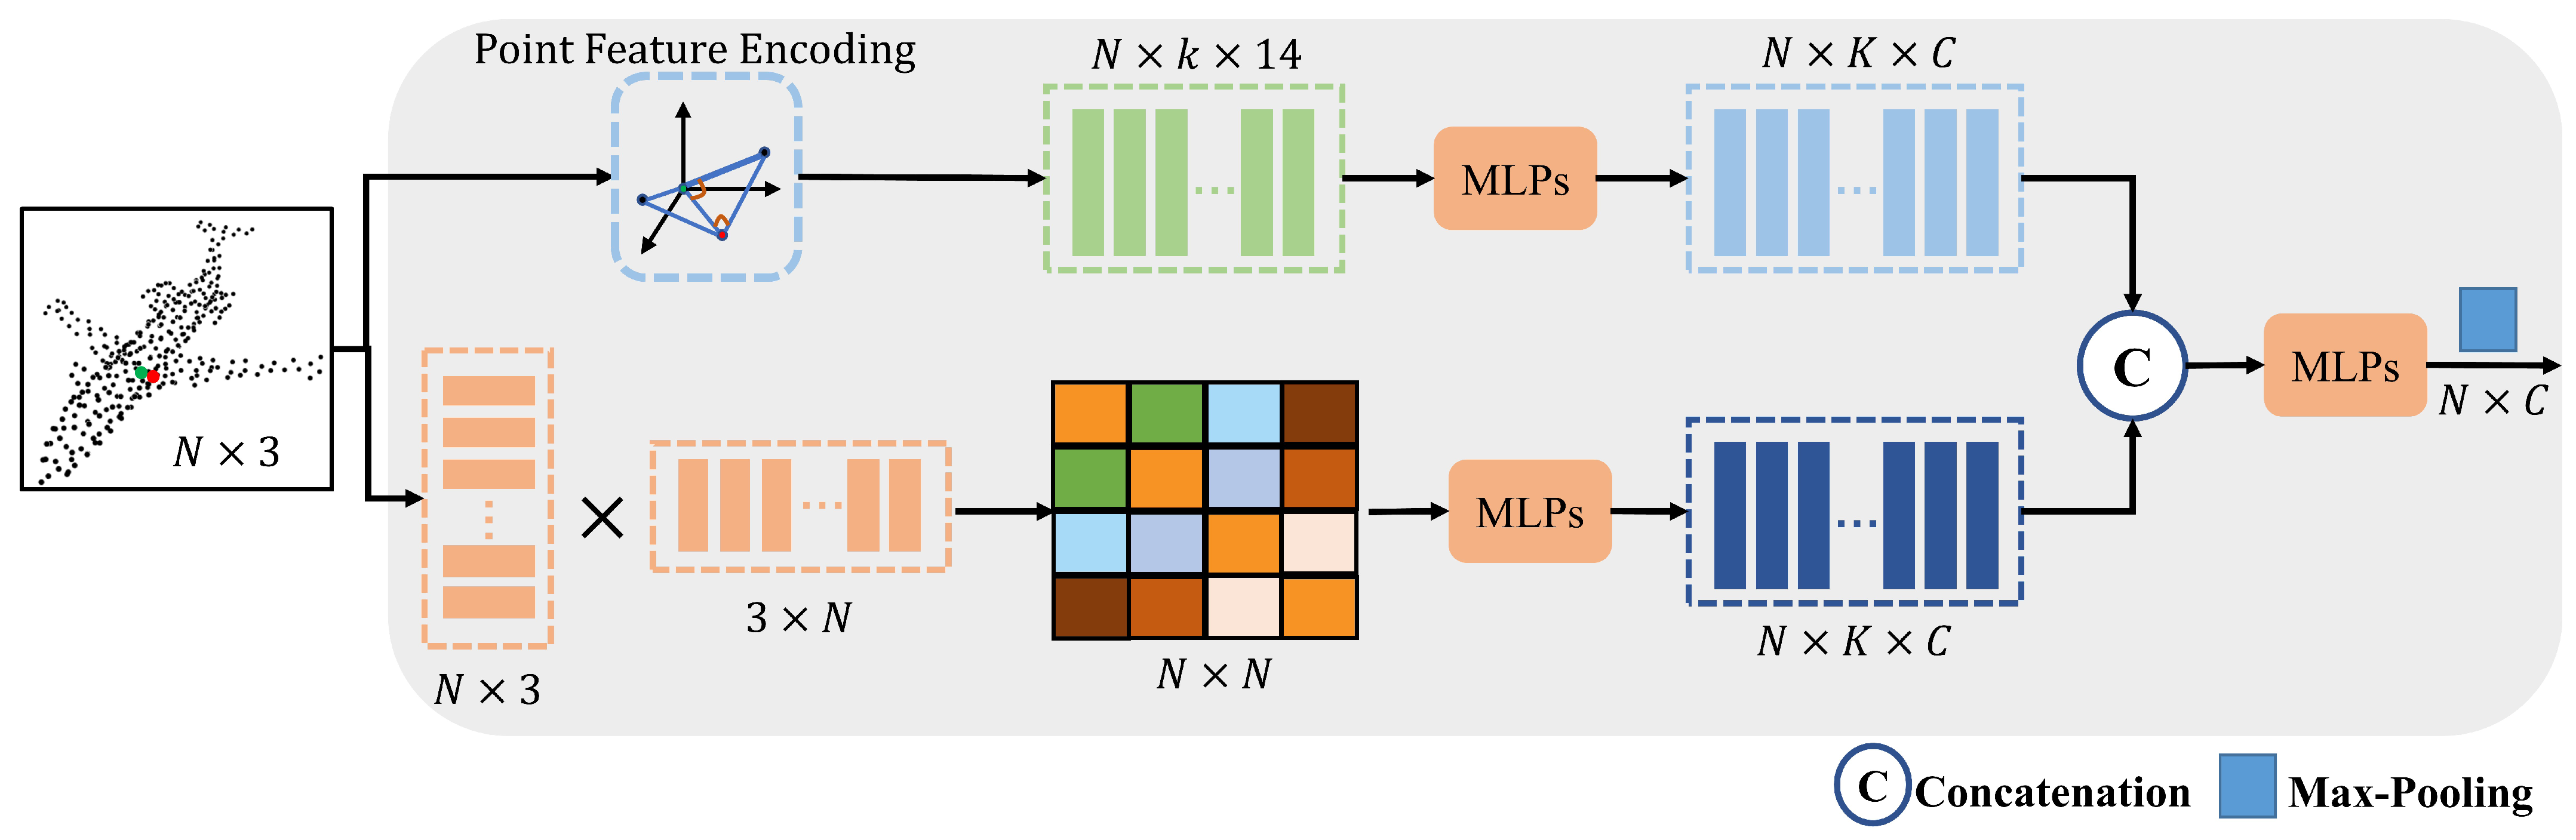
  • Encoding and learning of local features. Yu et al. [6] pioneered the field of point cloud upsampling with their PU-Net, a deep learning approach that leverages PointNet++ [13] for feature enhancement and a fully connected layer for reconstructing upscaled coordinates. Qian et al. [8] introduced a novel approach by representing 3D surfaces using 2D parameter spaces to enrich point data. In their subsequent work, PU-GCN [14], they employed graph convolutional networks (GCNs) in combination with shared multilayer perceptrons (MLPs) and parallel local feature learning networks, effectively processing multiscale features. Qiu et al. [15] integrated the self-attention mechanism into point cloud upsampling, emphasizing the enhancement of local feature distinguishability. Ding et al. [16] took a different approach, learning 2D perturbations through MLPs to estimate coordinate offsets between input and upsampling points. They further refined these offsets through residual learning, combining extracted features with the learned 2D perturbations. More recently, He et al. [9] introduced Grad-PU, an algorithm that seamlessly combines midpoint interpolation in Euclidean space with iterative optimization of distances to the target high-resolution point cloud.
These advancements collectively highlight the critical role of local feature learning in point cloud upsampling. They have significantly improved the quality of upsampling results. However, a persistent challenge remains feature homogenization, which results in the generated points being too close or far apart and blurring of the sharper points in the crucial regions. Future research efforts should focus on addressing this challenge to further enhance the reliability and accuracy of point cloud upsampling techniques.
  • Upsampling network architectures. In the realm of point cloud upsampling, network architectures can be broadly classified into two categories: supervised and unsupervised (or self-supervised) networks. Supervised networks leverage metrics such as point uniformity [17], point-to-point distance [6], and reconstruction loss [18] to meticulously refine dense point clouds by comparing them to ground truth (GT) data. Li et al. [7] introduce Dis-PU, a two-phase model that combines feature expansion and spatial refinement, delivering high-quality, uniformly distributed point clouds. On the other hand, unsupervised methods, exemplified by GAN networks [17] and the self-supervised SPU-Net [19], focus on learning directly from the inherent structure of the point cloud, without relying on GT comparisons. These methods underscore the significance of feature supervision in network design, particularly in self-supervised learning, for enhancing upsampling quality.
However, a notable limitation of these methods is their heavy reliance on reconstruction-based supervised learning. As the quality of high-dimensional features deteriorates, their effectiveness in supervising upsampling decreases. Additionally, these methods often overlook the supervision of the intrinsic local structure within point clouds, which is crucial for accurate and detailed upsampling. Future research should aim to address these challenges, exploring novel supervision strategies that can better capture and preserve the local structure of point clouds, leading to more robust and accurate upsampling results.

3. Our Methodology

Our objective is to learn a mapping function θ : X ( X R N × 3 ) X D from the local topology of the point cloud, where X R N × 3 represents the input sparse point cloud and X D R λ N × 3 ( λ is the upsampling ratio) is the output dense point cloud. Our goal is to ensure that each point in X D lies as close as possible to the surface represented by X while maintaining a uniform distribution and avoiding blurring in non-flat regions. Accordingly, we propose a feature-enhanced self-supervised point cloud upsampling network, called SSPU-FENet, which consists of a feature enhancement module (FEM) and a 3D noise perturbation module (NPM) for geometric coordinate reconstruction based on feature similarity. Figure 1 shows the overall network architecture of our proposed SSPU-FENet for point cloud upsampling.
In the feature enhancement module, we encode neighboring points to enrich the local details of the point cloud. This module effectively discriminates between various local features, resulting in a more detailed representation. On the other hand, the 3D noise perturbation module addresses the challenge of preventing the generation of excessively close points. This is achieved through a 3D noise perturbation learning operation that follows the feature expansion phase, ensuring a more distributed and accurate point cloud.

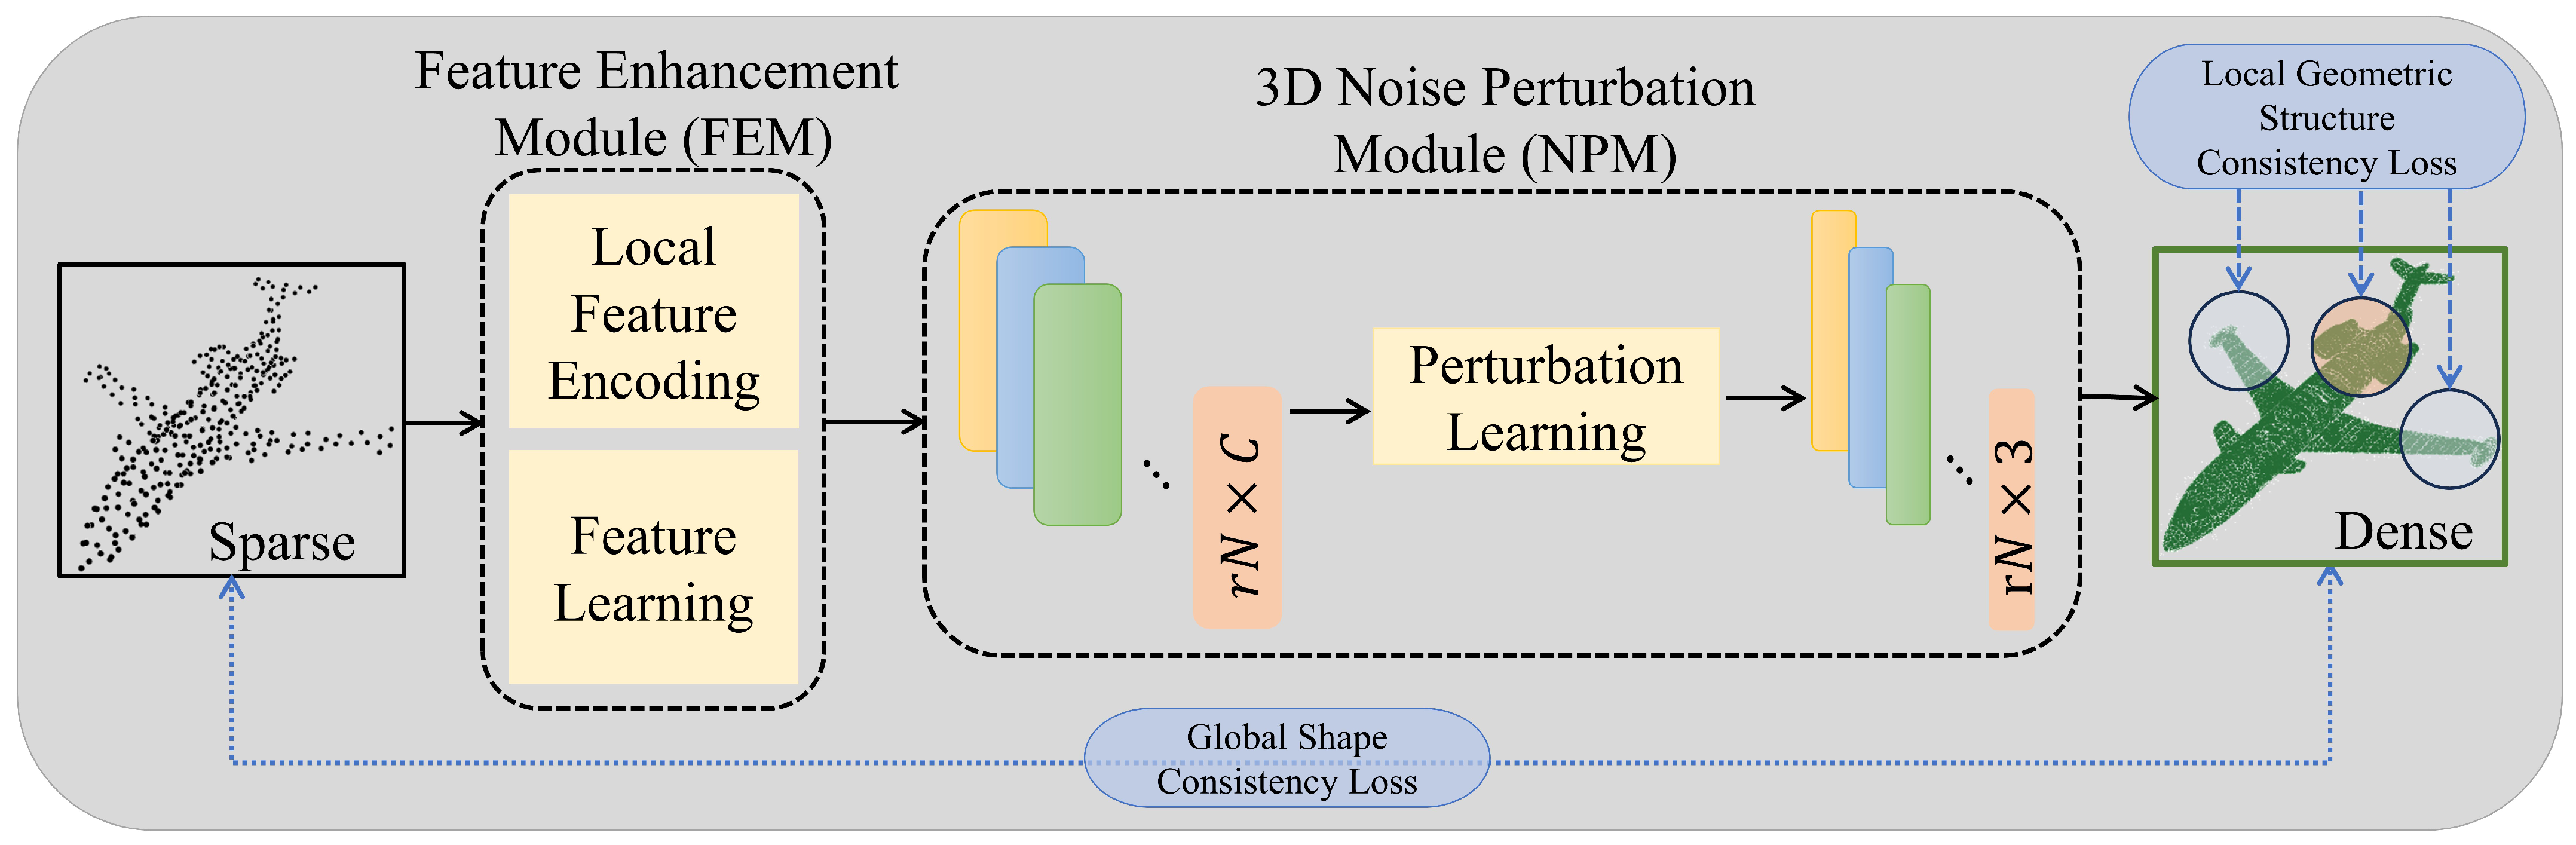
3.1. Feature Enhancement Module (FEM)

The feature enhancement module is mainly designed to prevent sharp features learned by corner points and edge points of non-flat regions (as shown in Figure 2) from being blurred. Given a sparse point cloud X R N × 3 and a scaling factor λ , the FEM encodes it into an N × C feature matrix, as shown in Figure 3. This encoding process enhances the distinction, detail, and richness of point features. Accordingly, we compute the edge vector and other relationships between points and their neighbors to learn distinctive features. Importantly, the method eschews preset thresholds for edge or corner points, using inner product-based learning to distinguish features in flat regions from non-flat regions.
First, to capture the key local features, for each point x i X , its k neighboring points x j are obtained using the KNN algorithm. The feature representation x i j is derived by encoding the coordinates of point x i , the normal vector, the neighborhood edge vector, and the inner product of normals between x i and its neighbors x j according to Equation (1).
x i j = ( x i , x j , e i j , n i , n j , α i j )
where e i j = x i x j ( e i j R 1 × 3 ) is the edge vector. n i and n j denote normal vectors of points x i and x j , respectively. α i j is the inner product between n i and n j , i.e., n i · n j .
The point cloud X with N points is encoded as X ( X R N × k × 14 ) via Equation (1). The encoded features X are then processed through a series of shared multilayer perceptrons (MLPs) to yield a higher-order nonlinear local feature representation X ^ ( X ^ R N × K × C , where C is the channel count, C 14 ) according to Equation (2).
x ^ = A ( h θ ( x i j ) )
where x ^ X ^ , x i j X , h θ ( · ) represents MLPs and A ( · ) is the symmetric function, which is the maximum pooling function in the paper.
Second, to capture rotation-invariant global structures, a Gram matrix G ( X ) ( G ( X ) = X X T , G ( X ) R N × N ) is constructed. A higher-order nonlinear global feature representation X ˜ ( X ˜ R N × K × C ) is derived by applying MLPs to the Gram matrix G ( X ) .
Finally, the local feature X ^ is concatenated with the global feature X ˜ , forming a new feature representation X ( X R N × K × 2 C ). And the enhanced feature X l o c a l ( X l o c a l R N × C ) is learned through MLPs and maximum pooling.

3.2. The 3D Noise Perturbation Module (NPM)

The necessity for perturbation learning emerges when replicating the feature X l o c a l r times, causing the reconstructed points to be either too close due to feature similarities or too distant due to feature variances. Essentially, noise is introduced to adjust the closeness of the spaced points, and move them away from or towards the point x i as required. Adaptive perturbation learning is then applied by using feature distance and Gaussian noise, which assigns larger perturbations to “similar” points and smaller ones to “dissimilar” points.
The embedding feature of the current point x i is denoted as x l o c a l i X l o c a l ( x l o c a l i R 1 × C ), with the following adaptive perturbation learning steps:
First, we compute the feature distance between the embedding feature x l o c a l i of point x i and x l o c a l j of any other points x j ( j = 1 , 2 , , N 1 ) according to Equation (3).
σ i j = | | x l o c a l i x l o c a l j | |
where σ i j [ 0 , 1 ] .
Second, the noise distribution, denoted as Q ( θ l ) , is parameterized by θ l . The learning constraints of parameters in the loss function aim to generate a uniformly distributed point cloud with a standard normal distribution.
Q θ l = θ l · N ( 0 , ( 1 σ i j ) )
Finally, Gaussian noise is added for the current point x i , and the feature representation after perturbation learning is obtained as follows:
x n o i s e i = h θ x l o c a l i + Q θ l
where x n o i s e i R 1 × C , and h θ ( · ) represents MLPs.
In this paper, the 3D coordinates of the output point cloud are reconstructed from the perturbation-learned features by using a fully connected layer with a size of r N × C .

3.3. Loss Functions

For efficient network training, we employ a composite loss function L j o i n t , incorporating global shape consistency loss L g s c , local geometric structure consistency loss L l g s c , and uniform loss L u i [17].
L j o i n t = α L g s c + β L l g s c + γ L u i + η | | θ | | 2
where α , β , γ are hyperparameters to balance the various loss weights, η is the weight decay hyperparameter, and θ is the hyperparameter in SSPU-FENet.
  • Global shape consistency loss. The input sparse point cloud S can generally be considered as a downsampled version of the output dense point cloud D, which shares consistent global shapes. By applying a downsampling function g ( · ) , we obtain the downsampled point cloud D ^ from D. The covariance matrices C D ^ and C S are computed for D ^ and S, respectively, effectively capturing the point cloud structure for applications like 3D detection, similarity analysis, and 2D image matching. The similarity measure between these two covariance matrices is then computed as follows:
ρ C D ^ , C S = i = 1 3 l n 2 λ i ( C D ^ , C S )
where λ i ( C D ^ , C S ) denotes the generalized eigenvalues of the covariance matrix C D ^ and C S , i.e., computing λ C D ^ C S = 0 .
Consequently, the input–output geometric feature consistency loss function is expressed as follows:
L g s c = min g ρ C D ^ , C S
where D ^ = g ( D ) .
  • Local geometric structure consistency loss. We introduce the local geometric structure consistency loss for point cloud upsampling tasks, motivated by the observation that 3D models usually share consistent (similar) local geometric structures. An illustration can be seen in Figure 4, where two regions highlighted in red and blue exhibit similar local geometric details. The measurement of such similarity can be computed by their Gram matrices [20,21]. Without loss of generality, assuming that the output dense point cloud is denoted by D, we construct the Gram matrix G ( x i ) ( G ( x i ) R k × k ) for any point x i D with the assistance of the KNN algorithm. The local geometric structure consistency loss is thus defined as follows.
L l g s c = 1 m j = 1 , j i m | | G ( x i ) G ( x j ) | | F
where m denotes the number of regions sharing similar local geometric structures with the region of point x i . 1 m N 1 (N is the number of points).

4. Experimental Results and Analysis

4.1. Datasets and Experimental Settings

The experiments are performed on the ESB dataset, which comprises 867 comprehensive and high-quality point clouds [22]. Additionally, we include a supplementary collection of point clouds sourced from PU-GAN [17], along with other mainstream datasets such as ModelNet40 [23] and PU1K [14]. Representative samples from these datasets are presented in Figure 5.
To ensure consistency across experiments, we reference other upsampling methods and normalize the point cloud models to the standard range of 1 , 1 as the input to our network. The proposed network is trained and tested on a server equipped with an NVIDIA Tesla K80 GPU. The network optimization is carried out using the Adam optimizer, and the proposed loss function detailed in the main paper is employed. The key parameters for SSPU-FENet are outlined in Table 1.
The evaluation of the upsampled point clouds is conducted using four commonly used metrics: Chamfer distance (CD), Hausdorff distance (HD), point-to-face distance (P2F), and Jensen–Shannon divergence (JSD) [17]. The results obtained from these metrics in our experiments are reported in the units of × 10 3 , providing a quantitative measure of the performance and accuracy of our approach.

4.2. Ablation Studies

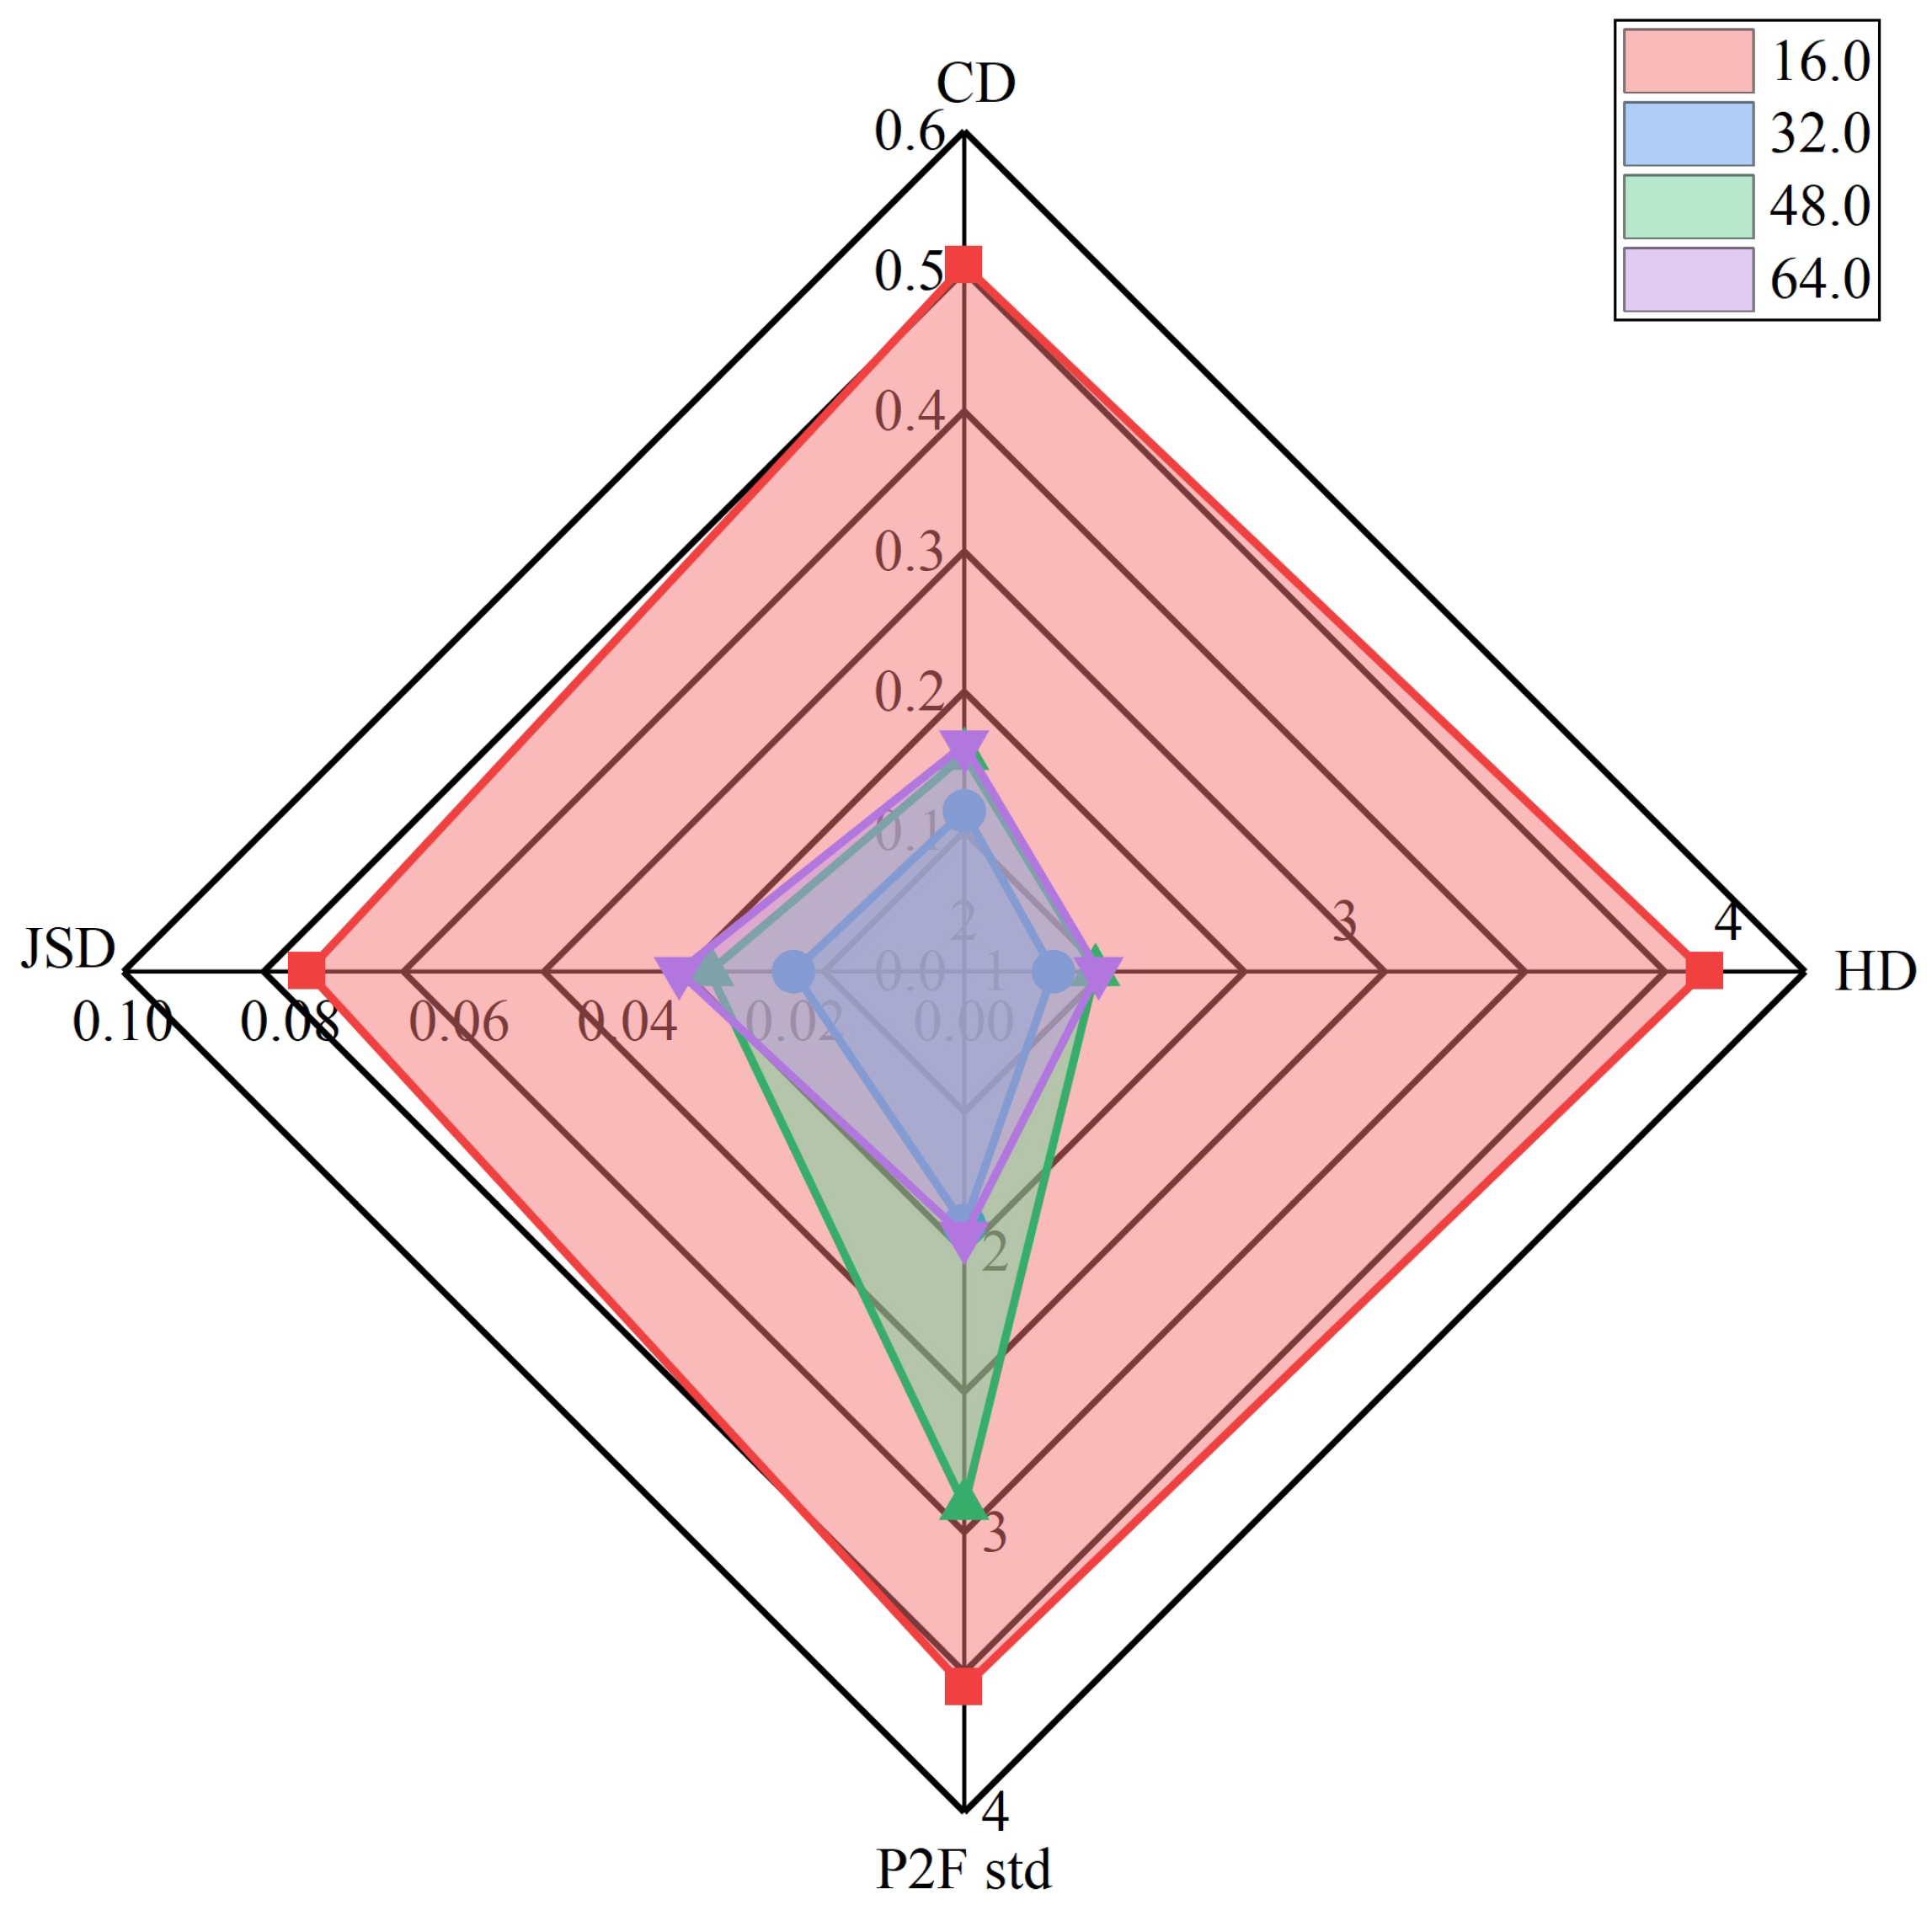
  • Analysis of the size of the neighboring range. The neighborhood size significantly influences the performance of local feature encoding and feature learning in point cloud upsampling, as shown in Figure 6, with a point cloud of 512 points as network input and the average results of upsampling on different ratios ( 4 × ,   8 × ,   16 × ) as the output. An analysis of the chamfer distance (CD) and Hausdorff distance (HD) reveals that a reduction in these distances corresponds to an enhancement in upsampling quality. Notably, the optimal results are attained at a neighborhood size of 32. Additionally, the point-to-face distance (P2F) represents the importance of a smaller distance, indicating a closer approximation to the geometric surface. Specifically, a neighborhood size of 32 yields the lowest average distance, approximately 1.9. The Jensen–Shannon divergence (JSD) metric provides insights into distribution disparities, while the two uniform metrics assess point alignment, all converging to their minimal values at a neighborhood size of 32. Moreover, whether using 512, 1024, or 4096 points as network input for upsampling, it shows that a neighborhood size of 32 still gives the best results in terms of evaluation metrics; e.g., for 1024 points as network input for 4 × upsampling, a neighborhood size of 32 yields the lowest average distance under the P2F metric, 1.9011, and a neighborhood size of 16 yields the distance 3.5910. In summary, this particular setting is crucial for achieving efficient and superior results in point cloud upsampling. For fewer or more points as input, we need to recompute the size of this neighborhood.
  • Analysis of network modules. Table 2 shows the average metric results on different upsampling ratios ( 4 × ,   8 × ,   16 × ) when inputting point clouds with 512 points to the three distinct networks for upsampling, which are SSPU-FENet, SSPU-FENet without the FEM (where the coordinates are directly fed into the network), and SSPU-FENet without the NPM. The results show that SSPU-FENet exhibits the lowest values across all metrics, clearly demonstrating the significance of each component in enhancing point cloud upsampling. Meanwhile, Figure 7 shows a visualization of the results. When the FEM is omitted, a noticeable increase point-to-face distance (P2F) is observed, rising from 1.9052 (Figure 7b) to 1.9210 (Figure 7a). This indicates that some of the interpolated points (mainly edge and corner points) have not been placed in the proper positions and they are too close to the current center point. It leads to a degradation in upsampling quality. Furthermore, the exclusion of the NPM also results in a significant deterioration of performance. Specifically, the chamfer distance (CD) increases from 0.1148 to 0.2206, indicating a decrease in the accuracy and precision of the upsampled point cloud.
In summary, the modules of SSPU-FENet play a pivotal role in ensuring the effectiveness of point cloud upsampling. The integration of both the FEM and NPM is crucial for achieving optimal results.
  • Analysis of model and time complexity. In Table 3, a comprehensive comparison of various network models is presented, emphasizing key aspects such as network type, network parameter size, inference time, and the incorporation of feature perturbation learning. A method like PU-GAN [17] employs fixed-value perturbation learning, leading to faster inference speeds despite its unique architecture as a generative adversarial network. Conversely, the GC-PCU [16] model employs adaptive perturbation learning, resulting in an increase in both parameters and inference time compared to PU-GAN or non-perturbation methods.
As for the proposed SSPU-FENet, it is specifically designed to preserve sharp features and enhance feature capabilities. By seamlessly integrating local feature encoding and establishing adaptive feature perturbation learning from individual points, the model dynamically adjusts its parameter learning based on variations in point count. Consequently, SSPU-FENet exhibits a larger network size and increased inference time. Nevertheless, it attains superior upsampling results, effectively striking a balance between model complexity and the excellence of upsampling performance.

4.3. Results of Point Cloud Upsampling

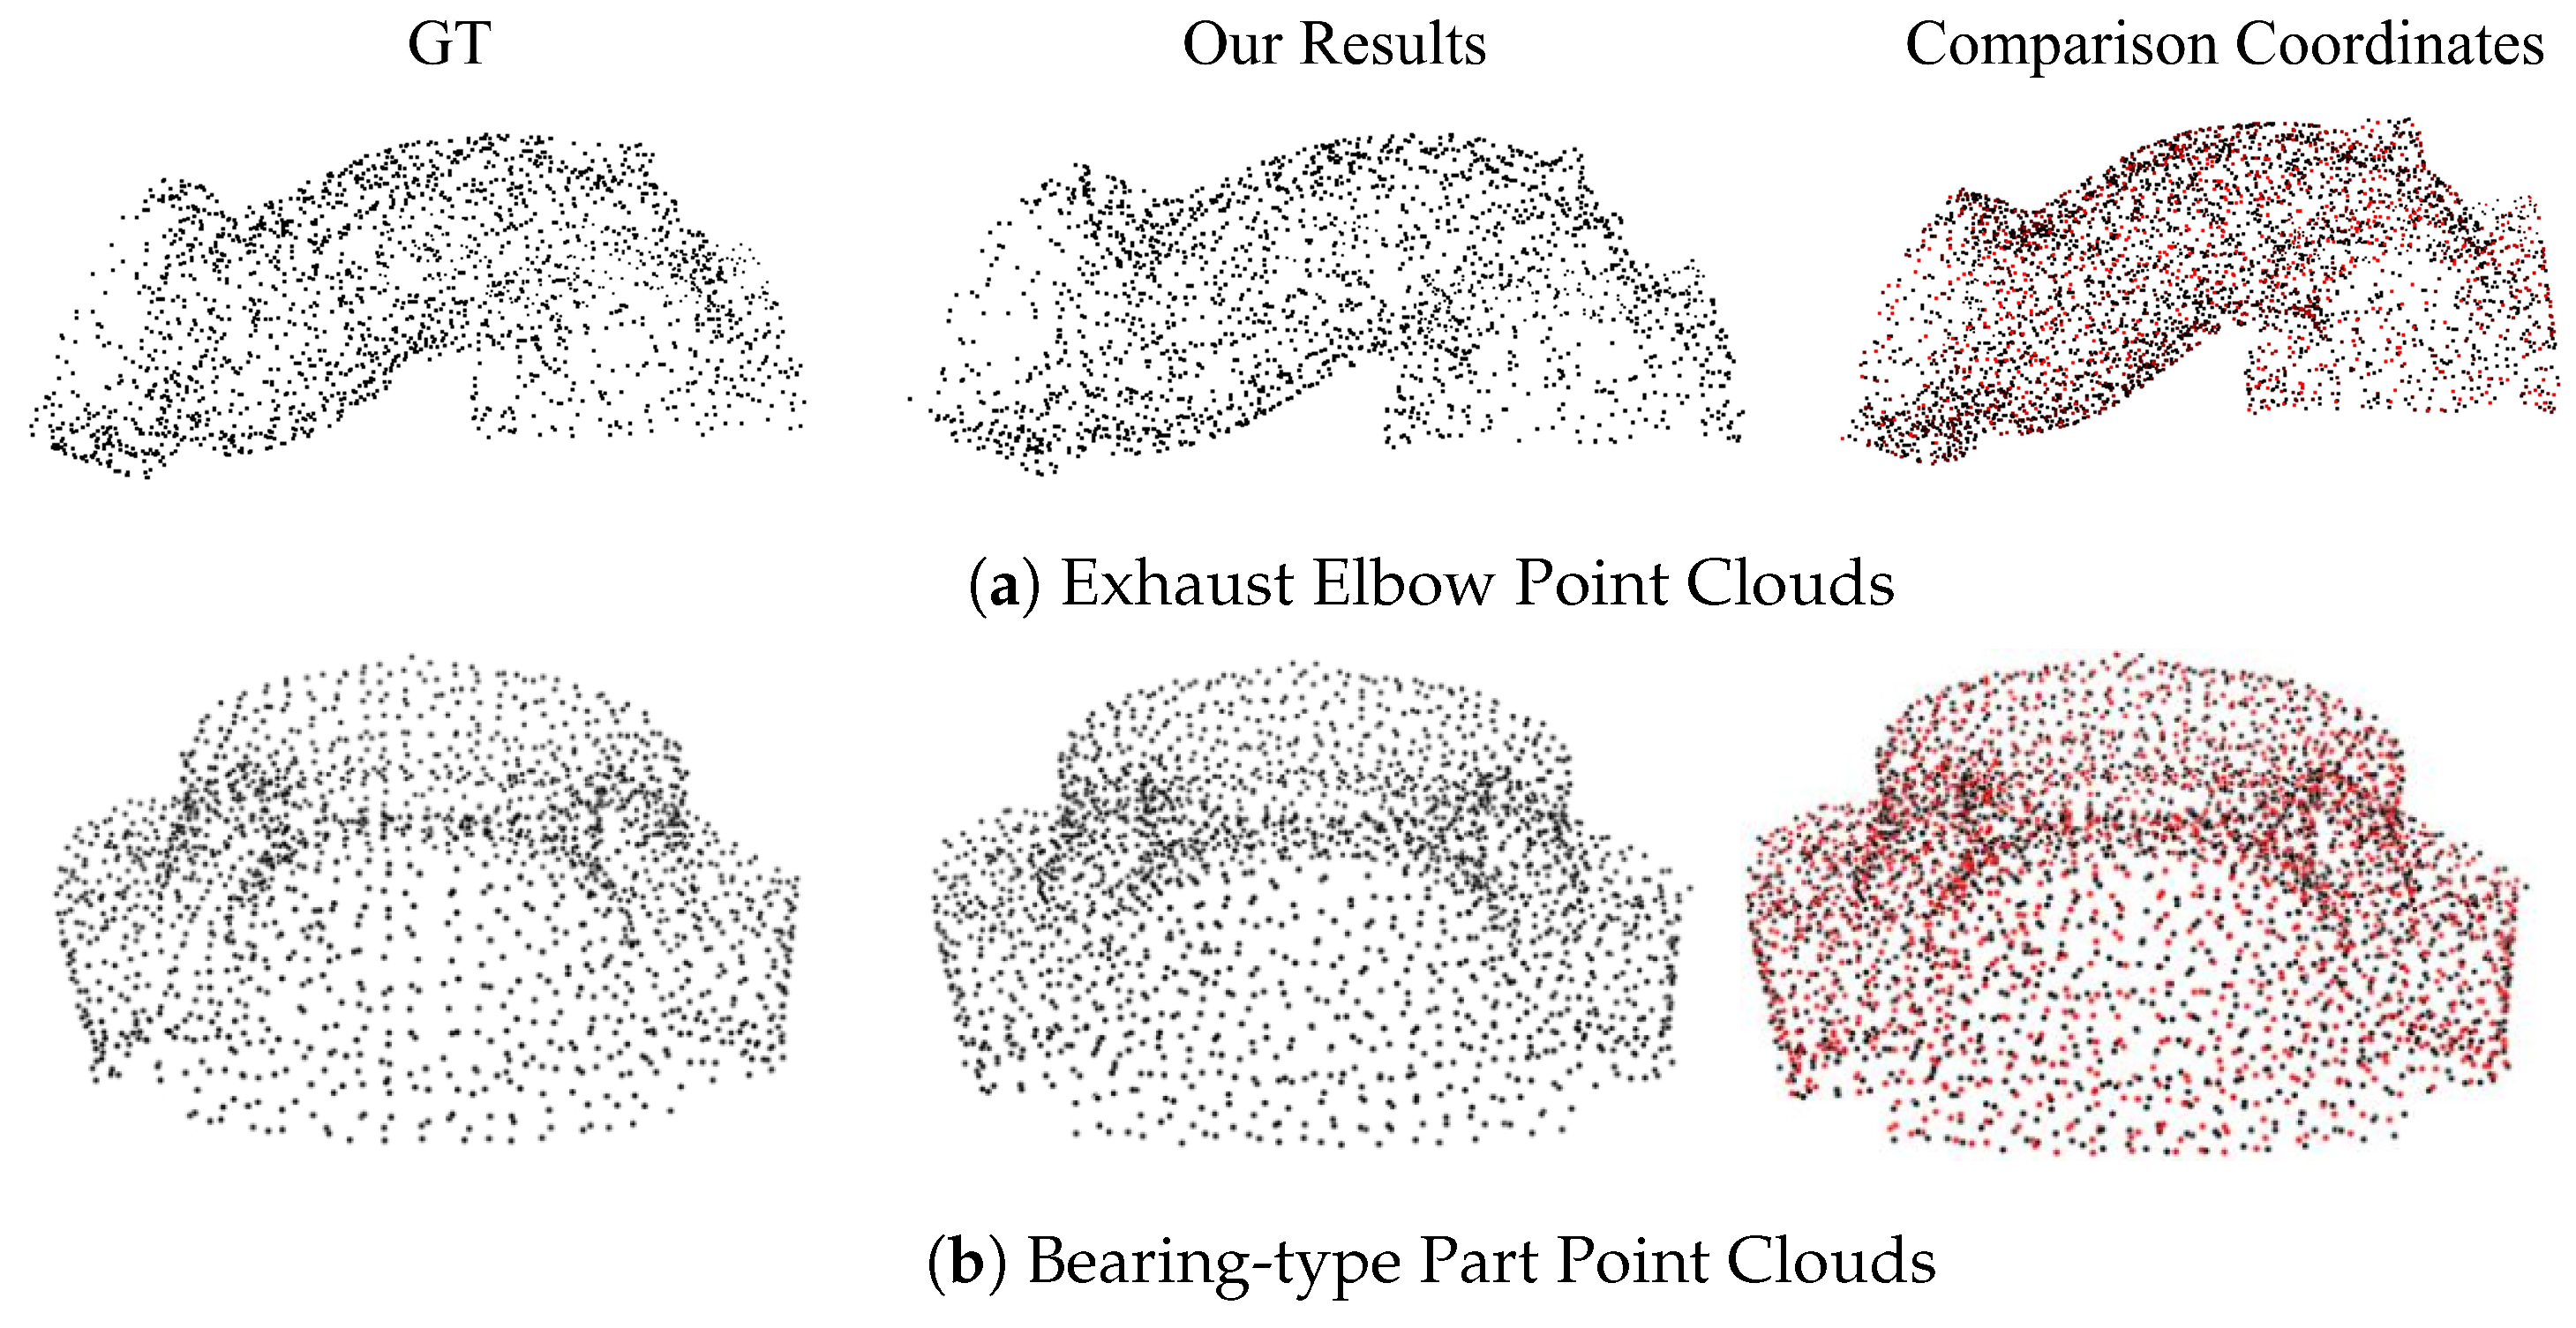
  • Results from testing on ESB dataset. Figure 8 validates the performance of our proposed point cloud upsampling method on mechanical CAD models sourced from the ESB dataset. Initially containing 512 points (first column), the point clouds are effectively upsampled to 1024 points (second column) and 2048 points (third column). This quadrupled point density not only enhances the clarity of the point cloud details but also brings the points closer to the geometric surface, ensuring a uniform distribution. Notably, the upsampling process preserves intricate manufacturing details, such as holes, as evident in the bearing seat point clouds presented in Figure 8a. These features remain clear, smooth, and well defined throughout the process.
For a deeper understanding of our method, Figure 9 compares the existing point clouds in the ESB dataset (ground truth; GT) with the upsampling results obtained in this paper. In the last column, the red points represent the GT point clouds (2048 points), while the black points represent the upsampling results. A coordinate comparison reveals a consistent topological structure between the two point clouds. As can be seen in the second column, the point clouds upsampled using SSPU-FENet show a uniform arrangement, preserving sharp and boundary features. We also compute the Hausdorff distance (HD) between the GT and upsampled point clouds. For the exhaust elbow point cloud in Figure 9a, the average HD is 6.4242, with a minimum distance of 0.0702 and a maximum distance of 17.0627. Similarly, for the bearing-type part point cloud in Figure 9b, the average HD is 9.7770, with a minimum distance of 0.7280 and a maximum distance of 20.1450. Additionally, the average point-to-face (P2F) distance for the bearing-type part is 3.8090. These metrics further validate the accuracy and precision of our upsampling method.
  • Results from tested point clouds collected in ModelNet40 and PU-GAN with various numbers of points. First, it is important to note that the number of points in a point cloud model can vary significantly. Therefore, it is crucial to assess the sampling effectiveness of our method across various point counts. To validate our approach, we randomly select models from the ModelNet40 dataset [23] and present the results in Figure 10. When dealing with sparse point clouds having diverse point inputs, our SSPU-FENet outperforms other methods, such as PU-Refiner [26] and PUFA-GAN [27]. Notably, even with a minimal input of 256 points, our method generates high-quality upsampled point clouds with well-defined boundaries and reduced blurring compared to PU-Mask [12]. Additionally, we observed that unsupervised methods exhibit varying upsampling effects when the input point clouds are sparse. For example, SPU-Net [19] produces some outliers at the edges of the upsampled point clouds. Similarly, SAPCU [25] generates some points to gather together. In addition, S 3 U-PVNet [25] blurs some non-flat regions, as shown in Figure 11.
Second, in Figure 12, we present the upsampling results on the PU-GAN dataset, where the density of the input point clouds (2048 points) is enhanced by a factor of 16 × using various methods, including PU-Net [6], PU-GAN [17], PU-GCN [14], Dis-PU [7], PC2-PU [24], and our SSPU-FENet. The first row of Figure 12a,b shows the detailed local parts of the upsampling results, and the second row shows the whole upsampling results. As can be seen from Figure 12, the other methods, while performing well in most regions, generate noisy points in non-flat regions (e.g., edge parts). For example, the bear point clouds generate noise points at the edges (red boxed parts in Figure 12a), and the point clouds of the legs of the dog are connected due to noisy points (red boxed parts in Figure 12b). This is mainly due to the fact that these methods (e.g., repulsion loss, direct addition of 1D or 2D noise perturbations) give a large repulsive force to the points in these regions, leading to the generation of noisy points. While SSPU-FENet adds learnable 3D noise perturbation parameters, and considers repulsion loss (uniform) in the loss function, thus maintains distinct features without points gathering together.
Third, we provide a detailed analysis using various evaluation metrics to further evaluate the performance of our proposed network. The results for 4 × and 16 × upsampling are summarized in Table 4. Upon examining the CD metric in both the 4 × and 16 × results, it becomes evident that the distance metrics of our method are closer to 0 compared to other methods. This observation indicates a lower degree of information loss, demonstrating the effectiveness of our approach in preserving the original geometry. Furthermore, according to the P2F evaluation metrics based on the 4× upsampling results, the P2F value of PU-Net (supervised learning method with repulsion loss) is 4.3590, and the P2F value of PU-GAN (unsupervised learning method with addition 1D noise) is 3.6100; while the P2F value of our SSPU-FENet is only 2.7034. This indicates that the points in our upsampled model are more closely aligned with the geometric surface. Taken together with the visual representations in Figure 12, it is clear that the SSPU-FENet proposed in this paper not only minimizes point reconstruction loss but also maintains point uniformity and sharp features, collectively leading to an enhanced upsampling effect. In addition, in terms of HD metrics, the results of this paper are only higher than the results of the S 3 U-PVNet [25] method. This is due to the fact that the S 3 U-PVNet [25] method adjusts the results through two processes of up- and downsampling (with high experimental complexity, as shown in Table 3), while this paper obtains the dense point clouds through only one process. Whereas the HD metrics reflect the maximum mismatch through the coordinates, the work is not an alignment, so a certain degree of error is acceptable. In summary, compared with visualization results and evaluation metrics, the method proposed in this paper generates more reasonable point positions than other methods.
  • Mesh reconstruction based on upsampled point clouds. Point cloud upsampling is pivotal in various downstream tasks, such as mesh reconstruction. Firstly, we verify the impact of our upsampled point cloud model on mesh reconstruction using the Poisson surface reconstruction method [28]. As shown in Figure 13, the first column displays randomly selected ground truth (GT) models from the ESB and PU-GAN datasets. The second and third columns are the 4 × and 8 × upsampling results, respectively, with the 512 input points. The varying colors in the last two columns represent the distance between the points and the GT model, ranging from blue (indicating the smallest distance) to red (representing the largest distance). It is evident that the mesh reconstruction closely resembles the GT model, apart from some minor non-smooth edges observed in the 4 × upsampling. Moreover, we randomly select a test sample from the PU1K dataset and generate the corresponding upsampled point cloud. Subsequently, we employ the ball-pivoting method [29] to reconstruct the meshes, as shown in Figure 14. Our method successfully infers the points at the armrests of the chair, significantly contributing to the subsequent mesh reconstruction process. In contrast, other methods [7,8,12,14,17,26,30] yield incomplete results or loss points at the armrests of the chair, demonstrating the superiority of our approach in handling complex geometric features.

5. Conclusions

SSPU-FENet, a self-supervised network with feature enhancement and perturbation learning modules, is proposed to generate geometric information-rich dense upsampled point clouds. This network captures global structural details, ensuring clear boundaries and optimal coordinate reconstruction. Experimental results demonstrate its superior upsampling performance compared to state-of-art methods, demonstrating its potential in dealing with CAD models. However, despite its promising performance, SSPU-FENet still faces challenges when processing complex point clouds. These challenges arise from the inherent difficulties in handling noisy, incomplete, or irregularly shaped point clouds, which are common in real-world applications. Therefore, further enhancements and refinements are needed to improve the network capability and generalization. For future work, we plan to extend its ability to handle arbitrary proportions of upsampling by creating a more flexible architecture, as well as minimizing manual human interference by building a fully unsupervised network. These efforts will expand the applicability of the network and reduce user workload while improving efficiency and accuracy. Meanwhile, we will transfer the network to the task of point cloud completion, especially for missing point clouds or point clouds with big holes, in order to improve the generalization ability of the network. In conclusion, while SSPU-FENet has achieved promising results in point cloud upsampling, there is still improvement in handling complex point clouds. By focusing on enhancing the robustness, flexibility, and automation of the network, we hope to develop a more powerful and generalized tool for point cloud upsampling in a variety of applications.

Author Contributions

Conceptualization, S.Q.; methodology, S.Q. and Y.J.; validation, S.Q.; writing—original draft preparation, S.Q.; writing—review and editing, S.Q., Y.J. and H.H. All authors have read and agreed to the published version of the manuscript.

Funding

This work was funded by the Key R & D Programs of Zhejiang Province (No. 2023C01224), the National Nature Science Foundation of China (No. 61702458), the Natural Science Foundation of Huzhou city, China (Np. 2022YZ15), the Zhejiang University of Water Resources and Electric Power Excellent Course Project (No. 2023-108) and the Huzhou University Excellent Graduate Course Project (No. YJGX24003).

Institutional Review Board Statement

Not applicable.

Informed Consent Statement

Not applicable.

Data Availability Statement

All data that support the findings of this study are included in this manuscript.

Conflicts of Interest

The authors report there are no competing interests to declare.

References

  1. Zhao, W.; Liu, X.; Zhai, D.; Jiang, J.; Ji, X. Self-Supervised Arbitrary-Scale Implicit Point Clouds Upsampling. IEEE Trans. Pattern Anal. Mach. Intell. 2023, 45, 12394–12407. [Google Scholar] [CrossRef] [PubMed]
  2. Yu, Z.; Li, M.; Yang, J.; Chen, Z.; Zhang, H.; Liu, W.; Han, F.K.; Liu, J. A Benchmark Dual-Modality Dental Imaging Dataset and a Novel Cognitively Inspired Pipeline for High-Resolution Dental Point Cloud Synthesis. Cogn. Comput. 2023, 15, 1922–1933. [Google Scholar] [CrossRef]
  3. Fugacci, U.; Romanengo, C.; Falcidieno, B.; Biasotti, S. Reconstruction and Preservation of Feature Curves in 3D Point Cloud Processing. Comput.-Aided Des. 2024, 167, 103649. [Google Scholar] [CrossRef]
  4. Saharia, C.; Ho, J.; Chan, W.; Salimans, T.; Fleet, D.J.; Norouzi, M. Image super-resolution via iterative refinement. IEEE Trans. Pattern Anal. Mach. Intell. 2022, 45, 4713–4726. [Google Scholar] [CrossRef]
  5. Zhang, W.; Zhao, W.; Li, J.; Zhuang, P.; Sun, H.; Xu, Y.; Li, C. CVANet: Cascaded visual attention network for single image super-resolution. Neural Netw. 2024, 170, 622–634. [Google Scholar] [CrossRef] [PubMed]
  6. Yu, L.; Li, X.; Fu, C.W.; Cohen-Or, D.; Heng, P.A. Pu-net: Point cloud upsampling network. In Proceedings of the IEEE Conference on Computer Vision and Pattern Recognition, Salt Lake City, UT, USA, 18–22 June 2018; pp. 2790–2799. [Google Scholar]
  7. Li, R.; Li, X.; Heng, P.A.; Fu, C.W. Point cloud upsampling via disentangled refinement. In Proceedings of the IEEE/CVF Conference on Computer Vision and Pattern Recognition, Nashville, TN, USA, 20–25 June 2021; pp. 344–353. [Google Scholar]
  8. Qian, Y.; Hou, J.; Kwong, S.; He, Y. PUGeo-Net: A geometry-centric network for 3D point cloud upsampling. In Proceedings of the European Conference on Computer Vision, Glasgow, UK, 23–28 August 2020; Springer: Cham, Switzerland, 2020; pp. 752–769. [Google Scholar]
  9. He, Y.; Tang, D.; Zhang, Y.; Xue, X.; Fu, Y. Grad-PU: Arbitrary-Scale Point Cloud Upsampling via Gradient Descent with Learned Distance Functions. In Proceedings of the IEEE/CVF Conference on Computer Vision and Pattern Recognition, Vancouver, BC, Canada, 17–24 June 2023; pp. 5354–5363. [Google Scholar]
  10. Han, B.; Zhang, X.; Ren, S. PU-GACNet: Graph attention convolution network for point cloud upsampling. Image Vis. Comput. 2022, 118, 104371. [Google Scholar] [CrossRef]
  11. Han, B.; Deng, L.; Zheng, Y.; Ren, S. S3U-PVNet: Arbitrary-scale point cloud upsampling via Point-Voxel Network based on Siamese Self-Supervised Learning. Comput. Vis. Image Underst. 2024, 239, 103890. [Google Scholar] [CrossRef]
  12. Liu, H.; Yuan, H.; Hamzaoui, R.; Liu, Q.; Li, S. PU-Mask: 3D Point Cloud Upsampling via an Implicit Virtual Mask. IEEE Trans. Circuits Syst. Video Technol. 2024, 34, 6489–6502. [Google Scholar] [CrossRef]
  13. Qi, C.R.; Yi, L.; Su, H.; Guibas, L.J. Pointnet++: Deep hierarchical feature learning on point sets in a metric space. In Advances in Neural Information Processing Systems, Long Beach, CA, USA, 4–9 December 2017; ACM: New York, NY, USA, 2017; pp. 5105–5114. [Google Scholar]
  14. Qian, G.; Abualshour, A.; Li, G.; Thabet, A.; Ghanem, B. Pu-gcn: Point cloud upsampling using graph convolutional networks. In Proceedings of the IEEE/CVF Conference on Computer Vision and Pattern Recognition, Nashville, TN, USA, 20–25 June 2021; pp. 11683–11692. [Google Scholar]
  15. Qiu, S.; Anwar, S.; Barnes, N. Pu-transformer: Point cloud upsampling transformer. In Proceedings of the Asian Conference on Computer Vision, Macau, China, 4–8 December 2022; pp. 2475–2493. [Google Scholar]
  16. Ding, D.; Qiu, C.; Liu, F.; Pan, Z. Point cloud upsampling via perturbation learning. IEEE Trans. Circuits Syst. Video Technol. 2021, 31, 4661–4672. [Google Scholar] [CrossRef]
  17. Li, R.; Li, X.; Fu, C.W.; Cohen-Or, D.; Heng, P.A. Pu-gan: A point cloud upsampling adversarial network. In Proceedings of the IEEE/CVF International Conference on Computer Vision, Seoul, Republic of Korea, 27 October–2 November 2019; pp. 7203–7212. [Google Scholar]
  18. Ye, S.; Chen, D.; Han, S.; Wan, Z.; Liao, J. Meta-PU: An arbitrary-scale upsampling network for point cloud. IEEE Trans. Vis. Comput. Graph. 2021, 28, 3206–3218. [Google Scholar] [CrossRef]
  19. Liu, X.; Liu, X.; Liu, Y.S.; Han, Z. Spu-net: Self-supervised point cloud upsampling by coarse-to-fine reconstruction with self-projection optimization. IEEE Trans. Image Process. 2022, 31, 4213–4226. [Google Scholar] [CrossRef] [PubMed]
  20. Pumir, T.; Singer, A.; Boumal, N. The generalized orthogonal Procrustes problem in the high noise regime. Inf. Inference J. IMA 2021, 10, 921–954. [Google Scholar] [CrossRef]
  21. Qin, S.; Li, Z.; Liu, L. Robust 3D Shape Classification via Non-Local Graph Attention Network. In Proceedings of the IEEE/CVF Conference on Computer Vision and Pattern Recognition, Vancouver, BC, Canada, 17–24 June 2023; pp. 5374–5383. [Google Scholar]
  22. Jayanti, S.; Kalyanaraman, Y.; Iyer, N.; Ramani, K. Developing an engineering shape benchmark for CAD models. Comput.-Aided Des. 2006, 38, 939–953. [Google Scholar] [CrossRef]
  23. Wu, Z.; Song, S.; Khosla, A.; Yu, F.; Zhang, L.; Tang, X.; Xiao, J. 3d shapenets: A deep representation for volumetric shapes. In Proceedings of the IEEE Conference on Computer Vision and Pattern Recognition, Boston, MA, USA, 7–12 June 2015; pp. 1912–1920. [Google Scholar]
  24. Long, C.; Zhang, W.; Li, R.; Wang, H.; Dong, Z.; Yang, B. Pc2-pu: Patch correlation and point correlation for effective point cloud upsampling. In Proceedings of the 30th ACM International Conference on Multimedia, Lisbon, Portugal, 10–14 October 2022; pp. 2191–2201. [Google Scholar]
  25. Zhao, W.; Liu, X.; Zhong, Z.; Jiang, J.; Gao, W.; Li, G.; Ji, X. Self-Supervised Arbitrary-Scale Point Clouds Upsampling via Implicit Neural Representation. In Proceedings of the IEEE/CVF Conference on Computer Vision and Pattern Recognition, New Orleans, LA, USA, 18–24 June 2022; pp. 1999–2007. [Google Scholar]
  26. Liu, H.; Yuan, H.; Hamzaoui, R.; Gao, W.; Li, S. PU-refiner: A geometry refiner with adversarial learning for point cloud upsampling. In Proceedings of the IEEE International Conference on Acoustics, Speech and Signal Processing, Singapore, 22–27 May 2022; pp. 2270–2274. [Google Scholar]
  27. Liu, H.; Yuan, H.; Hou, J.; Hamzaoui, R.; Gao, W. Pufa-gan: A frequency-aware generative adversarial network for 3d point cloud upsampling. IEEE Trans. Image Process. 2022, 31, 7389–7402. [Google Scholar] [CrossRef]
  28. Kazhdan, M.; Hoppe, H. Screened poisson surface reconstruction. ACM Trans. Graph. (ToG) 2013, 32, 1–13. [Google Scholar] [CrossRef]
  29. Bernardini, F.; Mittleman, J.; Rushmeier, H.; Silva, C.; Taubin, G. The ball-pivoting algorithm for surface reconstruction. IEEE Trans. Vis. Comput. Graph. 1999, 5, 349–359. [Google Scholar] [CrossRef]
  30. Yifan, W.; Wu, S.; Huang, H.; Cohen-Or, D.; Sorkine-Hornung, O. Patch-based progressive 3d point set upsampling. In Proceedings of the IEEE/CVF Conference on Computer Vision and Pattern Recognition, Long Beach, CA, USA, 15–20 June 2019; pp. 5958–5967. [Google Scholar]
Figure 1. Overall network architecture.
Applsci 15 00174 g001
Figure 2. Points in non-flat or flat regions.
Applsci 15 00174 g002
Figure 3. Feature enhancement module (FEM).
Applsci 15 00174 g003
Figure 4. Schematic diagram of local geometric structures’ consistency.
Applsci 15 00174 g004
Figure 5. Part point cloud models in the datasets.
Applsci 15 00174 g005
Figure 6. Comparison of the average performance of different upsampling ratios under different neighborhood sizes.
Applsci 15 00174 g006
Figure 7. Comparison of upsampling effects based on different modules ((a) represents removing the FEM module from SSPU-FENet and (b) is the result based on the SSPU-FENet) under the P2F metric.
Applsci 15 00174 g007
Figure 8. Part results tested in the ESB dataset.
Applsci 15 00174 g008
Figure 9. Comparison results between the GT point clouds in the ESB dataset and our generated point clouds.
Applsci 15 00174 g009
Figure 10. Upsampling ( 4 × ) the point cloud Cup from ModelNet40 with 256, 1024, and 4096 input points.
Applsci 15 00174 g010
Figure 11. Upsampling ( 4 × ) the point clouds from PU-GAN’s dataset with 512, 1024, 2048, and 4096 input points.
Applsci 15 00174 g011
Figure 12. Comparison of 16 × results.
Applsci 15 00174 g012
Figure 13. Visualization of mesh reconstruction compared to GT models.
Applsci 15 00174 g013
Figure 14. Visualization of mesh reconstruction compared to other methods.
Applsci 15 00174 g014
Table 1. Hyperparameters in SSPU-FENet.
HyperparameterValue
Window sizes of 2D conv layers3/3
Values k in two k-max pooling layers2/2
Learning rate0.001
Batch size28
Max epoch120
Decay rate0.70
Default upsampling ratio4
Table 2. Comparison of the average performance of different upsampling ratios under different modules.
MetricSSPU-FENetRemoving FEMRemoving NPM
CD0.11480.19430.2206
HD2.23312.64752.9116
P2F1.90521.92101.9223
JSD0.02030.02040.0234
Table 3. Comparison of model and time complexity.
ModelSupervised?Perturbation LearningParams (M)Time (ms)
PU-Net [6]YesNo3.004.55
PU-GAN [17]NoYes (fixed, 1D)2.077.08
PU-GCN [14]YesNo0.295.51
Dis-PU [7]YesNo3.9912.77
PC2-PU [24]YesNo1.714.19
GC-PCU [16]YesYes (adaptive, 2D)5.01858.9
SPU-Net [19]NoNo0.68130.9
SAPCU [25]NoNo26.4811,607.0
S 3 U-PVNet [11]NoNo19.641047.0
SSPU-FENetNoYes (adaptive, 3D)8.71900.1
Table 4. Comparison of 4 × and 16 × results under evaluation metrics.
Models 4 × 16 ×
CDHDP2FCDHDP2F
PU-Net [6]0.52254.60834.35900.31233.91115.0470
PU-GAN [17]0.26764.73793.61000.22326.32434.5690
PU-GCN [14]0.27243.04553.37600.16573.82243.5060
Dis-PU [7]0.25604.72773.17800.14846.09343.7660
PC2-PU [24]0.23212.59422.72500.09982.86922.9440
Grad-PU [9]0.25002.37001.89000.10802.35202.1270
S 3 U-PVNet [11]0.28001.64002.53000.12121.52502.4040
SAPCU [25]0.46009.06003.45000.38209.35503.2900
SSPU-FENet0.18982.22932.70340.09912.02972.1435
Disclaimer/Publisher’s Note: The statements, opinions and data contained in all publications are solely those of the individual author(s) and contributor(s) and not of MDPI and/or the editor(s). MDPI and/or the editor(s) disclaim responsibility for any injury to people or property resulting from any ideas, methods, instructions or products referred to in the content.

