Article

Curiosity-Driven Camouflaged Object Segmentation

by
Mengyin Pang
1,2,
Meijun Sun
1,2,* and
Zheng Wang
1,2
1
College of Intelligence and Computing, Tianjin University, Tianjin 300350, China
2
Tianjin Key Laboratory of Machine Learning, Tianjin University, Tianjin 300350, China
*
Author to whom correspondence should be addressed.
Appl. Sci. 2025, 15(1), 173; https://doi.org/10.3390/app15010173
Submission received: 3 December 2024 / Revised: 20 December 2024 / Accepted: 26 December 2024 / Published: 28 December 2024

Abstract

:
Camouflaged object segmentation refers to the task of accurately extracting objects that are seamlessly integrated within their surrounding environment. Existing deep-learning methods frequently encounter challenges in accurately segmenting camouflaged objects, particularly in capturing their complete and intricate details. To this end, we propose a novel method based on the Curiosity-Driven network, which is motivated by the innate human tendency for curiosity when encountering ambiguous regions and the subsequent drive to explore and observe objects’ details. Specifically, the proposed fusion bridge module aims to exploit the model’s inherent curiosity to fuse these features extracted by the dual-branch feature encoder to capture the complete details of the object. Then, drawing inspiration from curiosity, the curiosity-refinement module is proposed to progressively refine the initial predictions by exploring unknown regions within the object’s surrounding environment. Notably, we develop a novel curiosity-calculation operation to discover and remove curiosity, leading to accurate segmentation results. Extensive quantitative and qualitative experiments demonstrate that the proposed model significantly outperforms the existing competitors on three challenging benchmark datasets. Compared with the recently proposed state-of-the-art method, our model achieves performance gains of 1.80 % on average for S α . Moreover, our model can be extended to the polyp and industrial defects segmentation tasks, validating its robustness and effectiveness.

1. Introduction

Camouflaged object segmentation (COS) [1] is the task of extracting objects that are harmoniously blended with their ambient surroundings. Camouflaged objects are ubiquitous in nature and human society, including polyps in the medical field [2,3,4,5], defects in the industrial field [6,7], objects blurred by bad weather or light in the transportation field [8], and artistic creation objects in the entertainment and art fields [9]. These objects are difficult to identify due to their high degree of integration with the background, requiring more accurate location and more complete object segmentation. Therefore, COS has received increasing attention due to its application and scientific value.
The intricate backgrounds of objects and the inherent difficulty in recognizing boundaries pose significant challenges in the field of COS. Early methods aim to exploit hand-crafted low-level features (e.g., color [10], orientation [11], texture [12], 3D convexity [13], motion boundaries [14], etc.), but the effectiveness of these features in achieving accurate discrimination remains limited. Recently, the progressive advancement of deep learning techniques, coupled with the accessibility of large-scale COS datasets (e.g., COD10K [15], NC4K [16], CAMO [17]), has yielded substantial improvements in the overall segmentation performance of camouflaged objects. Numerous CNN-based approaches [15,16,18,19,20,21,22] have been proposed to address the COS challenge. Considering the superiority of Transformer in modeling long-term dependencies, many transformer-based methods [23,24,25,26] have also yielded commendable performance outcomes. However, their efficacy may diminish considerably in more intricate scenarios characterized by small targets, multiple targets, and blurred boundaries. As shown in Figure 1, recently proposed CNN-based methods (e.g., FEDER [22]) and Transformer-based methods (e.g., HitNet [25]) both perform poorly in capturing complete and intricate details.
In response to this challenge, curiosity, an important driving force for human exploration of the unknown world, can help us solve it. According to the cognitive processes of the human brain, when people encounter ambiguous entities or spatial regions, they naturally tend to exhibit curiosity and are more willing to allocate additional energy to observing and analyzing the object, thereby facilitating a gradual process of perception and confirmation. Inspired by this, we interpret curiosity as the model’s drive and inclination to explore unknown or subtle information, particularly those features that are challenging to discern. When encountering camouflaged objects, the model’s curiosity is stimulated by the concealment of their appearance and texture, prompting active exploration and learning of these object features. Based on this idea, we propose a novel Curiosity-Driven network (CDNet) to promote the model’s learning and exploration capabilities by motivating the model’s curiosity to facilitate a more effective segmentation process. Our CDNet contains three essential modules, i.e., the dual-branch feature encoder (DFE), the fusion bridge module (FBM), and the curiosity-refinement module (CRM). The DFE is designed to extract multi-level global features from the Transformer and local features from CNN. Subsequently, the FBM skillfully integrates these global and local features, harnessing curiosity to facilitate the fusion process. Additionally, the CRM enhances information acquisition and gradually refines initial segmentation results by discovering and removing curiosity to distinguish intricate details in unknown areas.
The contributions of this paper are summarized as follows:
  • We introduce the idea of curiosity into the COS task and propose a novel Curiosity-Driven network (CDNet) to obtain more information from unknown areas, thereby facilitating accurate segmentation of camouflaged objects.
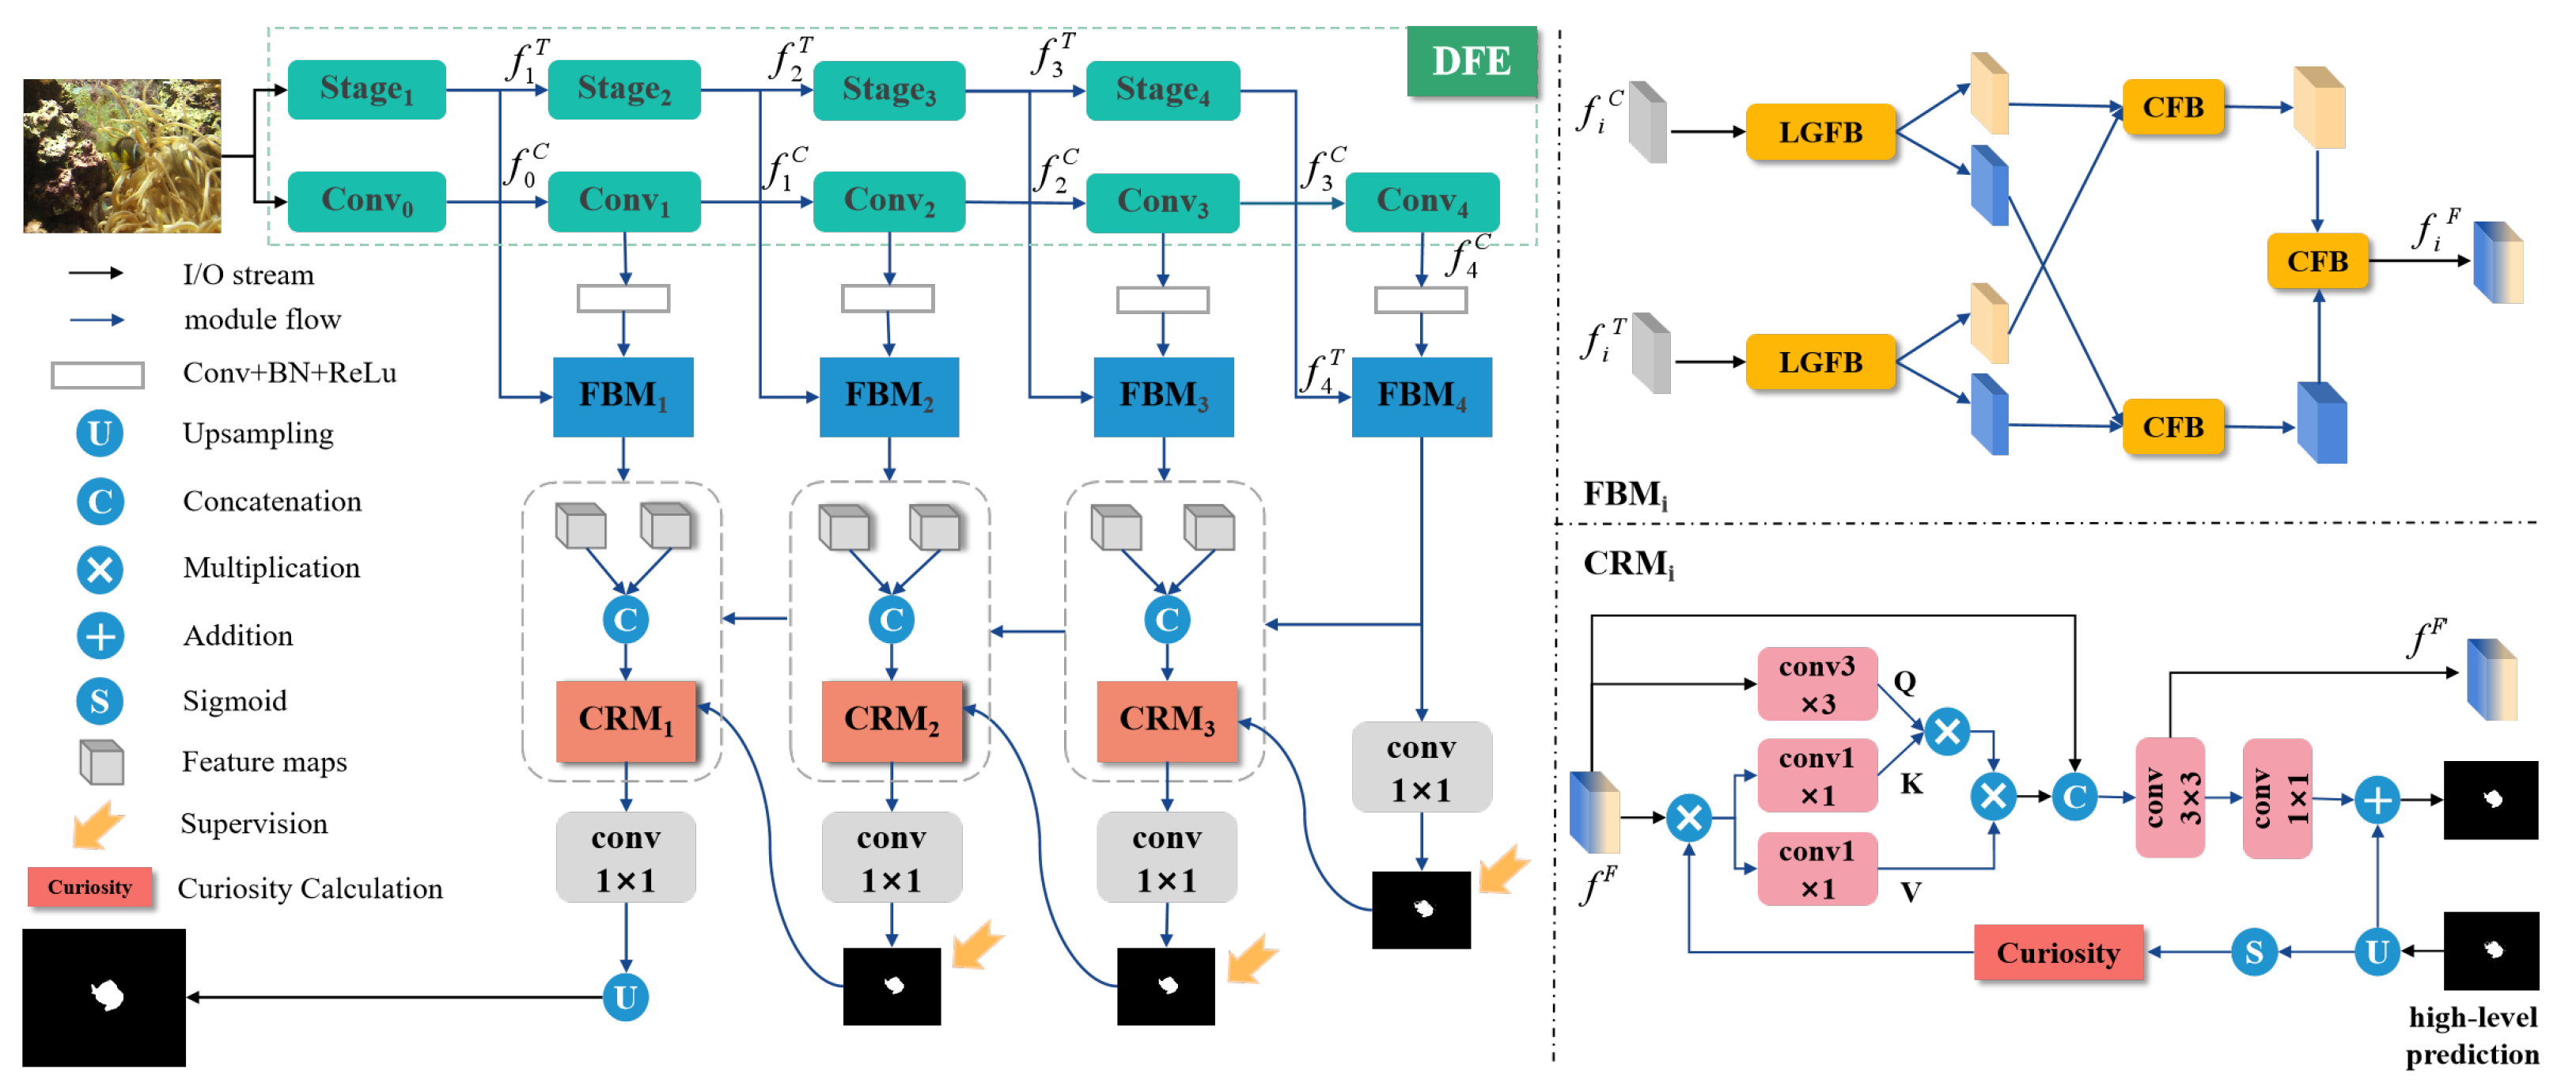
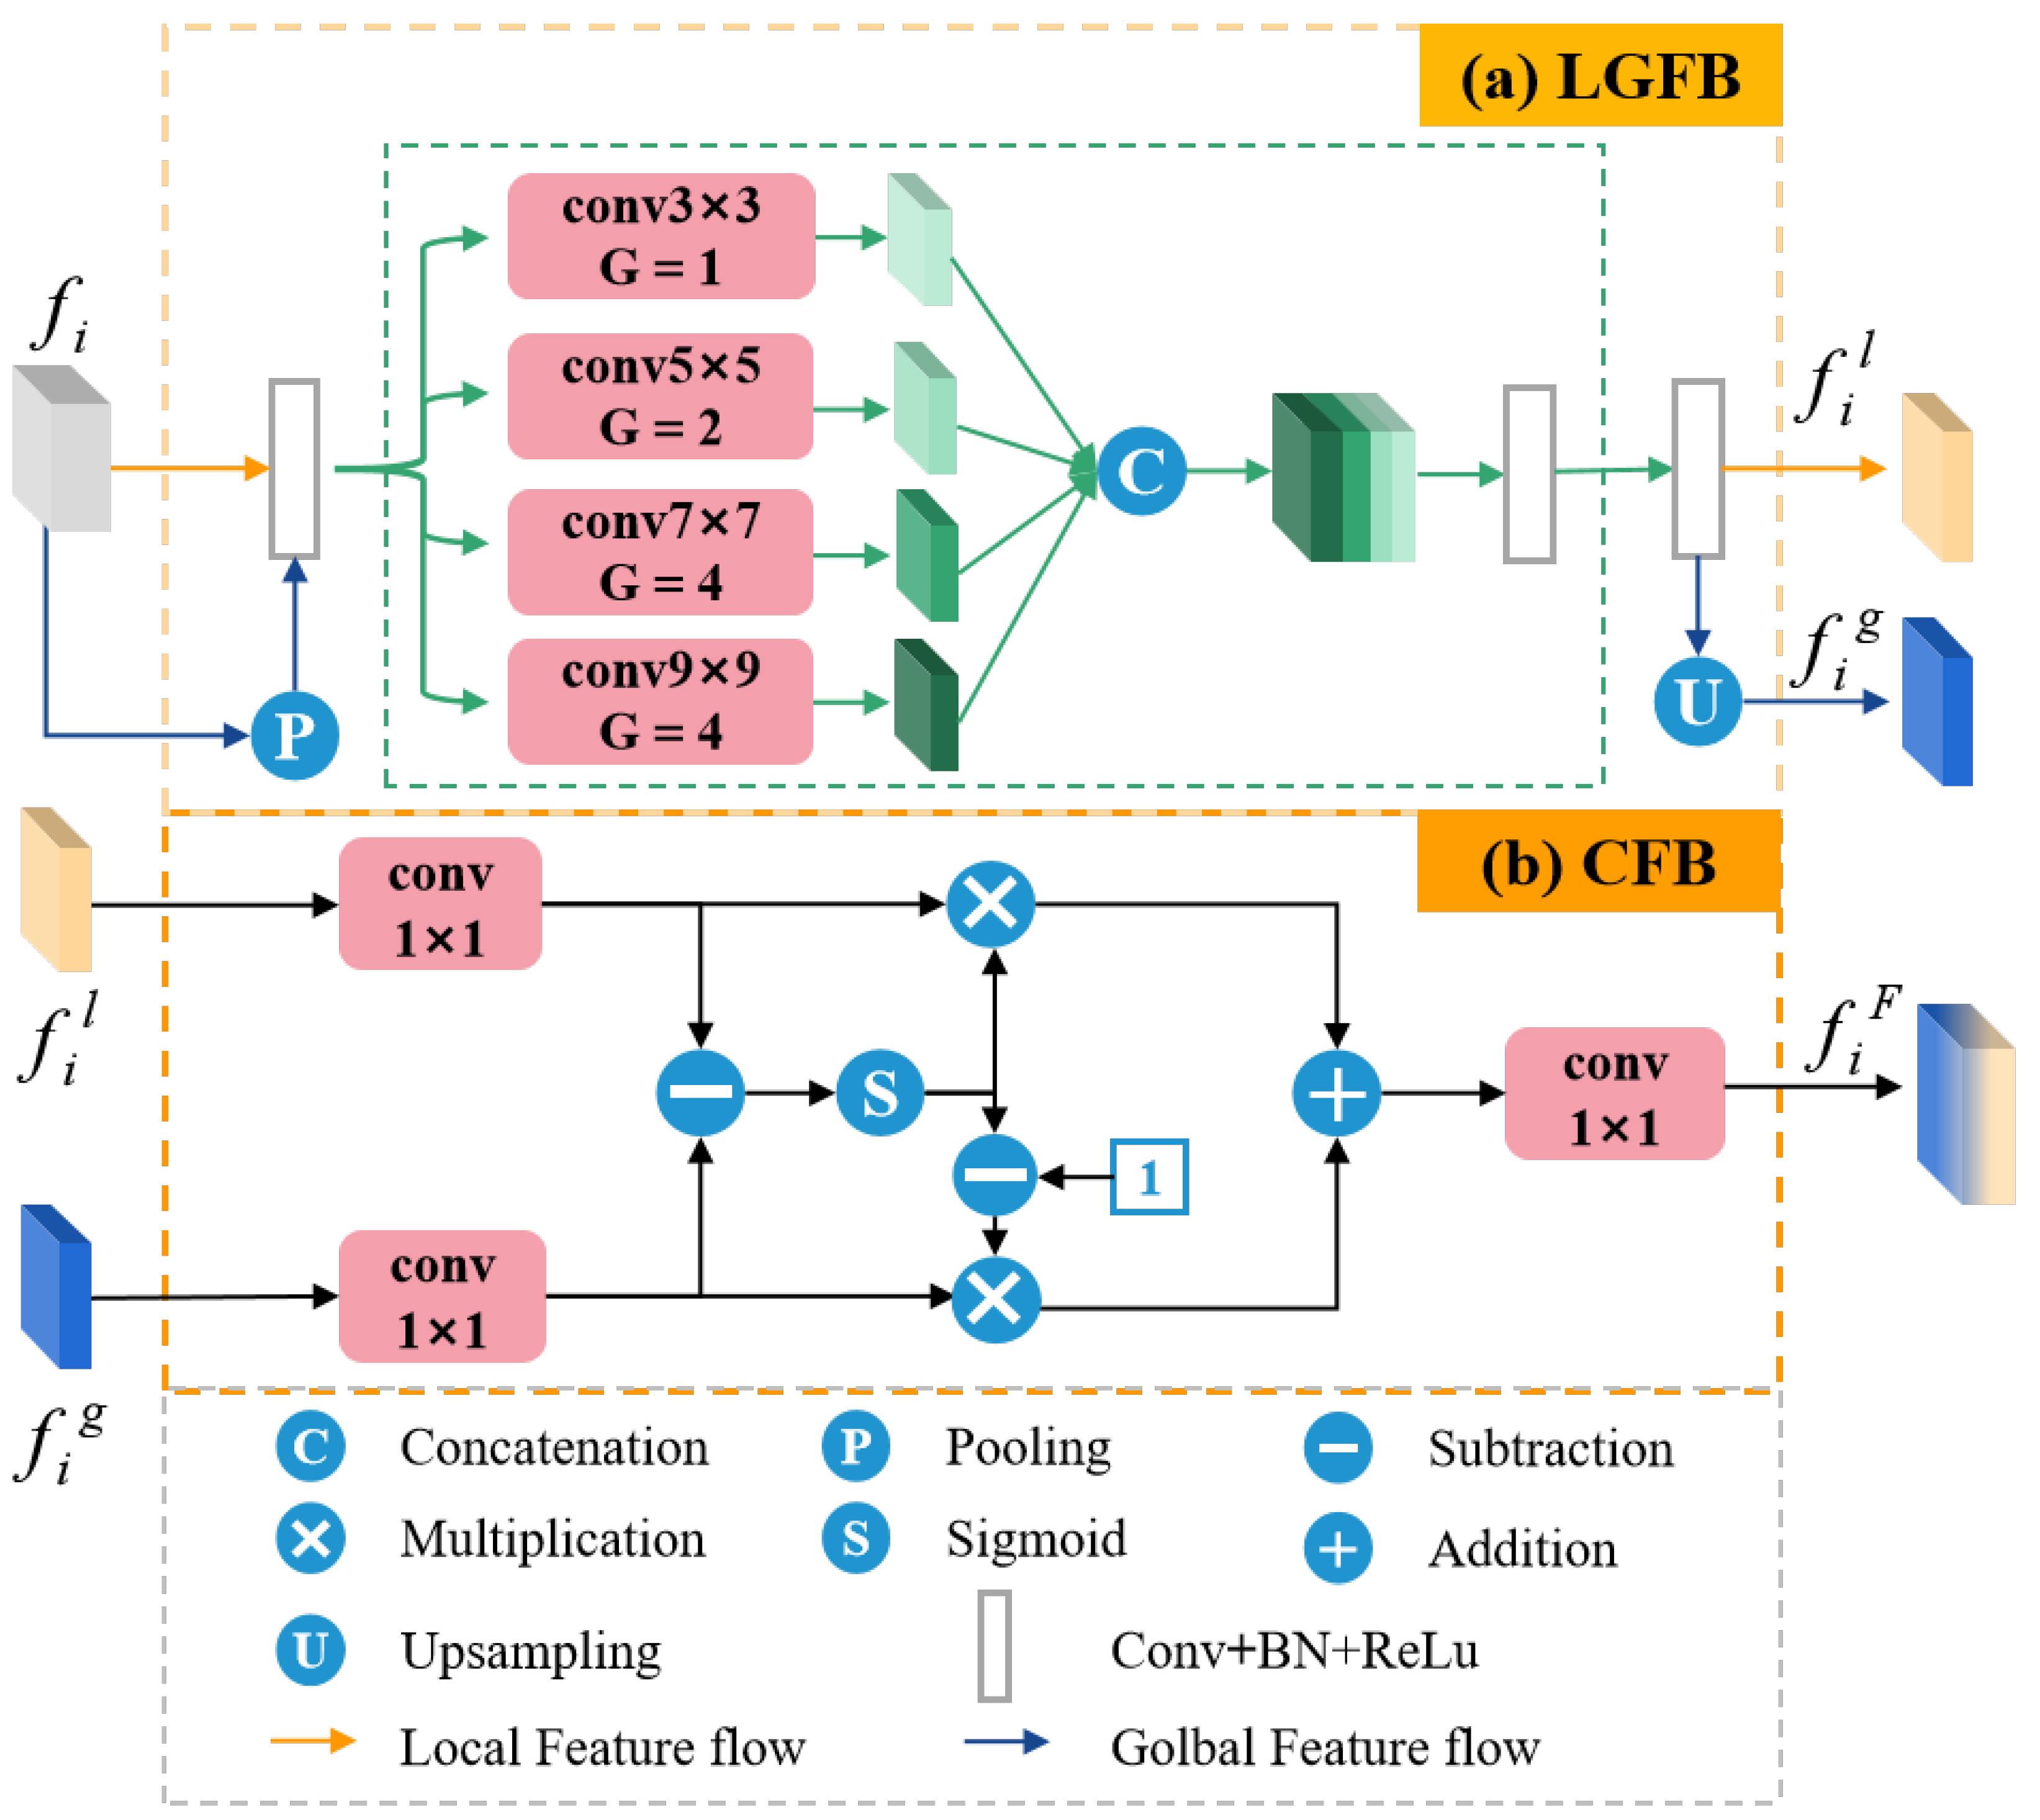
  • The fusion bridge module (FBM) is meticulously designed to effectively fuse the features extracted by CNN and Transformer by using the idea of curiosity to obtain complete information.
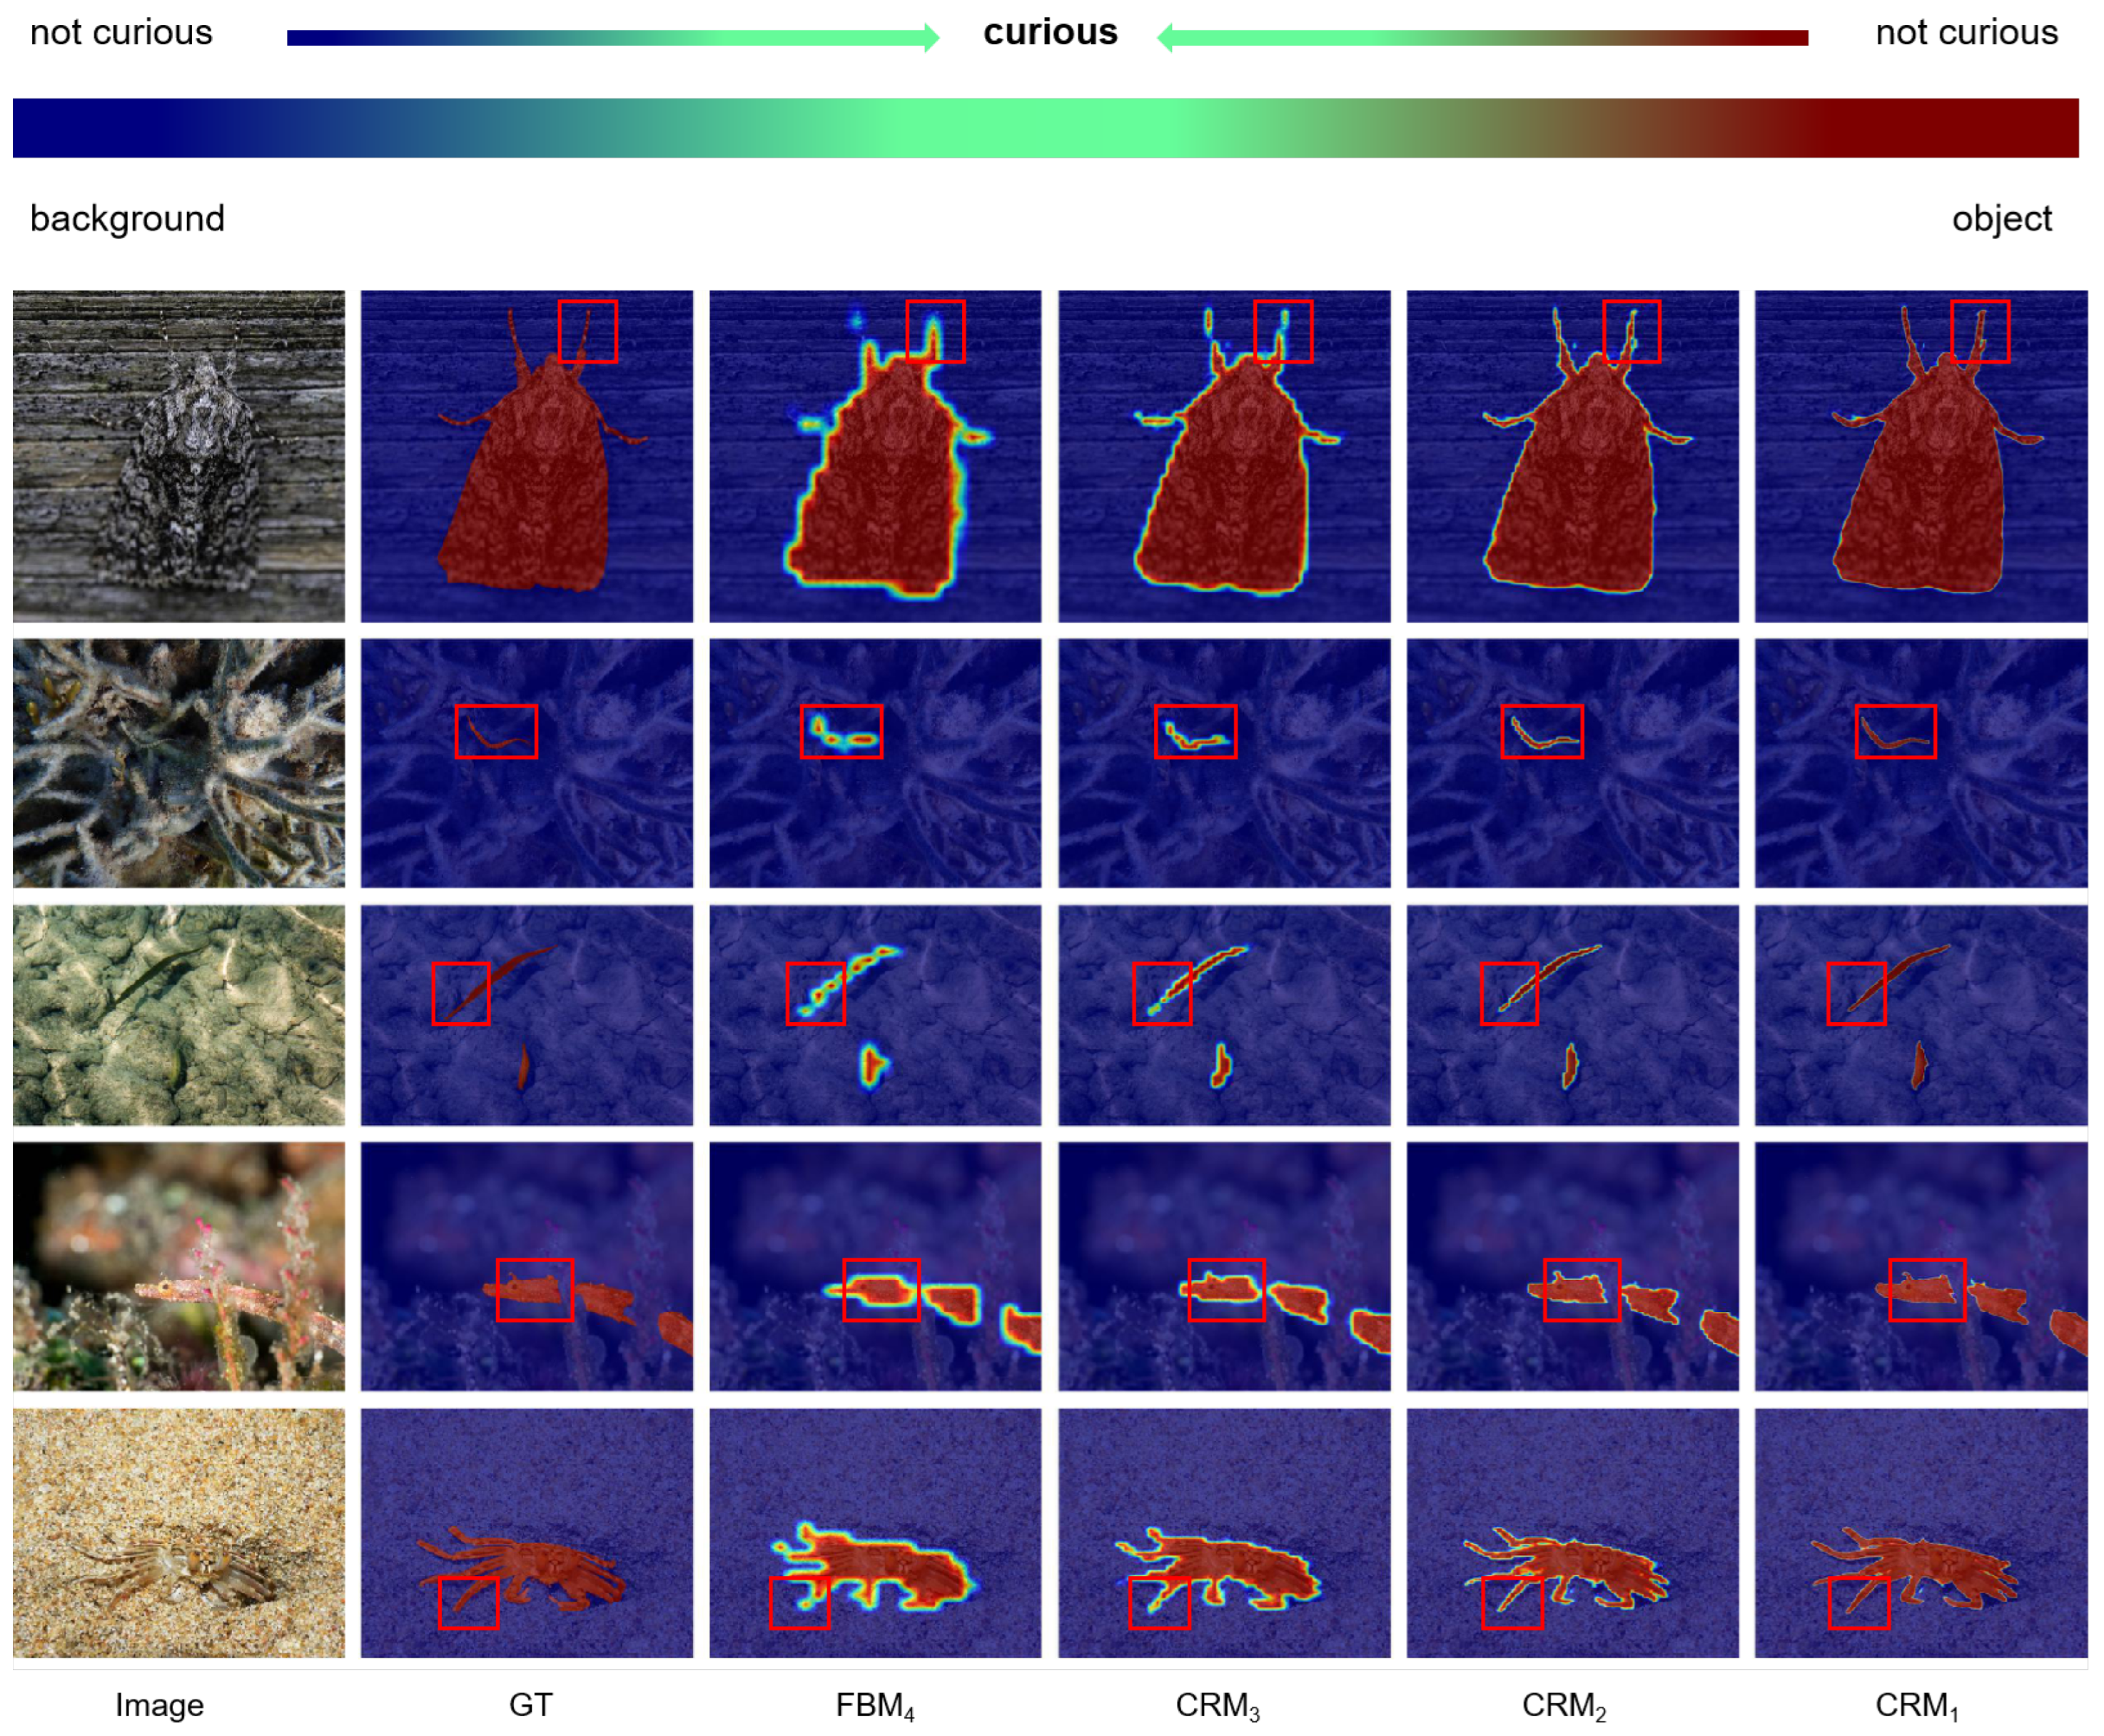
  • The curiosity-refinement module (CRM) is proposed to gradually discover and reduce the curiosity of camouflaged objects, and iteratively improve the initial segmentation to distinguish intricate details, thereby enhancing accuracy in segmentation results.
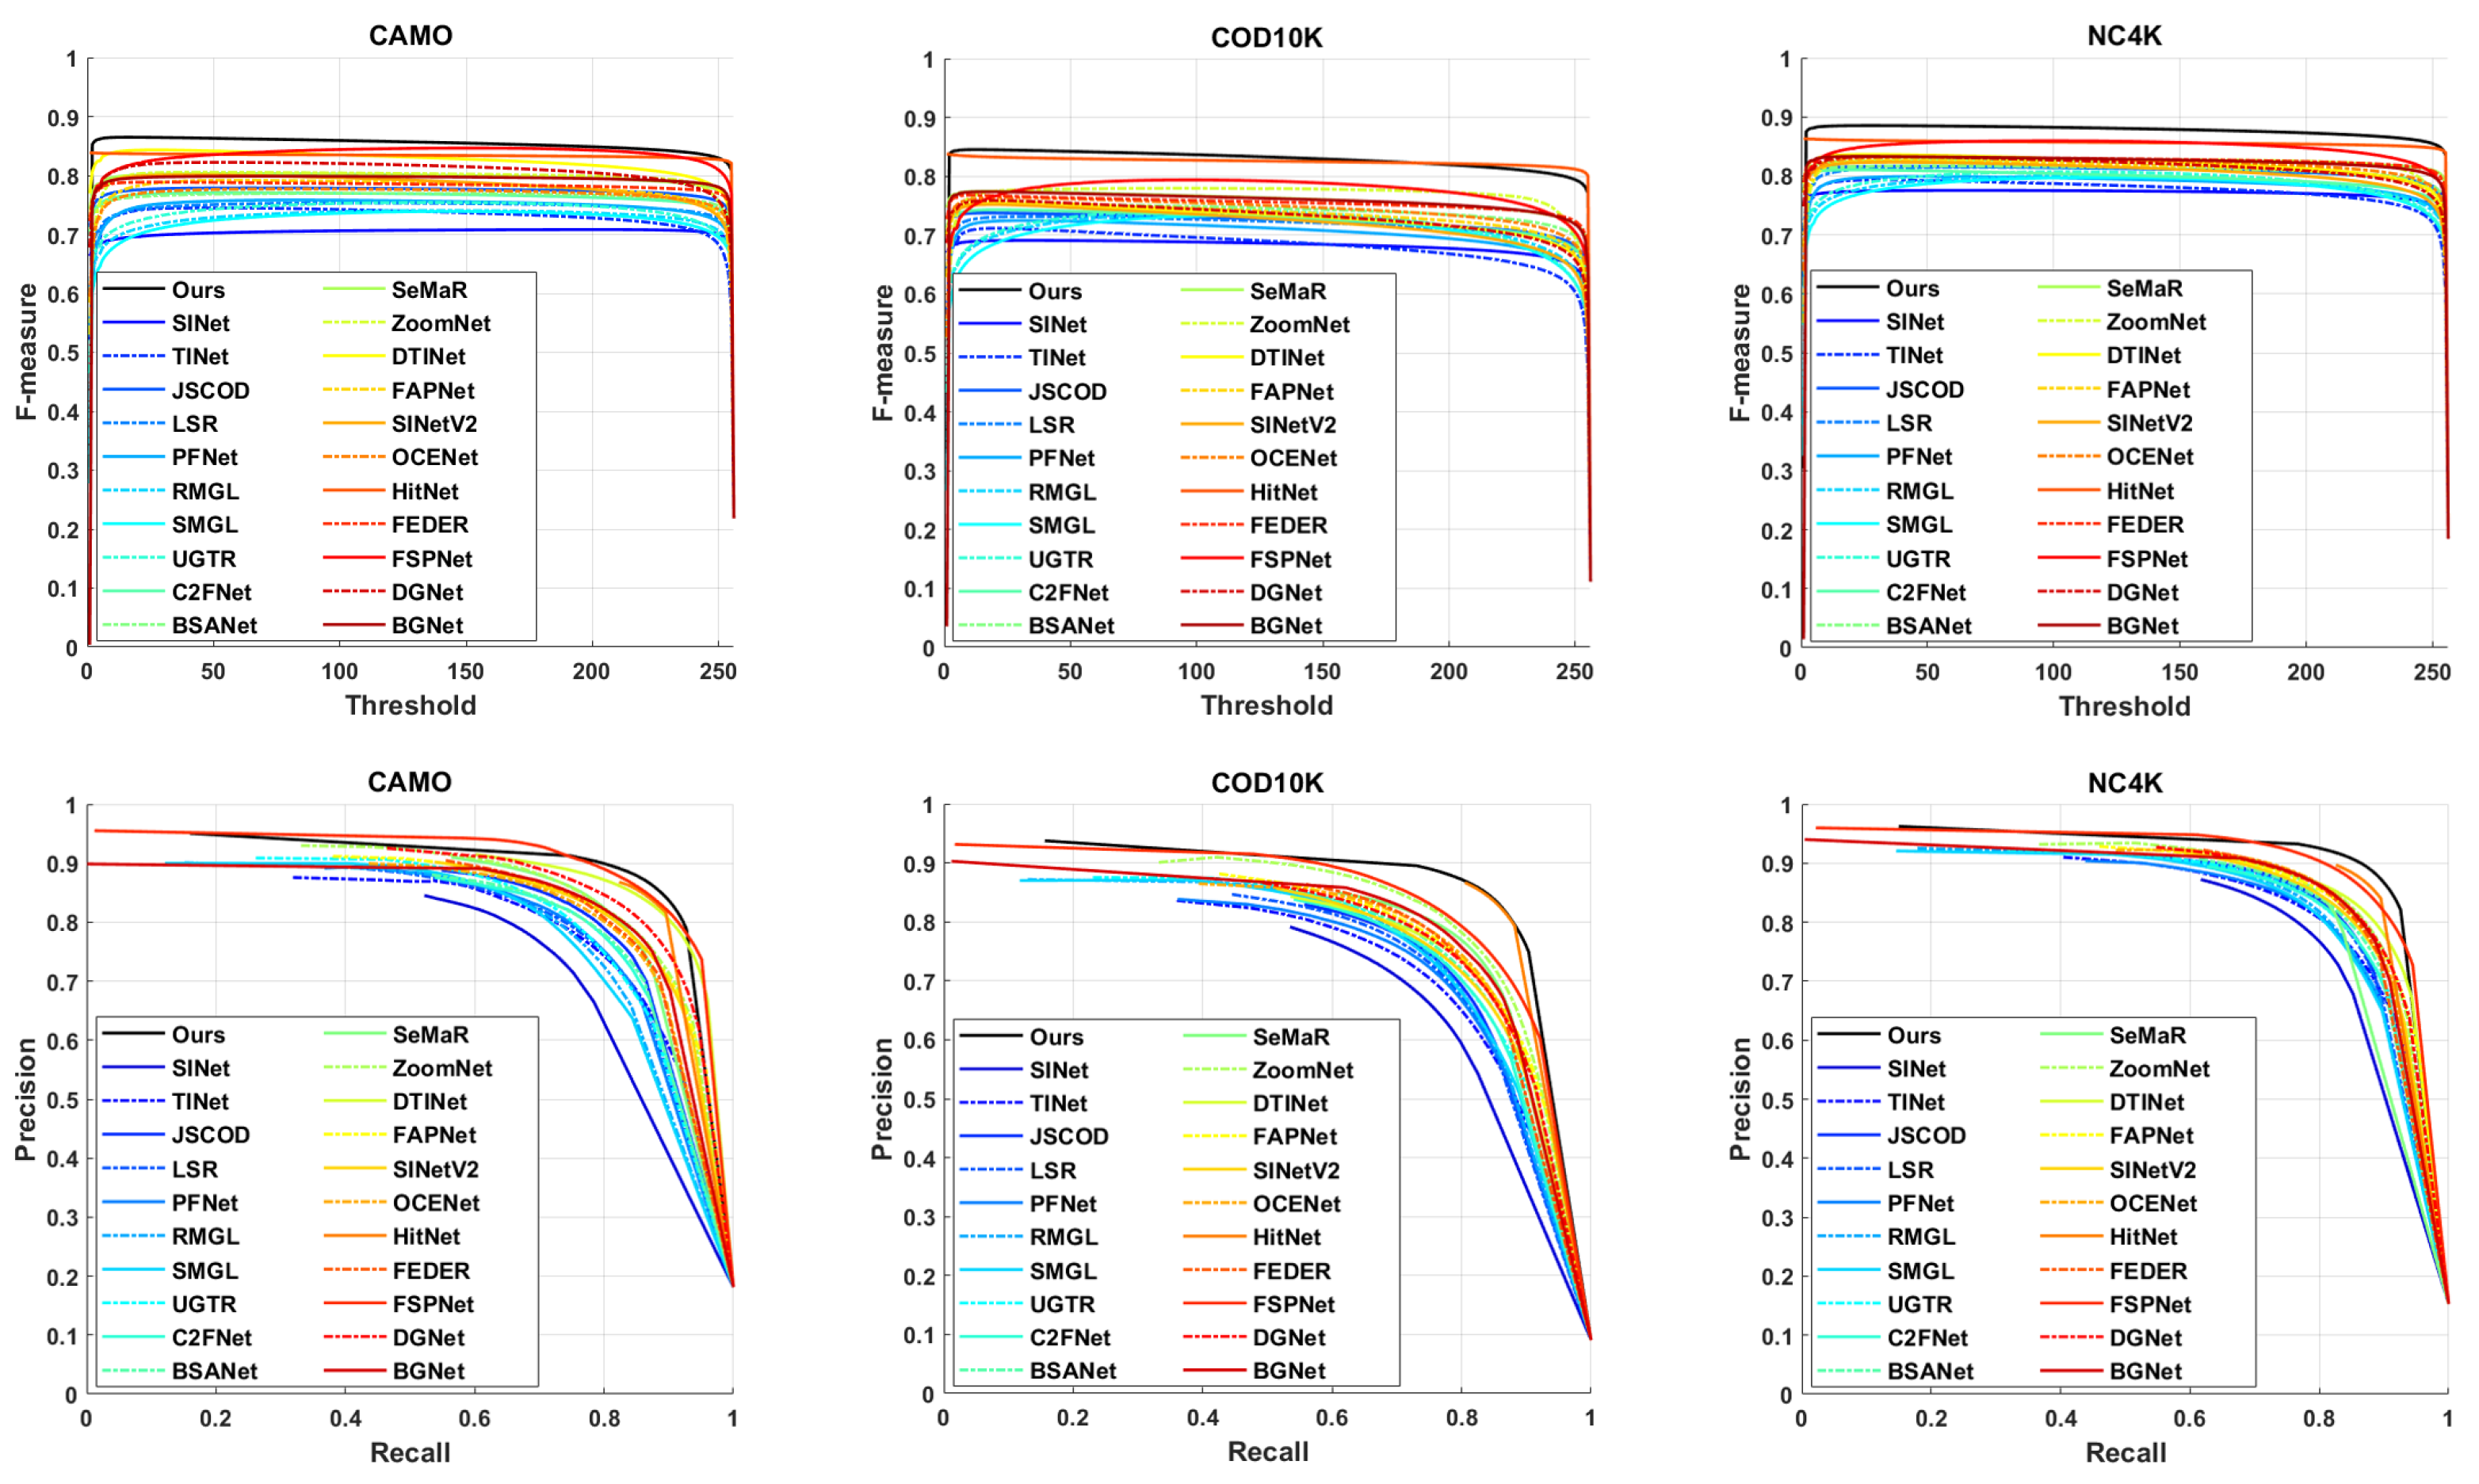
  • Extensive experimental evaluations demonstrate that our proposed CDNet outperforms 28 state-of-the-art methods on three widely adopted benchmark datasets, establishing its superior performance.
In Section 2, we introduce the related work, including the field of camouflaged object segmentation and the dual-branch architecture. In Section 3, we introduce the proposed model, including an overview of the model, a detailed introduction to each module, and the design of the loss function. In Section 4, we present the experiments, including a comparison of the proposed model with other competitors, ablation experiments of the model, extension applications, and discussion. In Section 5, we summarize the work in this paper and look forward to possible future research directions.

2. Related Work

2.1. Camouflaged Object Segmentation

The inconspicuousness of camouflaged objects can be attributed to their subtle distinctions from the surrounding background. Early works concerning camouflage primarily focused on discriminating between the foreground and background based on hand-crafted low-level features such as color [10], orientation [11], texture [12], 3D convexity [13], and motion boundaries [14]. In recent years, deep-learning-based methods for segmenting camouflaged objects have achieved promising results. For example, Fan et al. [15] devised SINet to emulate the progressive localization and exploration of camouflaged objects, drawing inspiration from the foraging behavior of wild predators. Pang et al. [27] replicated the zoom-in and zoom-out behavior exhibited by humans in the perception of blurred images and proposed a mixed-scale triplet network called ZoomNet. Considering the indistinct boundary characteristic of camouflage objects, Sun et al. [19] proposed BGNet, a novel approach aimed at investigating edge semantics associated with objects to guide the representation learning process in COS. Given the proficiency of transformers in capturing long-term dependencies, many transformer-based methods [23,24,25,26] are employed in COS. However, owing to the inherent limitations of CNN and Transformer architectures, the existing methods exhibit subpar performance in effectively extracting either global or local information, thereby resulting in incomplete segmentation of camouflaged objects. Additionally, the existing approaches neglect to incorporate the idea of curiosity from human cognitive processes in response to unknown areas and subsequent exploration.

2.2. Dual-Branch Architecture

The dual-branch architecture is prevalent in computer vision due to its ability to enhance model performance and accuracy through parallel processing of diverse data types [28], tasks [29], or feature extraction methods [30]. Considering the strengths of CNN in extracting local features and the proficiency of Transformer in capturing global features, we adopt a dual-branch architecture to simultaneously extract these complementary information, thereby acquiring comprehensive feature information. The primary challenge posed by a dual-branch architecture lies in effectively integrating the outputs of two independent branches to attain the desired outcomes. Existing methods for integrating information from distinct branches may inadvertently result in the loss or blurring of crucial feature information, thereby complicating the effective capture of correlation information between the two branches. To overcome this challenge, we innovatively integrated the idea of curiosity to complement local and global features from two branches, facilitating the effective integration of complementary features and providing comprehensive information for subsequent curiosity-driven refinement.

3. Methodology

3.1. Overview

Figure 2 illustrates the overall architecture of our proposed CDNet model. Given a single RGB image, we first feed it into the Dual-branch Feature Encoder (DFE) with a PVT [31] backbone and a ResNet-50 [32] backbone to, respectively, extract multi-level global features and multi-level local features which are further fed into convolution layers for channel reduction. Subsequently, the fusion bridge module (FBM) is specifically designed using the idea of curiosity to fuse each level’s local and global features, facilitating comprehensive integration of the extracted information. Finally, multiple curiosity-refinement modules (CRMs) are employed to progressively discover and reduce curiosity, refining the segmentation process and the precise identification of camouflaged objects.

3.2. Dual-Branch Feature Encoder

Diverging from prior approaches in COS, our dual-branch feature encoder (DFE) simultaneously processes images through both CNN and Transformer architectures, allowing for the extraction of global and local features, respectively. As shown in Figure 2, DFE mainly employs the CNN and Transformer feature encoders to extract features separately.
CNN Feature Encoder. Our CNN feature encoder adopts ResNet50 [32] as its backbone to extract the multi-level local context of camouflaged objects. Given an image I c of size W × H , the encoder generates a set of feature maps f i C i = 0 4 with the resolution of H 2 i + 1 × W 2 i + 1 .
Transformer Feature Encoder. Recent advancements in Vision Transformer (ViT) models have showcased promising results in various computer vision tasks. Therefore, we adopt PVT [31] as the Transformer backbone to extract the multi-level global context of camouflaged objects. Given an image I c of size W × H , the encoder first splits it into a sequence of non-overlapping image patches and then generates four feature maps f 1 T , f 2 T , f 3 T , f 4 T with the size of f i T is H 2 i + 1 × W 2 i + 1 , respectively.

3.3. Fusion Bridge Module

Fusion Bridge Module (FBM) endeavors to synergistically amalgamate local and global features extracted from CNN and Transformer in each layer. As shown in Figure 2, within the framework of FBMi, the feature f i C , extracted by CNN, is directed into the convolution-BN-Relu operation, followed by the extraction of its local features and global features through the local–global feature block (LGFB). The features extracted by the transformer also perform similar operations. Subsequently, the local and global features of both components are fused via the curiosity fusion block (CFB) to obtain the complete fused features. Notably, the CFB incorporates the concept of “curiosity”. During the model training process, it intelligently balances and optimizes the weights between the two branches, and the multi-scale features from the two branches complement each other. This dynamic adjustment not only ensures the algorithm’s sensitivity in capturing the subtle texture and edge information of the camouflaged object but also maintains the understanding of the overall structure of the objects, thereby promoting the effective fusion of features and segmenting the complete camouflaged objects.
Specifically, Figure 3a illustrates the detailed structure of the well-designed LGFB. LGFB includes local feature flow and global feature flow to extract local and global features, respectively. The local feature flow initiates by applying a convolution operation on the input feature and then feeds it into a four-branch pyramid convolution block whose convolution kernel is k j and the number of groups is G j . Ultimately, local features are obtained through a subsequent layer of convolutional processing. We set k j , j = 1 , 2 , 3 , 4 to 3 , 5 , 7 , 9 and set G j , j = 1 , 2 , 3 , 4 to 1 , 2 , 4 , 4 , respectively. Each convolution is accompanied by a batch normalization (BN) layer and a ReLU nonlinearity operation. The global feature flow initially employs the adaptive average pooling layer and then adopts upsampling after the operations similar to the local feature flow to extract global features.
The designed CFB facilitates feature fusion by integrating two distinct types of features, namely, local or global features derived from different encoders, and overall integration of local and global features based on the aforementioned features. The comprehensive depiction of CFB can be found in Figure 3b, and its input takes local features f i l , i = 1 , 2 , 3 , 4 and global features f i g , i = 1 , 2 , 3 , 4 as an example. We can calculate the curiosity weight ( c w ) and the fused features f i F , i = 1 , 2 , 3 , 4 in the following ways:
c w = S C o n v 1 f i l C o n v 1 f i g
f i F = C o n v 1 c w × f i g + ( 1 c w ) × f i l
where C o n v 1 · and S · denote the 1 × 1 convolution layer and sigmoid layer, respectively.
Finally, we can obtain the initial map of the objects by applying a 1 × 1 convolution on f 4 F . The f 4 F and the initial map would be refined progressively by the following curiosity-refinement modules.

3.4. Curiosity-Refinement Module

Given the resemblance between the camouflaged objects and their surrounding environment, the segmentation results often exhibit blurred regions. We noticed that humans are curious about ambiguous regions when observing camouflaged objects, and further analyze these regions to make a final decision. Inspired by this, we propose a curiosity-refinement module (CRM) to simulate human cognitive processes, gradually refining the initial segmentation by calculating the curiosity of each pixel in the initial segmentation result and reducing the curiosity. As shown in Figure 2, the concatenated feature map, consisting of the current-level feature ( f i F , i = 1 , 2 , 3 ) and the higher-level feature ( f i + 1 F , i = 1 , 2 , 3 ), along with the higher-level prediction, are fed into the CRM to identify and eliminate the curiosity region from foreground and background predictions, resulting in refined features and more accurate predictions.
The specific details of the CRMi are depicted in Figure 2. We upsample the higher-level prediction and normalize it with a sigmoid layer. Then we use this normalized map to calculate the curiosity. As commonly known, a pixel with a value of 1 represents the foreground, while a pixel with a value of 0 represents the background. Building upon this understanding, we hypothesize that pixels closer to a value of 0.5 exhibit higher curiosity. Consequently, We denote the prediction input map as P and its curiosity (C)-calculation operation is as follows:
C = 0.5 0.5 S U P
where U · and S · denote the upsampling layer and sigmoid layer, respectively. Given the input features f F R C × H × W , where C, H, W represent the channel number, height, and width, respectively. We first employ three 3 × 3 convolution layers on the feature map f F and reshape the convolution results to generate a new feature map query Q R C × N , and N = H × W is the number of pixels. Then the feature map f F is multiplied by the calculated curiosity C and passed through a 1 × 1 convolution layer. The resulting output is reshaped to obtain two new feature maps, key K R C × N , and value V R C × N , respectively. After that, we perform a matrix multiplication between the transpose of Q and K and apply softmax normalization to generate the attention map X R N × N :
x i j = e x p Q : i · K : j j N e x p Q : i · K : j
where Q : i denotes the ith column of matrix Q and x i j measures the jth position’s impact on the ith position. Meanwhile, we conduct a matrix multiplication between V and the transpose of X and reshape the result to R C × H × W . Following this, we use a skip connection and apply a 3 × 3 convolution layer to obtain the final output f F R C × H × W :
f F = C o n v 3 C a t j N V : j · x j i , f : i F
where C o n v 3 · and C a t · , · denote the 3 × 3 convolution layer layer and concatenation operation, respectively. Finally, feature f F undergoes a 1 × 1 convolution layer and is added to the high-level prediction map after upsampling. This process yields an additional output, referred to as the refined prediction map.

3.5. Loss Function

The binary cross-entropy ( L B C E ), although commonly employed in segmentation tasks, overlooks the global image structure by independently computing the loss for each pixel, thereby neglecting crucial contextual information. Inspired by [33], we employ the weighted BCE loss L b c e w and weighted IoU loss L i o u w to guide CDNet to discover and explore curiosity regions. Significantly, L i o u w assigns greater weights to pixels that exhibit higher difficulty levels, while L b c e w prioritizes challenging pixels instead of treating all pixels uniformly. Besides, as shown in Figure 2, we utilize multiple supervisions to guide the training process for the four side-output predictions ( P i , i 1 , 2 , 3 , 4 ) and the ground-truth mask (G). Finally, the overall loss is defined as follows:
L o v e r a l l = i = 1 4 2 i ( L b c e w ( P i , G ) + L i o u w ( P i , G ) )

4. Experiments

4.1. Experimental Setup

Datasets. We conduct experiments on three benchmark datasets for camouflaged object segmentation: CAMO [17], COD10K [15], and NC4K [16]. CAMO [17] comprises 1250 camouflaged and 1250 non-camouflaged images. COD10K [15] consists of 5066 camouflaged, 3000 background, and 1934 non-camouflaged images. NC4K [16] encompasses 4121 images sourced from the Internet. Conforming to the data partition strategy outlined in [15,16,21], we utilize all images containing camouflaged objects for our experimental evaluations. Specifically, our training set consists of 3040 images from COD10K and 1000 images from CAMO, while the remaining images are reserved for testing purposes.
Evaluation Metrics. To comprehensively compare our proposed method with other state-of-the-art methods, we employ five widely-used metrics to evaluate the COS performance. The details of each metric are provided as follows.
(1) PR Curve: PR curve is drawn with precision and recall as variables. Recall is the transverse coordinate and precision is the vertical coordinate. Specifically, given a saliency map S, we can convert it to a binary mask M, and then compute the precision and recall by comparing M with ground-truth G:
P r e c i s i o n = M G M , R e c a l l = M G G
Then, we adopt a popular strategy to partition the saliency map S using a set of thresholds (i.e., from 0 to 255). For each threshold, we first calculate a pair of recall and precision scores and then combine them to obtain a PR curve that describes the performance of the model at the different thresholds.
(2) Structure Measure ( S α ) [34]: It is proposed to assess the structural similarity between the regional perception ( S r ) and object perception ( S o ), which is defined by
S α = α × S o + ( 1 α ) × S r
where α 0 , 1 is a trade-off parameter and it is set to 0.5 as default.
(3) Enhanced-alignment Measure ( E ϕ ) [35]: It is used to capture image-level statistics and their local pixel matching information, which is defined by
E ϕ = 1 W × H i = 1 W j = 1 H ϕ ( S ( x , y ) , G ( x , y ) )
where W and H denote the width and height of ground-truth G, and ( x , y ) is the coordinate of each pixel in G. Symbol ϕ is the enhanced alignment matrix. This metric includes three values computed over all the thresholds, i.e., maximum ( E ϕ m x ), mean ( E ϕ m n ), and adaptive ( E ϕ a d ) values. In our experiments, we adopt the adaptive ( E ϕ a d ) values.
(4) F-measure ( F β ) [36]: It is used to comprehensively consider both precision and recall, and we can obtain the weighted harmonic mean by
F β = 1 + β 2 P r e c i s i o n × R e c a l l β 2 P r e c i s i o n + R e c a l l
where P r e c i s i o n and R e c a l l are defined by Formula (7). Recent studies [34,35] have suggested that the weighted F-measure ( F β w ) [36] can provide more reliable evaluation results than the traditional F β . Thus, we consider this metric in the comparison.
(5) Mean Absolute Error (M) [37]: It is used in foreground-background-segmentation tasks, which calculates the element-wise difference between the prediction map and the ground truth mask. It is defined by
M = 1 W × H i = 1 W j = 1 H S ( i , j ) G ( i , j )
where G and S denote the ground truth and normalized prediction (it is normalized to 0 , 1 ).
Implementation Details. We implement our network using the publicly available Pytorch toolbox [38]. A ten-core PC with an Intel Core i9-10900X 3.70 GHz CPU (with 32 GB memory) (Intel, Santa Clara, CA, USA) and an NVIDIA GeForce RTX 3090 GPU (with 24 GB memory) (Nvidia, Santa Clara, CA, USA) is used for both training and testing. During the training stage, input images are resized to a resolution of 416 × 416 and are augmented by randomly horizontal flipping. The batch size is set to 8 and the AdamW optimizer is adopted to optimize our network. The initial learning rate is set to 1 × 10⁻⁴. During the testing stage, the image is first resized to 416 × 416 for network inference, and then the output map is resized back to the original size of the input image. Both resizing processes use bilinear interpolation.

4.2. Comparison with State-of-the-Arts

To demonstrate the effectiveness of our CDNet, we compare it with 28 state-of-the-art methods, including CNN-based methods (i.e., SINet [15], C2FNet [20], TINet [39], JSCOD [40], PFNet [21], LSR [16], R-MGL [41], S-MGL [41], UGTR [42], NCHIT [43], ERRNet [44], TPRNet [45], FAPNet [46], BSANet [47], OCENet [48], PreyNet [49], SINetV2 [18], BGNet [19], SeMaR [50], FDNet [51], ZoomNet [27], DGNet-S [52], DGNet [52], and FEDER [22]) and Transformer-based methods (i.e., COS-T [23], DTINet [24], HitNet [25], and FSPNet [26]). To ensure a fair comparison, the prediction maps used in the evaluation of the above methods were either provided by the authors or generated by retraining the models using open-source code. Additionally, a consistent evaluation approach is applied to all prediction maps, ensuring a standardized comparison.
Quantitative Comparison. Table 1 presents a comprehensive summary of the quantitative results obtained by our proposed method when compared to 28 competing approaches. The evaluation was conducted on three challenging COS benchmark datasets, and the performance was measured using four evaluation metrics. It can be seen that the Transformer-based methods generally outperform the CNN-based methods. Furthermore, our proposed method consistently surpasses all other models on evaluated datasets. Compared to the recently proposed state-of-the-art HitNet [25], our method achieves average performance gains of 1.80 % , 1.43 % , 1.97 % , and 0.73 % on average in terms of S α , E ϕ a d , F β w and M on these three datasets, respectively. Compared to the recently proposed FSPNet [26], our method achieves average performance gains of 1.67 % , 2.97 % , 4.43 % , and 0.43 % , respectively. Besides, compared to the recently proposed CNN-based methods (i.e., FEDER [22] and DGNet [52]), our method shows significant performance improvements of 5.33 % , 4.00 % , 4.70 % , and 1.60 % over FEDER and 3.93 % , 3.43 % , 7.90 % , and 1.13 % over DGNet on average for S α , E ϕ a d , F β w and M, respectively. The superiority in performance benefits from the compensation of the effective fusion of local features from the CNN backbone and global features from the transformer backbone, and the smooth and curiosity-refinement module to accumulate more subtle clues of the camouflage objects. In addition to the comprehensive quantitative comparisons, we also provide PR curves and F-measure curves in Figure 4. The results undeniably demonstrate that our model surpasses other COS methods and attains the highest performance.
Qualitative Comparison. Figure 5 shows the segmentation results of our proposed method with ten representative COS competitors in challenging scenarios. The visual results presented in Figure 5 demonstrate that our method outperforms the competitors by effectively accurately segmenting camouflaged objects with higher precision and completeness. Specifically, in the 1st and 2nd rows, it can be observed that our method can completely segment large camouflaged objects while some methods fail to locate them. In the 3rd and 4th rows, it can be observed that our method can more precisely segment small camouflaged objects than other methods. In the 5th and 6th rows, the segmentation of multiple camouflaged objects presents a significant challenge. It can be observed that our method can effectively segment multiple camouflaged objects while other methods suffer from inaccurate segmentation results. In the 7th and 8th rows, it can be noticed that our method can completely segment occluded objects while some methods fail to segment them completely. In the 9th and 10th rows, the boundary between the object and the background is not sharp, which brings a serious challenge to identifying them from a similar background. In this case, our method still exhibits superior performance by accurately segmenting camouflaged objects with rich details. Overall, the results prove that our method can perform excellently in segmenting camouflaged objects under different challenging scenarios.

4.3. Ablation Study

In order to ascertain the efficacy of the proposed modules for COS, we carry out the following ablation studies on three COS benchmark datasets and report the results in Table 2. Specifically, we first provide the COS results using two backbones, i.e., ResNet50 [32] and Pyramid Vision Transformer [31] (denoted as “B1” and “B2”). For the CNN-backbone, i.e., B1, we remove all the additional modules (i.e., FBM and CRM), and only retain the CBR block in FBM to reduce the channels of the backbone features ( f i C , i = 1 , 2 , 3 , 4 ) and use the concatenation and 1 × 1 convolution operation to fuse the multi-level features in a top-down manner. For the transformer-backbone i.e., B2, we do the same operations for the backbone features ( f i T , i = 1 , 2 , 3 , 4 ).
Effectiveness of FBM. From Table 2, (c) uses FBM to fuse the results of method B1 and method B2. Compared with (a) and (b), (c) provides better performance. Specifically, compared with (a), (c) achieves obvious performance improvements on all datasets, with the performance gains of 8.10 % , 9.67 % , 11.76 % , and 2.03 % on average in terms of S α , E ϕ a d , F β w and M, respectively. Compared with (b), (c) achieves obvious performance improvements on all datasets, with the performance gains of 2.97 % , 3.70 % , 6.13 % , and 0.87 % on average in terms of S α , E ϕ a d , F β w and M, respectively. This confirms that the FBM can be beneficial for accurate camouflaged object segmentation.
Effectiveness of CRM. The key to CRM is our proposed curiosity operation, which continuously refines segmentation results, and ultimately achieves excellent results. From Table 2, compared with (a), (e) achieves obvious performance improvements on all datasets, with the performance gains of 4.10 % , 6.67 % , 5.10 % , and 0.80 % on average in terms of S α , E ϕ a d , F β w and M, respectively. Compared with (b), (f) achieves obvious performance improvements on all datasets, with the performance gains of 3.10 % , 3.47 % and 5.80 % , and 1.07 % on average in terms of S α , E ϕ a d , F β w and M, respectively. From the results of (d–i), it can be seen that the utilization of curiosity operations significantly enhances segmentation performance compared to scenarios where curiosity operations are not employed. Additionally, we visualize the heatmaps of intermediate results in CDNet in Figure 6. The columns from left to right represent the original image, the ground truth, and the outputs of FBM4, CRM3, CRM2, and CRM1, respectively. It is evident that with successive refinement iterations driven by curiosity, there is a significant reduction in curiosity. Specifically, as the curiosity-refinement operations progress, the model’s attention gradually shifts away from easily segmented areas, resulting in a reduction of curiosity toward these regions. Simultaneously, the model intensifies its focus on more challenging areas, characterized by higher curiosity, such as edges, occlusions, and intricate details. Through progressive curiosity-driven refinements, these areas are refined to diminish curiosity and ultimately attain outstanding results.
Overall, this corroborates that the CRM can effectively facilitate precise segmentation of camouflaged objects, with the proposed curiosity-driven operation playing a pivotal role.

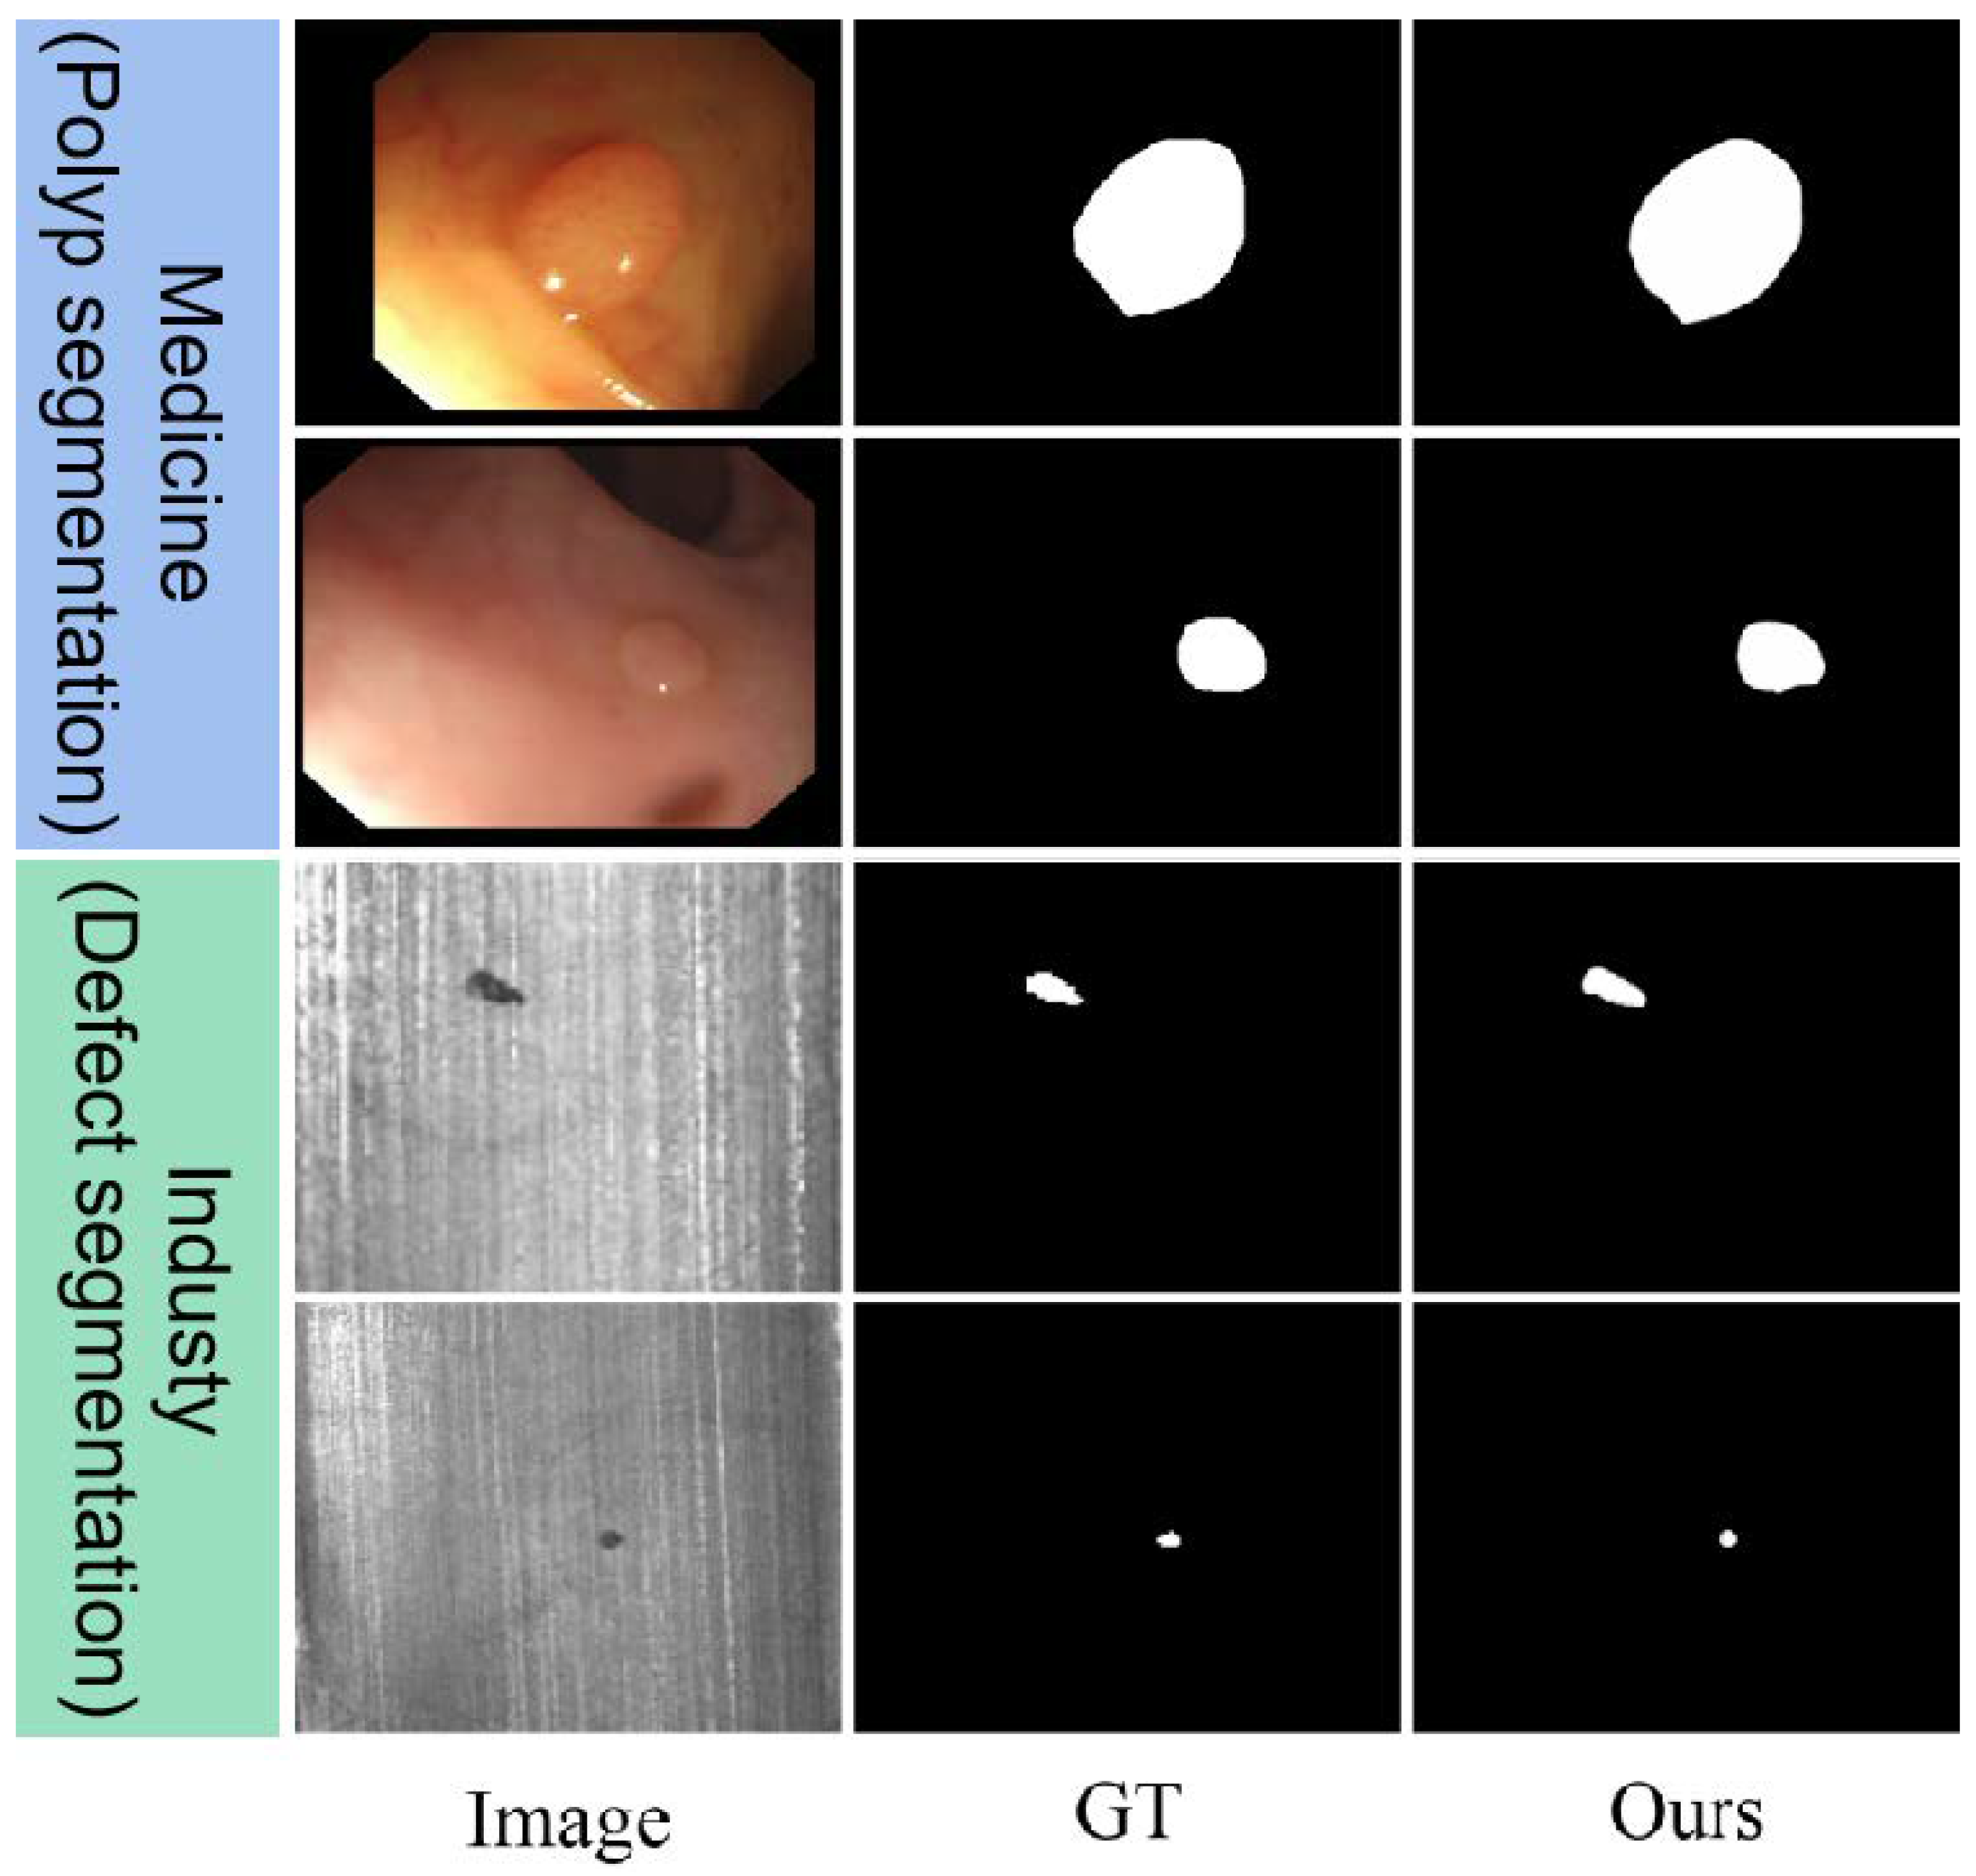
4.4. Extension Applications

In the medical field, automatic polyp segmentation is an essential step in modern polyp screening systems, which can help clinicians accurately locate polyp regions for further diagnosis or treatments. Similar to camouflaged object segmentation, polyp segmentation also faces several challenges, including (1) variations in the shape and size of polyps and (2) non-sharp boundary between a polyp and its surrounding mucosa [2,3,5]. In the industry field, industrial defects usually originate from the undesirable production process, e.g., mechanical impact, workpiece friction, chemical corrosion, and other unavoidable physical, whose external visual form is usually with unexpected patterns or outliers, e.g., surface scratches, spots, holes on industrial devices; color difference, indentation on fabric surface; impurities, breakage, stains on the material surface, etc [1,6]. Previous techniques work on the assumption that defects are easily detected, but they ignore those challenging defects that are “seamlessly” embedded in their materials’ surroundings. Therefore, to further validate the robustness of our CDNet, we extend it to the polyp-segmentation task and industrial defects segmentation.
From the quantitative comparison results in Table 3, it can see that our method is superior to other competitors on the datasets in the medical and industrial fields. Figure 7 presents a visualization of the results obtained by our model on downstream tasks. The 1st and 2nd rows showcase the outcomes of polyp segmentation, while the 3rd and 4th rows depict the results of industrial defect segmentation. Overall, quantitative and qualitative results provide compelling evidence of the success of our CDNet in addressing both the polyp segmentation and industrial defect-segmentation tasks, thus reinforcing the robustness and effectiveness of our method.

4.5. Discussion

Computational cost. Since the model integrates two backbone networks, its complexity is slightly higher than that of some models. As can be seen from Table 4, the number of parameters of our method is not optimal, slightly inferior to ZoomNet, but it is also within an acceptable range. What is more worth mentioning is that our model performs better than other models in the segmentation effect evaluation index and multiplication and accumulation operations (MACs), which further verifies the excellence of the model proposed in this paper.
The limitations of the benchmark datasets. The three benchmark datasets, CAMO [17], COD10K [15], and NC4K [16], are of great significance in the field of camouflaged target segmentation, but they also have limitations in terms of data volume and diversity, annotation quality, application scenario restrictions, and data balance. For example, these datasets mainly focus on naturally camouflaged and artificially camouflaged objects, and may not fully cover all application scenarios of camouflaged object segmentation, such as medical image segmentation. Therefore, to promote the further development of camouflaged target-segmentation technology, it is necessary to continuously explore and build larger, more diverse, and higher-quality datasets.

5. Conclusions

When humans observe camouflaged objects, they will repeatedly examine and analyze them to accurately identify them when faced with complex areas such as edge details that are highly similar to the background. Inspired by this human brain’s cognitive process, we propose a novel camouflaged object-segmentation network, the Curiosity-Driven network (CDNet), to simulate this process.
We first employ the dual-branch feature encoder to extract local and global features, respectively, by capitalizing the distinctive characteristics of CNN and Transformer backbones. Then, we propose the fusion bridge module to effectively fuse these features, providing effective feature information for subsequent refinement. Furthermore, we design the curiosity-refinement module to iteratively refine initial segmentation results by identifying and addressing curiosity of ambiguous areas, capturing valuable cues for precise and comprehensive segmentation. Extensive comparison experiments and ablation studies show that the proposed CDNet achieves superior performance over other state-of-the-art approaches on three COS benchmark datasets. Compared with the recently proposed state-of-the-art method, our model achieves average performance gains of 1.80 % on average for S α . Additionally, the application in downstream tasks also verifies the robustness and effectiveness of our proposed CDNet. Overall, all quantitative and qualitative results provide compelling evidence of the success of our CDNet. In the future, we plan to investigate model lightweight and explore the potential of our method for more real-world applications.

Author Contributions

Conceptualization, M.P., M.S. and Z.W.; methodology, M.P., M.S. and Z.W.; formal analysis, M.P.; investigation, M.P.; data curation, M.P.; writing—original draft preparation, M.P.; writing—review and editing, M.P., M.S. and Z.W.; visualization, M.P.; supervision, M.S. and Z.W.; funding acquisition, M.S. and Z.W. All authors have read and agreed to the published version of the manuscript.

Funding

This research was funded by the National Natural Science Foundation of China (CN) under grant Nos. [62076180] and [62376189].

Institutional Review Board Statement

Not applicable.

Informed Consent Statement

Not applicable.

Data Availability Statement

Publicly available datasets were analyzed in this study. The CAMO dataset can be found at https://drive.google.com/drive/folders/1h-OqZdwkuPhBvGcVAwmh0f1NGqlH_4B6, accessed on 27 August 2023, reference number [17]. The COD10K dataset can be found at https://drive.google.com/file/d/1pVq1rWXCwkMbEZpTt4-yUQ3NsnQd_DNY/view, accessed on 27 August 2023, reference number [15]. The NC4K dataset can be found at https://drive.google.com/file/d/1kzpX_U3gbgO9MuwZIWTuRVpiB7V6yrAQ/view, accessed on 27 August 2023, reference number [16].

Conflicts of Interest

The authors declare no conflicts of interest.

References

  1. Fan, D.P.; Ji, G.P.; Xu, P.; Cheng, M.M.; Sakaridis, C.; Van Gool, L. Advances in deep concealed scene understanding. Vis. Intell. 2023, 1, 16. [Google Scholar] [CrossRef]
  2. Peng, C.; Qian, Z.; Wang, K.; Zhang, L.; Luo, Q.; Bi, Z.; Zhang, W. MugenNet: A Novel Combined Convolution Neural Network and Transformer Network with Application in Colonic Polyp Image Segmentation. Sensors 2024, 24, 7473. [Google Scholar] [CrossRef]
  3. Tong, Y.; Chen, Z.; Zhou, Z.; Hu, Y.; Li, X.; Qiao, X. An Edge-Enhanced Network for Polyp Segmentation. Bioengineering 2024, 11, 959. [Google Scholar] [CrossRef]
  4. Tomar, N.K.; Jha, D.; Bagci, U.; Ali, S. TGANet: Text-guided attention for improved polyp segmentation. In Proceedings of the Medical Image Computing and Computer Assisted Intervention—MICCAI 2022: 25th International Conference, Singapore, 18–22 September 2022; Proceedings, Part III. Springer: Berlin/Heidelberg, Germany, 2022; pp. 151–160. [Google Scholar] [CrossRef]
  5. Fan, D.P.; Ji, G.P.; Zhou, T.; Chen, G.; Fu, H.; Shen, J.; Shao, L. Pranet: Parallel reverse attention network for polyp segmentation. In Proceedings of the Medical Image Computing and Computer Assisted Intervention—MICCAI 2020: 23rd International Conference, Lima, Peru, 4–8 October 2020; Proceedings, Part VI 23. Springer: Berlin/Heidelberg, Germany, 2020; pp. 263–273. [Google Scholar] [CrossRef]
  6. Qiu, J.; Shi, H.; Hu, Y.; Yu, Z. Enhancing Anomaly Detection Models for Industrial Applications through SVM-Based False Positive Classification. Appl. Sci. 2023, 13, 12655. [Google Scholar] [CrossRef]
  7. Sharma, M.; Lim, J.; Lee, H. The Amalgamation of the Object Detection and Semantic Segmentation for Steel Surface Defect Detection. Appl. Sci. 2022, 12, 6004. [Google Scholar] [CrossRef]
  8. Wu, W.; Deng, X.; Jiang, P.; Wan, S.; Guo, Y. Crossfuser: Multi-modal feature fusion for end-to-end autonomous driving under unseen weather conditions. IEEE Trans. Intell. Transp. Syst. 2023, 24, 14378–14392. [Google Scholar] [CrossRef]
  9. Feng, R.; Prabhakaran, B. Facilitating fashion camouflage art. In Proceedings of the 21st ACM International Conference on Multimedia, Barcelona, Spain, 21–25 October 2013; pp. 793–802. [Google Scholar] [CrossRef]
  10. Price, N.; Green, S.; Troscianko, J.; Tregenza, T.; Stevens, M. Background matching and disruptive coloration as habitat-specific strategies for camouflage. Sci. Rep. 2019, 9, 7840. [Google Scholar] [CrossRef]
  11. Pike, T.W. Quantifying camouflage and conspicuousness using visual salience. Methods Ecol. Evol. 2018, 9, 1883–1895. [Google Scholar] [CrossRef]
  12. Xue, F.; Cui, G.; Song, W. Camouflage texture evaluation using saliency map. In Proceedings of the Fifth International Conference on Internet Multimedia Computing and Service, Huangshan, China, 17–18 August 2013; pp. 93–96. [Google Scholar]
  13. Pan, Y.; Chen, Y.; Fu, Q.; Zhang, P.; Xu, X. Study on the camouflaged target detection method based on 3D convexity. Mod. Appl. Sci. 2011, 5, 152. [Google Scholar] [CrossRef]
  14. Yin, J.; Han, Y.; Hou, W.; Li, J. Detection of the mobile object with camouflage color under dynamic background based on optical flow. Procedia Eng. 2011, 15, 2201–2205. [Google Scholar]
  15. Fan, D.P.; Ji, G.P.; Sun, G.; Cheng, M.M.; Shen, J.; Shao, L. Camouflaged object detection. In Proceedings of the IEEE/CVF Conference on Computer Vision and Pattern Recognition, Seattle, WA, USA, 13–19 June 2020; pp. 2777–2787. [Google Scholar]
  16. Lv, Y.; Zhang, J.; Dai, Y.; Li, A.; Liu, B.; Barnes, N.; Fan, D.P. Simultaneously localize, segment and rank the camouflaged objects. In Proceedings of the IEEE/CVF Conference on Computer Vision and Pattern Recognition, Nashville, TN, USA, 20–25 June 2021; pp. 11591–11601. [Google Scholar]
  17. Le, T.N.; Nguyen, T.V.; Nie, Z.; Tran, M.T.; Sugimoto, A. Anabranch network for camouflaged object segmentation. Comput. Vis. Image Underst. 2019, 184, 45–56. [Google Scholar] [CrossRef]
  18. Fan, D.P.; Ji, G.P.; Cheng, M.M.; Shao, L. Concealed Object Detection. IEEE Trans. Pattern Anal. Mach. Intell. 2022, 44, 6024–6042. [Google Scholar] [CrossRef] [PubMed]
  19. Sun, Y.; Wang, S.; Chen, C.; Xiang, T.Z. Boundary-guided camouflaged object detection. arXiv 2022, arXiv:2207.00794. [Google Scholar]
  20. Chen, G.; Liu, S.J.; Sun, Y.J.; Ji, G.P.; Wu, Y.F.; Zhou, T. Camouflaged object detection via context-aware cross-level fusion. IEEE Trans. Circuits Syst. Video Technol. 2022, 32, 6981–6993. [Google Scholar] [CrossRef]
  21. Mei, H.; Ji, G.P.; Wei, Z.; Yang, X.; Wei, X.; Fan, D.P. Camouflaged object segmentation with distraction mining. In Proceedings of the IEEE/CVF Conference on Computer Vision and Pattern Recognition, Nashville, TN, USA, 20–25 June 2021; pp. 8772–8781. [Google Scholar]
  22. He, C.; Li, K.; Zhang, Y.; Tang, L.; Zhang, Y.; Guo, Z.; Li, X. Camouflaged object detection with feature decomposition and edge reconstruction. In Proceedings of the IEEE/CVF Conference on Computer Vision and Pattern Recognition, Vancouver, BC, Canada, 17–24 June 2023; pp. 22046–22055. [Google Scholar]
  23. Wang, H.; Wang, X.; Sun, F.; Song, Y. Camouflaged object segmentation with transformer. In Proceedings of the Cognitive Systems and Information Processing: 6th International Conference, ICCSIP 2021, Suzhou, China, 20–21 November 2021; Revised Selected Papers 6. Springer: Berlin/Heidelberg, Germany, 2022; pp. 225–237. [Google Scholar]
  24. Liu, Z.; Zhang, Z.; Tan, Y.; Wu, W. Boosting camouflaged object detection with dual-task interactive transformer. In Proceedings of the 2022 26th International Conference on Pattern Recognition (ICPR), Montreal, QC, Canada, 21–25 August 2022; pp. 140–146. [Google Scholar]
  25. Hu, X.; Wang, S.; Qin, X.; Dai, H.; Ren, W.; Tai, Y.; Wang, C.; Shao, L. High-resolution iterative feedback network for camouflaged object detection. arXiv 2022, arXiv:2203.11624. [Google Scholar] [CrossRef]
  26. Huang, Z.; Dai, H.; Xiang, T.Z.; Wang, S.; Chen, H.X.; Qin, J.; Xiong, H. Feature shrinkage pyramid for camouflaged object detection with transformers. In Proceedings of the IEEE/CVF Conference on Computer Vision and Pattern Recognition, Vancouver, BC, Canada, 17–24 June 2023; pp. 5557–5566. [Google Scholar]
  27. Pang, Y.; Zhao, X.; Xiang, T.Z.; Zhang, L.; Lu, H. Zoom in and out: A mixed-scale triplet network for camouflaged object detection. In Proceedings of the IEEE/CVF Conference on Computer Vision and Pattern Recognition, New Orleans, LA, USA, 18–24 June 2022; pp. 2160–2170. [Google Scholar]
  28. Zhao, Z.; Bai, H.; Zhang, J.; Zhang, Y.; Xu, S.; Lin, Z.; Timofte, R.; Van Gool, L. Cddfuse: Correlation-driven dual-branch feature decomposition for multi-modality image fusion. In Proceedings of the IEEE/CVF Conference on Computer Vision and Pattern Recognition, Vancouver, BC, Canada, 17–24 June 2023; pp. 5906–5916. [Google Scholar]
  29. Yu, C.; Gao, C.; Wang, J.; Yu, G.; Shen, C.; Sang, N. Bisenet v2: Bilateral network with guided aggregation for real-time semantic segmentation. Int. J. Comput. Vis. 2021, 129, 3051–3068. [Google Scholar] [CrossRef]
  30. Zhou, B.; Cui, Q.; Wei, X.S.; Chen, Z.M. Bbn: Bilateral-branch network with cumulative learning for long-tailed visual recognition. In Proceedings of the IEEE/CVF Conference on Computer Vision and Pattern Recognition, Seattle, WA, USA, 13–19 June 2020; pp. 9719–9728. [Google Scholar]
  31. Wang, W.; Xie, E.; Li, X.; Fan, D.P.; Song, K.; Liang, D.; Lu, T.; Luo, P.; Shao, L. Pyramid vision transformer: A versatile backbone for dense prediction without convolutions. In Proceedings of the IEEE/CVF International Conference on Computer Vision, Montreal, BC, Canada, 11–17 October 2021; pp. 568–578. [Google Scholar]
  32. He, K.; Zhang, X.; Ren, S.; Sun, J. Deep residual learning for image recognition. In Proceedings of the IEEE Conference on Computer Vision and Pattern Recognition, Las Vegas, NV, USA, 27–30 June 2016; pp. 770–778. [Google Scholar]
  33. Wei, J.; Wang, S.; Huang, Q. F3Net: Fusion, feedback and focus for salient object detection. In Proceedings of the AAAI Conference on Artificial Intelligence, New York, NY, USA, 7–12 February 2020; Volume 34, pp. 12321–12328. [Google Scholar]
  34. Fan, D.P.; Cheng, M.M.; Liu, Y.; Li, T.; Borji, A. Structure-measure: A new way to evaluate foreground maps. In Proceedings of the IEEE International Conference on Computer Vision, Venice, Italy, 22–29 October 2017; pp. 4548–4557. [Google Scholar]
  35. Fan, D.P.; Ji, G.P.; Qin, X.; Cheng, M.M. Cognitive vision inspired object segmentation metric and loss function. Sci. Sin. Inf. 2021, 6, 5. [Google Scholar]
  36. Margolin, R.; Zelnik-Manor, L.; Tal, A. How to evaluate foreground maps? In Proceedings of the IEEE Conference on Computer Vision and Pattern Recognition, Columbus, OH, USA, 23–28 June 2014; pp. 248–255. [Google Scholar]
  37. Perazzi, F.; Krähenbühl, P.; Pritch, Y.; Hornung, A. Saliency filters: Contrast based filtering for salient region detection. In Proceedings of the 2012 IEEE Conference on Computer Vision and Pattern Recognition, Providence, RI, USA, 16–21 June 2012; pp. 733–740. [Google Scholar]
  38. Su, J.; Li, J.; Zhang, Y.; Xia, C.; Tian, Y. Selectivity or invariance: Boundary-aware salient object detection. In Proceedings of the IEEE/CVF International Conference on Computer Vision, Seoul, Republic of Korea, 27 October–2 November 2019; pp. 3799–3808. [Google Scholar]
  39. Zhu, J.; Zhang, X.; Zhang, S.; Liu, J. Inferring camouflaged objects by texture-aware interactive guidance network. In Proceedings of the AAAI Conference on Artificial Intelligence, Virtual, 2–9 February 2021; Volume 35, pp. 3599–3607. [Google Scholar]
  40. Li, A.; Zhang, J.; Lv, Y.; Liu, B.; Zhang, T.; Dai, Y. Uncertainty-aware joint salient object and camouflaged object detection. In Proceedings of the IEEE/CVF Conference on Computer Vision and Pattern Recognition, Nashville, TN, USA, 20–25 June 2021; pp. 10071–10081. [Google Scholar]
  41. Zhai, Q.; Li, X.; Yang, F.; Chen, C.; Cheng, H.; Fan, D.P. Mutual graph learning for camouflaged object detection. In Proceedings of the IEEE/CVF Conference on Computer Vision and Pattern Recognition, Nashville, TN, USA, 20–25 June 2021; pp. 12997–13007. [Google Scholar]
  42. Yang, F.; Zhai, Q.; Li, X.; Huang, R.; Luo, A.; Cheng, H.; Fan, D.P. Uncertainty-guided transformer reasoning for camouflaged object detection. In Proceedings of the IEEE/CVF International Conference on Computer Vision, Montreal, BC, Canada, 11–17 October 2021; pp. 4146–4155. [Google Scholar]
  43. Zhang, C.; Wang, K.; Bi, H.; Liu, Z.; Yang, L. Camouflaged object detection via neighbor connection and hierarchical information transfer. Comput. Vis. Image Underst. 2022, 221, 103450. [Google Scholar] [CrossRef]
  44. Ji, G.P.; Zhu, L.; Zhuge, M.; Fu, K. Fast camouflaged object detection via edge-based reversible re-calibration network. Pattern Recognit. 2022, 123, 108414. [Google Scholar] [CrossRef]
  45. Zhang, Q.; Ge, Y.; Zhang, C.; Bi, H. TPRNet: Camouflaged object detection via transformer-induced progressive refinement network. Vis. Comput. 2022, 39, 4593–4607. [Google Scholar] [CrossRef]
  46. Zhou, T.; Zhou, Y.; Gong, C.; Yang, J.; Zhang, Y. Feature Aggregation and Propagation Network for Camouflaged Object Detection. IEEE Trans. Image Process. 2022, 31, 7036–7047. [Google Scholar] [CrossRef] [PubMed]
  47. Zhu, H.; Li, P.; Xie, H.; Yan, X.; Liang, D.; Chen, D.; Wei, M.; Qin, J. I can find you! Boundary-guided separated attention network for camouflaged object detection. In Proceedings of the AAAI Conference on Artificial Intelligence, Pomona, CA, USA, 24–28 October 2022; Volume 36, pp. 3608–3616. [Google Scholar]
  48. Liu, J.; Zhang, J.; Barnes, N. Modeling aleatoric uncertainty for camouflaged object detection. In Proceedings of the IEEE/CVF Winter Conference on Applications of Computer Vision, Waikoloa, HI, USA, 3–8 January 2022; pp. 1445–1454. [Google Scholar]
  49. Zhang, M.; Xu, S.; Piao, Y.; Shi, D.; Lin, S.; Lu, H. Preynet: Preying on camouflaged objects. In Proceedings of the 30th ACM International Conference on Multimedia, Lisboa, Portugal, 10–14 October 2022; pp. 5323–5332. [Google Scholar]
  50. Jia, Q.; Yao, S.; Liu, Y.; Fan, X.; Liu, R.; Luo, Z. Segment, magnify and reiterate: Detecting camouflaged objects the hard way. In Proceedings of the IEEE/CVF Conference on Computer Vision and Pattern Recognition, New Orleans, LA, USA, 18–24 June 2022; pp. 4713–4722. [Google Scholar]
  51. Zhong, Y.; Li, B.; Tang, L.; Kuang, S.; Wu, S.; Ding, S. Detecting camouflaged object in frequency domain. In Proceedings of the IEEE/CVF Conference on Computer Vision and Pattern Recognition, New Orleans, LA, USA, 18–24 June 2022; pp. 4504–4513. [Google Scholar]
  52. Ji, G.P.; Fan, D.P.; Chou, Y.C.; Dai, D.; Liniger, A.; Van Gool, L. Deep gradient learning for efficient camouflaged object detection. Mach. Intell. Res. 2023, 20, 92–108. [Google Scholar] [CrossRef]
Figure 1. Visual comparison of COS in different challenging scenarios, including large objects, small objects, multiple objects, occluded objects, and objects with background matching (from top to bottom in the figure). The local heatmap is placed in the bottom right corner. Compared with the recently proposed CNN-based method FEDER [22] and Transformer-based HitNet [25], our method provides superior performance with more accurate object localization and more complete object segmentation, mainly due to the proposed fusion bridge module and curiosity-refinement module.
Applsci 15 00173 g001
Figure 2. The overall architecture of the proposed CDNet, consists of three key components, i.e., dual-branch feature encoder (DFE), fusion bridge module (FBM), and curiosity-refinement module (CRM).
Applsci 15 00173 g002
Figure 3. The detailed architecture of local–global feature block (LGFB) and curiosity fusion block (CFB) in fusion bridge module (FBM).
Applsci 15 00173 g003
Figure 4. F-measure (top) and Precision-recall (bottom) curves on the three camouflaged object datasets.
Applsci 15 00173 g004
Figure 5. Visual comparison of the proposed model with state-of-the-art methods in several challenging scenarios, including large objects, small objects, multiple objects, occluded objects, and objects with background matching. Please zoom in for details.
Applsci 15 00173 g005
Figure 6. Visualization of intermediate results in our CDNet in several challenging scenarios, including large objects, small objects, multiple objects, occluded objects, and objects with background matching.
Applsci 15 00173 g006
Figure 7. Extension applications. The Visualization results in medicine (1st and 2nd rows) and industry (3rd and 4th rows).
Applsci 15 00173 g007
Table 1. Quantitative comparison of our method with 28 state-of-the-art methods on three benchmark datasets. The best three scores are highlighted in red, green, and blue, respectively, with ↑/↓ indicating that higher/lower scores are better.
MethodsCAMO-Test{250 Images}COD10K-Test{2026 Images}NC4K{4121 Images}
S α E ϕ ad F β w M S α E ϕ ad F β w M S α E ϕ ad F β w M
CNN-Based Method
SINet0.7510.7710.6060.1000.7710.8060.5510.0510.8080.8710.7690.058
C2FNet0.7960.8650.7190.0800.8130.8860.6860.0360.8380.9010.7620.049
TINet0.7810.8470.6780.0870.7930.8480.6350.0420.8290.8820.7340.055
JSCOD0.8000.8720.7280.0730.8090.8820.6840.0350.8420.9060.7710.047
PFNet0.7820.8520.6950.0850.8000.8680.6600.0400.8290.8870.7450.053
LSR0.7930.8260.7250.0850.7930.8680.6580.0410.8390.8830.7790.053
R-MGL0.7750.8480.6730.0880.8140.8650.6660.0350.8330.8900.7400.052
S-MGL0.7720.8500.6640.0890.8110.8510.6550.0370.8290.8850.7310.055
UGTR0.7850.8590.6860.0860.8180.8500.6670.0350.8390.8860.7460.052
NCHIT0.7840.8410.6520.0880.7920.7940.5910.0460.8300.8720.7100.058
ERRNet0.7790.8550.6790.0850.7860.8450.6300.0430.8270.8920.7370.054
TPRNet0.8140.8700.7810.0760.8290.8920.7250.0340.8540.9030.7900.047
FAPNet0.8150.8770.7340.0760.8220.8750.6940.0360.8510.9030.7750.047
BSANet0.7940.8660.7170.0790.8180.8940.6990.0340.8410.9060.7710.048
OCENet0.8070.7670.8660.0750.8320.7450.8900.0320.8570.8170.8990.044
PreyNet0.7900.8560.7080.0770.8130.8940.6970.0340.8340.8990.7630.050
SINetV20.8200.8820.7430.0700.8150.8870.6800.0370.8470.9030.7690.048
BGNet0.8120.8700.7490.0730.8310.9010.7220.0330.8510.9070.7880.044
SeMaR0.8150.8810.7530.0710.8330.8930.7240.0340.8410.9050.7810.046
FDNet0.8410.9010.7750.0630.8400.9060.7290.0300.8340.8950.7500.052
ZoomNet0.8200.8830.7520.0660.8380.8930.7290.0290.8530.9070.7840.043
DGNet-S0.8260.8960.7540.0630.8100.8690.6720.0360.8450.9020.7640.047
DGNet0.8390.9060.7690.0570.8220.8790.6930.0330.8570.9100.7840.042
FEDER0.8070.8730.7850.0690.8230.9000.7400.0320.8460.9050.8170.045
Transformer-Based Method
COS-T0.8130.8960.7760.0600.7900.9010.6930.0350.8250.8810.7300.055
DTINet0.8570.9120.7960.0500.8240.8930.6950.0340.8630.9150.7920.041
HitNet0.8440.9020.8010.0570.8680.9320.7980.0240.8700.9210.8250.039
FSPNet0.8560.8990.7990.0500.8510.8950.7350.0260.8790.9150.8160.035
Ours0.8700.9240.8280.0470.8790.9380.8060.0210.8930.9400.8540.030
Table 2. Quantitative evaluation for ablation studies on three datasets. ↑/↓ indicating that higher/lower scores are better. The best results are highlighted in Bold. “B1” is the CNN backbone, “B2” is the Transformer backbone, and “ w / o C” means not use the curiosity operations in CRM.
ModelMethodCAMO-Test{250 Images}COD10K-Test{2026 Images}NC4K{4121 Images}
S α E ϕ ad F β w M S α E ϕ ad F β w M S α E ϕ ad F β w M
(a)B10.7840.8020.7010.0690.7930.8080.6510.0480.8010.8730.7580.052
(b)B20.8320.8870.7840.0570.8470.8740.7160.0350.8530.9010.7790.042
(c)B1+B2+FBM0.8650.9170.8220.0520.8710.9270.7930.0240.8850.9290.8480.032
(d)B1+CRM w / o C0.8310.8870.7690.0600.8110.8690.7180.0410.8410.9020.7840.049
(e)B1+CRM0.8360.8910.7510.0580.8180.8840.7240.0390.8470.9080.7880.048
(f)B2+CRM w / o C0.8610.9110.8150.0540.8650.9170.7850.0300.8830.9210.8390.035
(g)B2+CRM0.8650.9160.8190.0520.8690.9210.7890.0230.8910.9290.8450.031
(h)B1+B2+FBM+CRM w / o C0.8670.9210.8240.0480.8740.9310.7990.0220.8870.9320.8480.031
(i)Ours0.8690.9240.8260.0470.8760.9360.8060.0210.8910.9380.8510.030
Table 3. Quantitative comparison of our method with the state-of-the-art methods on the extension applications. ↑/↓ indicating that higher/lower scores are better.
MethodsMedicine{CVC-300 Dataset}Industry{CDS2K Dataset}
S α E ϕ ad F β w M S α E ϕ ad F β w M
DGNet0.8270.8520.7060.0350.8220.8510.7310.028
FEDER0.8350.8630.7190.0340.8280.8630.7400.028
HitNet0.8440.8690.7240.0320.8490.8930.7590.026
FSPNet0.8410.8660.7260.0320.8470.8820.7550.026
Ours0.8460.8730.7390.0340.8510.8950.7630.025
Table 4. The Computational efficiency comparison of our method with the state-of-the-art methods on the COD10K dataset. ↑/↓ indicating that higher/lower scores are better.
MethodsMACsPara.COD10K-Test{2026 Images}
S α E ϕ ad F β w M
BGNet58.45 G79.85 M0.8310.9010.7220.033
ZoomNet95.5 G23.38 M0.8380.8930.7290.029
DTINet144.68 G266.33 M0.8240.8930.6950.034
HitNet55.95 G25.73 M0.8680.9320.7980.024
PopNet154.88 G188.05 M0.8510.910.7570.028
Ours38.36 G59.34 M0.8780.9380.8060.021
Disclaimer/Publisher’s Note: The statements, opinions and data contained in all publications are solely those of the individual author(s) and contributor(s) and not of MDPI and/or the editor(s). MDPI and/or the editor(s) disclaim responsibility for any injury to people or property resulting from any ideas, methods, instructions or products referred to in the content.

