Exploiting Extrinsic Information for Serial MAP Detection by Utilizing Estimator in Holographic Data Storage Systems


Abstract
1. Introduction
- -
- Proposed the method to convert the estimated interference into extrinsic information.
- -
- Found out the optimized value of (the ratio of extracting the interference into extrinsic information).
- -
- Analyzed and explained the combination of the interference estimator and the serial MAP detection.
- -
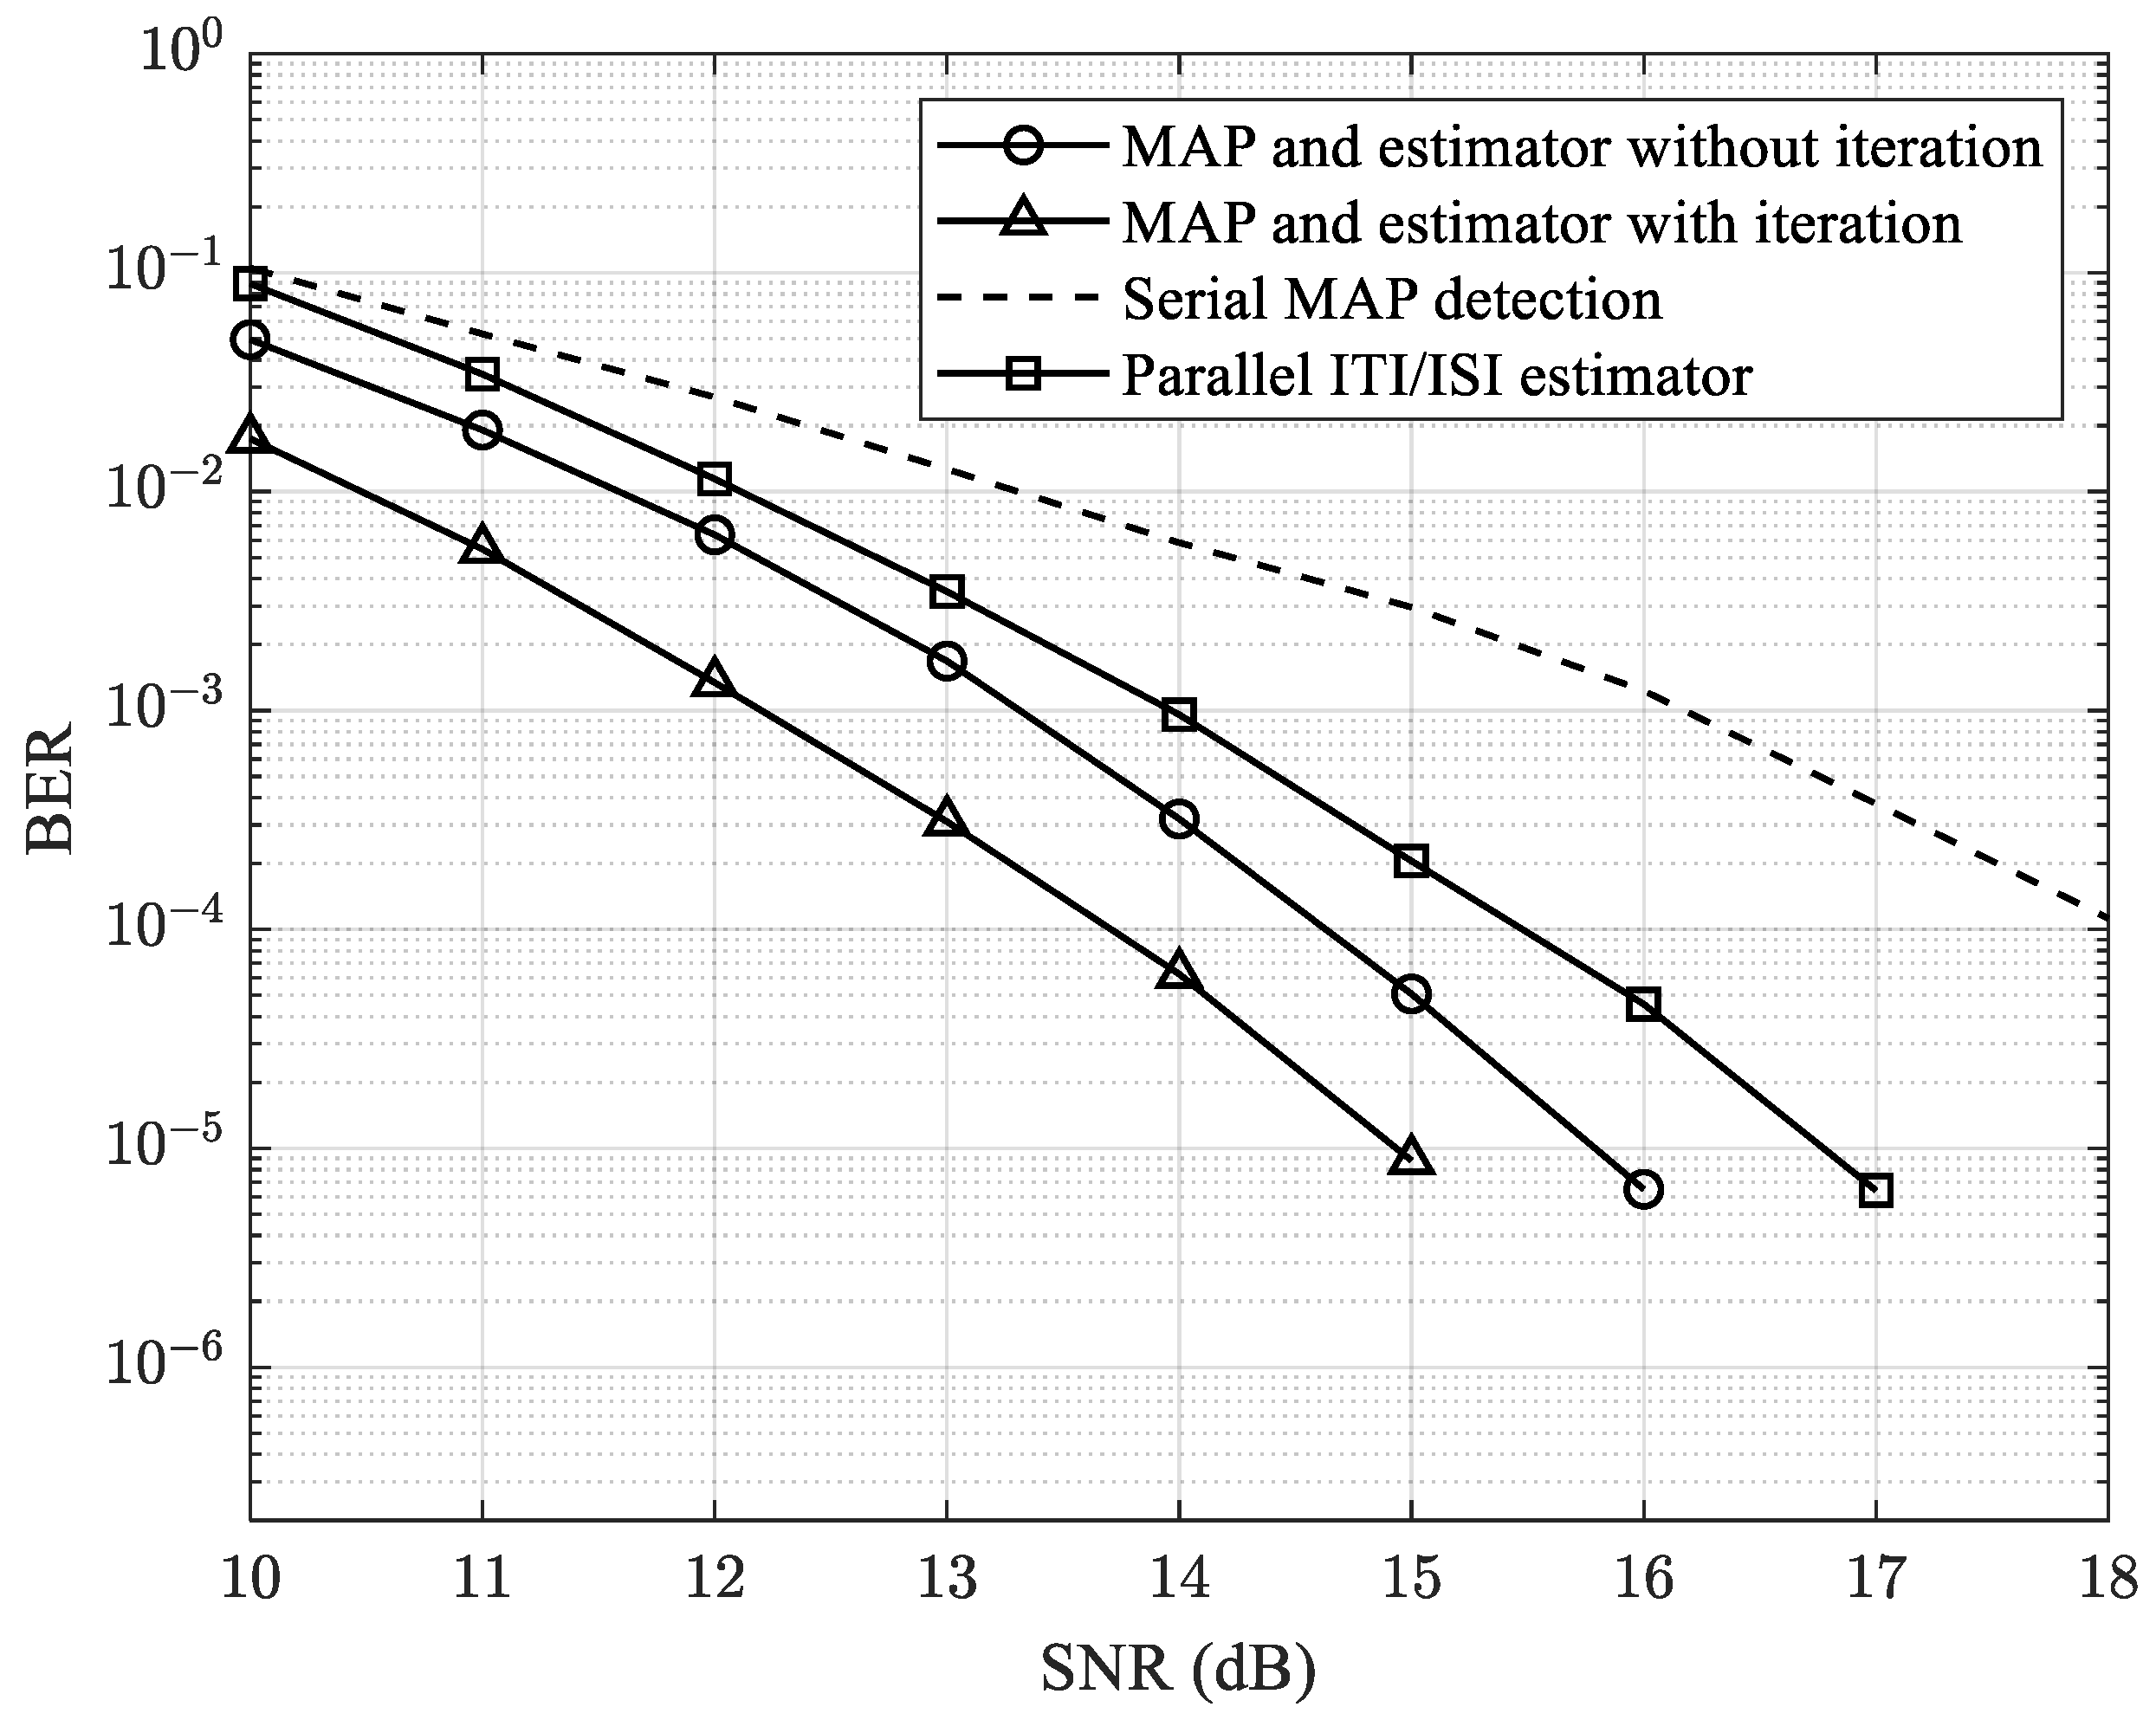
- Presented comprehensive simulation results to validate the effectiveness of the proposed model. The results demonstrate significant improvements in BER performance compared to existing approaches, confirming the robustness of our method.
2. Background
2.1. Generalized Partial Response (GPR) Target and Equalizer
2.2. Interference Estimator
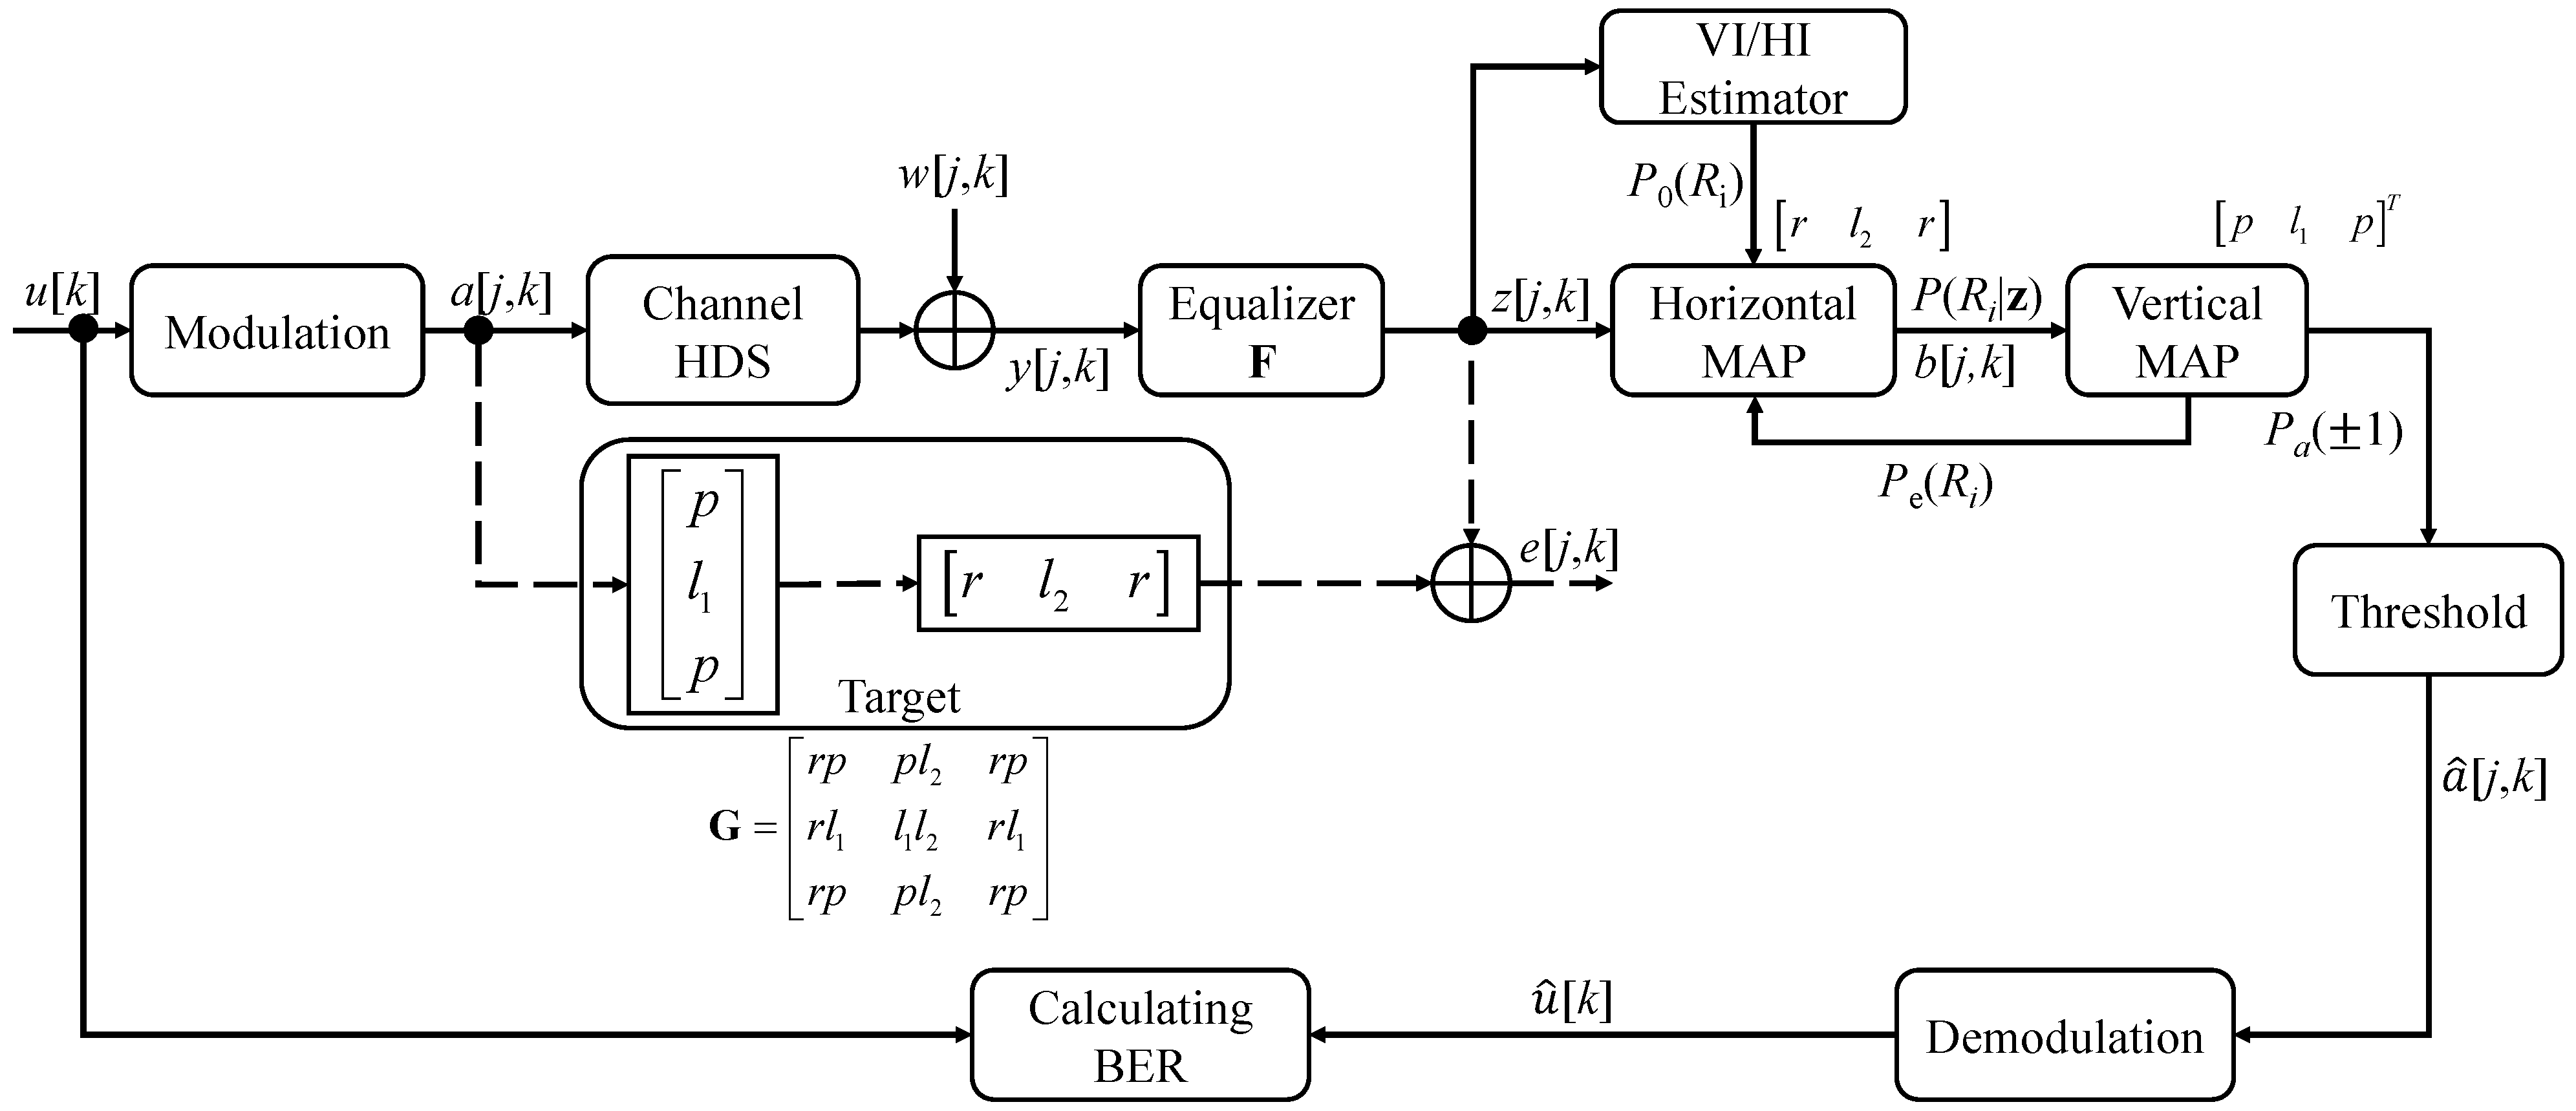
3. Proposed Model
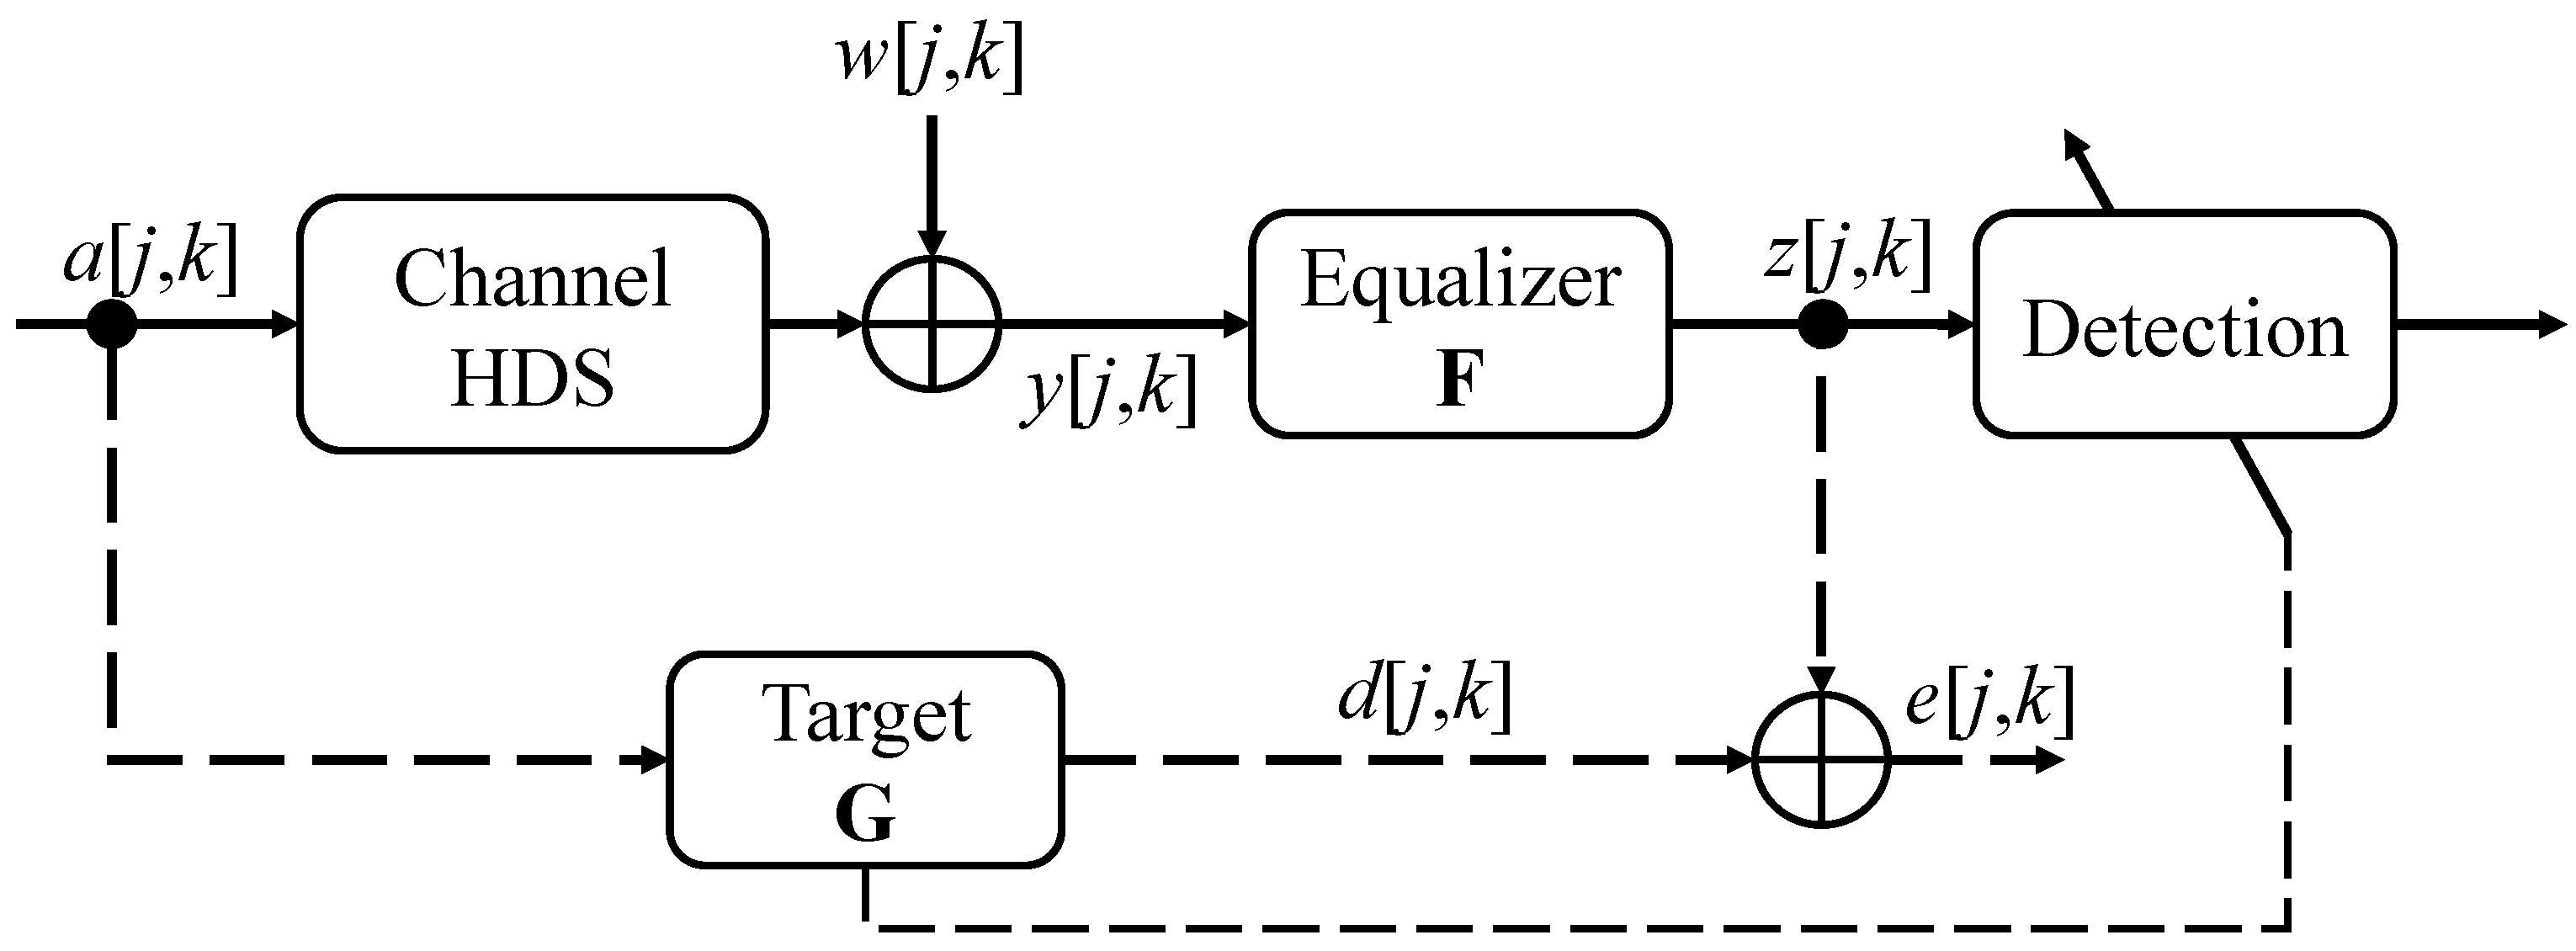
3.1. HDS Channel
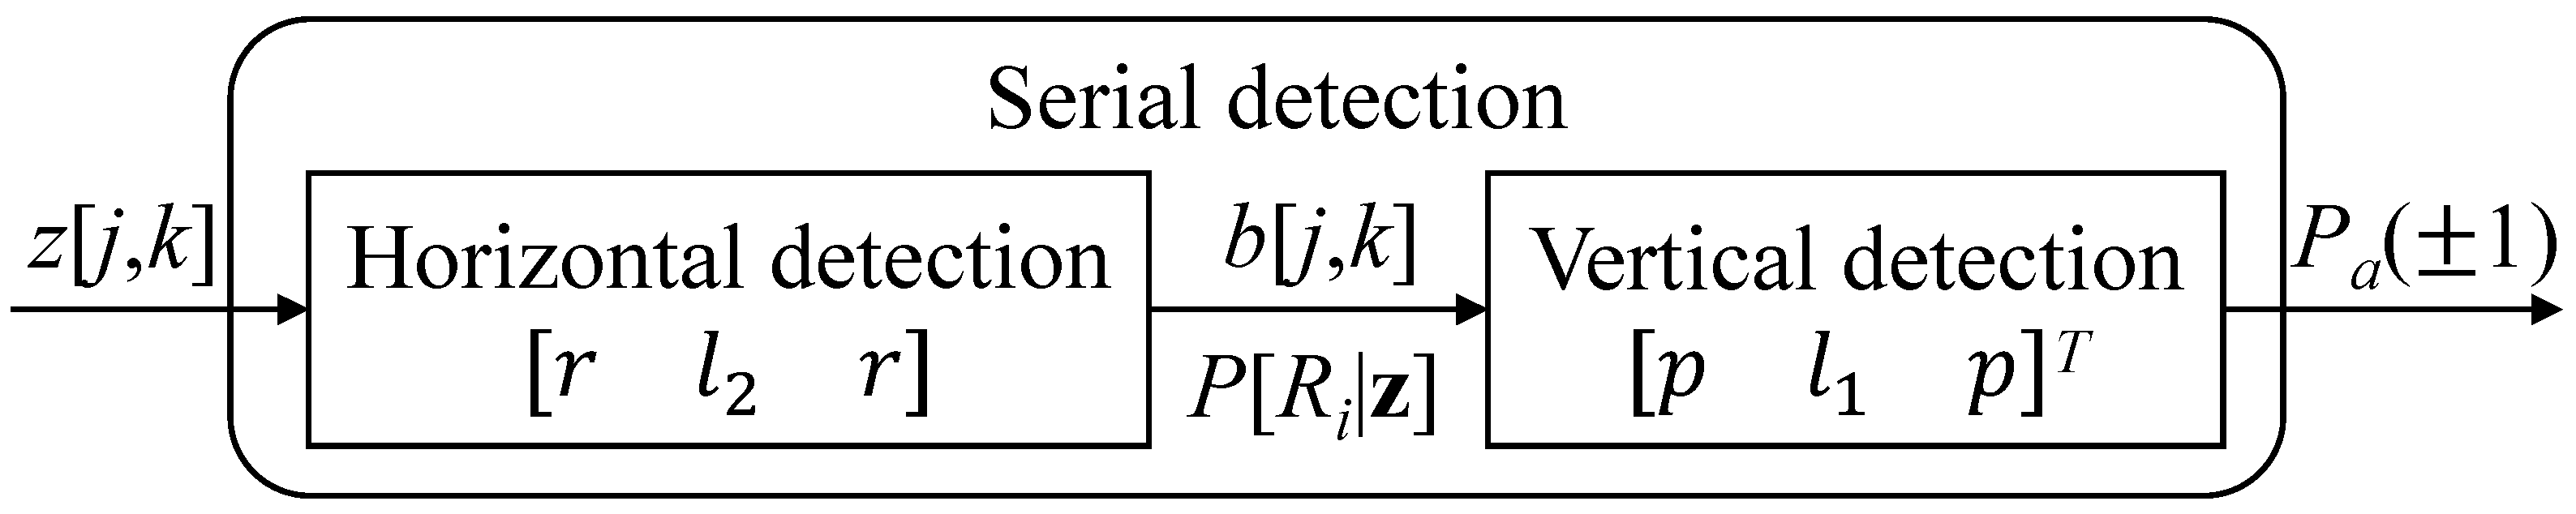
3.2. Serial MAP Detection
- Horizontal detection
- Vertical detection
3.3. Extracting the Extrinsic Information for Serial MAP Detection
4. Results and Discussions
5. Conclusions
Author Contributions
Funding
Institutional Review Board Statement
Informed Consent Statement
Data Availability Statement
Conflicts of Interest
References
- Le, H.-D.; Park, M. Enhancing multi-class attack detection in graph neural network through feature rearrangement. Electronics 2024, 13, 2404. [Google Scholar] [CrossRef]
- Tran, D.-H.; Park, M. FN-GNN: A novel graph embedding approach for enhancing graph neural networks in network intrusion detection systems. Appl. Sci. 2024, 14, 6932. [Google Scholar] [CrossRef]
- Nguyen-Vu, L.; Doan, T.-P.; Bui, M.; Hong, K.; Jung, S. On the defense of spoofing countermeasures against adversarial attacks. IEEE Access 2023, 11, 94563–94574. [Google Scholar] [CrossRef]
- Duong, M.T.; Lee, S.; Hong, M.C. DMT-Net: Deep multiple networks for low-light image enhancement based on retinex model. IEEE Access 2023, 11, 132147–132161. [Google Scholar] [CrossRef]
- Dang, X.T.; Nguyen, H.V.; Shin, O.S. Optimization of IRS-NOMA-Assisted cell-free massive MIMO systems using deep reinforcement learning. IEEE Access 2023, 11, 94402–94414. [Google Scholar] [CrossRef]
- Vadde, V.; Kumar, B.V.K.V. Channel modeling and estimation for intrapage equalization in pixel-matched volume holographic data storage. Appl. Opt. 1999, 38, 4374–4386. [Google Scholar] [CrossRef]
- Hesselink, L.; Orlov, S.S.; Bashaw, M.C. Holographic data storage systems. Proc. IEEE 2004, 92, 1231–1280. [Google Scholar] [CrossRef]
- Banyal, R.; Prasad, B. Holographic recording in Fe:Ce:Ti doped LiNbO3 crystal. Optics Commun. 2007, 274, 300–306. [Google Scholar] [CrossRef]
- Koo, K.; Kim, S.Y.; Jeong, J.J.; Kim, S.W. Two-dimensional soft output viterbi algorithm with a variable reliability factor for holographic data storage. Jpn. J. Appl. Phys. 2013, 52, 09LE03. [Google Scholar] [CrossRef]
- Wilson, W.Y.H.; Immink, K.A.S.; Xi, X.B.; Chong, T.C. Efficient coding technique for holographic storage using the method of guided scrambling. Proc. SPIE 2000, 4090, 191–196. [Google Scholar] [CrossRef]
- Nguyen, T.A.; Lee, J. Two-dimensional interference estimator with parallel structure for holographic data storage channel. Appl. Sci. 2022, 12, 2112. [Google Scholar] [CrossRef]
- Chen, C.-Y.; Chiueh, T.-D. A low-complexity high-performance modulation code for holographic data storage. In Proceedings of the 2007 14th IEEE International Conference on Electronics, Circuits and Systems, Marrakech, Morocco, 11–14 December 2007; pp. 788–791. [Google Scholar]
- Tarng, J.-H.; Tseng, C.-F.; Chen, T.-C. Two-dimensional modulation code for holographic data storage systems. In Optical Data Storage; OSA Technical Digest Series (CD); Optica Publishing Group: Portland, OR, USA, 2007. [Google Scholar]
- Nguyen, C.; Lee, J. 9/12 2-D modulation code for bit-patterned media recording. IEEE Trans. Magn. 2017, 53, 3101207. [Google Scholar] [CrossRef]
- Warisarn, C.; Arrayangkool, A.; Kovintavewat, P. An ITI-mitigating 5/6 modulation code for bit-patterned media recording. IEICE Trans. Electron. 2015, 98, 528–533. [Google Scholar] [CrossRef]
- Jeong, S.; Lee, J. Track mis-registration estimator based on K-means algorithm for bit-patterned media recording. IEEE Trans. Magn. 2023, 59, 3000405. [Google Scholar] [CrossRef]
- Forney, G. The viterbi algorithm. Proc. IEEE 1973, 61, 268–278. [Google Scholar] [CrossRef]
- Bahl, L.; Cocke, J.; Jelinek, F.; Raviv, J. Optimal decoding of linear codes for minimizing symbol error rate (Corresp.). IEEE Trans. Inf. Theory 1974, 20, 284–287. [Google Scholar] [CrossRef]
- Khametong, A.; Warisarn, C. A study of iterative signal processing schemes for double-layered bit-patterned recording. IEEE Trans. Magn. 2024, 60, 3100305. [Google Scholar] [CrossRef]
- Nabavi, S.; Kumar, B.V.K.V. Two-dimensional generalized partial response equalizer for bit-patterned media. In Proceedings of the International Conference on Communications, Glasgow, UK, 24–28 June 2007; pp. 6249–6254. [Google Scholar]
- Koo, K.; Kim, S.-Y.; Kim, S. Modified two-dimensional soft output viterbi algorithm with two-dimensional partial response target for holographic data storage. Jpn. J. Appl. Phys. 2012, 51, 08JB03. [Google Scholar] [CrossRef]
- Nguyen, T.A.; Lee, J. Serial maximum a posteriori detection of two-dimensional generalized partial response target for holographic data storage systems. Appl. Sci. 2023, 13, 5247. [Google Scholar] [CrossRef]
- Srivallapanondh, S.; Freire, P.J.; Spinnler, B.; Costa, N.; Napoli, A.; Turitsyn, S.K.; Prilepsky, J.E. Parallelization of recurrent neural network-based equalizer for coherent optical systems via knowledge distillation. J. Light. Technol. 2024, 42, 2275–2284. [Google Scholar] [CrossRef]
- Cheng, T.; Belzer, B.J.; Sivakumar, K. Row-column soft-decision feedback algorithm for two-dimensional intersymbol interference. IEEE Signal. Proc. Lett. 2007, 14, 433–436. [Google Scholar] [CrossRef]
- Zheng, J.; Ma, X.; Guan, Y.L.; Cai, K.; Chan, K.S. Low-complexity iterative row-column soft decision feedback algorithm for 2-D inter-symbol interference channel detection with gaussian approximation. IEEE Trans. Magn. 2013, 49, 4768–4773. [Google Scholar] [CrossRef]


| v[j,k − 1] | v[j,k] | v[j,k + 1] |
|---|---|---|
| −2rp − pl2 | −2rl1 − l1l2 | −2rp − pl2 |
| −pl2 | −l1l2 | −pl2 |
| 2rp − pl2 | −2rl1 + l1l2 | 2rp − pl2 |
| −2rp + pl2 | 2rl1 − l1l2 | −2rp + pl2 |
| pl2 | l1l2 | pl2 |
| 2rp + pl2 | 2rl1 + l1l2 | 2rp + pl2 |
| Ri | Pe(Ri) |
|---|---|
| −l1 − 2p | Pa(−1)Pa(−1)Pa(−1) |
| −l1 | Pa(1)Pa(−1)Pa(−1) + Pa(−1)Pa(−1)Pa(1) |
| −l1 + 2p | Pa(1)Pa(−1)Pa(1) |
| l1 − 2p | Pa(−1)Pa(1)Pa(−1) |
| l1 | Pa(1)Pa(1)Pa(−1) + Pa(−1)Pa(1)Pa(1) |
| l1 + 2p | Pa(1)Pa(1)Pa(1) |
Disclaimer/Publisher’s Note: The statements, opinions and data contained in all publications are solely those of the individual author(s) and contributor(s) and not of MDPI and/or the editor(s). MDPI and/or the editor(s) disclaim responsibility for any injury to people or property resulting from any ideas, methods, instructions or products referred to in the content. |
© 2024 by the authors. Licensee MDPI, Basel, Switzerland. This article is an open access article distributed under the terms and conditions of the Creative Commons Attribution (CC BY) license (https://creativecommons.org/licenses/by/4.0/).
Share and Cite
Nguyen, T.A.; Lee, J. Exploiting Extrinsic Information for Serial MAP Detection by Utilizing Estimator in Holographic Data Storage Systems. Appl. Sci. 2025, 15, 139. https://doi.org/10.3390/app15010139
Nguyen TA, Lee J. Exploiting Extrinsic Information for Serial MAP Detection by Utilizing Estimator in Holographic Data Storage Systems. Applied Sciences. 2025; 15(1):139. https://doi.org/10.3390/app15010139
Chicago/Turabian StyleNguyen, Thien An, and Jaejin Lee. 2025. "Exploiting Extrinsic Information for Serial MAP Detection by Utilizing Estimator in Holographic Data Storage Systems" Applied Sciences 15, no. 1: 139. https://doi.org/10.3390/app15010139
APA StyleNguyen, T. A., & Lee, J. (2025). Exploiting Extrinsic Information for Serial MAP Detection by Utilizing Estimator in Holographic Data Storage Systems. Applied Sciences, 15(1), 139. https://doi.org/10.3390/app15010139