
Assessment of the Presence of Microplastics in Stabilized Sewage Sludge: Analysis Methods and Environmental Impact

 , ,
, ,  , , and
Abstract
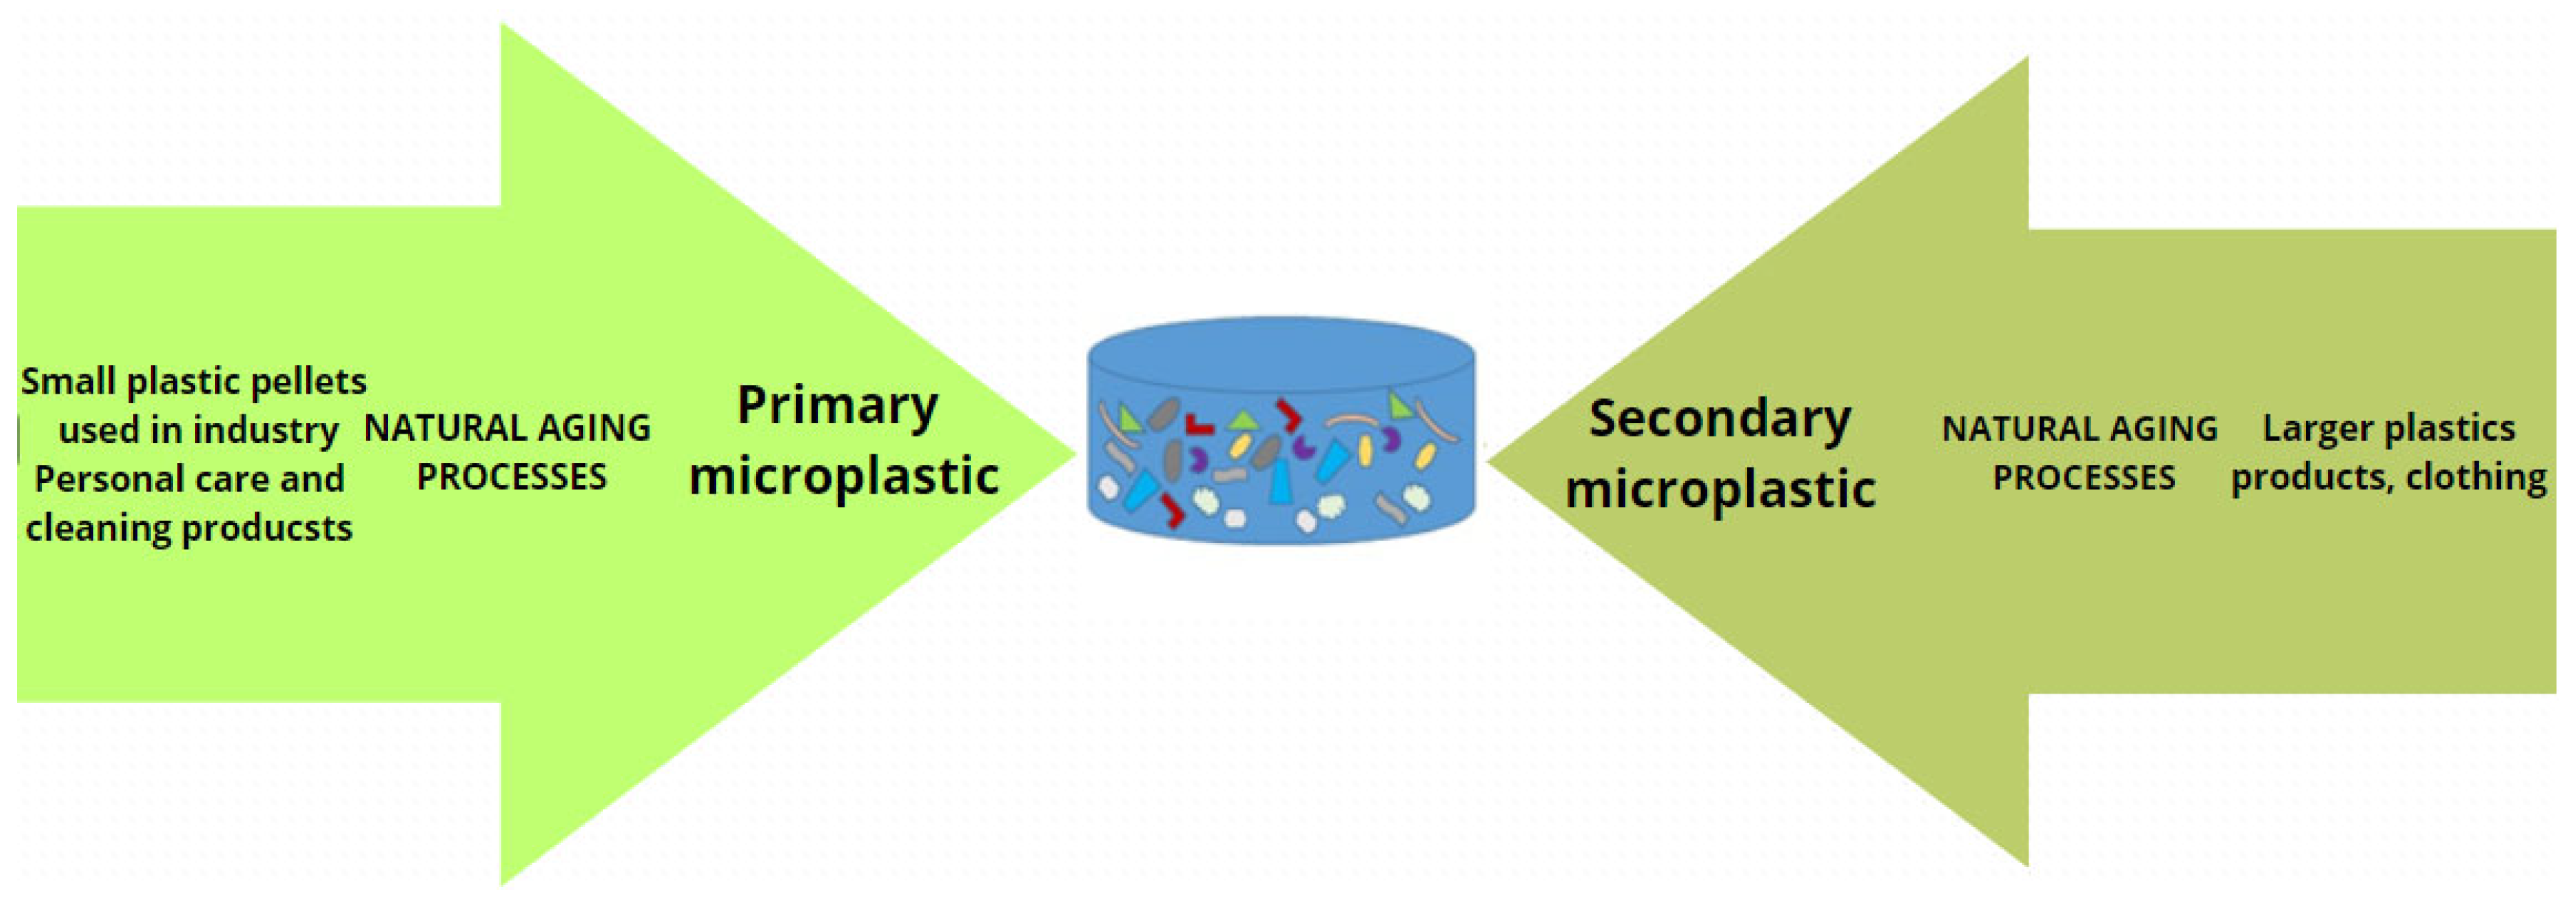
1. Introduction
2. Materials and Methods
2.1. Materials
2.2. Sampling
2.3. Sample Processing
2.4. Separation and Digestion Methods
2.5. Sample Processing
2.5.1. Attenuated Total Reflectance Fourier Transform Infrared Spectroscopy
2.5.2. Confocal Microscope
2.5.3. FIB/SEM (Focused Ion Beam/Scanning Electron Microscope)
2.5.4. Statistical Analysis
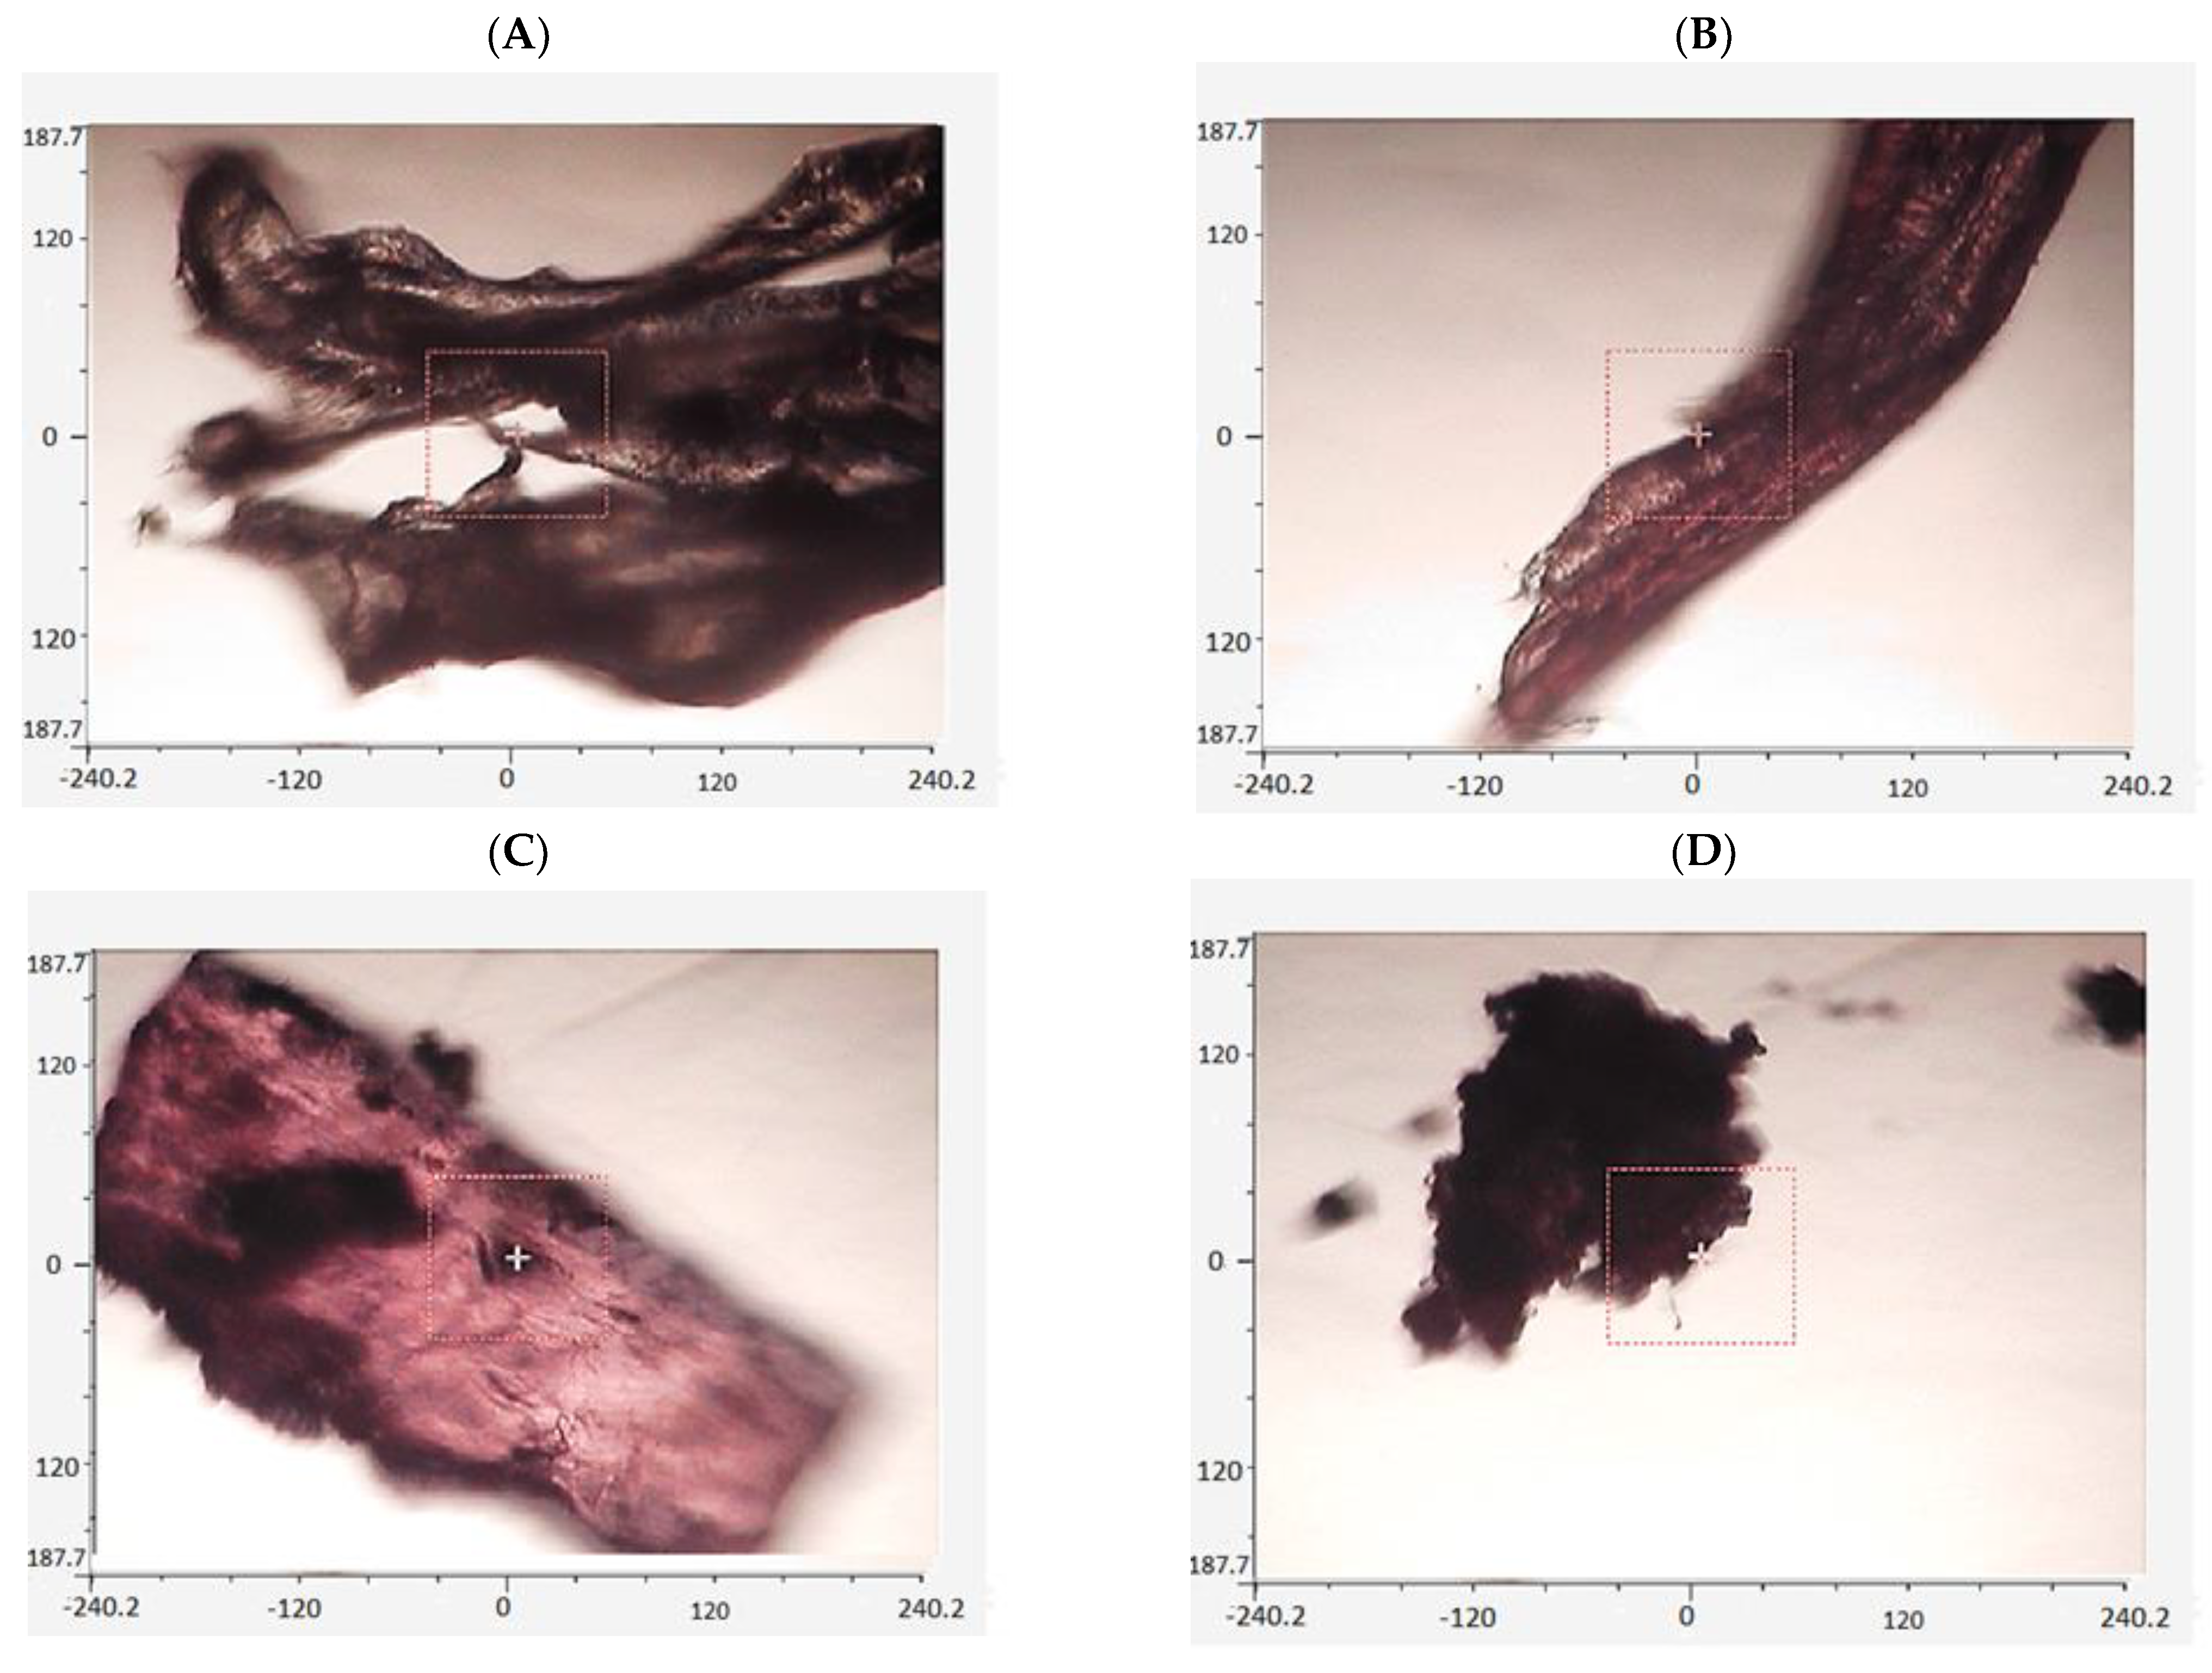
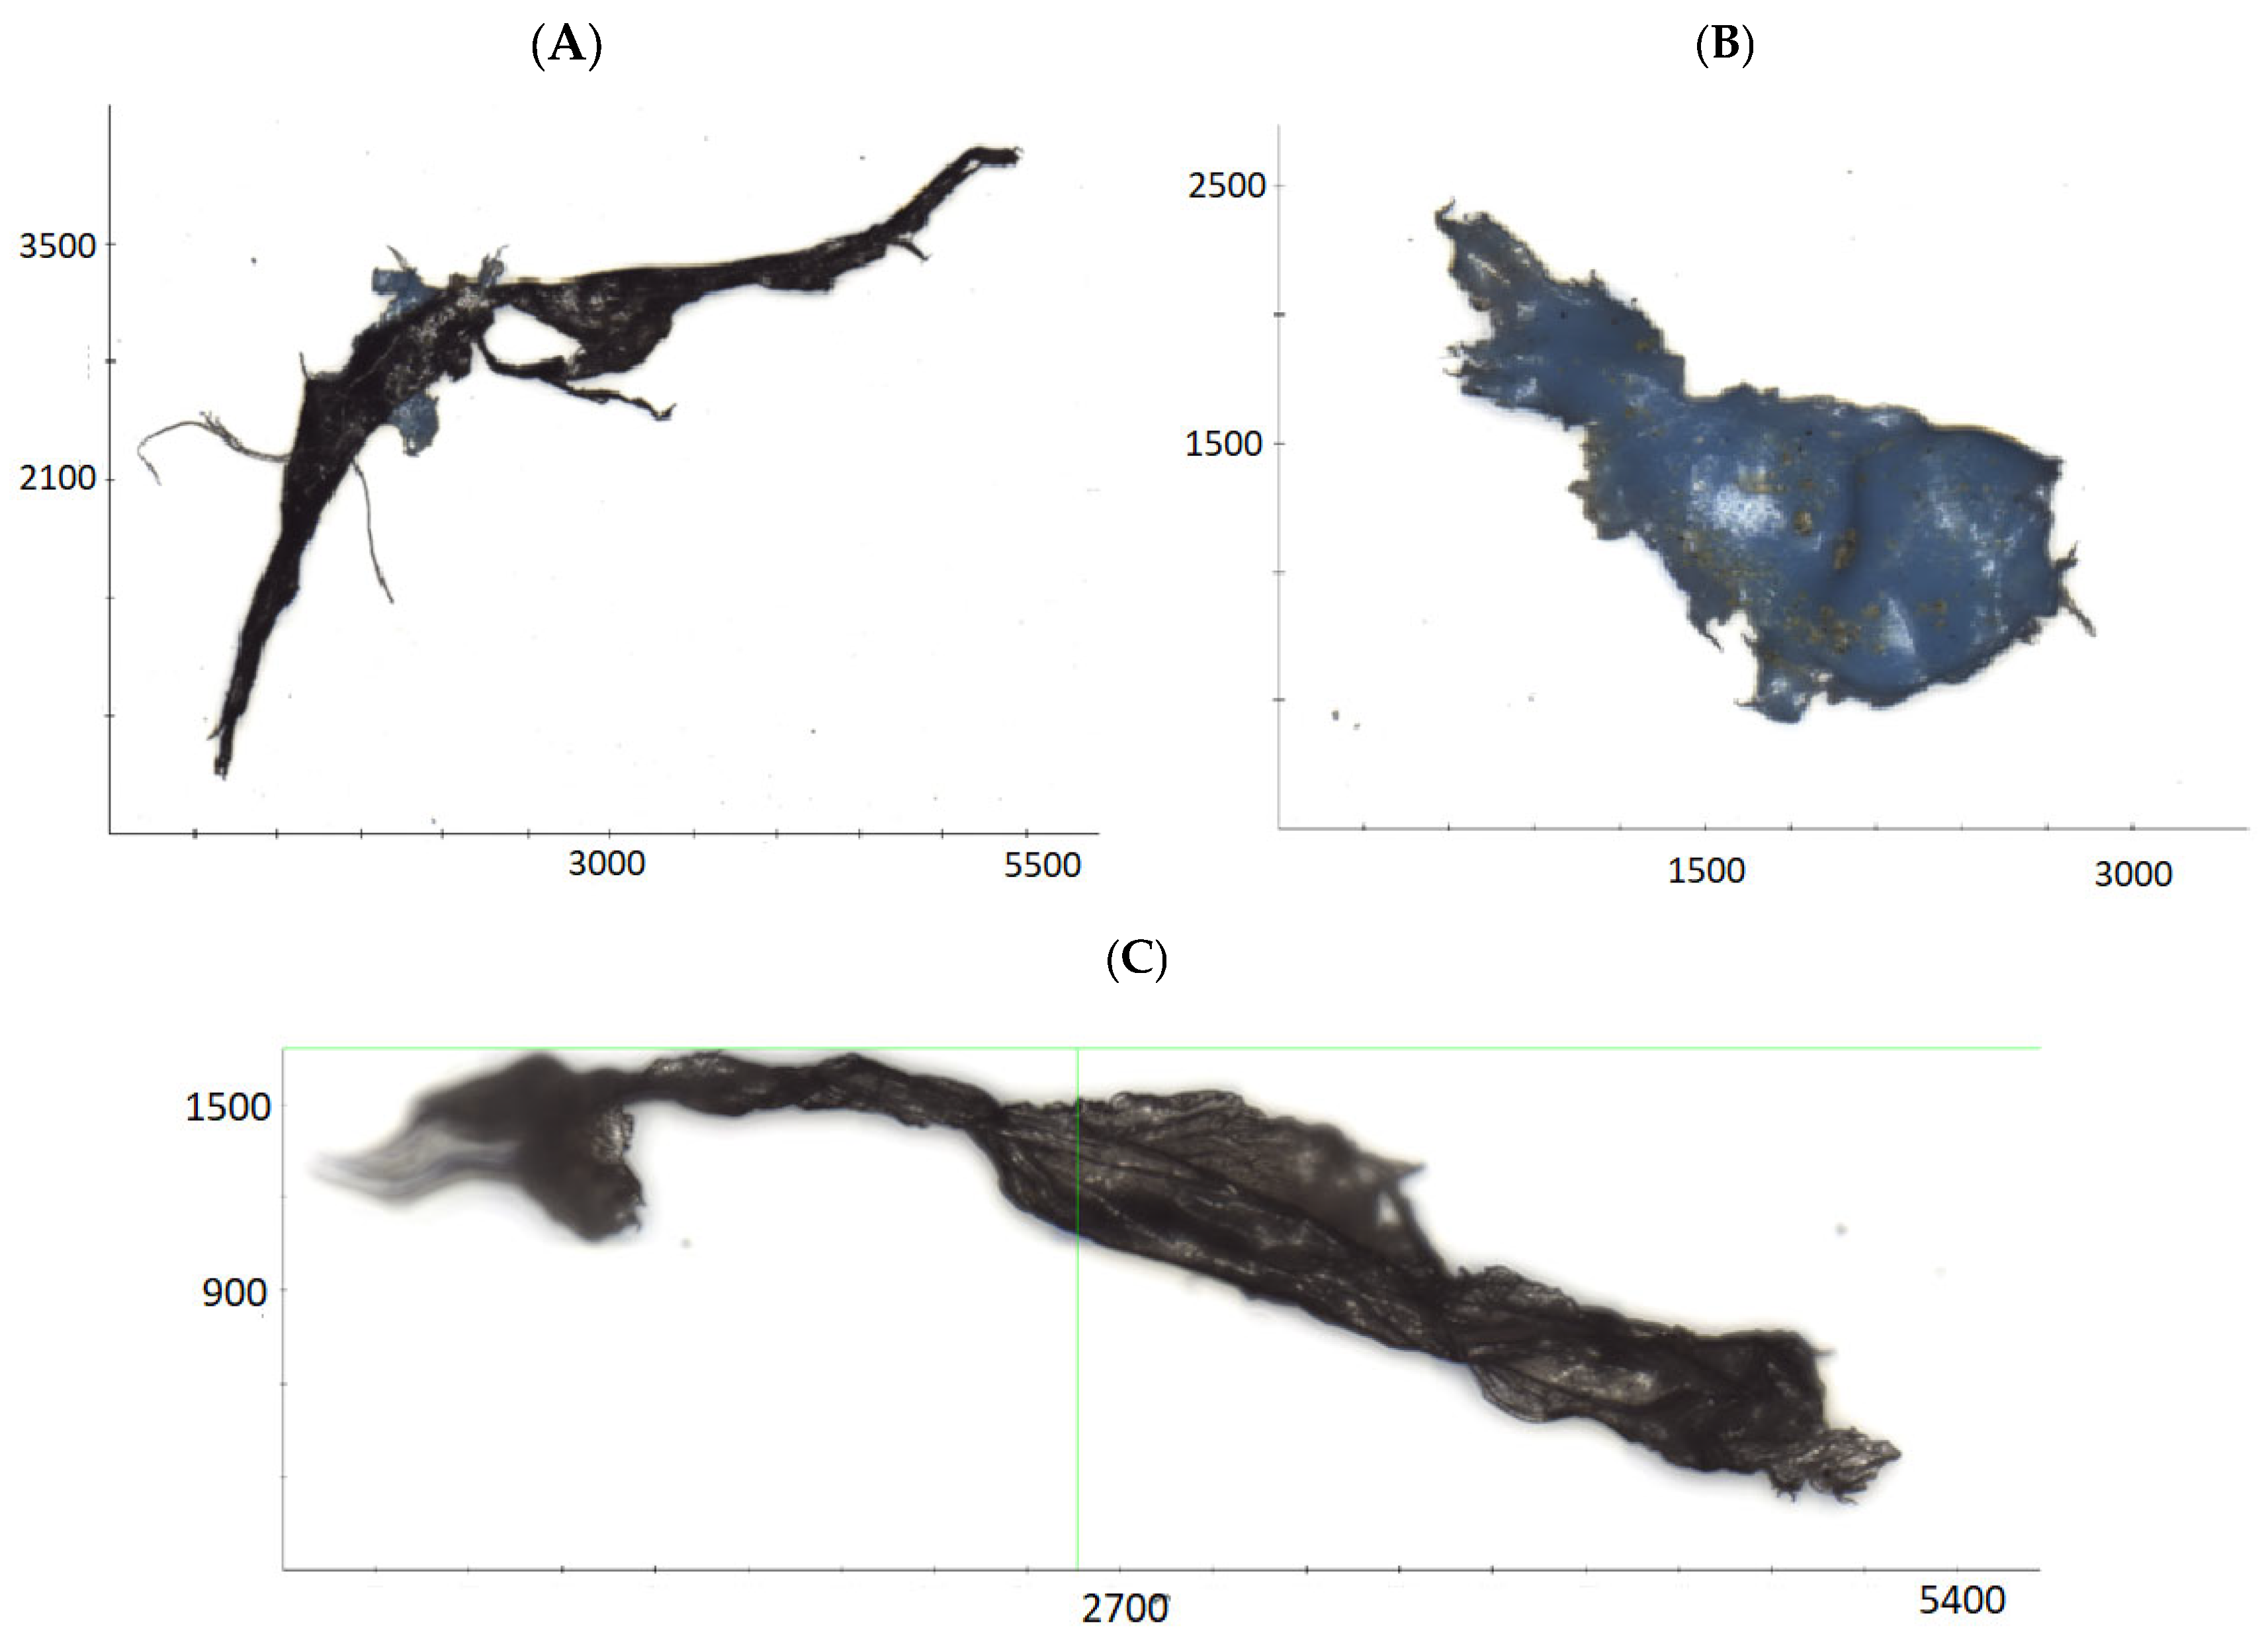
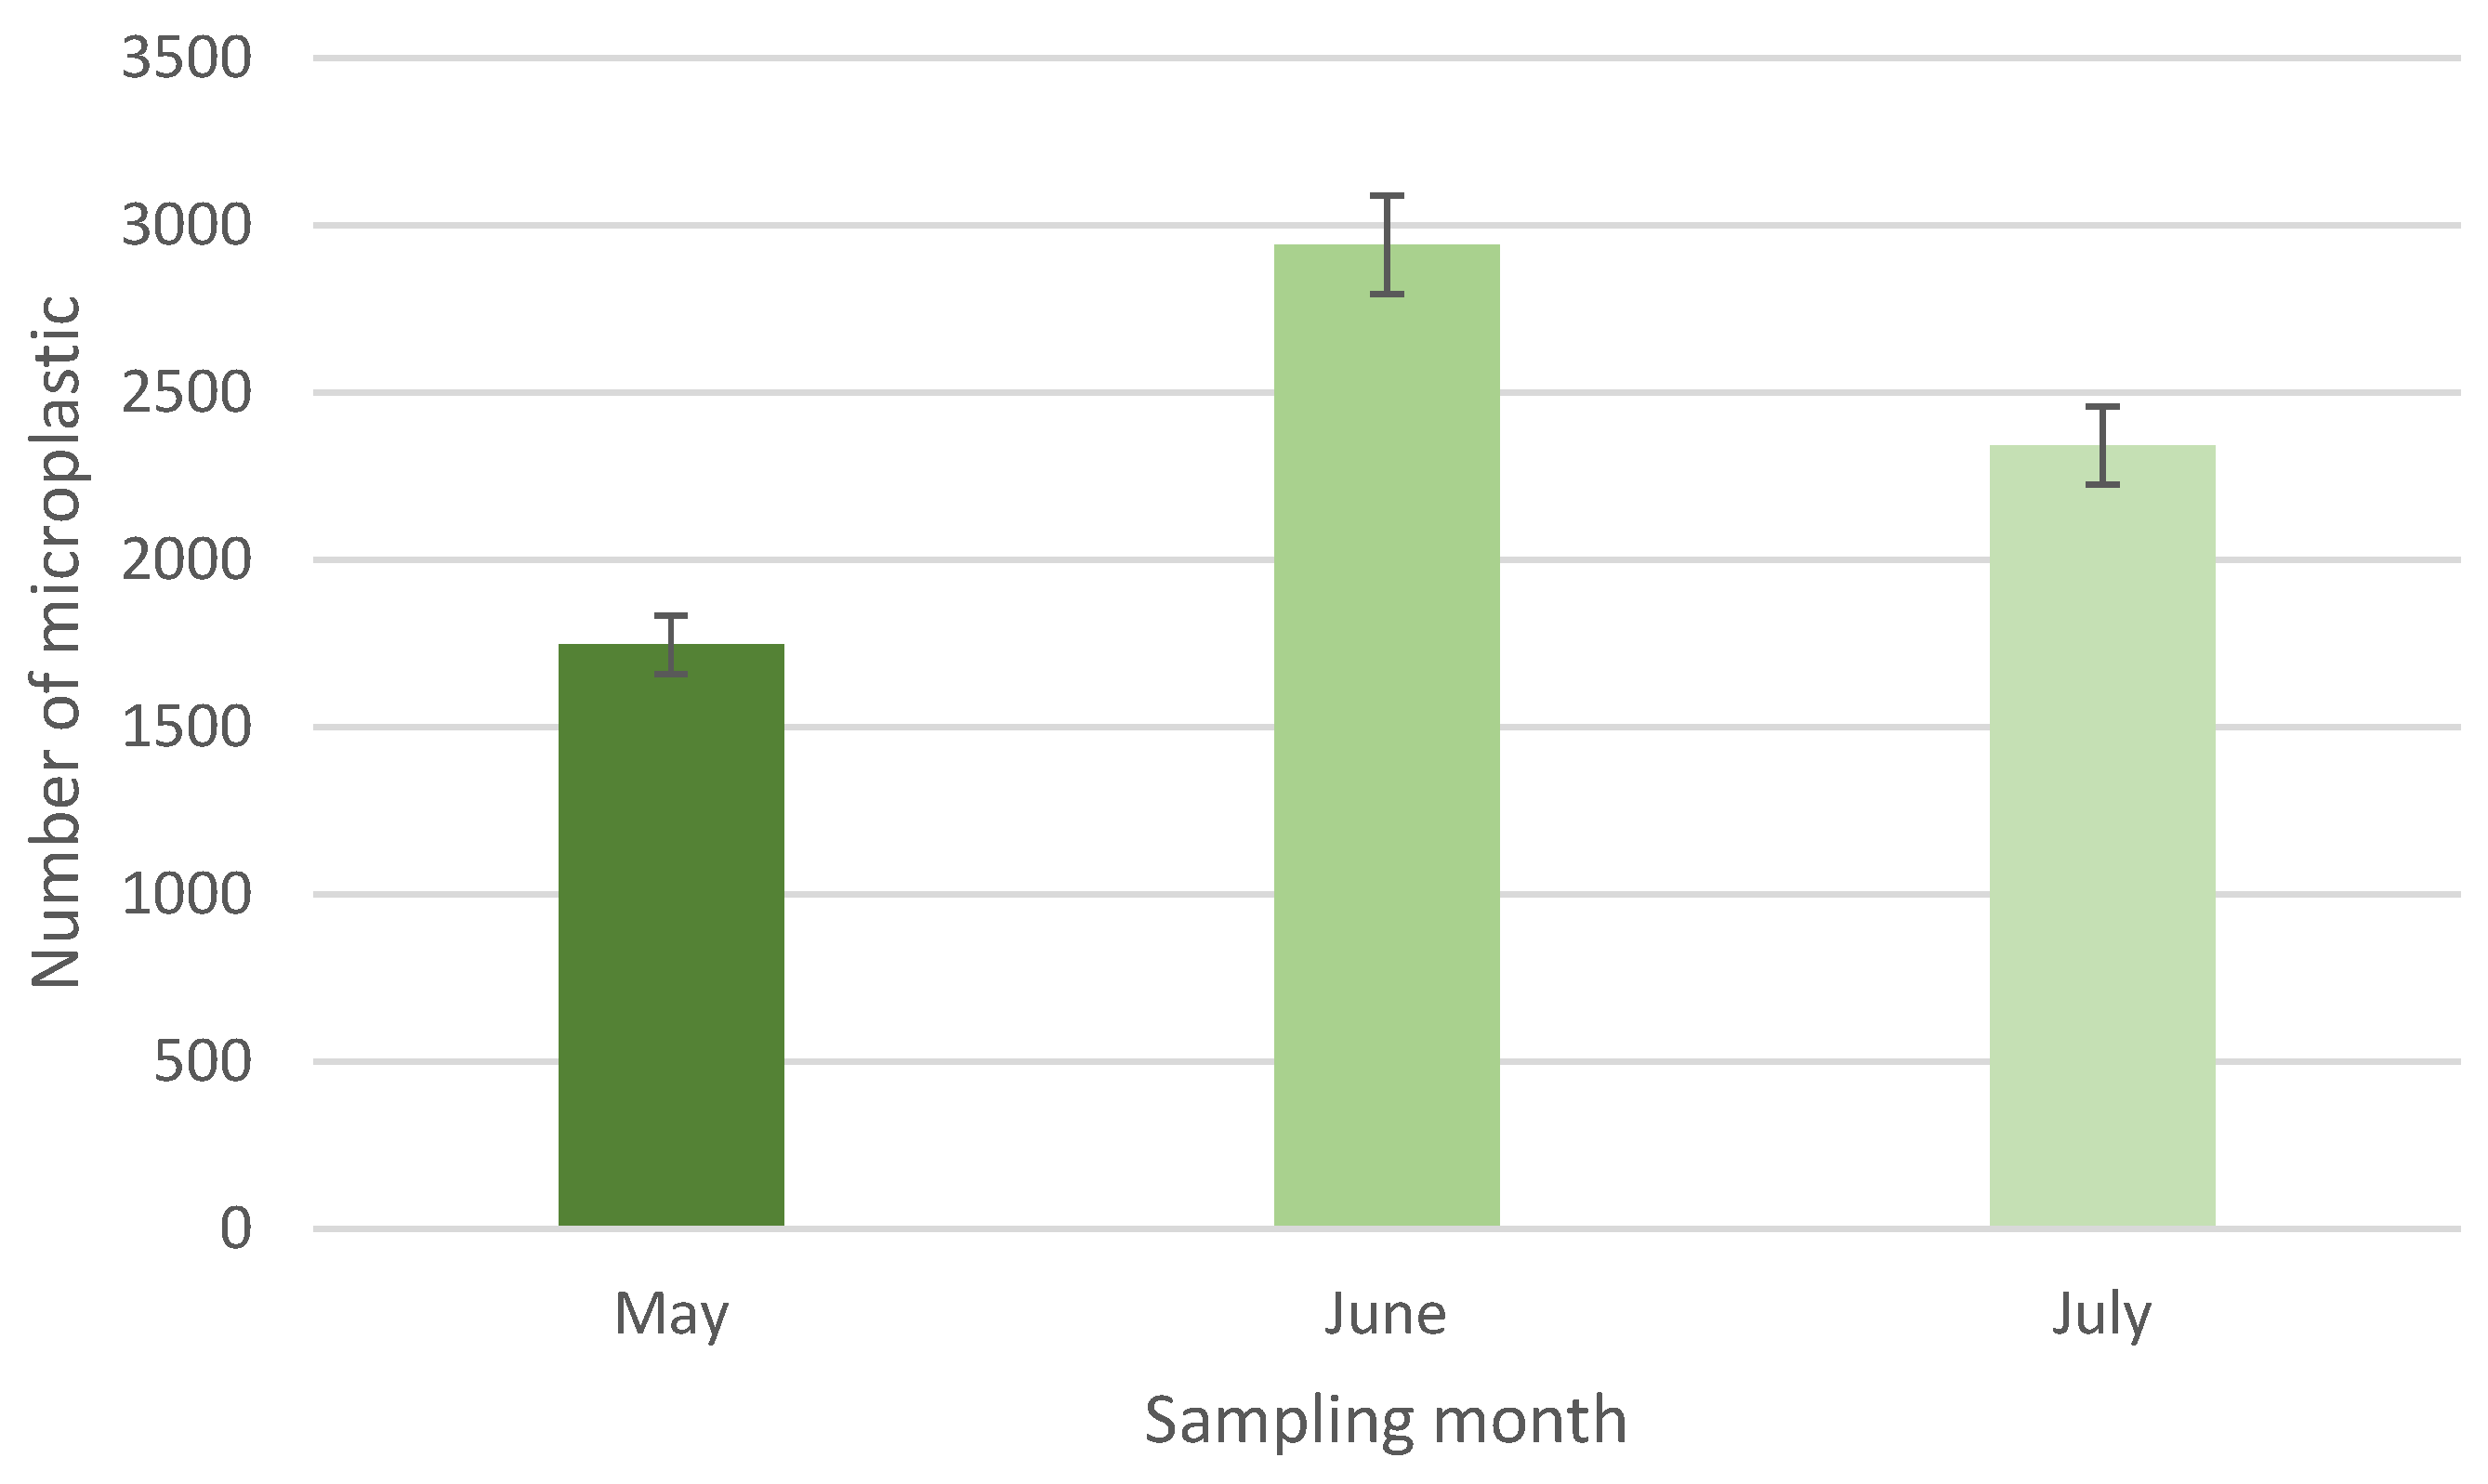
3. Results and Discussions
4. Conclusions
Author Contributions
Funding
Institutional Review Board Statement
Informed Consent Statement
Data Availability Statement
Conflicts of Interest
References
- Dehaut, A.; Cassone, A.-L.; Frère, L.; Hermabessiere, L.; Himber, C.; Rinnert, E.; Rivière, G.; Lambert, C.; Soudant, P.; Huvet, A.; et al. Microplastics in Seafood: Benchmark Protocol for Their Extraction and Characterization. Environ. Pollut. 2016, 215, 223–233. [Google Scholar] [CrossRef] [PubMed]
- Harper, C.A.; Petrie, E.M. Plastics Materials and Processes; John Wiley & Sons, Inc.: Hoboken, NJ, USA, 2003; ISBN 3175723993. [Google Scholar]
- Carpenter, E.J.; Anderson, S.J.; Harvey, G.R.; Miklas, H.P.; Peck, B.B. Polystyrene Spherules in Coastal Waters. Science 1972, 178, 749–750. [Google Scholar] [CrossRef]
- Hidalgo-Ruz, V.; Gutow, L.; Thompson, R.C.; Thiel, M. Microplastics in the Marine Environment: A Review of the Methods Used for Identification and Quantification. Environ. Sci. Technol. 2012, 46, 3060–3075. [Google Scholar] [CrossRef]
- Plastics Europe. Plastics—The Facts 2019; Conversio Market & Strategy GmbH: Mainaschaff, Germany, 2019; Volume 14, p. 35. [Google Scholar]
- Geyer, R.; Jambeck, J.R.; Law, K.L. Production, Use, and Fate of All Plastics Ever Made. Sci. Adv. 2017, 3, 19–24. [Google Scholar] [CrossRef] [PubMed]
- Zhao, S.; Zhu, L.; Li, D. Microplastic in Three Urban Estuaries, China. Environ. Pollut. 2015, 206, 597–604. [Google Scholar] [CrossRef] [PubMed]
- Durak, J.; Styszko, K.; Sochacka-Tatara, E. Evaluation of the Stability of Selected Hydroxy Derivatives of Polycyclic Aromatic Hydrocarbons in Environmental Samples. Desalination Water Treat. 2021, 232, 324–330. [Google Scholar] [CrossRef]
- Styszko, K.; Durak, J.; Malicka, A.; Bochnia, T.; Zaba, T. The Occurrence of Chemicals of Emerging Concern in Samples of Surface Water and Wastewater Collected in Kraków, Poland. Desalination Water Treat. 2021, 232, 308–323. [Google Scholar] [CrossRef]
- Eriksen, M.; Lebreton, L.C.M.; Carson, H.S.; Thiel, M.; Moore, C.J.; Borerro, J.C.; Galgani, F.; Ryan, P.G.; Reisser, J. Plastic Pollution in the World’s Oceans: More than 5 Trillion Plastic Pieces Weighing over 250,000 Tons Afloat at Sea. PLoS ONE 2014, 9, e111913. [Google Scholar] [CrossRef]
- Imhof, H.K.; Ivleva, N.P.; Schmid, J.; Niessner, R.; Laforsch, C. Contamination of Beach Sediments of a Subalpine Lake with Microplastic Particles. Curr. Biol. 2013, 23, R867–R868. [Google Scholar] [CrossRef] [PubMed]
- Lechner, A.; Keckeis, H.; Lumesberger-Loisl, F.; Zens, B.; Krusch, R.; Tritthart, M.; Glas, M.; Schludermann, E. The Danube so Colourful: A Potpourri of Plastic Litter Outnumbers Fish Larvae in Europe’s Second Largest River. Environ. Pollut. 2014, 188, 177–181. [Google Scholar] [CrossRef]
- Worek, J.; Badura, X.; Białas, A.; Chwiej, J.; Kawoń, K.; Styszko, K. Pollution from Transport: Detection of Tyre Particles in Environmental Samples. Energies 2022, 15, 2816. [Google Scholar] [CrossRef]
- Styszko, K.; Durak, J.; Kończak, B.; Głodniok, M.; Borgulat, A. The Impact of Sewage Sludge Processing on the Safety of Its Use. Sci. Rep. 2022, 12, 12227. [Google Scholar] [CrossRef] [PubMed]
- Corradini, F.; Meza, P.; Eguiluz, R.; Casado, F.; Huerta-Lwanga, E.; Geissen, V. Evidence of Microplastic Accumulation in Agricultural Soils from Sewage Sludge Disposal. Sci. Total Environ. 2019, 671, 411–420. [Google Scholar] [CrossRef] [PubMed]
- Harley-Nyang, D.; Memon, F.A.; Jones, N.; Galloway, T. Investigation and Analysis of Microplastics in Sewage Sludge and Biosolids: A Case Study from One Wastewater Treatment Works in the UK. Sci. Total Environ. 2022, 823, 153735. [Google Scholar] [CrossRef]
- Mahon, A.M.; O’Connell, B.; Healy, M.G.; O’Connor, I.; Officer, R.; Nash, R.; Morrison, L. Microplastics in Sewage Sludge: Effects of Treatment. Environ. Sci. Technol. 2017, 51, 810–818. [Google Scholar] [CrossRef] [PubMed]
- Weber, C.J.; Santowski, A.; Chifflard, P. Investigating the Dispersal of Macro- and Microplastics on Agricultural Fields 30 Years after Sewage Sludge Application. Sci. Rep. 2022, 12, 6401. [Google Scholar] [CrossRef] [PubMed]
- Sol, D.; Laca, A.; Laca, A.; Díaz, M. Approaching the Environmental Problem of Microplastics: Importance of WWTP Treatments. Sci. Total Environ. 2020, 740, 140016. [Google Scholar] [CrossRef] [PubMed]
- Hatinoğlu, M.D.; Sanin, F.D. Sewage Sludge as a Source of Microplastics in the Environment: A Review of Occurrence and Fate during Sludge Treatment. J. Environ. Manag. 2021, 295, 113028. [Google Scholar] [CrossRef]
- Gong, J.; Xie, P. Research Progress in Sources, Analytical Methods, Eco-Environmental Effects, and Control Measures of Microplastics. Chemosphere 2020, 254, 126790. [Google Scholar] [CrossRef]
- Li, X.; Chen, L.; Mei, Q.; Dong, B.; Dai, X.; Ding, G.; Zeng, E.Y. Microplastics in Sewage Sludge from the Wastewater Treatment Plants in China. Water Res. 2018, 142, 75–85. [Google Scholar] [CrossRef] [PubMed]
- Nizzetto, L.; Futter, M.; Langaas, S. Are Agricultural Soils Dumps for Microplastics of Urban Origin? Environ. Sci. Technol. 2016, 50, 10777–10779. [Google Scholar] [CrossRef] [PubMed]
- Zhang, B.; Yang, X.; Chen, L.; Chao, J.; Teng, J.; Wang, Q. Microplastics in Soils: A Review of Possible Sources, Analytical Methods and Ecological Impacts. J. Chem. Technol. Biotechnol. 2020, 95, 2052–2068. [Google Scholar] [CrossRef]
- Giuffréde López Carnelo, L.; de Miguez, S.R.; Marbán, L. Heavy Metals Input with Phosphate Fertilizers Used in Argentina. Sci. Total Environ. 1997, 204, 245–250. [Google Scholar] [CrossRef]
- ISO 5667-13:2011; Water Quality—Sampling. Part 13: Guidance on Sampling of Sludges. International Standard Organization: Geneva, Switzerland, 2011.
- Jagoda, W.; Kamil, K.; Joanna, C.; Katarzyna, B.; Daniel, K.; Katarzyna, S. Analysis of the Content, Composition, and Structure of Microplastics Found in Sewage Sludge. In Proceedings of the Fifth Edition of the International Conference Energy Fuels Environment (EFE2024), Krakow, Poland, 26–28 June 2024; Bogdan, S., Ed.; AGH University of Science and Technology: Krakow, Poland, 2024. ISBN 9788396934314. [Google Scholar]
- Gao, D.; Li, X.Y.; Liu, H.T. Source, Occurrence, Migration and Potential Environmental Risk of Microplastics in Sewage Sludge and during Sludge Amendment to Soil. Sci. Total Environ. 2020, 742, 140355. [Google Scholar] [CrossRef] [PubMed]
- Ragoobur, D.; Huerta-Lwanga, E.; Somaroo, G.D. Microplastics in Agricultural Soils, Wastewater Effluents and Sewage Sludge in Mauritius. Sci. Total Environ. 2021, 798, 149326. [Google Scholar] [CrossRef] [PubMed]
- Edo, C.; González-Pleiter, M.; Leganés, F.; Fernández-Piñas, F.; Rosal, R. Fate of Microplastics in Wastewater Treatment Plants and Their Environmental Dispersion with Effluent and Sludge. Environ. Pollut. 2020, 259, 113837. [Google Scholar] [CrossRef]
- Franco, A.A.; Martín-García, A.P.; Egea-Corbacho, A.; Arellano, J.M.; Albendín, G.; Rodríguez-Barroso, R.; Quiroga, J.M.; Coello, M.D. Assessment and Accumulation of Microplastics in Sewage Sludge at Wastewater Treatment Plants Located in Cádiz, Spain. Environ. Pollut. 2023, 317, 120689. [Google Scholar] [CrossRef] [PubMed]
- Lusher, A.; Hurley, R.; Vogelsang, C.; Nizzetto, L.; Olsen, M. Mapping Microplastics in Sludge; NIVA-Norsk Institutt for Vannforskning: Oslo, Norway, 2017; ISBN 9788257769505. [Google Scholar] [CrossRef]
- Dris, R.; Gasperi, J.; Saad, M.; Mirande, C.; Tassin, B. Synthetic Fibers in Atmospheric Fallout: A Source of Microplastics in the Environment? Mar. Pollut. Bull. 2016, 104, 290–293. [Google Scholar] [CrossRef] [PubMed]
- Lares, M.; Ncibi, M.C.; Sillanpää, M.; Sillanpää, M. Occurrence, Identification and Removal of Microplastic Particles and Fibers in Conventional Activated Sludge Process and Advanced MBR Technology. Water Res. 2018, 133, 236–246. [Google Scholar] [CrossRef]
- Talvitie, J.; Mikola, A.; Setälä, O.; Heinonen, M.; Koistinen, A. How Well Is Microlitter Purified from Wastewater?—A Detailed Study on the Stepwise Removal of Microlitter in a Tertiary Level Wastewater Treatment Plant. Water Res. 2017, 109, 164–172. [Google Scholar] [CrossRef]
- Mintenig, S.M.; Int-Veen, I.; Löder, M.G.J.; Primpke, S.; Gerdts, G. Identification of Microplastic in Effluents of Waste Water Treatment Plants Using Focal Plane Array-Based Micro-Fourier-Transform Infrared Imaging. Water Res. 2017, 108, 365–372. [Google Scholar] [CrossRef] [PubMed]
- Ziajahromi, S.; Drapper, D.; Hornbuckle, A.; Rintoul, L.; Leusch, F.D.L. Microplastic Pollution in a Stormwater Floating Treatment Wetland: Detection of Tyre Particles in Sediment. Sci. Total Environ. 2020, 713, 136356. [Google Scholar] [CrossRef]
- Chiellini, E.; Corti, A.; Swift, G. Biodegradation of Thermally-Oxidized, Fragmented Low-Density Polyethylenes. Polym. Degrad. Stab. 2003, 81, 341–351. [Google Scholar] [CrossRef]
- Tsai, J.-C.; Lo, Y.-L.; Lin, C.-Y.; Sheu, H.-M.; Lin, J.-C. Feasibility of Rapid Quantitation of Stratum Corneum Lipid Content by Fourier Transform Infrared Spectrometry; IOS Press: Amsterdam, The Netherlands, 2004; Volume 18. [Google Scholar]
- Tew, W.Y.; Ying, C.; Wujun, Z.; Baocai, L.; Yoon, T.L.; Yam, M.F.; Jingying, C. Application of FT-IR Spectroscopy and Chemometric Technique for the Identification of Three Different Parts of Camellia Nitidissima and Discrimination of Its Authenticated Product. Front. Pharmacol. 2022, 13, 931203. [Google Scholar] [CrossRef]
- Ferreira, F.G.D.; Lima, M.A.G.A.; Almeida, Y.M.B.; Vinhas, G.M. Evaluation of Photodegradation in LDPE/Modified Starch Blends. Polímeros 2009, 19, 313–317. [Google Scholar] [CrossRef]
- Gola, A.; Niżniowska, A.; Musiał, W. The Influence of Initiator Concentration on Selected Properties on Poly-N-Vinylcaprolactam Nanoparticles. Nanomaterials 2019, 9, 1577. [Google Scholar] [CrossRef] [PubMed]
- Kamble, M.T.; Rudtanatip, T.; Soowannayan, C.; Nambunruang, B.; Medhe, S.V.; Wongprasert, K. Depolymerized Fractions of Sulfated Galactans Extracted from Gracilaria Fisheri and Their Antibacterial Activity against Vibrio Parahaemolyticus and Vibrio Harveyi. Mar. Drugs 2022, 20, 469. [Google Scholar] [CrossRef]
- Liu, X.; Yuan, W.; Di, M.; Li, Z.; Wang, J. Transfer and Fate of Microplastics during the Conventional Activated Sludge Process in One Wastewater Treatment Plant of China. Chem. Eng. J. 2019, 362, 176–182. [Google Scholar] [CrossRef]
- Cheung, P.K.; Fok, L. Characterisation of Plastic Microbeads in Facial Scrubs and Their Estimated Emissions in Mainland China. Water Res. 2017, 122, 53–61. [Google Scholar] [CrossRef]
- Ou, H.; Zeng, E.Y. Occurrence and Fate of Microplastics in Wastewater Treatment Plants. In Microplastic Contamination in Aquatic Environments: An Emerging Matter of Environmental Urgency; Elsevier: Amsterdam, The Netherlands, 2018; pp. 317–338. ISBN 9780128137475. [Google Scholar]
- Trestrail, C.; Walpitagama, M.; Hedges, C.; Truskewycz, A.; Miranda, A.; Wlodkowic, D.; Shimeta, J.; Nugegoda, D. Foaming at the Mouth: Ingestion of Floral Foam Microplastics by Aquatic Animals. Sci. Total Environ. 2020, 705, 135826. [Google Scholar] [CrossRef]
- Yu, Y.; Mo, W.Y.; Luukkonen, T. Adsorption Behaviour and Interaction of Organic Micropollutants with Nano and Microplastics—A Review. Sci. Total Environ. 2021, 797, 149140. [Google Scholar] [CrossRef] [PubMed]
- Hurley, R.R.; Lusher, A.L.; Olsen, M.; Nizzetto, L. Validation of a Method for Extracting Microplastics from Complex, Organic-Rich, Environmental Matrices. Environ. Sci. Technol. 2018, 52, 7409–7417. [Google Scholar] [CrossRef] [PubMed]
- Campanale, C.; Massarelli, C.; Savino, I.; Locaputo, V.; Uricchio, V.F. A Detailed Review Study on Potential Effects of Microplastics and Additives of Concern on Human Health. Int. J. Environ. Res. Public Health 2020, 17, 1212. [Google Scholar] [CrossRef] [PubMed]
- Głodniok, M.; Korol, J.; Zawartka, P.; Krawczyk, B.; Deska, M. Organic Fertilizer and Method for Obtaining It; Polish Patent Office: Warsaw, Poland, 2017. [Google Scholar]
- Kończak, B.; Zawartka, P. Methods for Obtaining of Slow-Releasing Granular Fertilizer. Polish Patent 423664, 11 November 2017. [Google Scholar]
- Ratchnashree, S.R.; Karmegam, N.; Selvam, M.; Manikandan, S.; Deena, S.R.; Subbaiya, R.; Vickram, A.S.; Kim, W.; Govarthanan, M. Advanced Technologies for the Determination of Quantitative Structure-Activity Relationships and Degradation Efficiency of Micropollutants and Their Removal in Water—A Review. Sci. Total Environ. 2023, 904, 166563. [Google Scholar] [CrossRef] [PubMed]
- Guo, J.-J.; Huang, X.-P.; Xiang, L.; Wang, Y.-Z.; Li, Y.-W.; Li, H.; Cai, Q.-Y.; Mo, C.-H.; Wong, M.-H. Source, Migration and Toxicology of Microplastics in Soil. Environ. Int. 2020, 137, 105263. [Google Scholar] [CrossRef]
- Zettler, E.R.; Mincer, T.J.; Amaral-Zettler, L.A. Life in the “Plastisphere”: Microbial Communities on Plastic Marine Debris. Environ. Sci. Technol. 2013, 47, 7137–7146. [Google Scholar] [CrossRef] [PubMed]


| Component | Content/Determined Value |
|---|---|
| Total moisture, wt % (% m/m) | 78.2 ± 2.3 |
| Dry matter, wt % (% m/m) | 21.8 ± 2.3 |
| Organic substance, wt % DM | 64.7 ± 12.8 |
| Nitrogen, wt % DM | 5.3 ± 1.6 |
| Phosphorus, wt % DM | 2.7 ± 0.2 |
| Magnesium, wt % DM | 0.6 ± 0.1 |
| Calcium, wt % DM | 2.6 ± 0.5 |
| Copper, wt % (mg/kg) | 321.2 ± 68.0 |
| Cadmium, wt % (mg/kg) | 0.7 ± 0.2 |
| Lead, wt % (mg/kg) | 20.6 ± 7.9 |
| Zinc, wt % (mg/kg) | 674.1 ± 66.2 |
| Chrome, wt % (mg/kg) | 24.9 ± 3.8 |
| Mercury, wt % (mg/kg) | 0.3 ± 0.1 |
Disclaimer/Publisher’s Note: The statements, opinions and data contained in all publications are solely those of the individual author(s) and contributor(s) and not of MDPI and/or the editor(s). MDPI and/or the editor(s) disclaim responsibility for any injury to people or property resulting from any ideas, methods, instructions or products referred to in the content. |
© 2024 by the authors. Licensee MDPI, Basel, Switzerland. This article is an open access article distributed under the terms and conditions of the Creative Commons Attribution (CC BY) license (https://creativecommons.org/licenses/by/4.0/).
Share and Cite
Worek, J.; Kawoń, K.; Chwiej, J.; Berent, K.; Rego, R.; Styszko, K. Assessment of the Presence of Microplastics in Stabilized Sewage Sludge: Analysis Methods and Environmental Impact. Appl. Sci. 2025, 15, 1. https://doi.org/10.3390/app15010001
Worek J, Kawoń K, Chwiej J, Berent K, Rego R, Styszko K. Assessment of the Presence of Microplastics in Stabilized Sewage Sludge: Analysis Methods and Environmental Impact. Applied Sciences. 2025; 15(1):1. https://doi.org/10.3390/app15010001
Chicago/Turabian StyleWorek, Jagoda, Kamil Kawoń, Joanna Chwiej, Katarzyna Berent, Rosa Rego, and Katarzyna Styszko. 2025. "Assessment of the Presence of Microplastics in Stabilized Sewage Sludge: Analysis Methods and Environmental Impact" Applied Sciences 15, no. 1: 1. https://doi.org/10.3390/app15010001
APA StyleWorek, J., Kawoń, K., Chwiej, J., Berent, K., Rego, R., & Styszko, K. (2025). Assessment of the Presence of Microplastics in Stabilized Sewage Sludge: Analysis Methods and Environmental Impact. Applied Sciences, 15(1), 1. https://doi.org/10.3390/app15010001