

Neuromuscular Capabilities in Top-Level Weightlifters and Their Association with Weightlifting Performance

 , and
, and 
Abstract
1. Introduction
2. Materials and Methods
2.1. Design
2.2. Participants
2.3. Procedures
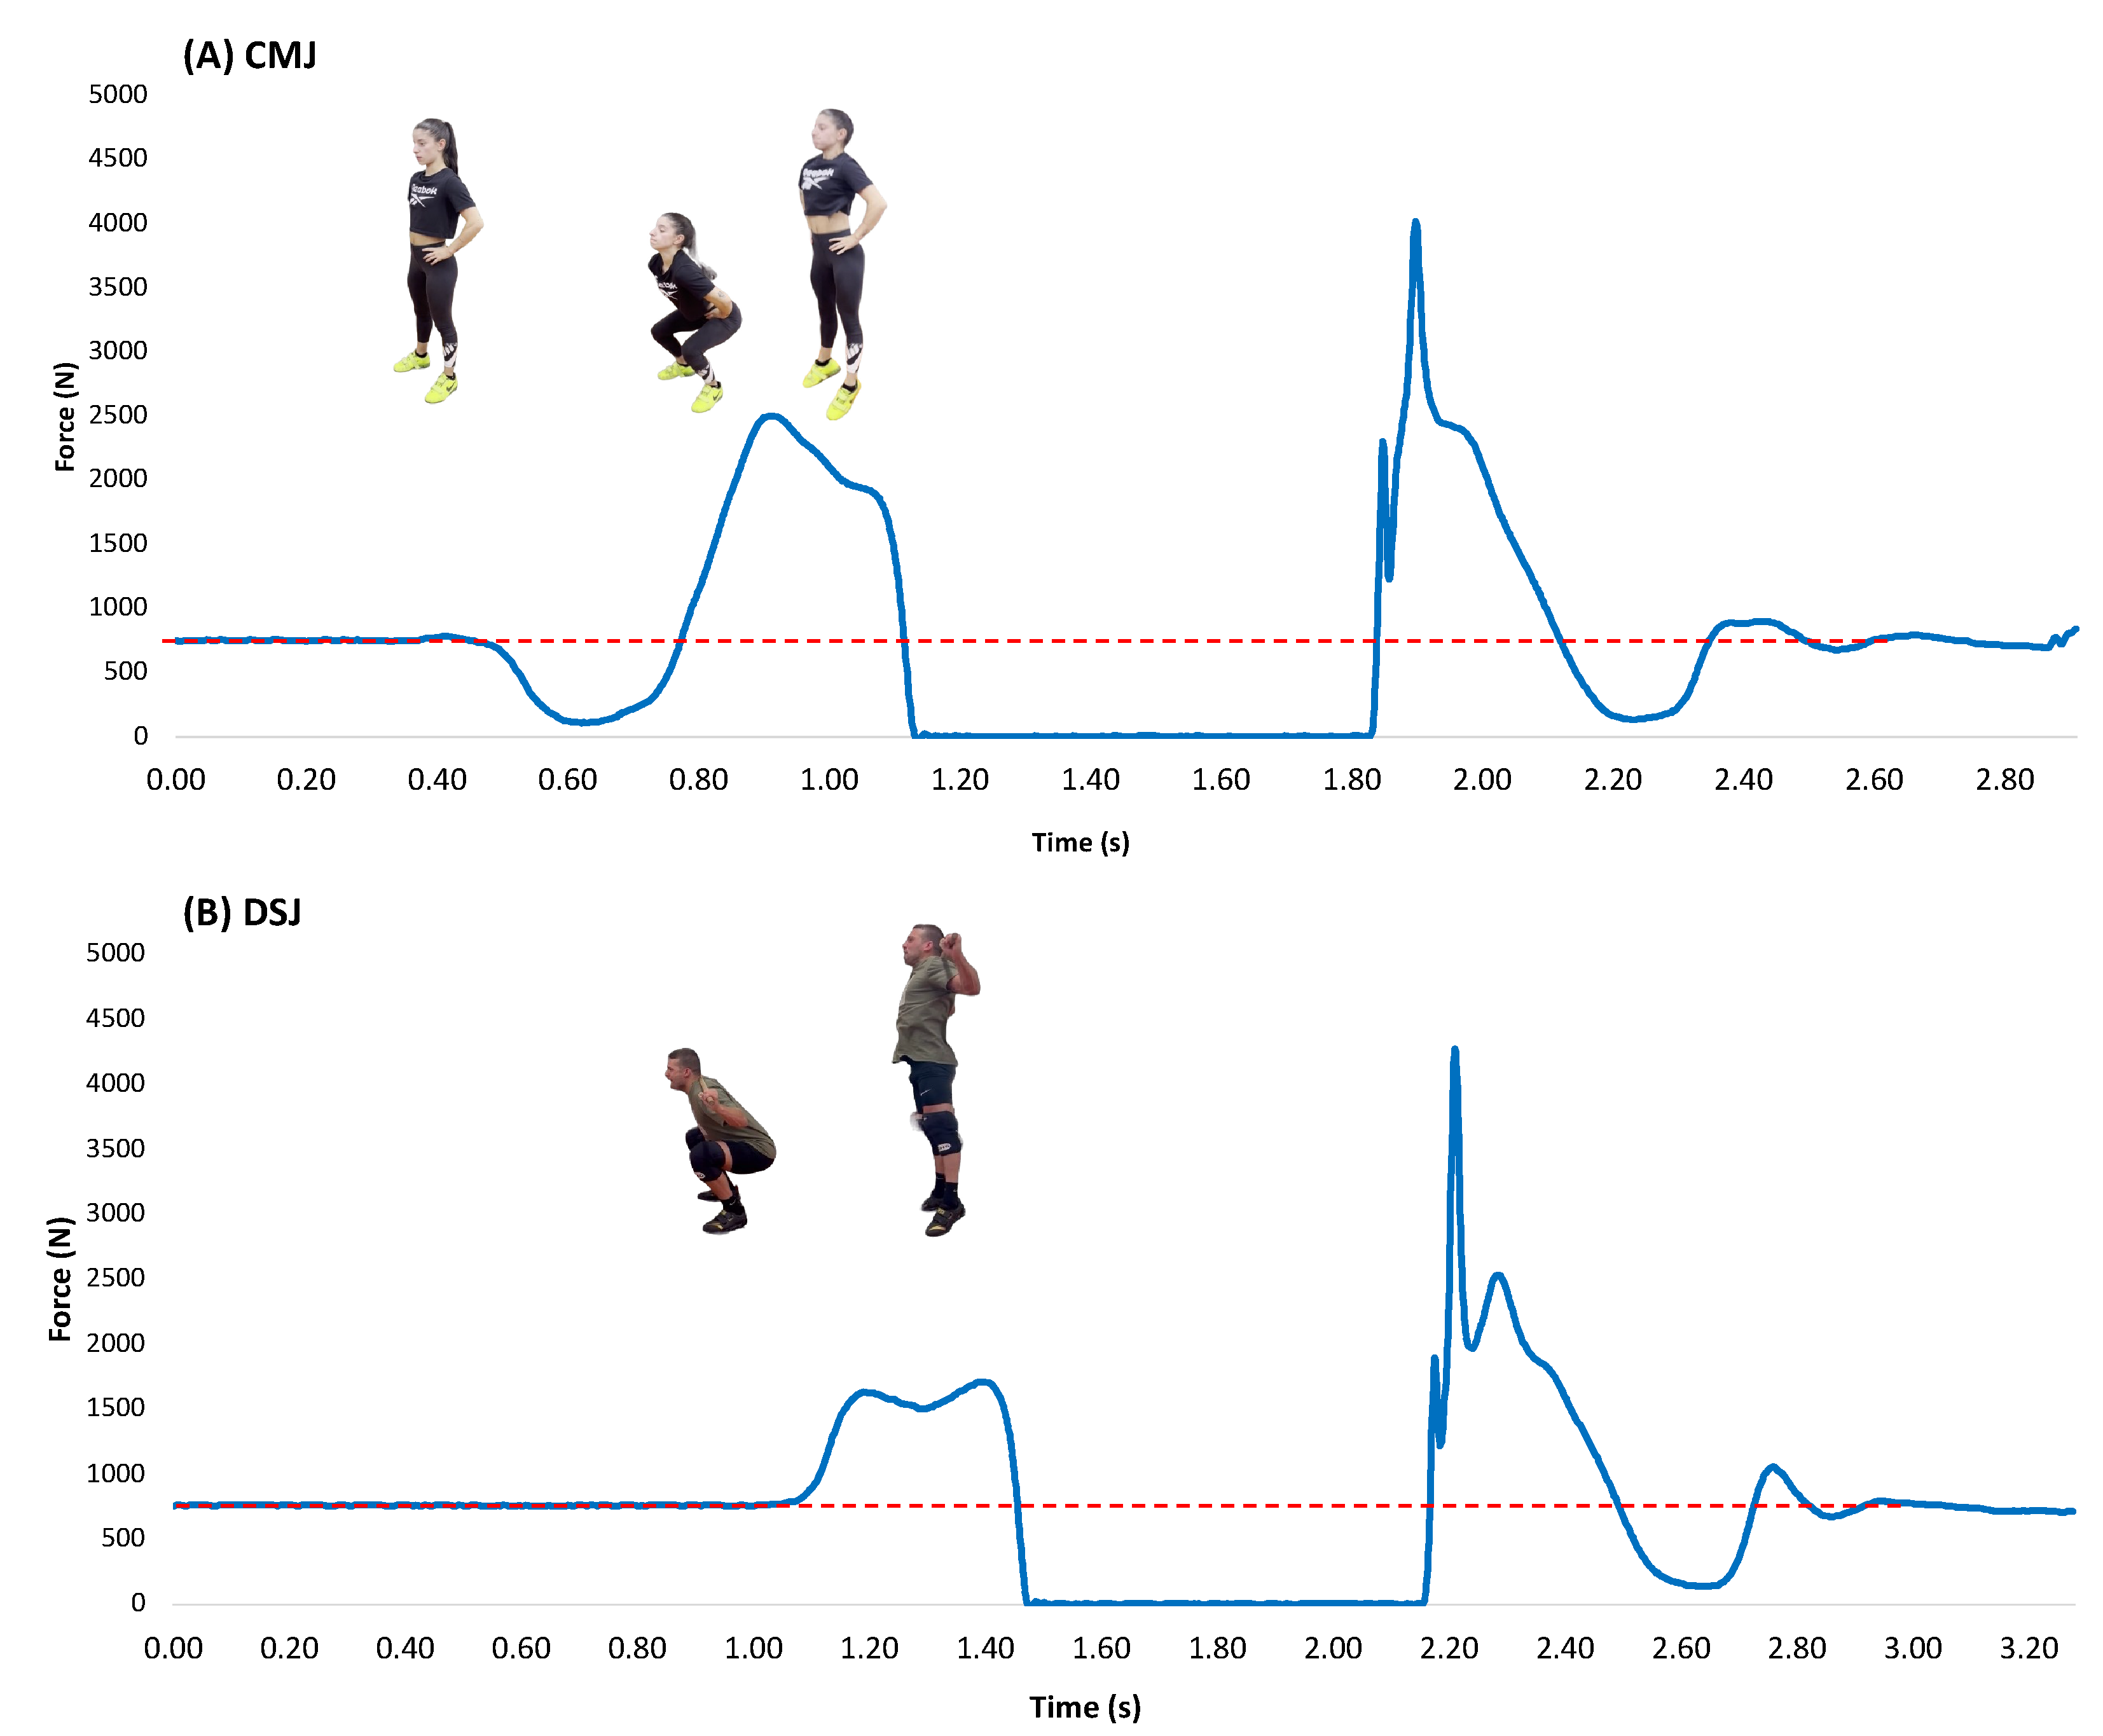
2.4. Measurement Equipment and Data Analysis
2.5. Statistical Analyses
3. Results
3.1. Descriptive Results
3.2. Associations for All Subjects
3.3. Associations for Males
3.4. Associations for Females
4. Discussion
5. Conclusions
Author Contributions
Funding
Institutional Review Board Statement
Informed Consent Statement
Data Availability Statement
Acknowledgments
Conflicts of Interest
References
- Stone, M.H.; Pierce, K.C.; Sands, W.A.; Stone, M.E. Weightlifting: A Brief Overview. Strength. Cond. J. 2006, 28, 50–66. [Google Scholar] [CrossRef]
- Chavda, S.; Hill, M.; Martin, S.; Swisher, A.; Haff, G.G.; Turner, A.N. Weightlifting: An Applied Method of Technical Analysis. Strength. Cond. J. 2021, 43, 32–42. [Google Scholar] [CrossRef]
- Soriano, M.A.; Suchomel, T.J.; Comfort, P. Weightlifting Overhead Pressing Derivatives: A Review of the Literature. Sports Med. 2019, 49, 867–885. [Google Scholar] [CrossRef]
- Joffe, S.A.; Price, P.; Chavda, S.; Shaw, J.; Tallent, J. The Relationship of Lower-Body, Multijoint, Isometric and Dynamic Neuromuscular Assessment Variables with Snatch, and Clean and Jerk Performance in Competitive Weightlifters: A Meta-Analysis. Strength. Cond. J. 2023, 45, 411–428. [Google Scholar] [CrossRef]
- Garhammer, J. A Review of Power Output Studies of Olympic and Powerlifting: Methodology, Performance Prediction, and Evaluation Tests. J. Strength Cond. Res. 1993, 7, 76–89. [Google Scholar] [CrossRef]
- Vizcaya, F.J.; Viana, O.; Del Olmo, M.F.; Acero, R.M. Could the Deep Squat Jump Predict Weightlifting Performance? J. Strength Cond. Res. 2009, 23, 729–734. [Google Scholar] [CrossRef] [PubMed]
- Chavda, S.; Lake, J.P.; Comfort, P.; Bishop, C.; Joffe, S.A.; Turner, A.N. Relationship Between Kinetic and Kinematic Measures of the Countermovement Jump and National Weightlifting Performance. J. Sci. Sport Exerc. 2023, 1–13. [Google Scholar] [CrossRef]
- Canavan, P.K.; Garrett, G.E.; Armstrong, L.E. Kinematic and Kinetic Relationships between an Olympic-Style Lift and the Vertical Jump. J. Strength Cond. Res. 1996, 10, 127–130. [Google Scholar] [CrossRef]
- Soriano, M.A.; Jimenez-Ormeno, E.; Amaro-Gahete, F.J.; Haff, G.G.; Comfort, P. How Does Lower-Body and Upper-Body Strength Relate to Maximum Split Jerk Performance? J. Strength Cond. Res. 2022, 36, 2102–2107. [Google Scholar] [CrossRef]
- Lucero, R.A.J.; Fry, A.C.; LeRoux, C.D.; Hermes, M.J. Relationships between Barbell Squat Strength and Weightlifting Performance. Int. J. Sports Sci. Coach. 2019, 14, 562–568. [Google Scholar] [CrossRef]
- Stone, M.H.; Sands, W.A.; Pierce, K.C.; Carlock, J.; Cardinale, M.; Newton, R.U. Relationship of Maximum Strength to Weightlifting Performance. Med. Sci. Sports Exerc. 2005, 37, 1037–1043. [Google Scholar]
- Joffe, S.A.; Tallent, J. Neuromuscular Predictors of Competition Performance in Advanced International Female Weightlifters: A Cross-Sectional and Longitudinal Analysis. J. Sports Sci. 2020, 38, 985–993. [Google Scholar] [CrossRef] [PubMed]
- Zecchin, A.; Puggina, E.F.; Hortobágyi, T.; Granacher, U. Association Between Foundation Strength and Weightlifting Exercises in Highly Trained Weightlifters: Support for a General Strength Component. J. Strength Cond. Res. 2023, 37, 1375–1381. [Google Scholar] [CrossRef] [PubMed]
- Carlock, J.M.; Smith, S.L.; Hartman, M.J.; Morris, R.T.; Ciroslan, D.A.; Pierce, K.C.; Newton, R.U.; Harman, E.A.; Sands, W.A.; Stone, M.H. The Relationship between Vertical Jump Power Estimates and Weightlifting Ability: A Field-Test Approach. J. Strength Cond. Res. 2004, 18, 534–539. [Google Scholar] [CrossRef] [PubMed]
- Garhammer, J.; Gregor, R. Propulsion Forces as a Function of Intensity for Weightlifting and Vertical Jumping. J. Strength Cond. Res. 1992, 6, 129–134. [Google Scholar] [CrossRef]
- Comfort, P.; Haff, G.G.; Suchomel, T.J.; Soriano, M.A.; Pierce, K.C.; Hornsby, W.G.; Haff, E.E.; Sommerfield, L.M.; Chavda, S.; Morris, S.J.; et al. National Strength and Conditioning Association Position Statement on Weightlifting for Sports Performance. J. Strength Cond. Res. 2023, 37, 1163–1190. [Google Scholar] [CrossRef]
- Zaras, N.; Stasinaki, A.N.; Spiliopoulou, P.; Hadjicharalambous, M.; Terzis, G. Lean Body Mass, Muscle Architecture, and Performance in Well-Trained Female Weightlifters. Sports 2020, 8, 67. [Google Scholar] [CrossRef] [PubMed]
- Zaras, N.; Stasinaki, A.N.; Spiliopoulou, P.; Arnaoutis, G.; Hadjicharalambous, M.; Terzis, G. Rate of Force Development, Muscle Architecture, and Performance in Elite Weightlifters. Int. J. Sports Physiol. Perform. 2021, 16, 216–223. [Google Scholar] [CrossRef] [PubMed]
- Glassbrook, D.J.; Helms, E.R.; Brown, S.R.; Storey, A.G. A Review of the Biomechanical Differences between the High-Bar and Low-Bar Back-Squat. J. Strength Cond. Res. 2017, 31, 2618–2634. [Google Scholar] [CrossRef]
- McGuigan, M.R.; Kane, M.K. Reliability of Performance of Elite Olympic Weightlifters. J. Strength Cond. Res. 2004, 18, 650–653. [Google Scholar] [CrossRef]
- Badby, A.J.; Mundy, P.D.; Comfort, P.; Lake, J.P.; McMahon, J.J. The Validity of Hawkin Dynamics Wireless Dual Force Plates for Measuring Countermovement Jump and Drop Jump Variables †. Sensors 2023, 23, 4820. [Google Scholar] [CrossRef]
- Merrigan, J.J.; Stone, J.D.; Galster, S.M.; Hagen, J.A. Analyzing Force-Time Curves: Comparison of Commercially Available Automated Software and Custom MATLAB Analyses. J. Strength Cond. Res. 2022, 36, 2387–2402. [Google Scholar] [CrossRef] [PubMed]
- Koo, T.K.; Li, M.Y. A Guideline of Selecting and Reporting Intraclass Correlation Coefficients for Reliability Research. J. Chiropr. Med. 2016, 15, 155–163. [Google Scholar] [CrossRef] [PubMed]
- Hopkins, W.G.; Marshall, S.W.; Batterham, A.M.; Hanin, J. Progressive Statistics for Studies in Sports Medicine and Exercise Science. Med. Sci. Sports Exerc. 2009, 41, 3. [Google Scholar] [CrossRef] [PubMed]
- MacKenzie, S.J.; Lavers, R.J.; Wallace, B.B. A Biomechanical Comparison of the Vertical Jump, Power Clean, and Jump Squat. J. Sports Sci. 2014, 32, 1576–1585. [Google Scholar] [CrossRef] [PubMed]
- Hakkinen, K.; Kauhanen, H.; Komi, P.V. Biomechanical Changes in the Olympic Weightlifting Technique of the Snatch and Clean and Jerk from Submaximal to Maximal Loads. Scand. J. Sports Sci. 1984, 6, 57–66. [Google Scholar]
- McMahon, J.J.; Lake, J.P.; Ripley, N.J.; Comfort, P. Vertical Jump Testing in Rugby League: A Rationale for Calculating Take-off Momentum. J. Appl. Biomech. 2020, 36, 370–374. [Google Scholar] [CrossRef]
- Jaric, S.; Mirkov, D.; Markovic, G. Normalizing Physical Performance Tests for Body Size: A Proposal for Standardization. J. Strength Cond. Res. 2005, 19, 467–474. [Google Scholar] [CrossRef]


| Metrics | Mean ± SD | LL 95% CI | UL 95% CI | CV (%) | Min | Max |
|---|---|---|---|---|---|---|
| Males | ||||||
| Snatch (kg) | 141.33 ± 13.78 | 130.31 | 152.36 | 10 | 118.00 | 155.00 |
| Relative snatch (kg/kg) | 1.94 ± 0.14 | 1.73 | 1.95 | 8 | 1.63 | 2.00 |
| C&J (kg) | 171.5 ± 19.92 | 155.56 | 187.44 | 12 | 140.00 | 193.00 |
| Relative C&J (kg/kg) | 2.23 ± 0.14 | 2.12 | 2.34 | 6 | 2.02 | 2.38 |
| Back squat (kg) | 211.67 ± 22.29 | 193.83 | 229.50 | 11 | 185.00 | 240.00 |
| Relative back squat (kg/kg) | 2.76 ± 0.22 | 2.58 | 2.93 | 8 | 2.52 | 3.14 |
| Front squat (kg) | 192.67 ± 23.85 | 173.59 | 211.75 | 12 | 160.00 | 225.00 |
| Relative front squat (kg/kg) | 2.51 ± 0.24 | 2.32 | 2.70 | 10 | 2.15 | 2.80 |
| CMJ height (m) | 0.53 ± 0.07 | 0.48 | 0.58 | 12 | 0.45 | 0.60 |
| CMJ prop net impulse (N·s) | 251.81 ± 39.58 | 220.14 | 283.48 | 16 | 178.59 | 285.36 |
| CMJ PP (W) | 5498.40 ± 1062.84 | 4647.97 | 6348.83 | 19 | 3646.13 | 6497.64 |
| CMJ relative PP (W/kg) | 70.74 ± 6.65 | 65.42 | 76.07 | 9 | 61.87 | 77.41 |
| DSJ height (m) | 0.51 ± 0.06 | 0.46 | 0.56 | 12 | 0.41 | 0.58 |
| DSJ prop net impulse (N·s) | 247.67 ± 35.45 | 219.31 | 276.04 | 14 | 182.33 | 273.17 |
| DSJ PP (W) | 4921.07 ± 710.21 | 4352.799 | 5489.34 | 14 | 3592.13 | 5452.99 |
| DSJ relative PP (W/kg) | 63.77 ± 5.31 | 59.52 | 68.01 | 8 | 54.76 | 69.52 |
| Females | ||||||
| Snatch (kg) | 81.43 ± 7.61 | 75.80 | 87.07 | 9 | 72.00 | 92.00 |
| Relative snatch (kg/kg) | 1.42 ± 0.07 | 1.37 | 1.47 | 5 | 1.32 | 1.51 |
| C&J (kg) | 100.14 ± 9.94 | 92.78 | 107.51 | 10 | 83.00 | 115.00 |
| Relative C&J (kg/kg) | 1.74 ± 0.06 | 1.70 | 1.74 | 4 | 1.68 | 1.85 |
| Back squat (kg) | 131.43 ± 13.76 | 121.24 | 141.62 | 11 | 105.00 | 150.00 |
| Relative back squat (kg/kg) | 2.29 ± 0.12 | 2.20 | 2.38 | 5 | 2.17 | 2.53 |
| Front squat (kg) | 114.29 ± 10.95 | 106.17 | 122.40 | 10 | 94.00 | 127.00 |
| Relative front squat (kg/kg) | 1.99 ± 0.07 | 1.94 | 2.04 | 4 | 1.87 | 2.10 |
| CMJ height (m) | 0.40 ± 0.07 | 0.35 | 0.45 | 16 | 0.28 | 0.46 |
| CMJ prop net impulse (N·s) | 161.46 ± 21.15 | 145.79 | 177.13 | 13 | 136.63 | 194.60 |
| CMJ PP (W) | 3329.47 ± 455.85 | 2991.78 | 3667.17 | 14 | 2755.31 | 4057.07 |
| CMJ relative PP (W/kg) | 58.11 ± 6.95 | 52.96 | 63.27 | 12 | 47.78 | 65.65 |
| DSJ height (m) | 0.37 ± 0.07 | 0.32 | 0.42 | 19 | 0.27 | 0.44 |
| DSJ prop net impulse (N·s) | 157.50 ± 19.96 | 142.71 | 172.28 | 13 | 137.24 | 187.61 |
| DSJ PP (W) | 2886.35 ± 435.76 | 2563.90 | 3208.81 | 15 | 2213.12 | 3384.73 |
| DSJ relative PP (W/kg) | 50.52 ± 7.98 | 44.61 | 56.43 | 16 | 38.37 | 58.26 |
| Males | Females | ||||
|---|---|---|---|---|---|
| Test | Metrics | Snatch Performance (kg) | Clean and Jerk Performance (kg) | Snatch Performance (kg) | Clean and Jerk Performance (kg) |
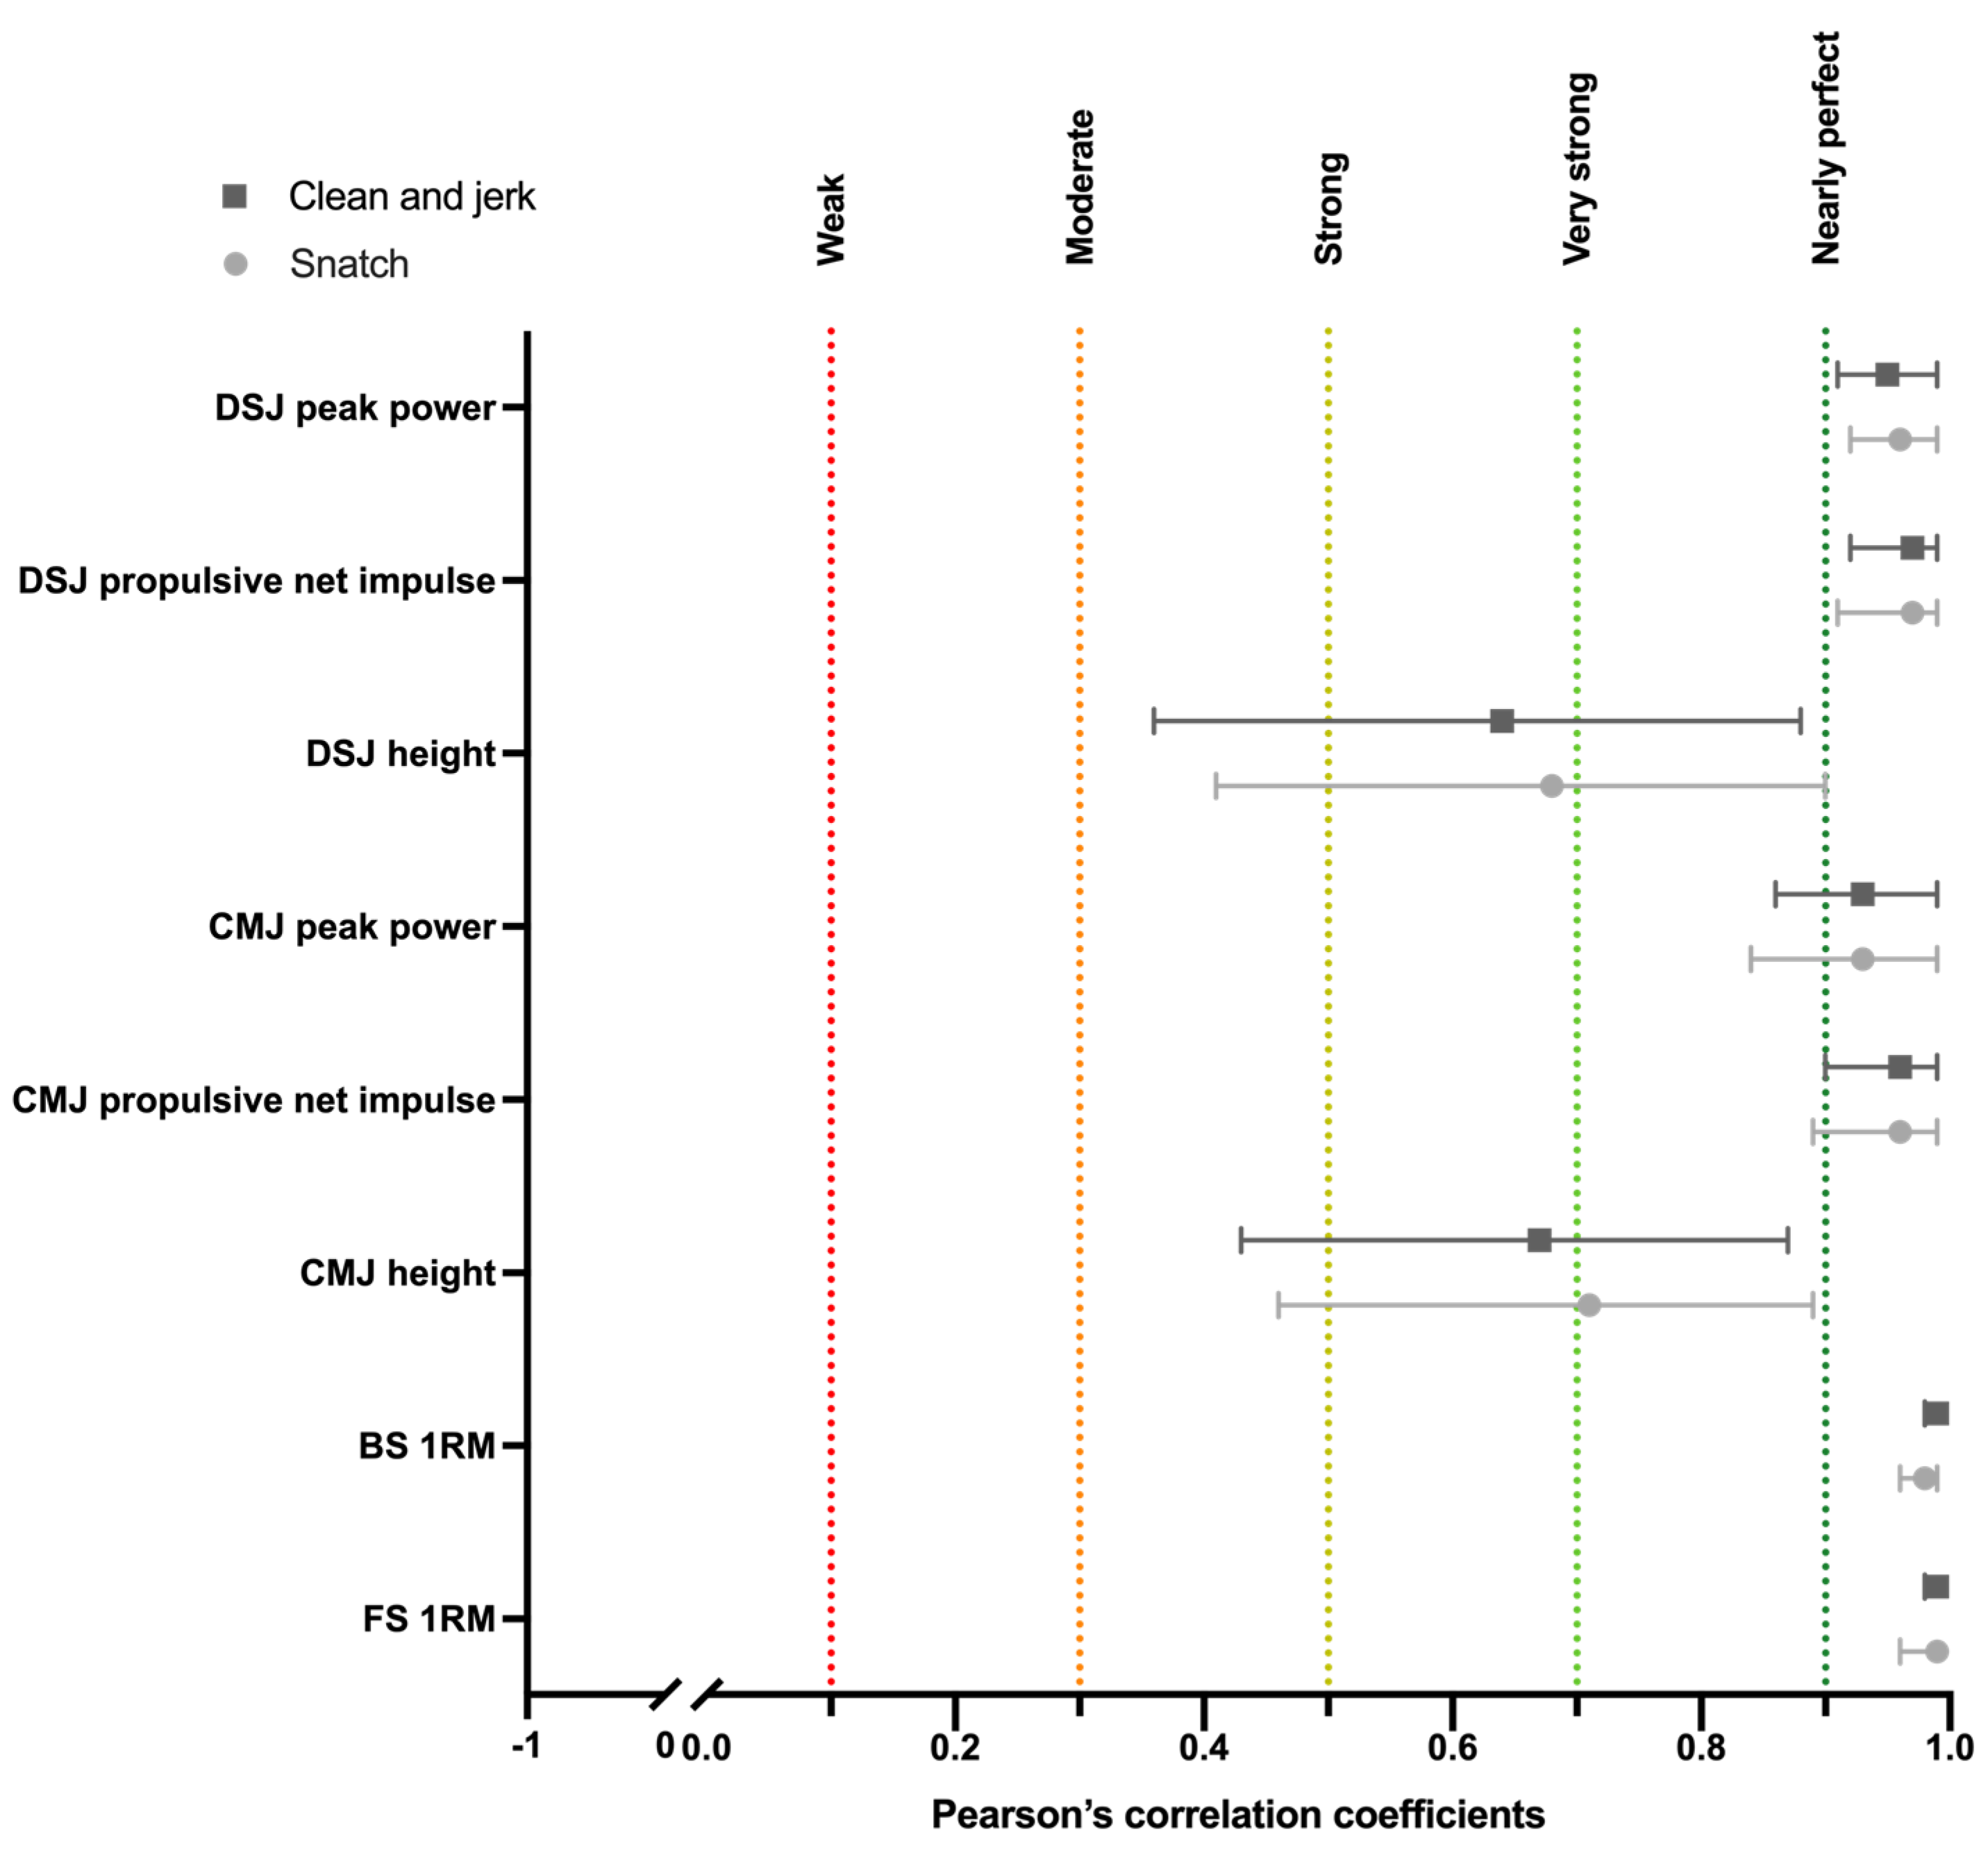
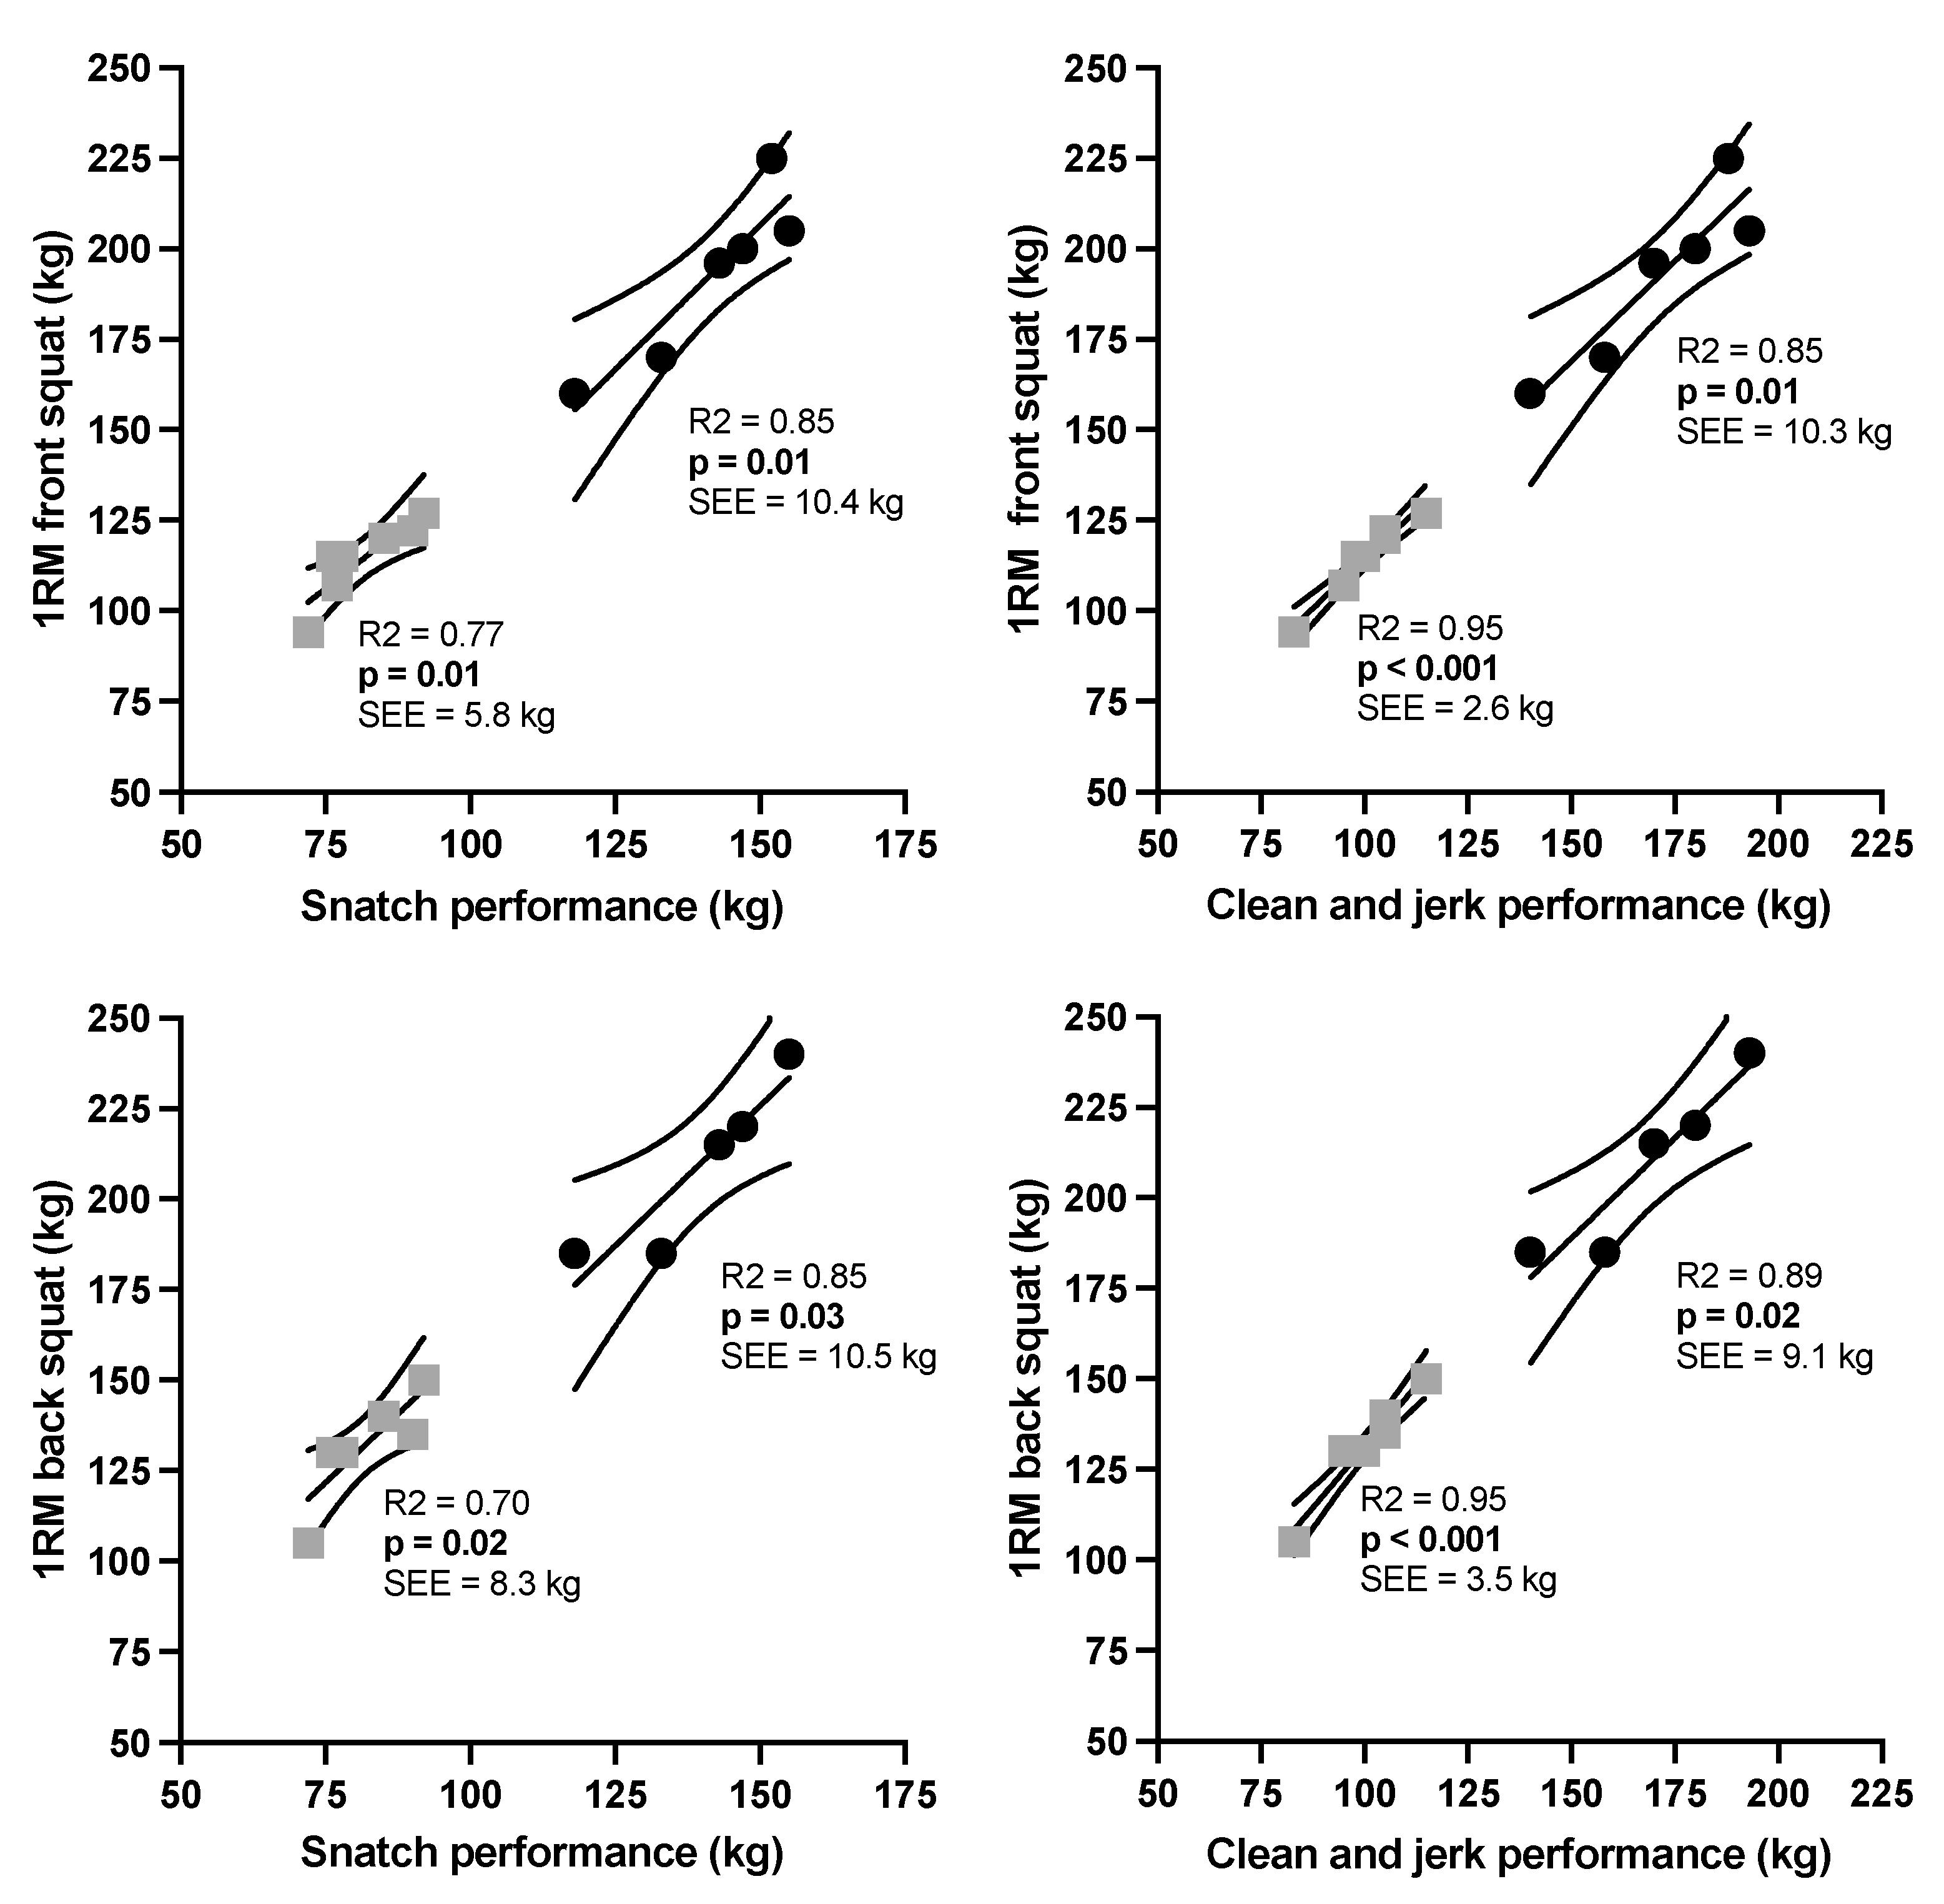
| FS | 1RM (95% CI) [Interpretation] [Fisher’s z] | r = 0.92 **(0.56–1.00) [Nearly perfect] [1.6] | r = 0.92 ** (0.57–1.00) [Nearly perfect] [1.6] | r = 0.88 ** (0.74–1.00) [Very strong] [1.4] | r = 0.98 *** (0.94–1.00) [Nearly perfect] [2.2] |
| BS | 1RM (95% CI) [Interpretation] [Fisher’s z] | r = 0.93 * (0.79–1.00) [Nearly perfect] [1.6] | r = 0.94 * (0.80–1.00) [Nearly perfect] [1.8] | r = 0.84 * (0.66–1.00) [Very strong] [1.2] | r = 0.97 *** (0.84–1.00) [Nearly perfect] [2.2] |
| CMJ | Jump height (95% CI) [Interpretation] [Fisher’s z] | r = 0.05 (−0.97–0.92) [Very weak] [0.1] | r = −0.05 (−0.97–0.92) [Very weak] [0.1] | r = −0.02 (−0.95–0.69) [Very weak] [0.0] | r = 0.67 (0.43–0.87) [Strong] [0.81] |
| Prop net impulse (95% CI) [Interpretation] [Fisher’s z] | r = 0.96 ** (0.25–1.00) [Nearly perfect] [1.9] | r = 0.93 ** (0.30–1.00) [Nearly perfect] [1.7] | r = 0.87 * (0.46–0.99) [Very strong] [1.3] | r = 0.81 * (0.33–1.00) [Very strong] [1.1] | |
| Peak power (95% CI) [Interpretation] [Fisher’s z] | r = 0.84 * (−0.22–1.00) [Very strong] [1.6] | r = 0.81 * (−0.20–0.94) [Very strong] [1.4] | r = 0.67 (−0.05–0.95) [Strong] [0.8] | r = 0.65 (−0.09–0.99) [Strong] [0.8] | |
| DSJ | Jump height (95% CI) [Interpretation] [Fisher’s z] | r = −0.12 (−0.93–0.97) [Very weak] [0.1] | r = −0.22 (−0.94–0.98) [Very weak] [0.2] | r = 0.67 (−0.05–0.95) [Strong] [0.8] | r = 0.65 (−0.09–0.99) [Strong] [0.8] |
| Prop net impulse (95% CI) [Interpretation] [Fisher’s z] | r = 0.96 ** (0.16–1.00) [Nearly perfect] [2.0] | r = 0.93 ** (0.25–1.00) [Nearly perfect] [1.7] | r = 0.80 * (0.08–0.99) [Very strong] [1.1] | r = 0.76 * (0.14–0.99) [Very strong] [1.0] | |
| Peak power (95% CI) [Interpretation] [Fisher’s z] | r = 0.84 * (−0.22–1.00) [Very strong] [1.6] | r = 0.81 * (−0.20–0.94) [Very strong] [1.4] | r = 0.53 (−0.24–0.96) [Strong] [0.6] | r = 0.44 (−0.34–0.98) [Moderate] [0.5] | |
Disclaimer/Publisher’s Note: The statements, opinions and data contained in all publications are solely those of the individual author(s) and contributor(s) and not of MDPI and/or the editor(s). MDPI and/or the editor(s) disclaim responsibility for any injury to people or property resulting from any ideas, methods, instructions or products referred to in the content. |
© 2024 by the authors. Licensee MDPI, Basel, Switzerland. This article is an open access article distributed under the terms and conditions of the Creative Commons Attribution (CC BY) license (https://creativecommons.org/licenses/by/4.0/).
Share and Cite
Soriano, M.A.; Flores, F.J.; Lama-Arenales, J.; Fernández-del-Olmo, M.; Comfort, P. Neuromuscular Capabilities in Top-Level Weightlifters and Their Association with Weightlifting Performance. Appl. Sci. 2024, 14, 3762. https://doi.org/10.3390/app14093762
Soriano MA, Flores FJ, Lama-Arenales J, Fernández-del-Olmo M, Comfort P. Neuromuscular Capabilities in Top-Level Weightlifters and Their Association with Weightlifting Performance. Applied Sciences. 2024; 14(9):3762. https://doi.org/10.3390/app14093762
Chicago/Turabian StyleSoriano, Marcos A., Francisco J. Flores, Juan Lama-Arenales, Miguel Fernández-del-Olmo, and Paul Comfort. 2024. "Neuromuscular Capabilities in Top-Level Weightlifters and Their Association with Weightlifting Performance" Applied Sciences 14, no. 9: 3762. https://doi.org/10.3390/app14093762
APA StyleSoriano, M. A., Flores, F. J., Lama-Arenales, J., Fernández-del-Olmo, M., & Comfort, P. (2024). Neuromuscular Capabilities in Top-Level Weightlifters and Their Association with Weightlifting Performance. Applied Sciences, 14(9), 3762. https://doi.org/10.3390/app14093762