1. Introduction
1.1. Electrical Motor Diagnostics and Switched Reluctance Motor Characteristics
In recent years, electric drives have increased in popularity in various industries, especially in transport, i.e., passenger cars, buses, and other utility and military vehicles. On the one hand, this phenomenon entails their miniaturization and automation. On the other hand, challenges with their reliability and safety usage are rising. While failures or downtime of electric motors in everyday household appliances are usually not of great importance, in places such as production lines, construction machines, railways, or mines, they can result in significant financial losses and even human casualties. Therefore, proper monitoring and reliability management are essential.
Identifying the variety of motor faults and their severity is challenging, and an electric machine is only a single component of the entire electric drive. Nevertheless, each specific fault has its unique features in the measured signal. These physical attributes can facilitate identifying the degree of specific fault and even the range to the critical point of stopping the motor considering the specific kind of electrical machine.
A switched reluctance motor (SRM) was selected for this research regarding the high durability requirements for special applications. Among its advantages is that the SRM is built of iron and does not have permanent magnets. Therefore, there is no risk of demagnetization due to a strong magnetic field or high temperature. It has a suitable compact design, thanks to which it can rotate at a speed of over 10,000 rpm [
1].
1.2. Literature References
Electric motor diagnostics and fault monitoring have existed since they were invented and are in operation. The defects they may undergo can be divided into electrical and mechanical ones. Typical motor mechanical faults might be bearing failure, rotor eccentricity (air-gap irregularity), broken rotor bars, cracked end rings, bent shaft, bolt loosening, gearbox failure, etc. [
2]. Nevertheless, more efficient diagnostic tools have been developed in recent years, such as finite element methods, techniques based on the frequency domain, model-based techniques, and the application of pattern recognition [
2].
Apart from classic spectrum analysis for stationary signals, instantaneous frequency analysis and the Wigner distributions as time-frequency analysis methods can be applied in variable-speed drives, e.g., with faults causing load torque oscillation [
3].
Excluding some specific cases for a particular type of electric motor, the SRM is susceptible to the same types of faults each machine can undergo.
The SRM can experience a wide range of electrical fault types, such as open- and short-circuit faults in power switches, open-phase winding, and zero-output current sensors faults [
4], as in power transistors of the full-bridge power converter (FBPC) [
5]. There are also methods of diagnosing lesser-known faults, such as the high-resistance connection (HRC) fault, using a multisensor calibrated transformer with shifted windows (MSSwin-T) [
6].
As for the mechanical faults modeling, the dynamic eccentricity in the SRM can be simulated using the finite element method coupled with dynamic equations developed by MATLAB/Simulink™ software and then applied, e.g., for torque analysis using the FEA-TFR approach [
7].
The experimental method of SRM eccentricity diagnostics can consist of monitoring the offline and standstill modes by utilizing the fault signature as a differential-induced voltage, achieved by injecting diagnostic pulses into the motor windings [
8]. The winding method can also measure and reduce the effects of rotor eccentricity on the SRM. The currents in the windings can be adjusted in parallel paths, reducing unbalanced magnetic forces [
9]. The eccentricity fault can also be detected by the measurement of mutual fluxes and mutually induced voltages, as it is observed that mutual fluxes increase with an increase in the eccentricity percent [
10]. The degree and location of the dynamic eccentricity fault can also be determined using produced current signature calculation algorithms and detection patterns named ELDP [
11].
Another widely used signal for eccentricity testing is the machine casing’s acceleration (vibration) signal. Monitoring it can diagnose inter-turn faults and rotor eccentricity in SRMs. The forces can be detected on the machine by accelerometers [
12].
SRMs are also used as traction drives in electric vehicles. There is a fault diagnosis of the rotor position sensor based on a sliding mode observer (SMO) and an average torque estimator, which can be applied to light electric vehicles (LEV) [
13]. Motors installed in-wheel can undergo a coordination control method that is proposed to achieve vehicles’ vibration suppression and braking energy recovery, considering motor eccentricity [
14]. This fault also causes an unbalanced magnetic pull of the wheel motor on vehicle dynamics, which can be addressed with Maxwell’s stress method and the principle of virtual displacement [
15]. The air-gap eccentricity also affects the handling stability of electric vehicles (EVs) [
16]. SRMs are also being tested as traction motors in EVs for bearing failures in static and dynamic states using the Hilbert transform and the Bayesian optimized neural network (BoNN) [
17].
There are also comprehensive methods for testing the SRM at the motor and generator phases of operation, using diagnostic tools such as the k-out-of-n: G model and the reliability block diagram model [
18].
1.3. Paper Novelty and Contents
Considering the SRM diagnostics research, a distinguishable deficit exists between those carried out on a physical with suitable universal application purposes and those based only on simulation and mathematical modelling. Experimental motor diagnostics with mechanical faults are rare and, in the case of SRMs, almost nonexistent, probably due to the necessary interference with the motor’s construction, required by precise technical knowledge and competence with setting a given damage (disassembling the original bearing, etc.). Also, after such experiments, the motor can be irretrievably broken.
The authors overcame these adversities by constructing a test stand for SRM diagnostics. It included particular elements for setting the mechanical faults, i.e., a sleeve with a bearing support for the dynamic eccentricity and a disc for the imbalance. The instrumentation was comprised of dynamic load control software written in LabView 2023.
The appropriate design of the measurement station allows for a wide range of diagnostic tests in the electric motor. It is possible to freely change the load and motor speed ranges for different types of eccentricity and imbalance.
The author’s approach allowed for illustrating a comparison between two motors’ states (faulty and proper operation) utilizing the real-time, physical signal (acceleration and phase current) of the SRM. The analysis employed fast Fourier transform (FFT) on the measured signal spectrum at a constant motor speed for different torque loads and the rotational speed of the SRM. The results obtained during an experiment on a real object can demonstrate the universal effects of the given faults wherever the SRM is applied.
The rest of the paper is organized in the following manner:
The succeeding chapter describes the construction of the reluctance motor along with its principle of operation and properties. The test stand—with mechanical devices for inflicting damage and electronics for acquiring measurements—is also presented in detail. The following section presents and compares the selected results obtained from it. In the end, the results obtained were interpreted, and the hypothesis posed at the beginning of this paper was replied to. Additionally, proposals for further research on this issue are indicated.
2. Materials and Methods
2.1. Switched Reluctance Motor Construction
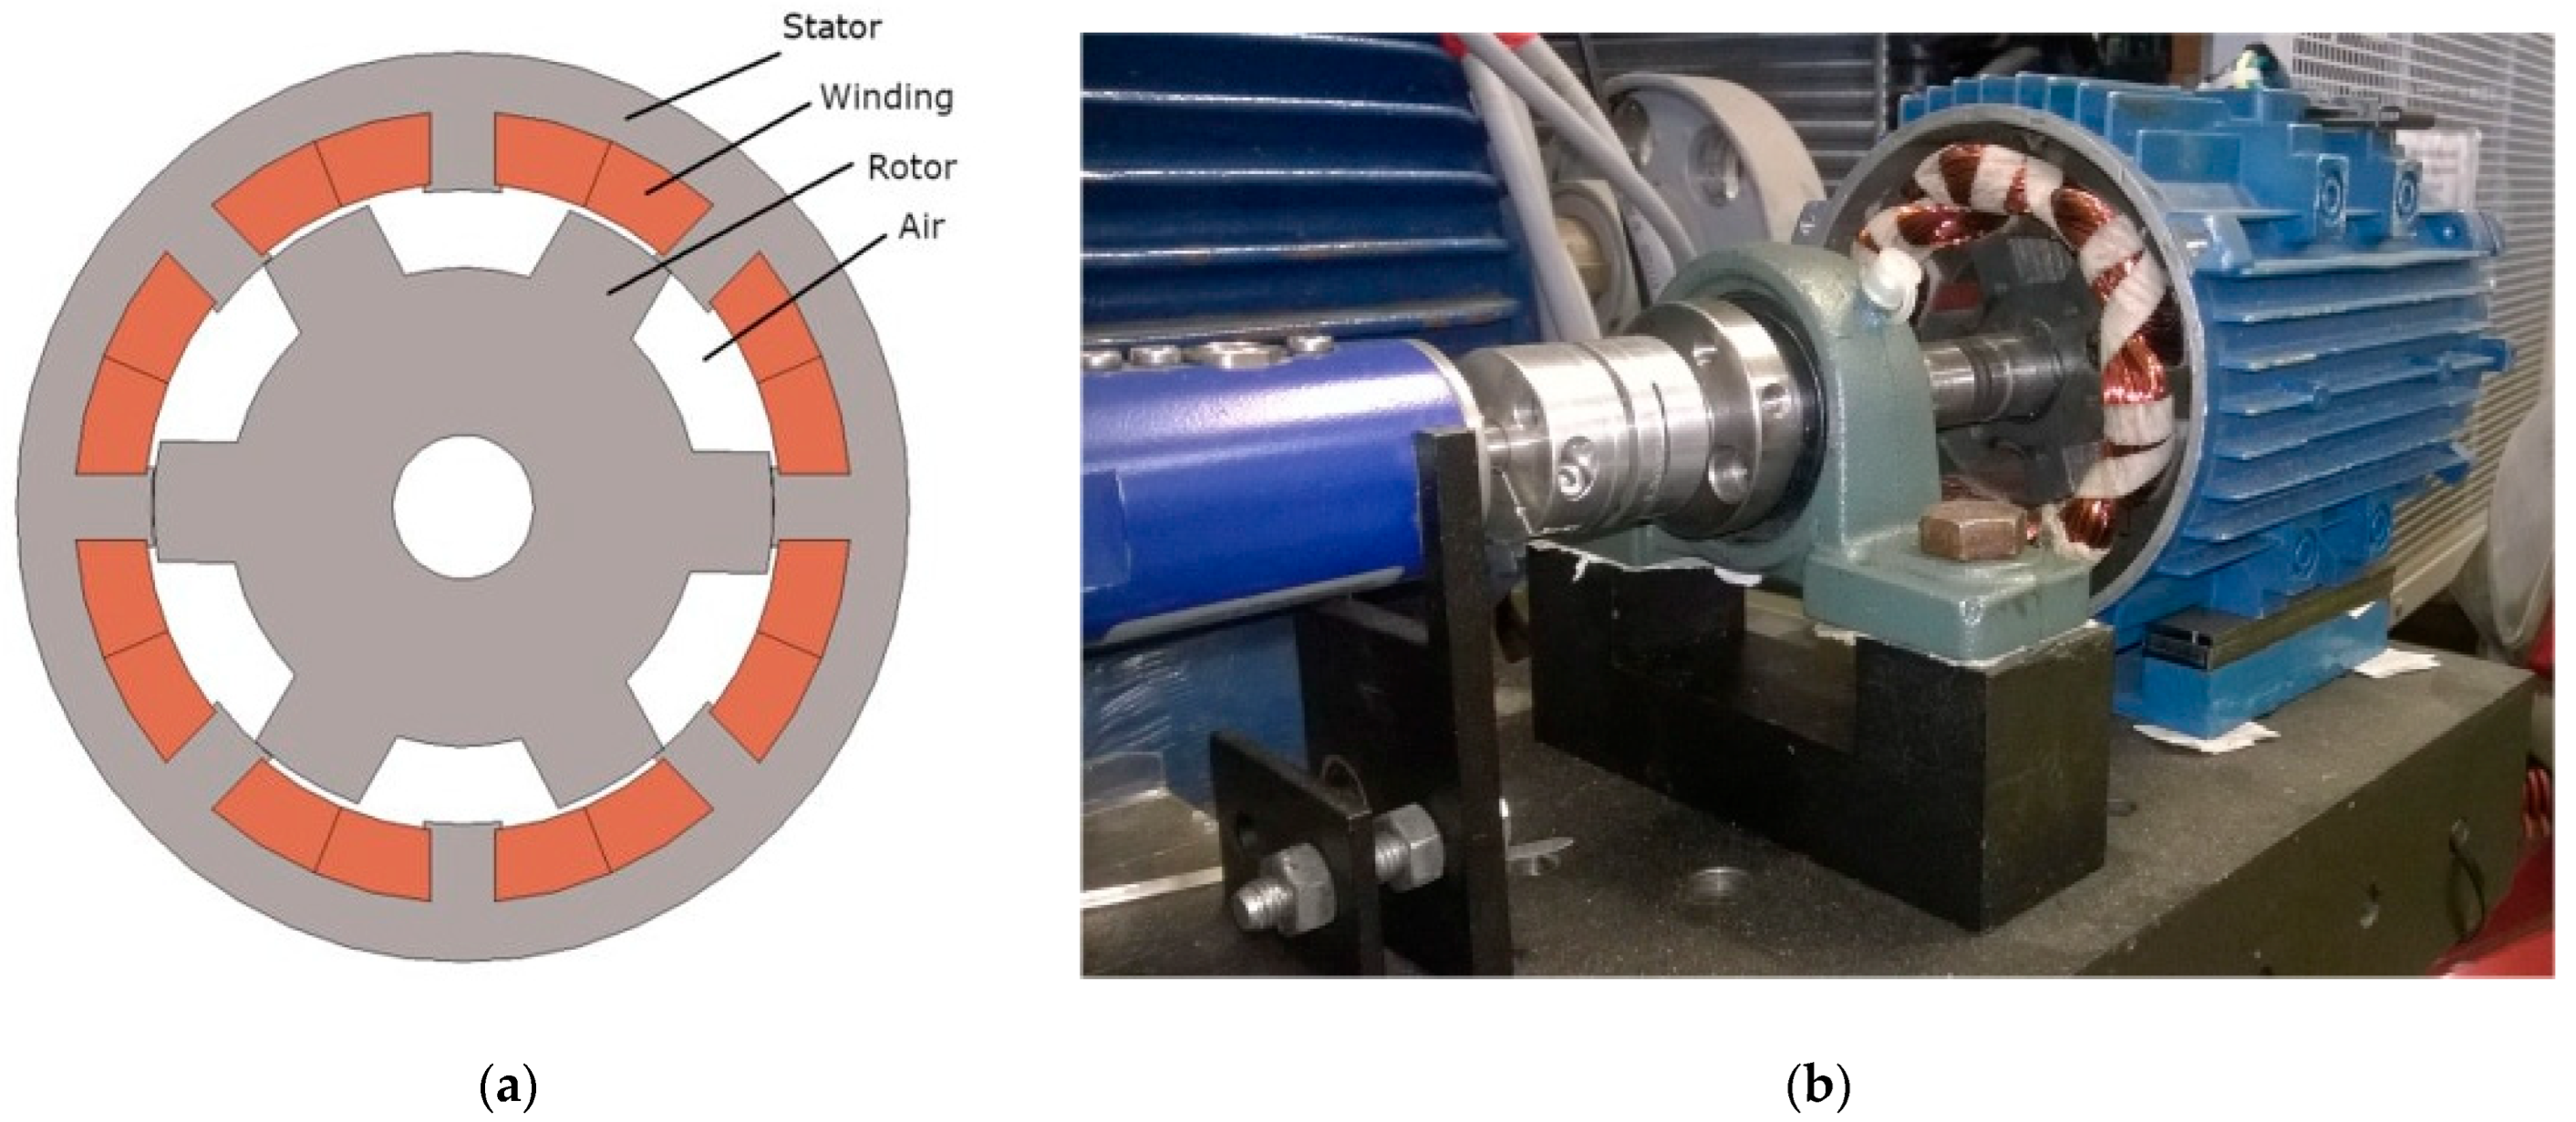
The SRM is a brushless electric motor with salient poles on the rotor and stator and is made of iron (
Figure 1a,b).
The magnetic circuit in this motor is asymmetrical—there are different numbers of rotor and stator poles (usually more of them on the stator). With the rotation of the rotor, the power supply is delivered accordingly to the subsequent stator phases to produce a reluctance torque. The magnetic flux also changes dynamically, and thus its inverse—reluctance—hence the name of the motor.
The electric phase equation of the motor can be represented as follows—the induced voltage in the motor is given by the following equation:
where
φ is the phase flux,
i is the current running through the
k phase, and
R is the resistance on the semiconductor elements. The flux (
φ) is nonlinear, depending on the phase current (
i) and rotor rotation angle value. Consequently, phase voltage
Uk is also nonlinear.
Although permanent magnet or induction motors are more common due to their higher energy density, the SRM is preferred for its more robust durability and reliability to external (e.g., environmental) factors such as high temperature, humidity, or electromagnetic interaction. It can also reach a very high rotational speed, even exceeding 10,000 rpm. Due to the lack of magnets, there is no risk of demagnetization of the material by extreme temperatures or electromagnetic pulses. Examples of the employment of reluctance motors are fiber spinners, conveyor belts, group travel drives, electro spindles, actuators, wrapping and folding machines, dosing pumps, equipment for industrial processes, etc.
2.2. Electric Motor Faults and Diagnostic Methods
2.2.1. Introduction to Diagnostics
Diagnostics was initially applied in medicine and used in technical applications afterward. Therefore, in the field of technology, the term diagnosis can be understood as an analysis of the temporary technical condition of machines or an assessment of the ability to operate the object. Its most important tasks are as follows:
Detection—detection of the occurrence of an emerging failure;
Location—determination of the location, a defective part, or link of the failure that arises;
Specification—determination of the cause of the failure;
Forecast—determining the remaining period of possible operation to plan the appropriate and favorable date of repair and ensure the necessary logistics activities.
The examined object is the SRM, and as was mentioned, it is primarily operated in locations of military or industrial importance, where the replacement or repair of the mechanism can be complicated, and such an activity must be carefully planned. The type and degree of fault will determine the downtime length and the repair’s complexity.
An appropriate test plan and measuring tools are necessary to identify any fault in a given electric motor. For this purpose, various physical quantities of the motor can be analyzed during its operation. Usually, these are vibrations (acceleration), phase currents, or the voltage at the motor terminals. Sometimes, the temperature measurement or one of the magnetic quantities (field strength, flux, or other) is met.
In addition to experimenting on the stand, it is also recommended to simulate it using an analytical or having it based on the finite element method (FEM) model. It allows the study of the object’s behavior almost cost-free in ideal conditions. Indeed, this is only sometimes possible, e.g., when experimenting with coupled mechanical, electrical, temperature, and other test-related phenomena that are impossible to include in the computer model.
2.2.2. Electric Motor Faults
Every electric motor, including the SRM, is susceptible to several types of faults, generally divided into mechanical and electrical ones.
The electrical faults in electric motors can be distinguished as the following [
19]:
An open or short circuit in motor windings (mainly due to winding insulation failure);
Wrong connection of windings;
High-resistance contact with the conductor;
Wrong or unstable ground.
The mechanical faults in electric motors can be distinguished as the following:
Bearing failure;
Gearbox failure;
Air-gap irregularity;
Bent shaft;
Bolt loosening.
The motor drive failures in electric motors can be distinguished as the following:
2.2.3. Eccentricity and Imbalance
The two mechanical faults mentioned above were investigated in this study: dynamic eccentricity and imbalance. They were selected because they are some of the most frequent mechanical defects in electric motors, and it is possible to design appropriate tools for setting them.
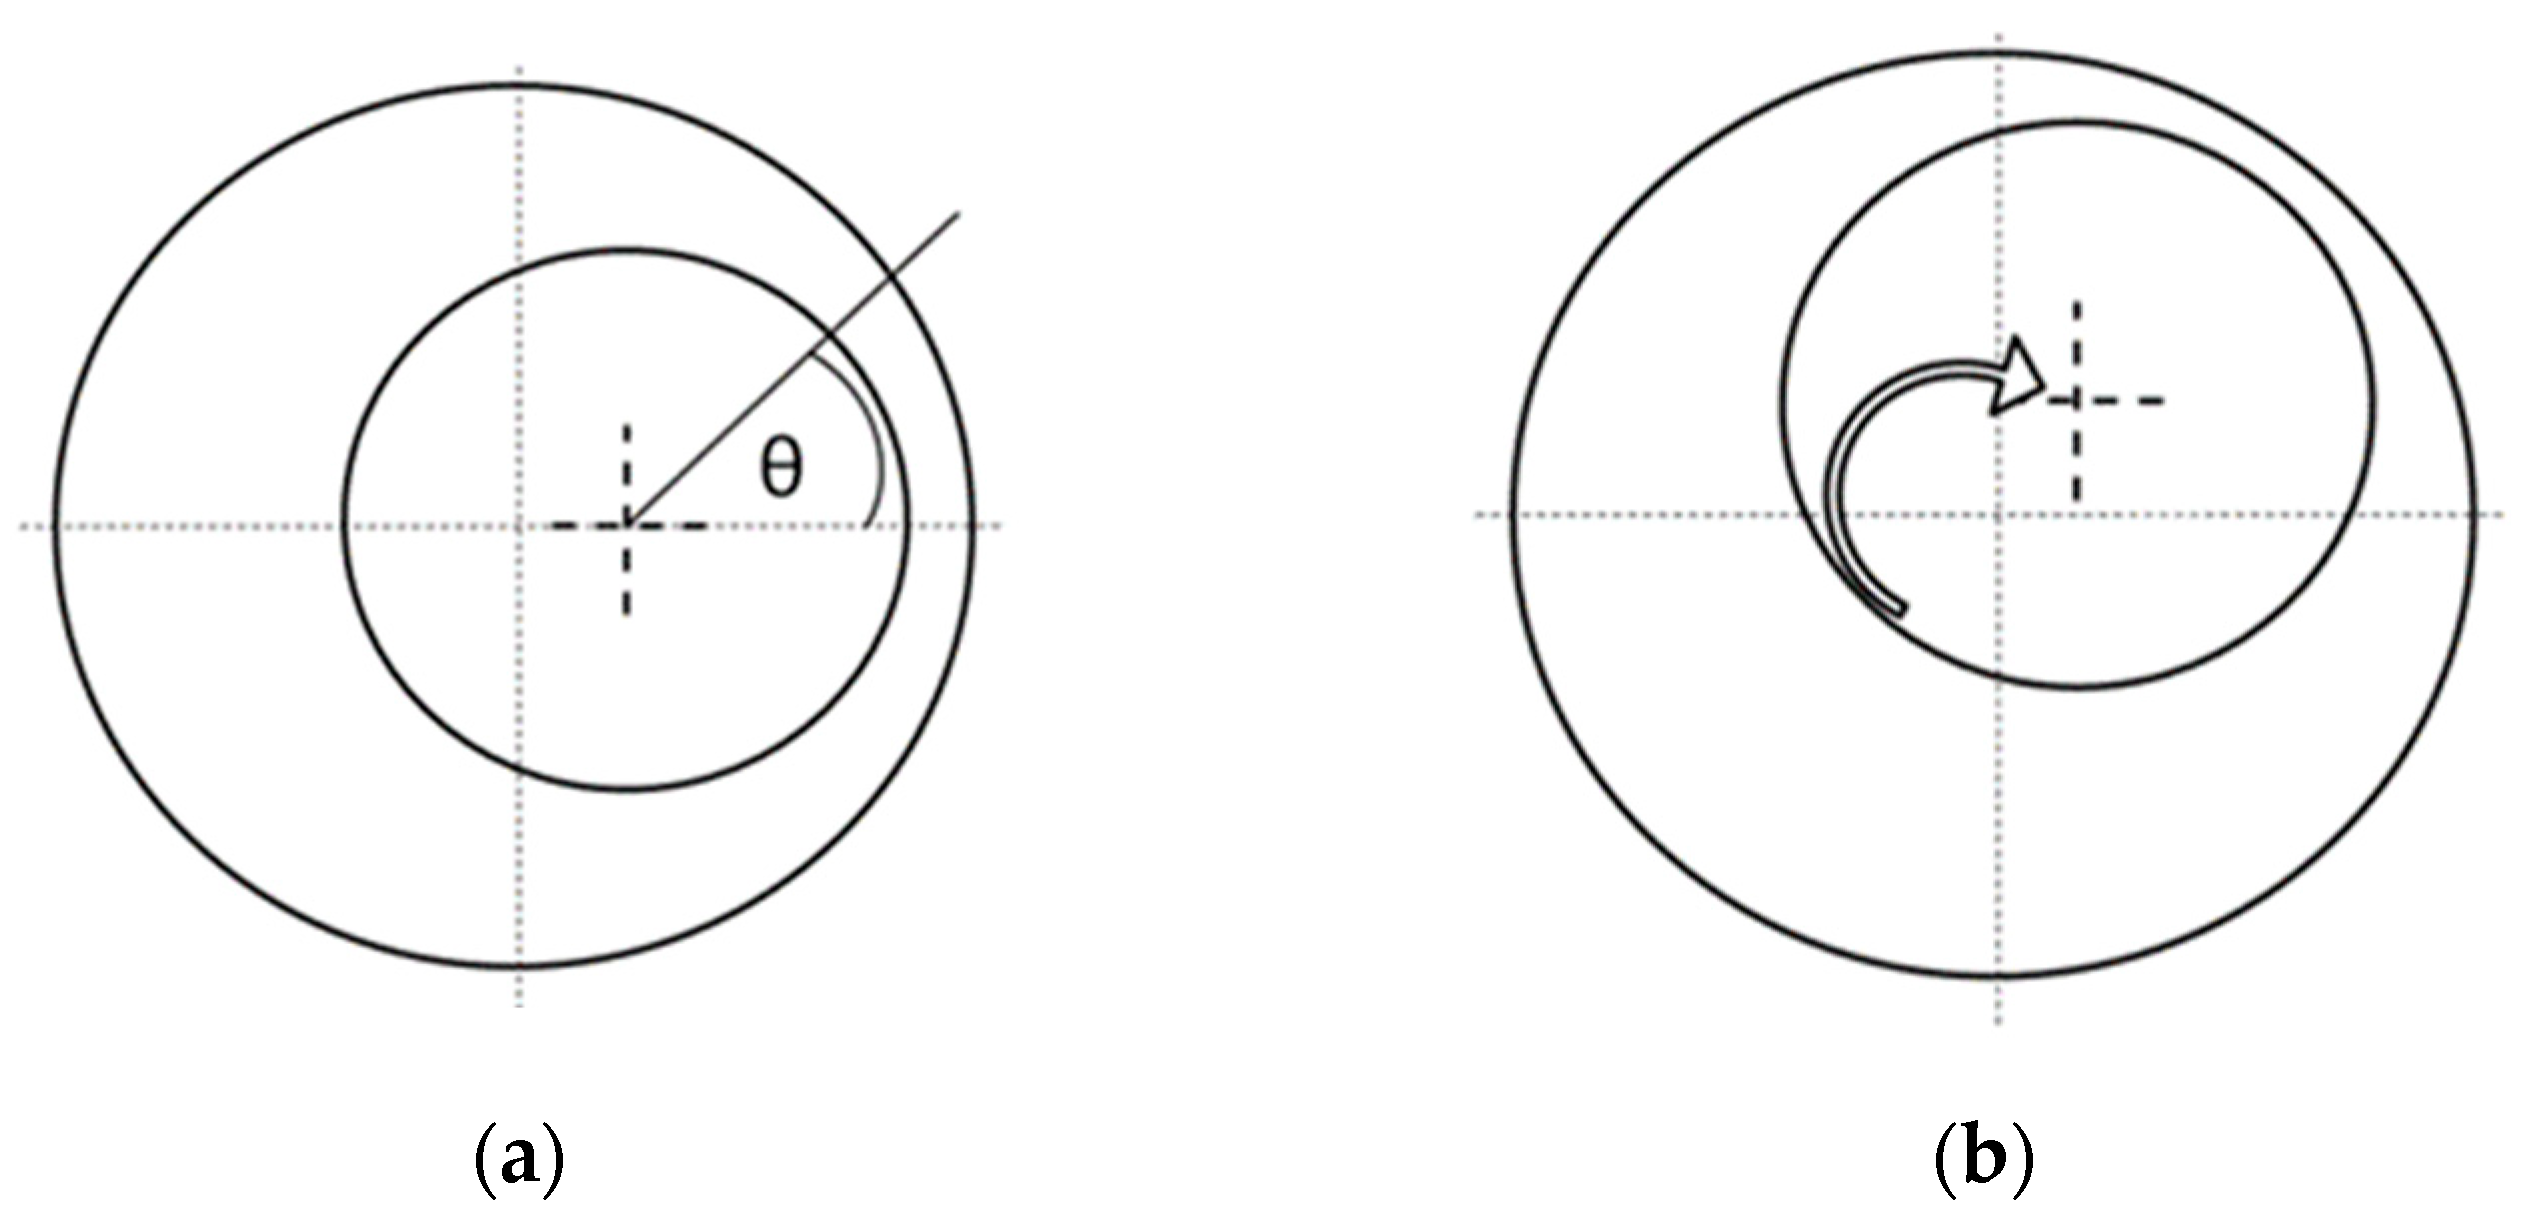
Eccentricity occurs in electric motors when there is a non-uniform air gap between the stator and the rotor. There are two types of this phenomenon: static eccentricity and dynamic eccentricity. In static eccentricity, the centerline of the shaft is at a constant offset from the center of the stator. In dynamic eccentricity, the centerline of the shaft is at a variable offset from the center of the stator (
Figure 2). The causes of air-gap eccentricity might be improper mounting, a loose or missing bolt, misalignment, or rotor imbalance [
19].
Therefore, an eccentricity fault is the result of minor mechanical imperfections. The opposite can also be assumed—eccentricity generates other mechanical defects. Indeed, the intensification of this effect guides the physical contact between the stator and rotor and, consequently, damage to the motor. Thus, monitoring the early stage of this phenomenon is vital.
In addition to the technical aspect, modifying the air gap’s width contributes to the motor’s magnetic field fluctuation. While at static eccentricity, it is constant in time, at dynamic eccentricity, the air gap varies periodically. Thus, a dynamic variation in the magnetic field affects the current and the torque values, which also vary in time.
The second fault performed on the test stand was the imbalance. It occurs when the shaft’s mass centerline does not coincide with its geometric centerline. There are three types of imbalance: static imbalance, couple imbalance, and dynamic imbalance (a combination of the first two). With static imbalance, only one force is involved. With a couple of imbalances, two equal forces (weights) are 180° from each other, causing the rotor to appear balanced at rest. In reality, almost all imbalances are dynamic. An imbalance can be caused by improper manufacture, an uneven debris build-up on the rotors/vanes/blades, or the addition of shaft fittings without an appropriate counterbalancing procedure [
19].
2.3. Test Bench
The examined SRM had a relatively small rated power, not exceeding one watt. It has four phases, with eight poles on the stator and six on the rotor.
Table 1 shows all its and the DC motor parameters.
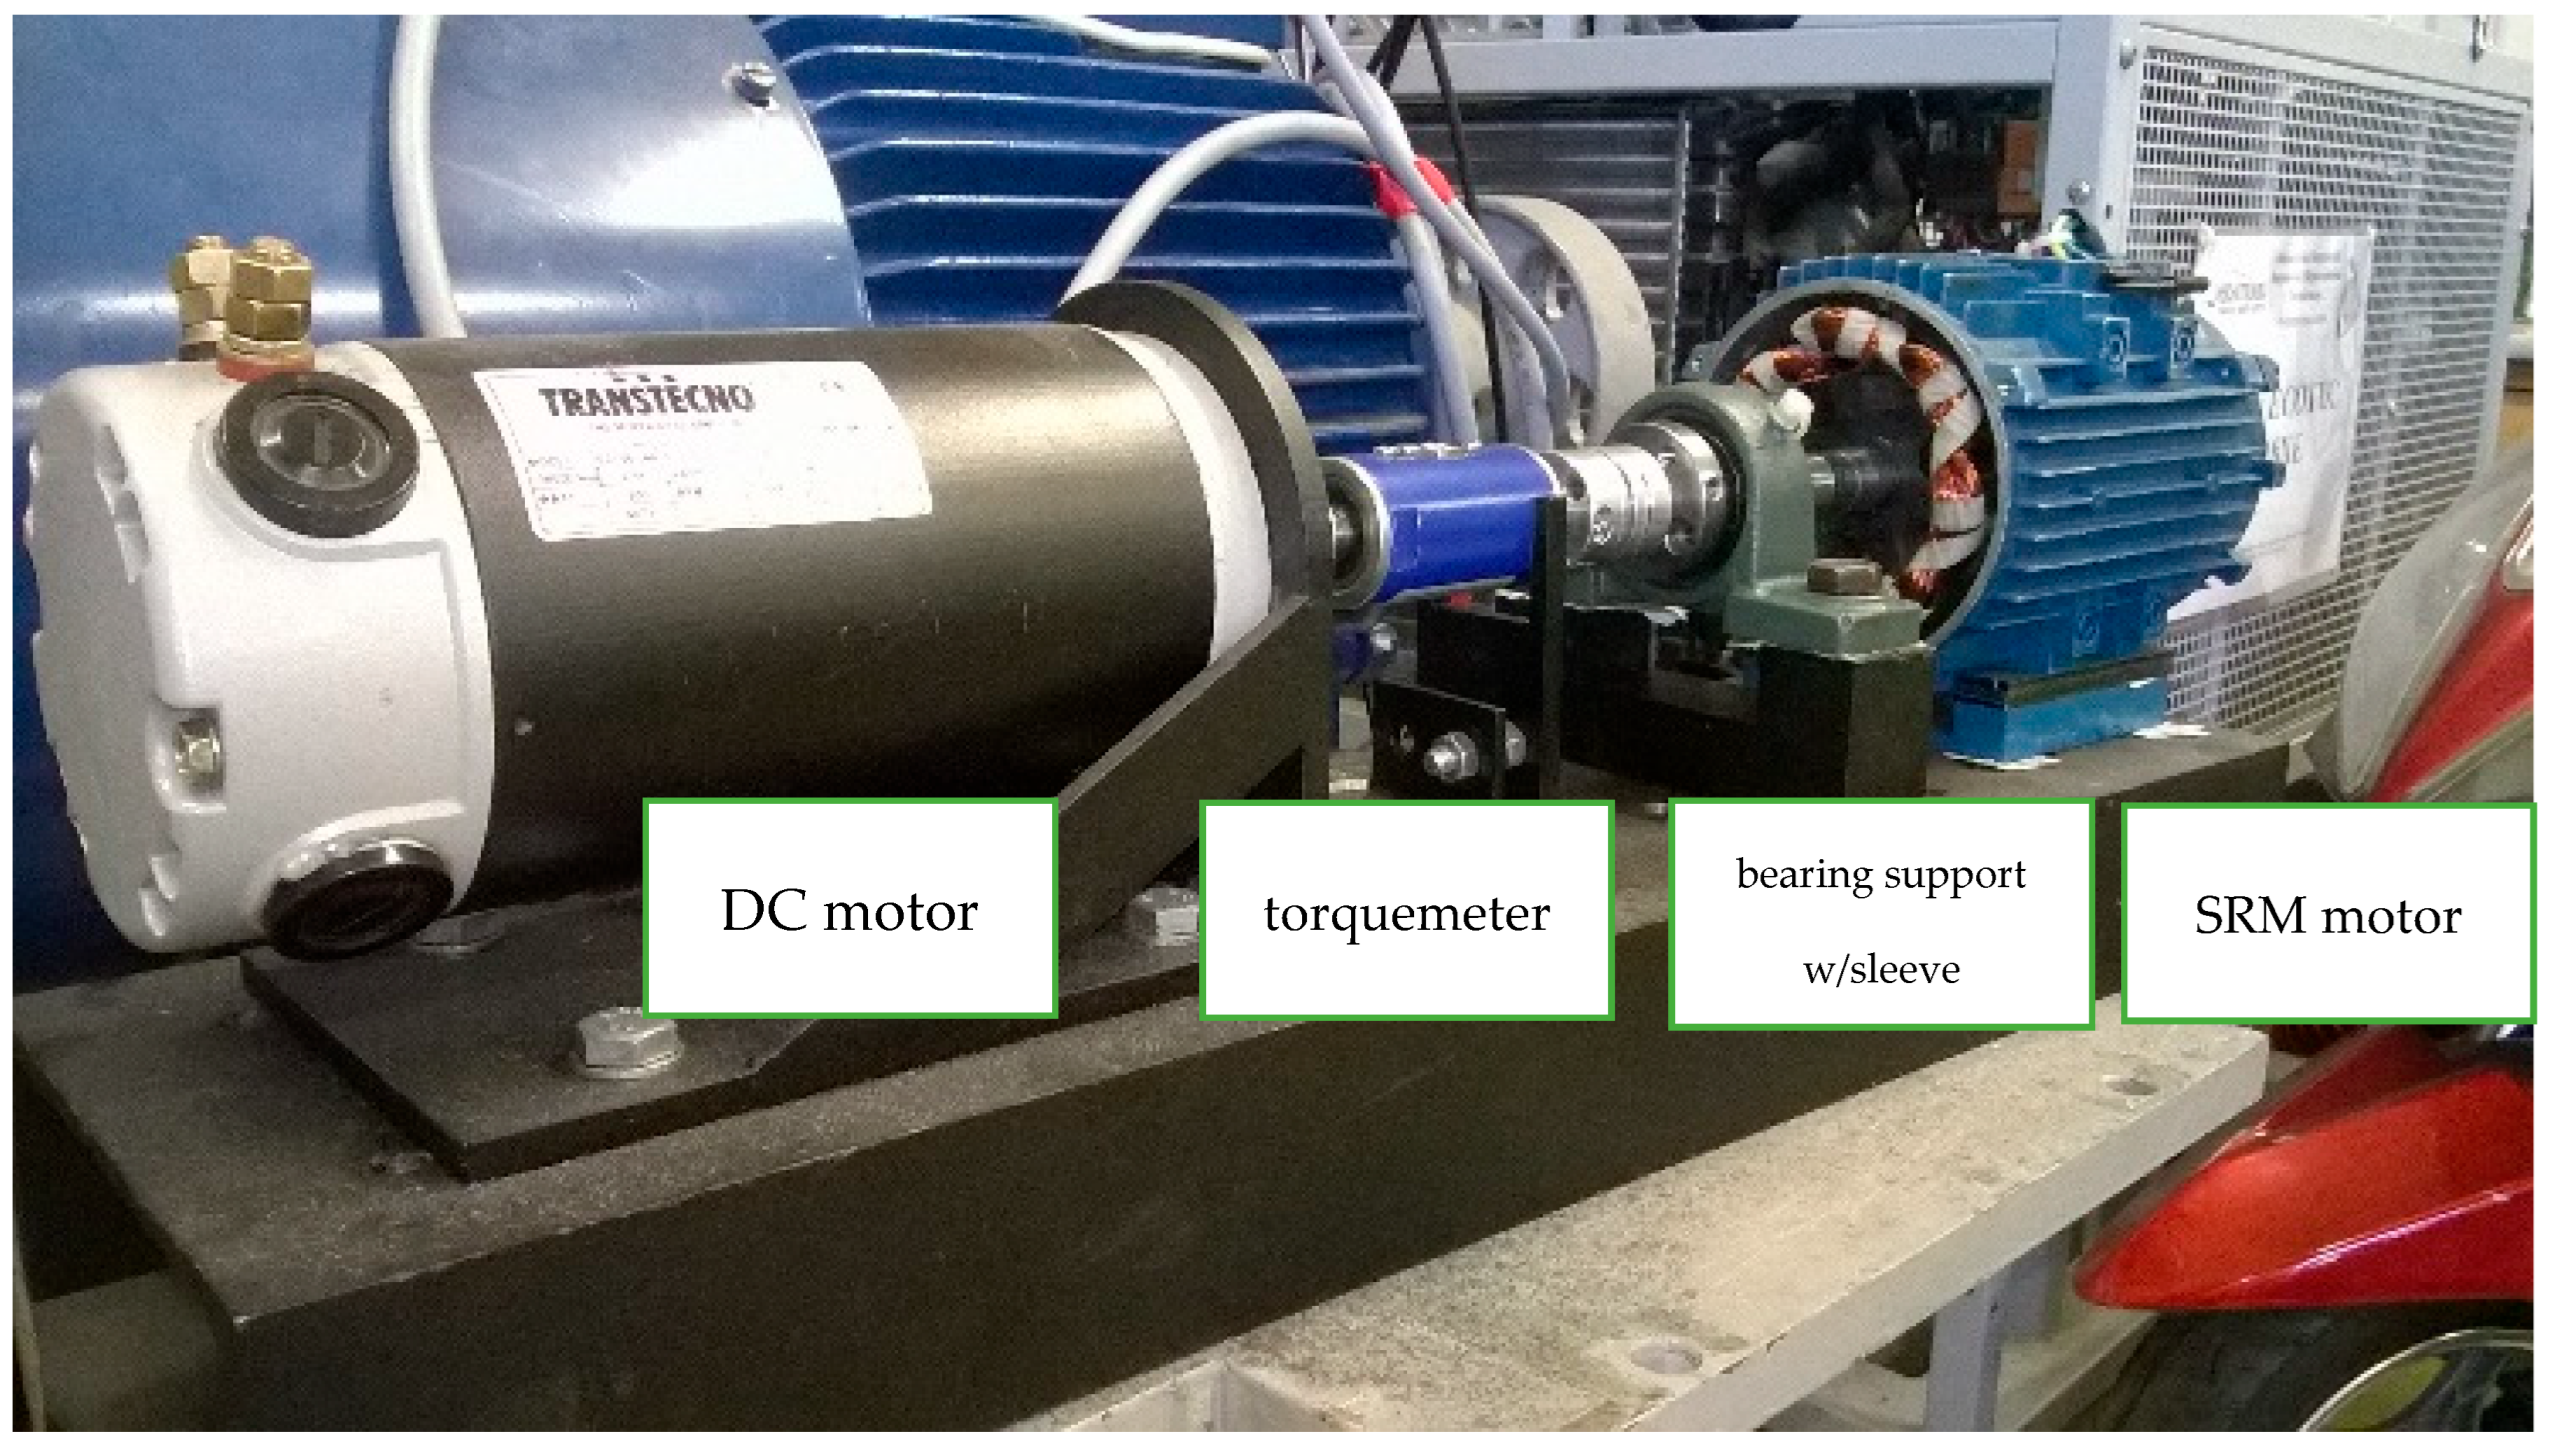
The primary assumption of this study was to conduct experiments on a specially designed test stand, where it would be possible to test the described mechanical faults on the motor in its entire operating range. Therefore, a freely regulated torque load for the tested motor was used (
Figure 3). It was assumed that the main diagnostic signals would be the current flowing through the motor and vibrations measured on the motor housing by the accelerometer.
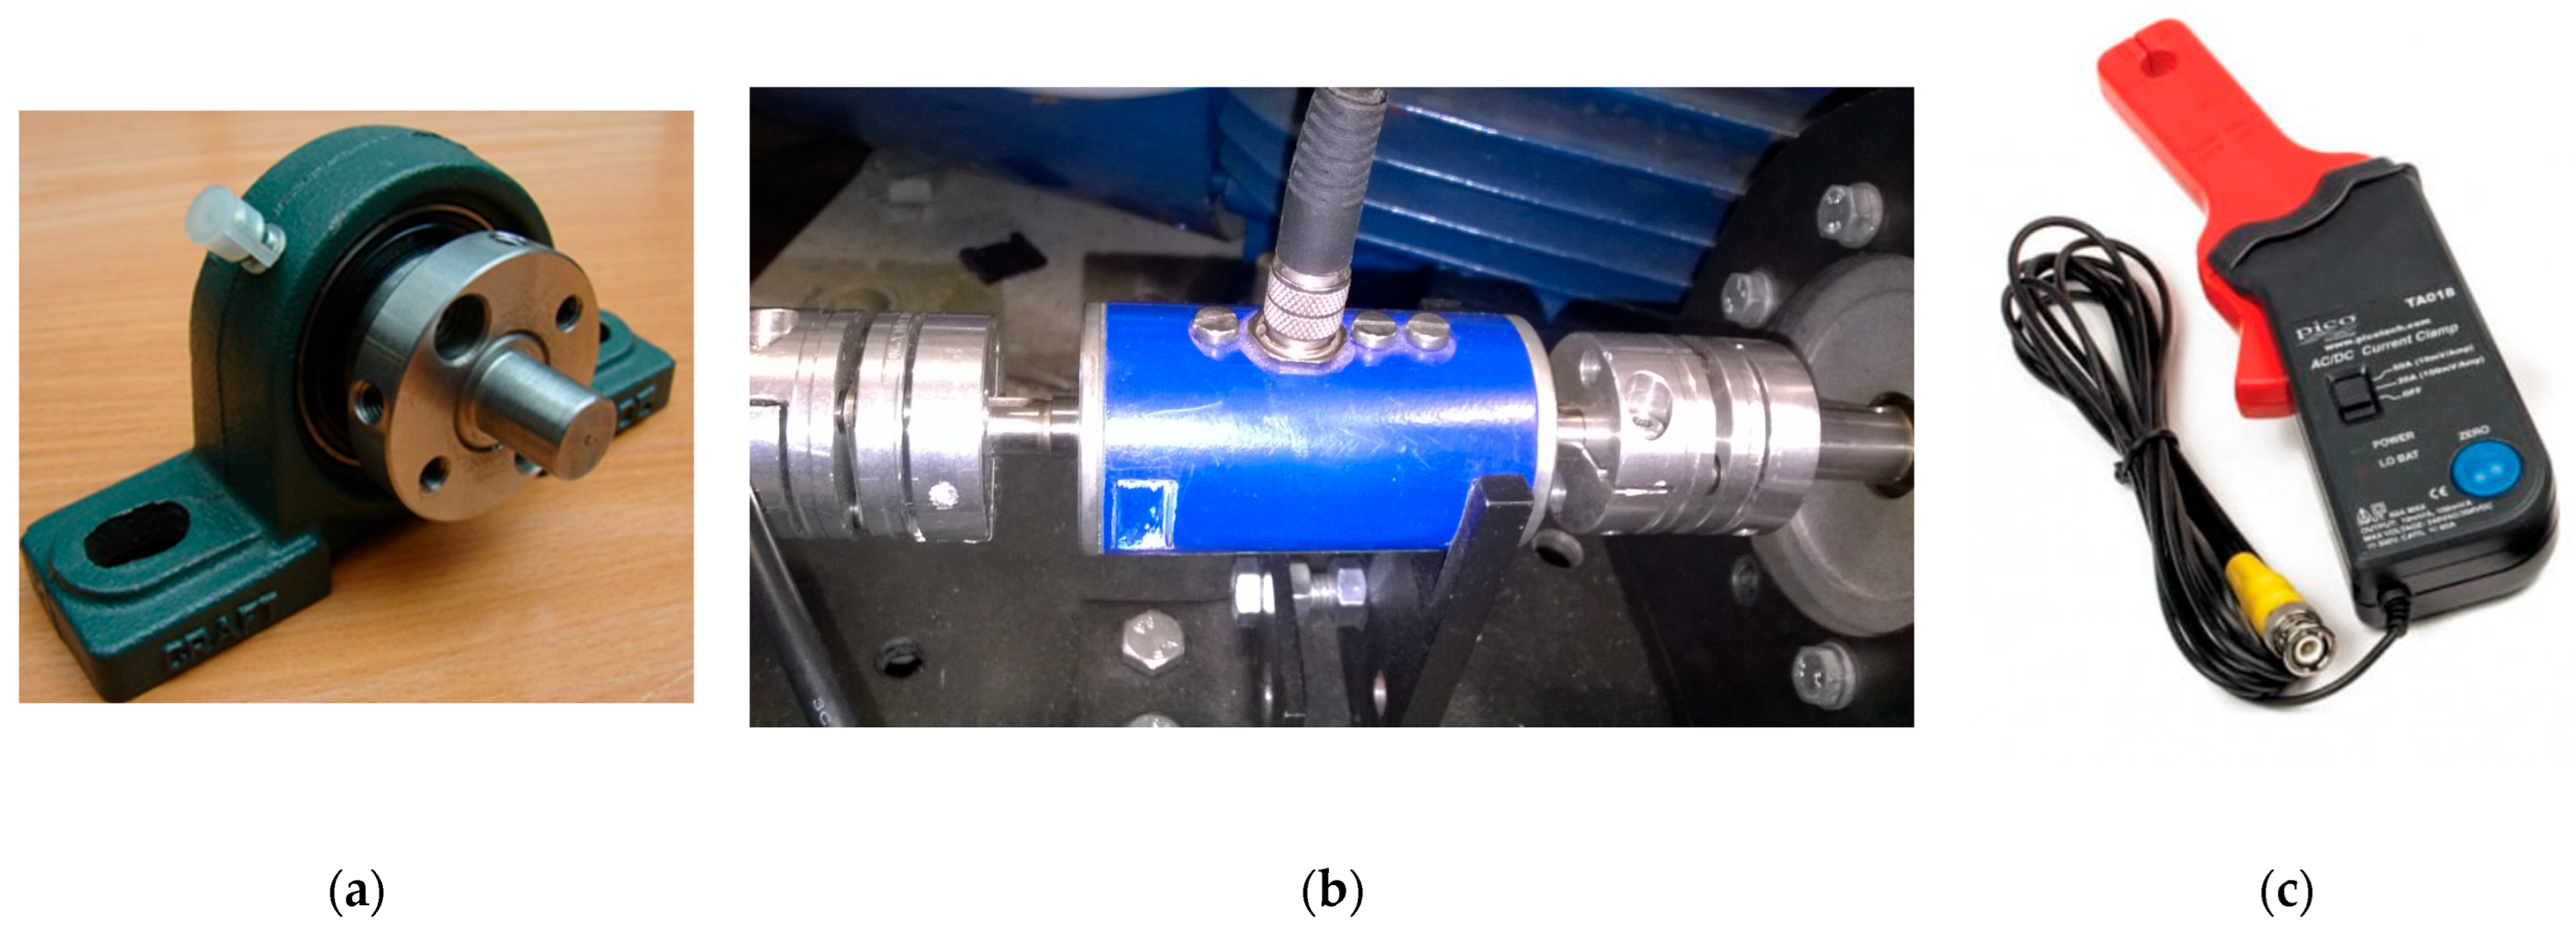
Figure 4a shows the bearing support as the element forcing the eccentricity fault.
This support prevented the motor shaft from moving. It rested on the factory bearing on one side and all the support bearings (
Figure 4a) on the other. Thus, the original motor bearing was removed.
2.4. Sensors
Several sensors described below were used to carry out reliable measurements. All of them were adequately calibrated, and none needed built-in filters. Then, their signal was stored in a National Instruments™ (Warsaw, Poland) Poland measurement card, where an analog–digital converter appropriately sampled it.
Between the tested motor and the load was a torque meter NCTE 2200-5 (
Figure 4b) connected by two clutches. This instrument operated from 0 up to −5/+5 Nm with an accuracy of 1%.
The current was measured with a probe 60 A AC/DC, BNC connector (
Figure 4c). These clamps can measure currents up to 60 A, while here, a more accurate measurement mode of up to 20 A was used since the values of the currents of the examined motor did not exceed two amperes.
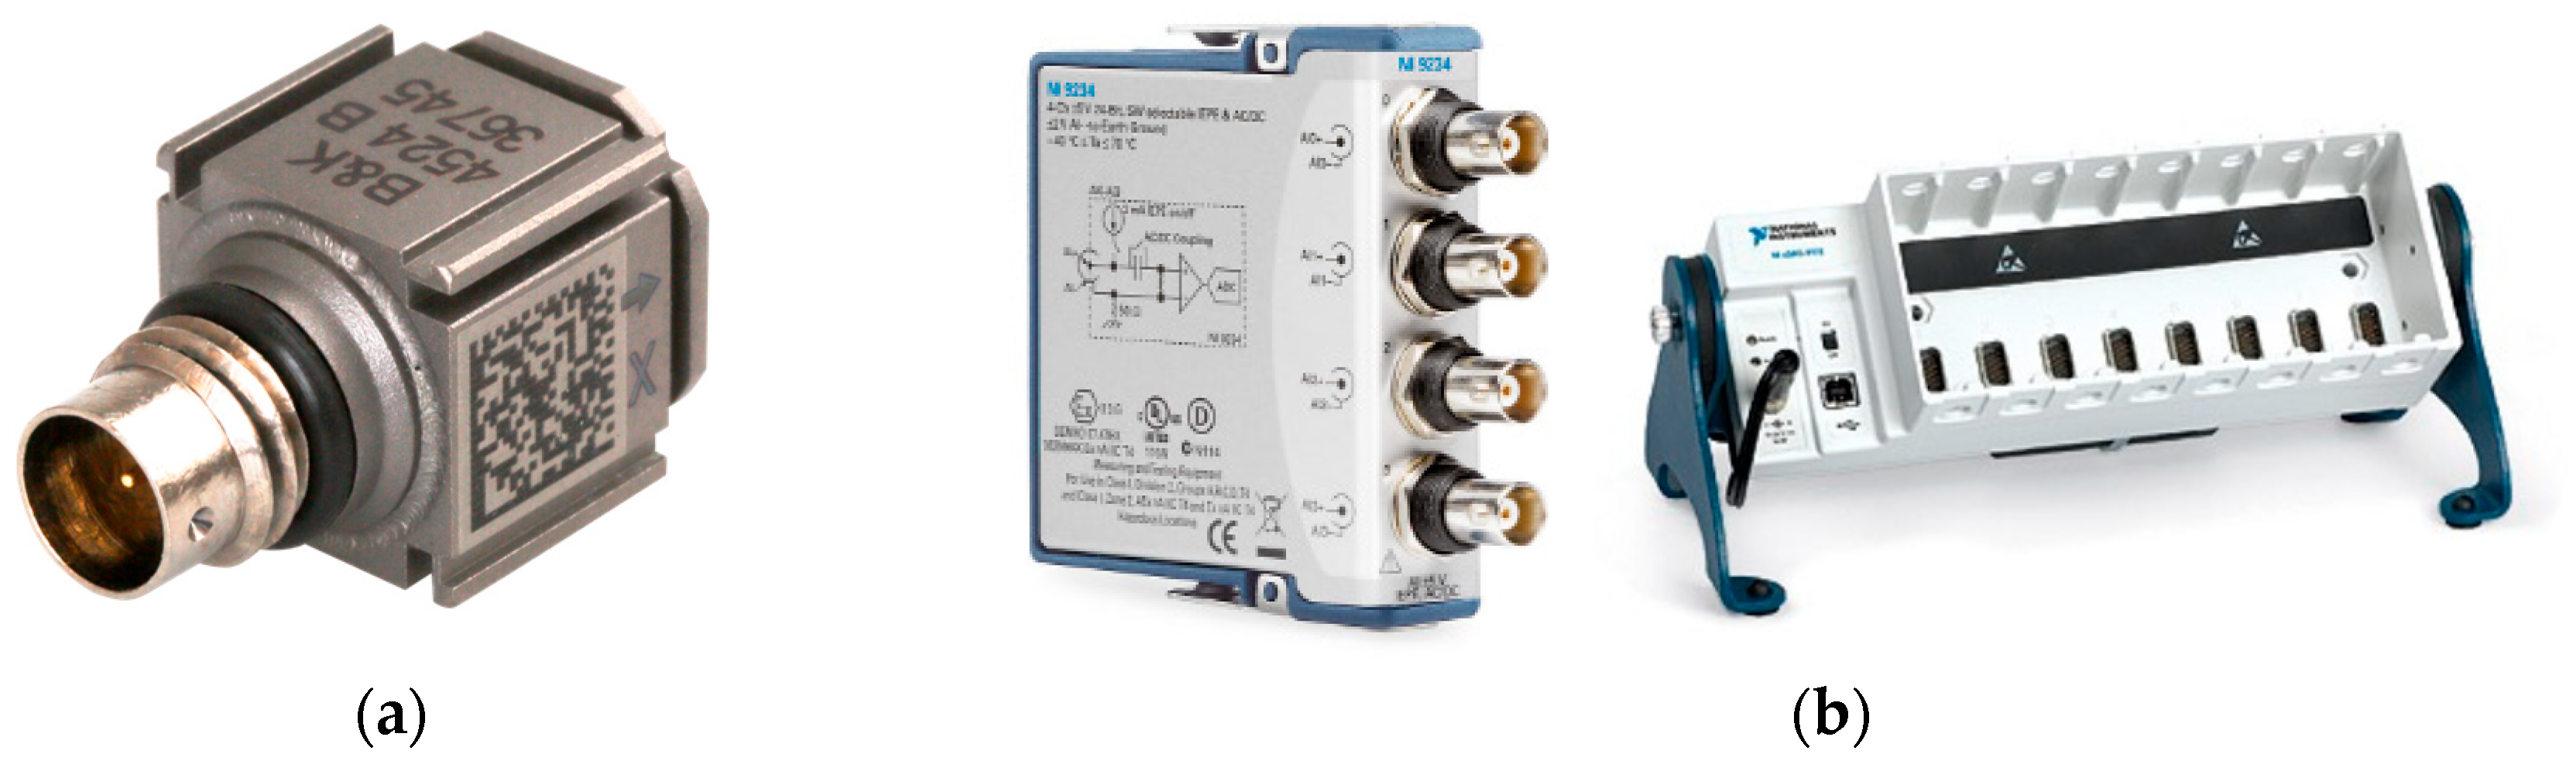
To measure the accelerations (vibrations), the Miniature Triaxial CCLD Accelerometer (Type 4524-B) was equipped with three independent outputs for simultaneous high-level, general-purpose vibration measurements (
Figure 5a). The maximum operational level range was up to 50 g (approximately 490 ms
−2). Its sensitivity was 10 mV/ms
−2, as declared by a manufacturer, with the residual noise level in the spec frequency range (rms) of about ±4000 µg. Since the maximum accelerations measured here were approx. 4 ms
−2, the parameters of these sensors were sufficient.
Electronic systems have been designed to allow manual control of the tested and loaded motor for the needs of the test stand. Using the appropriate methods also ensured the conditioning of the measurement signals and their adjustment to the levels acceptable for the National Instruments™ measurement cards.
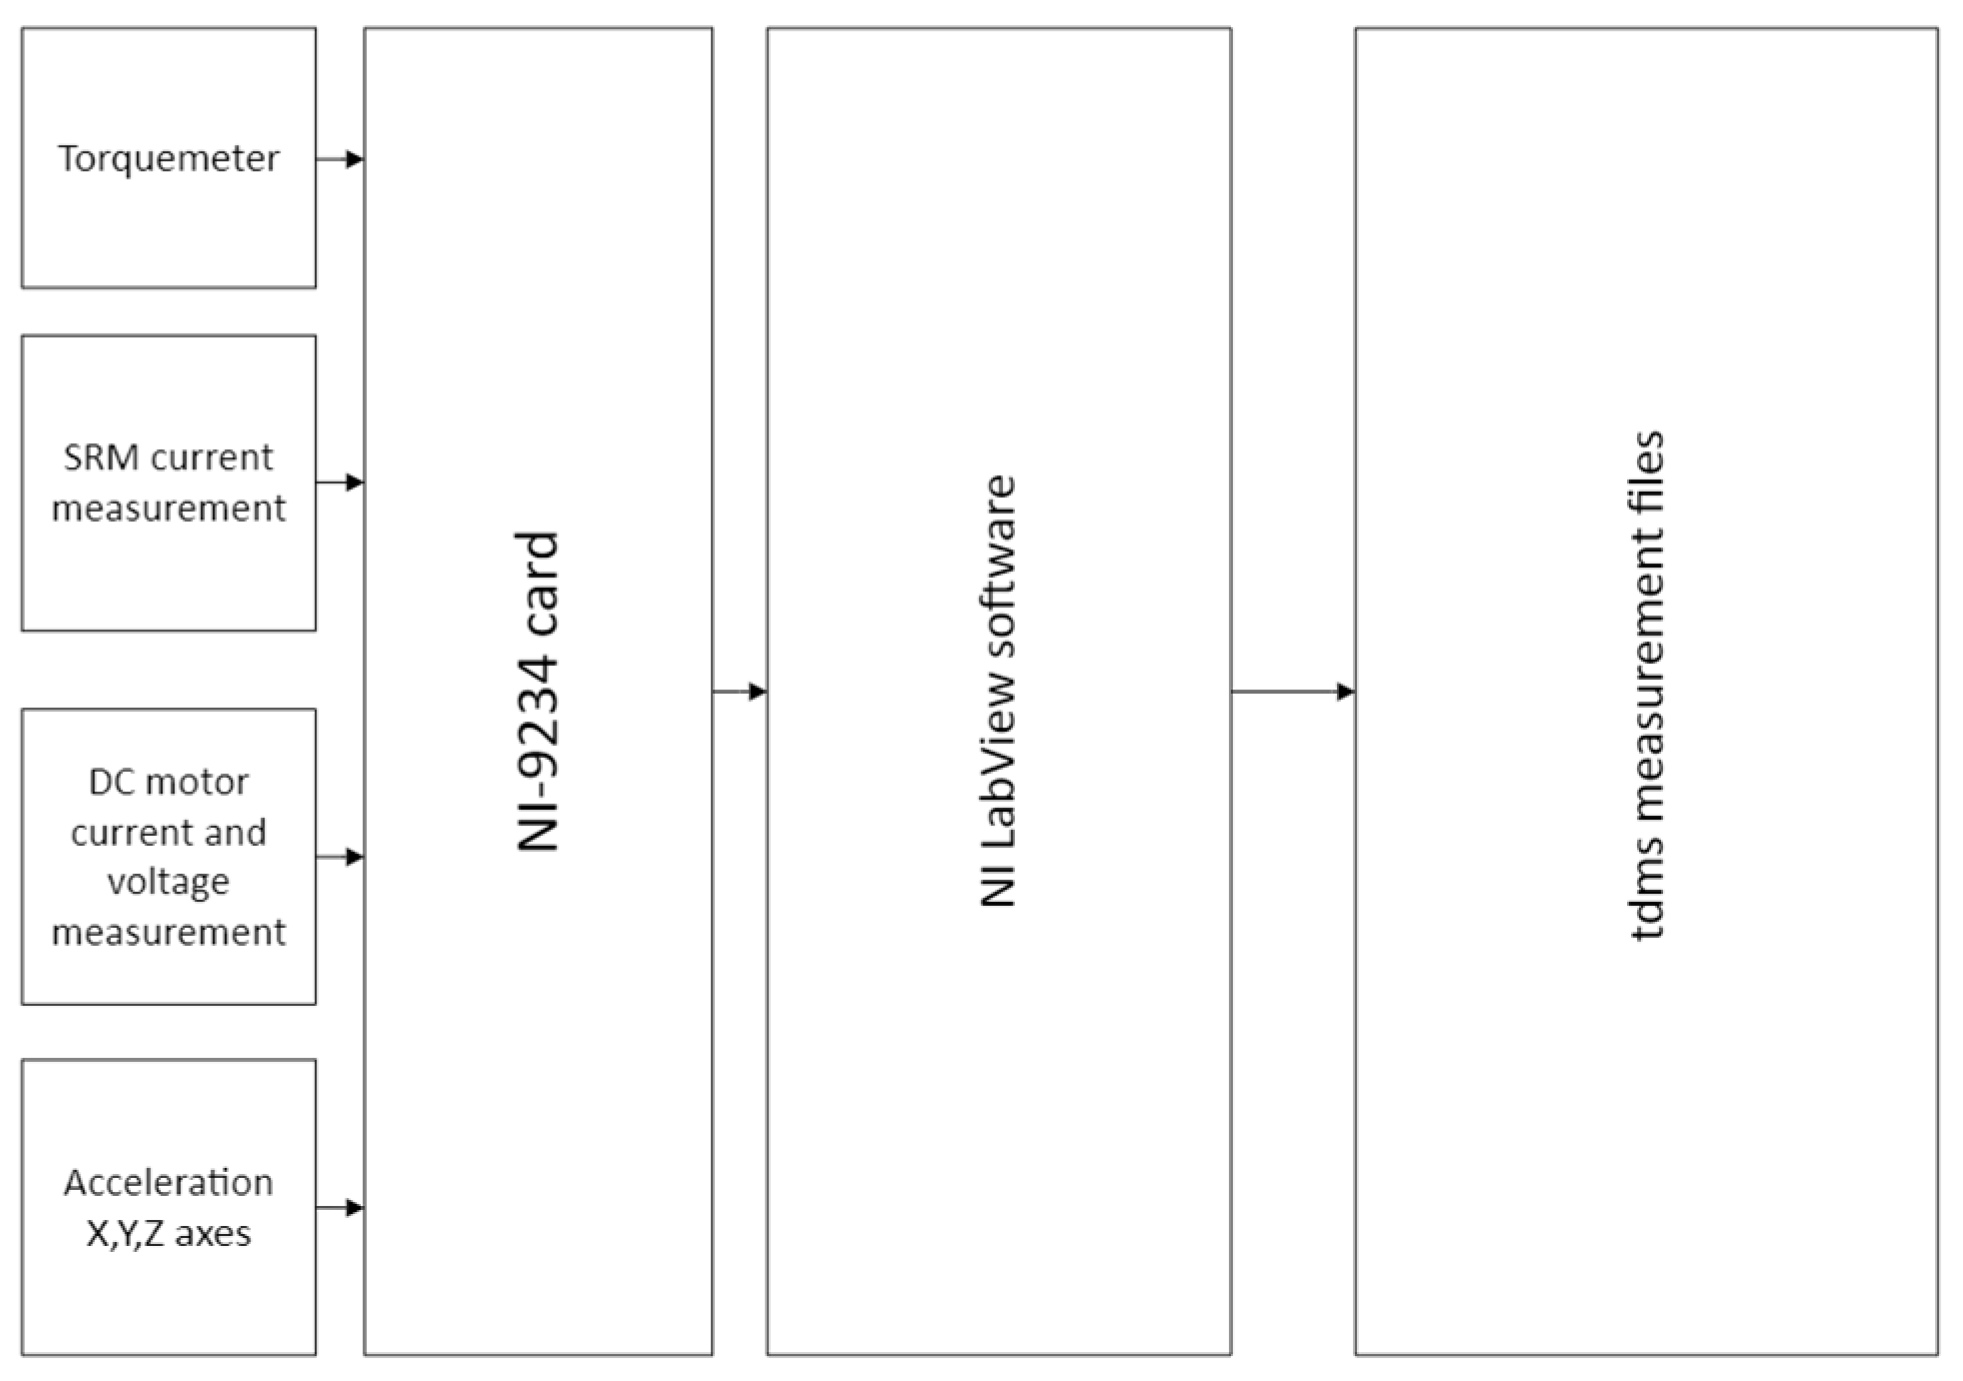
Signals of all measured physical quantities were collected using the NI-9234 measurement card from National Instruments, located in the Compact DAQ-9172 housing (
Figure 5b). It used a 24-bit delta–sigma analog–digital conversion resolution.
Each measurement lasted six seconds, and the sampling rate was 25,600 samples per second. In one card, there were six measurement channels examining the following quantities:
Direct and reference torques;
Current and voltage from braking DC motor;
Vibration (acceleration) from the X, Y, and Z axes;
SRM phase current.
The measurement diagram is presented in
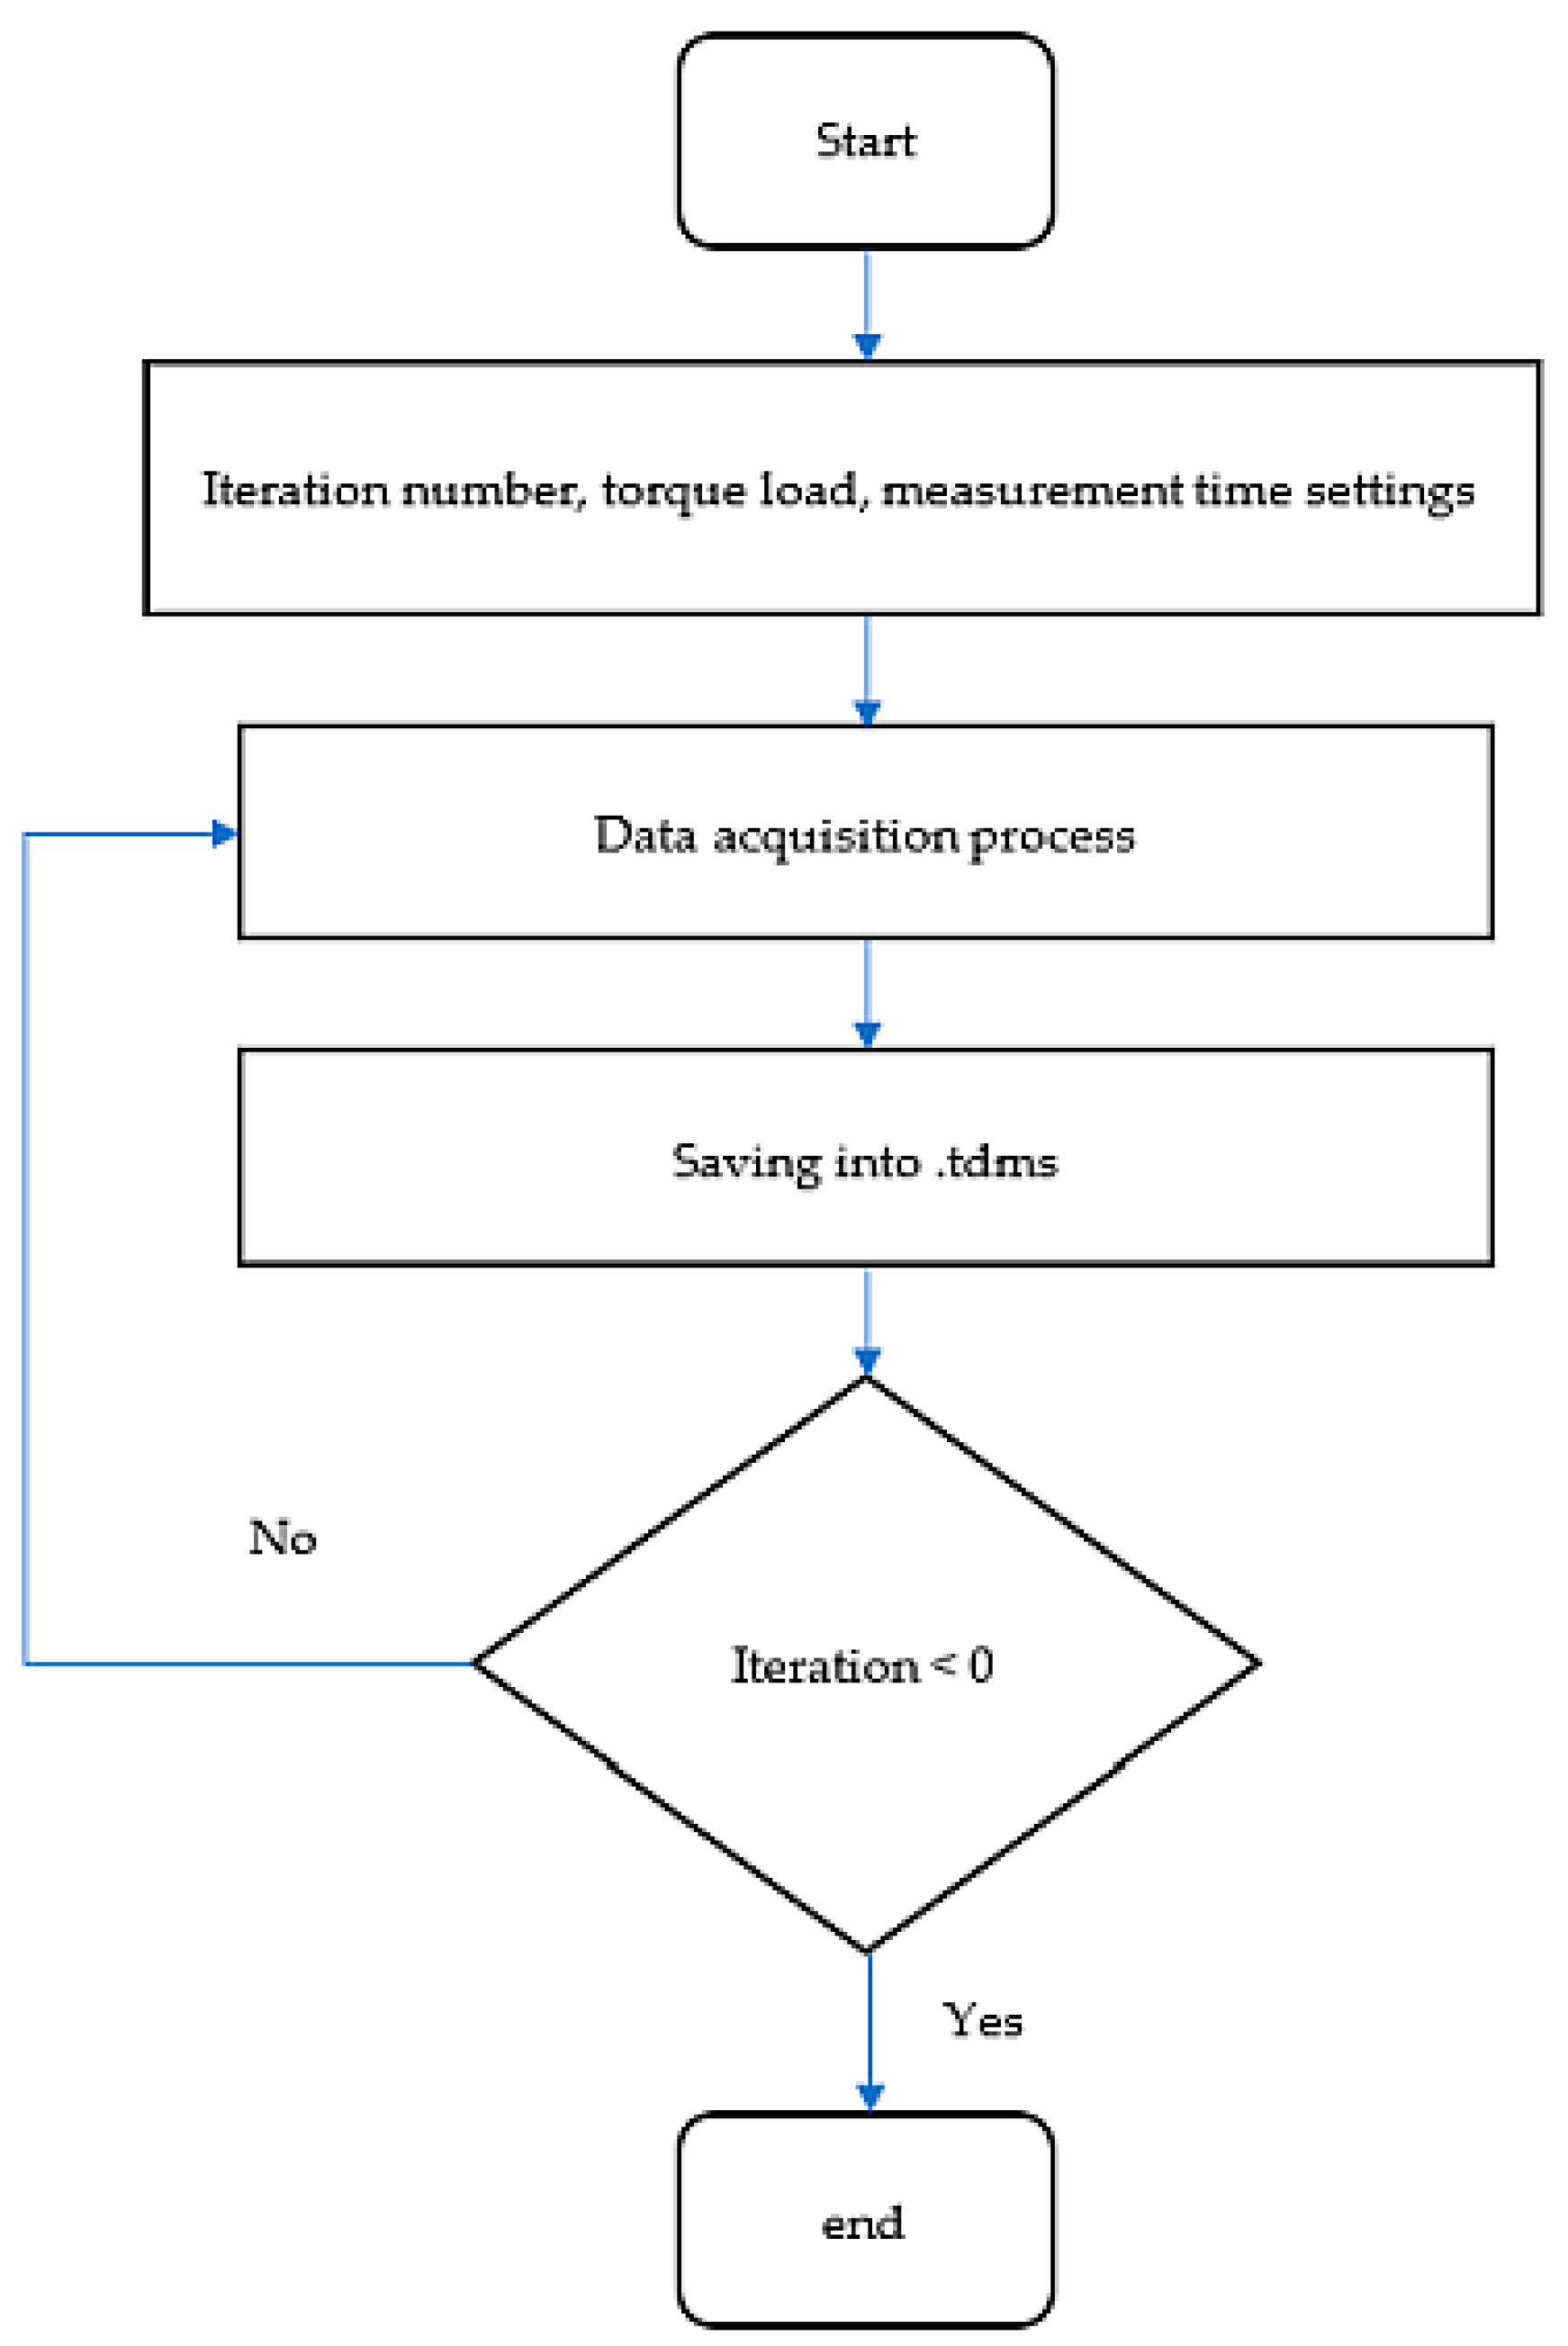
Figure 6. The signals were recorded simultaneously through several channels controlled by the appropriate NI Labview™ 2023 software as a specific VI (virtual instrument—
Figure 7).
The software could set the following parameters:
Measurement time;
Load torque;
Number of iterations.
Then, the measurement files were saved in .tdms format, which could later be converted to the Matlab .mat file format or Excel worksheets for further analysis.
3. Results
Every experiment carried out on the test bench had the following parameters:
Load torque:
0 Nm (no load);
1 Nm;
2 Nm.
SRM Rotational speed:
3.1. The Results of Dynamic Eccentricity Tests
Dynamic eccentricity tests were carried out for two cases: no-fault and fault, with a displacement of 0.25 mm.
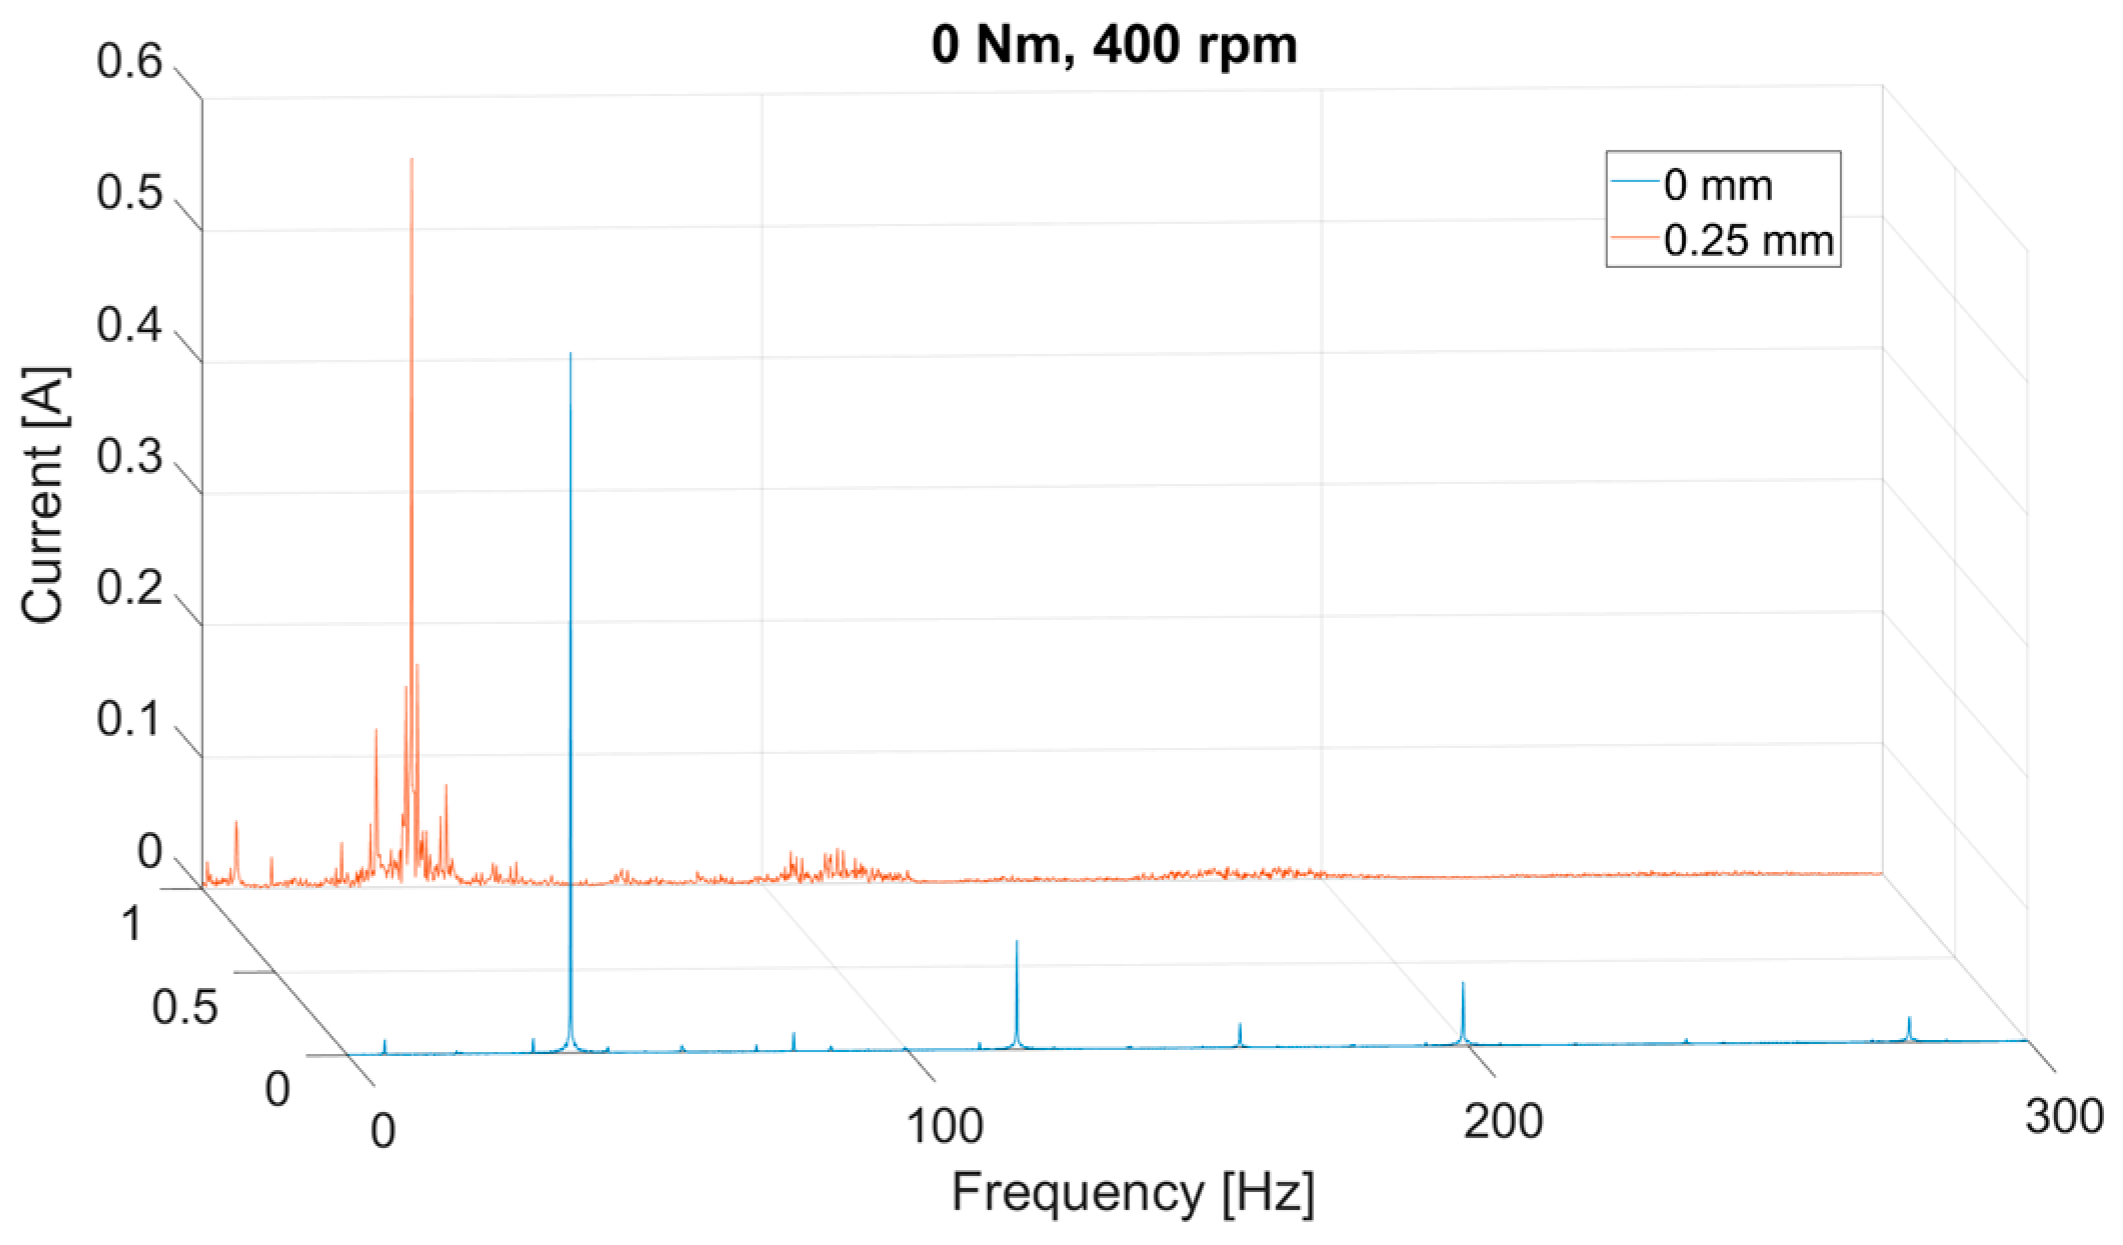
In these charts (except for the first one), current peaks spread out from each other clearly at about 6.66 Hz, which is the equivalent of 400 rpm of motor rotational speed. The highest peak, around 40 Hz, stands out in all the graphs. This is the sixth multiple of the rotational speed because this motor has six poles on the rotor.
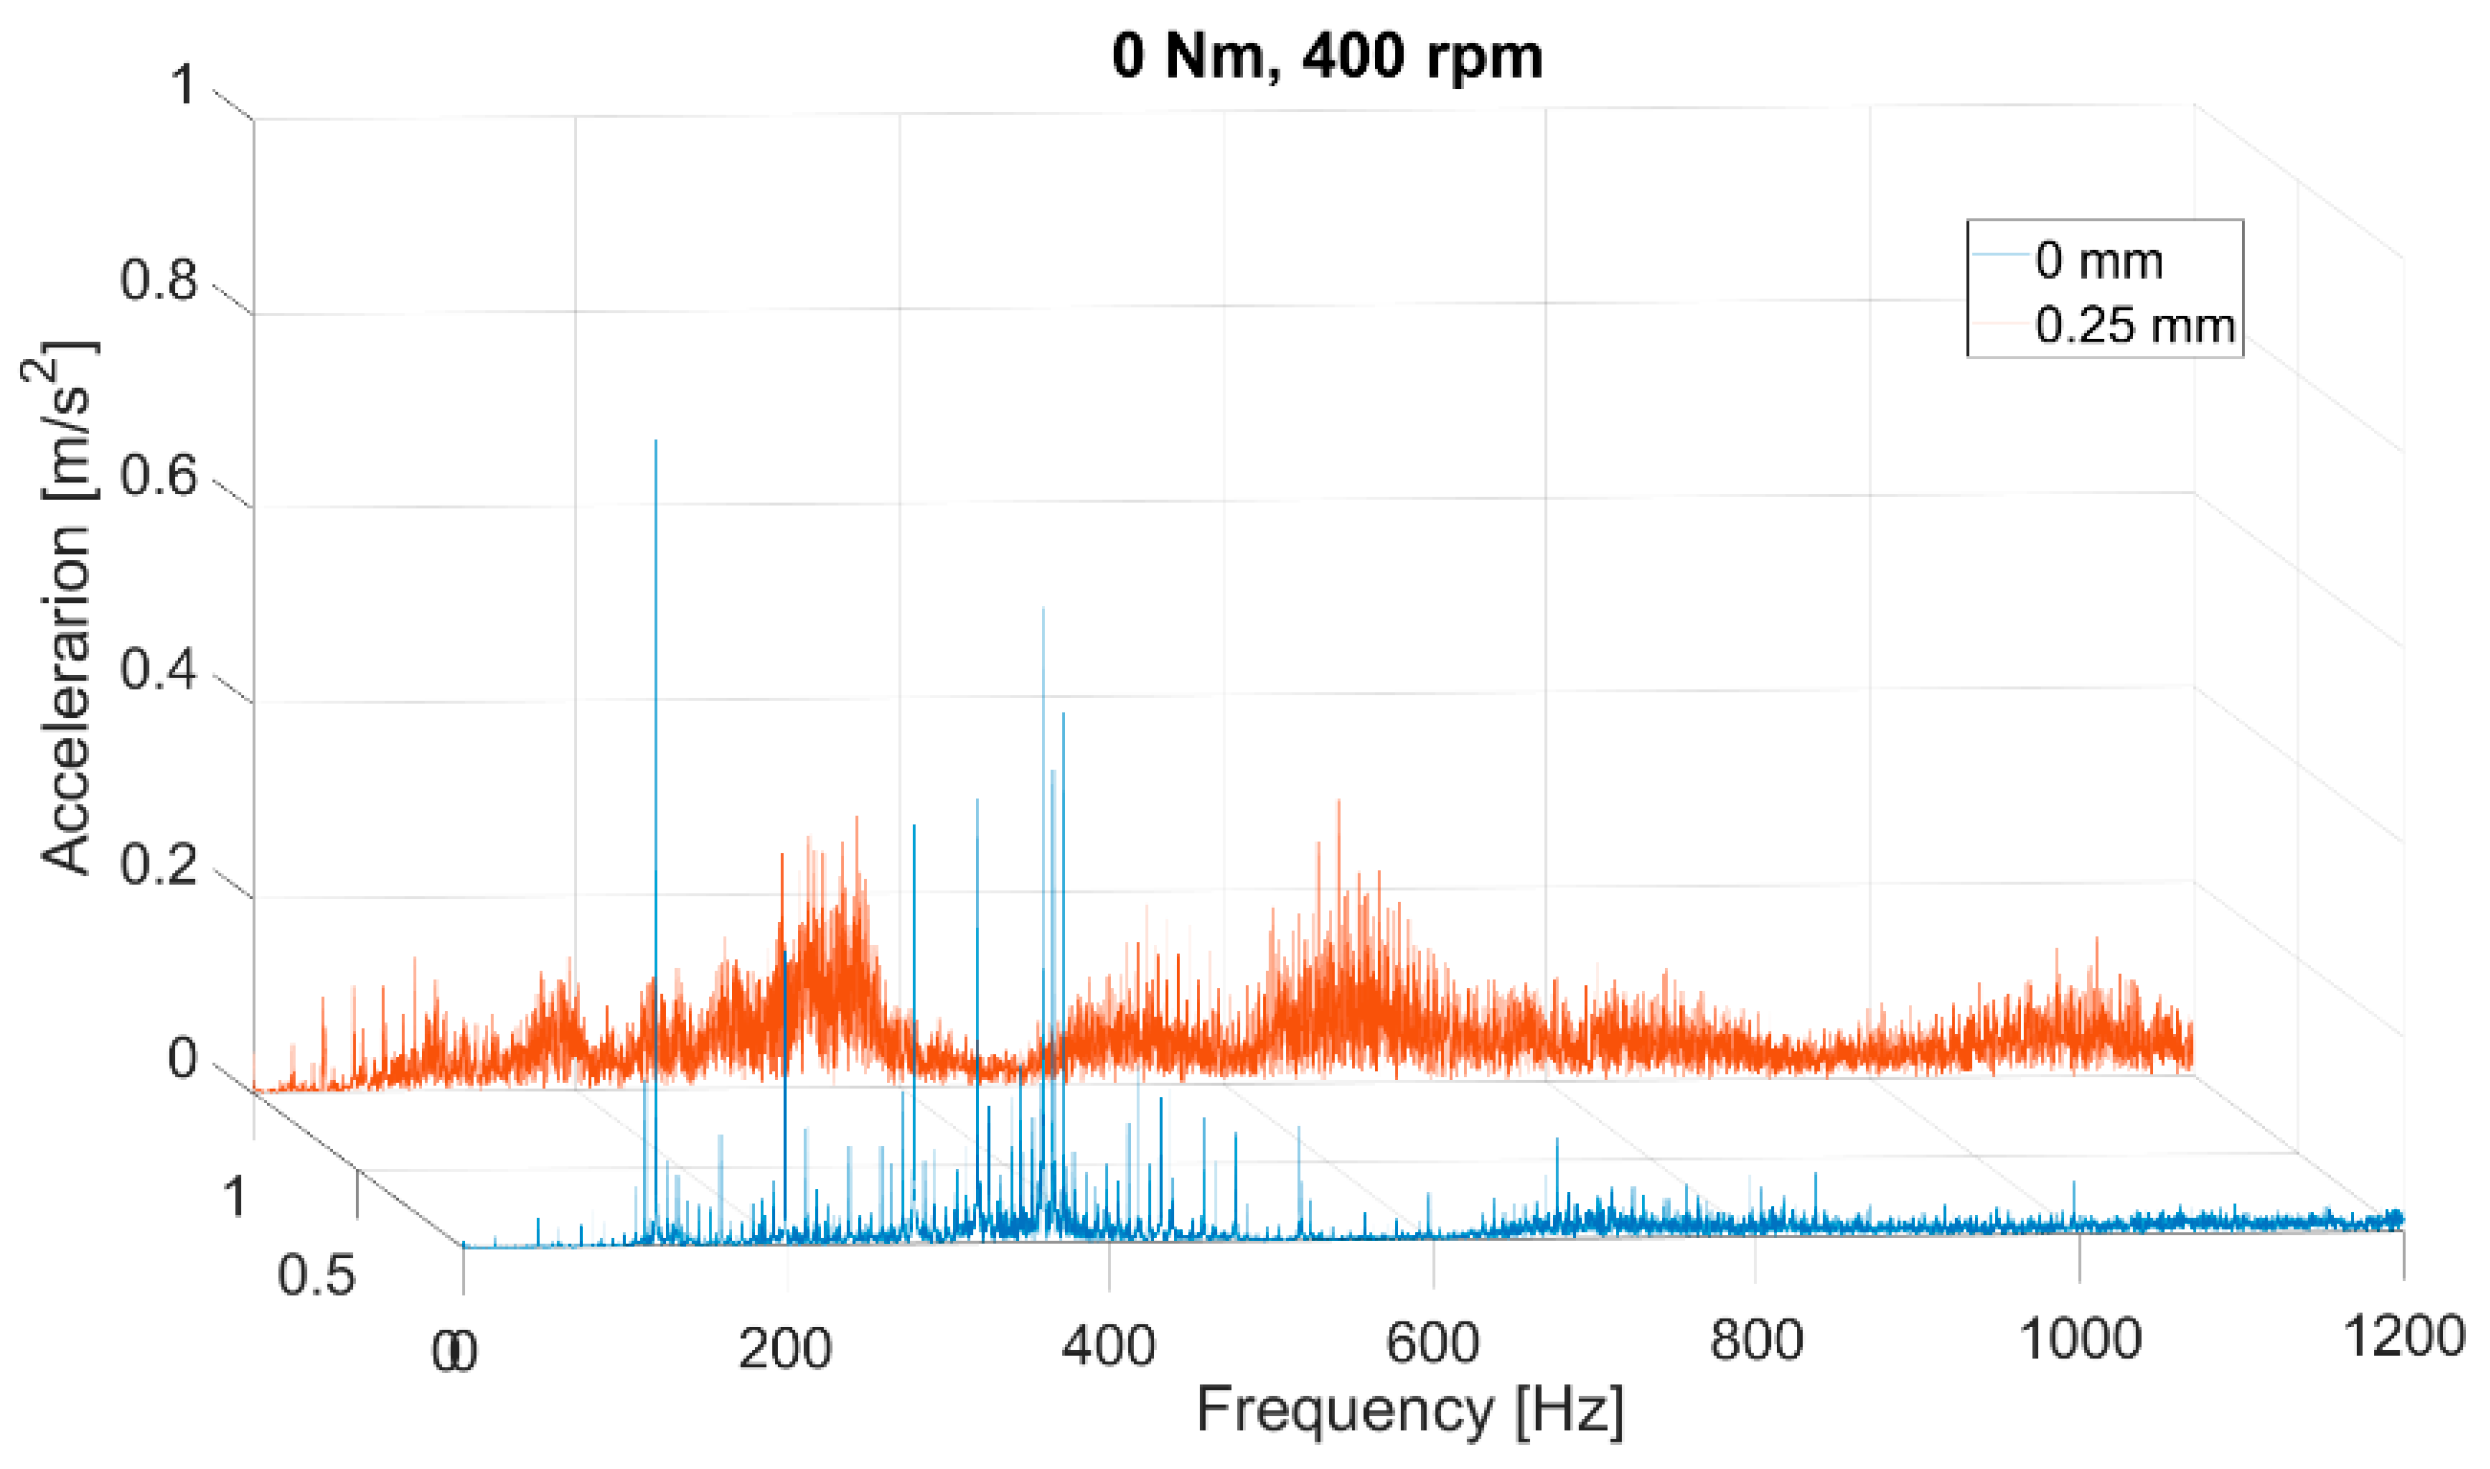
Only the peak (prominent sixth) and multiples can be seen for the measurement at a zero torque load (
Figure 8) and with the correct operation of the electric motor. As a result of the applied fault, the signal is very distorted.
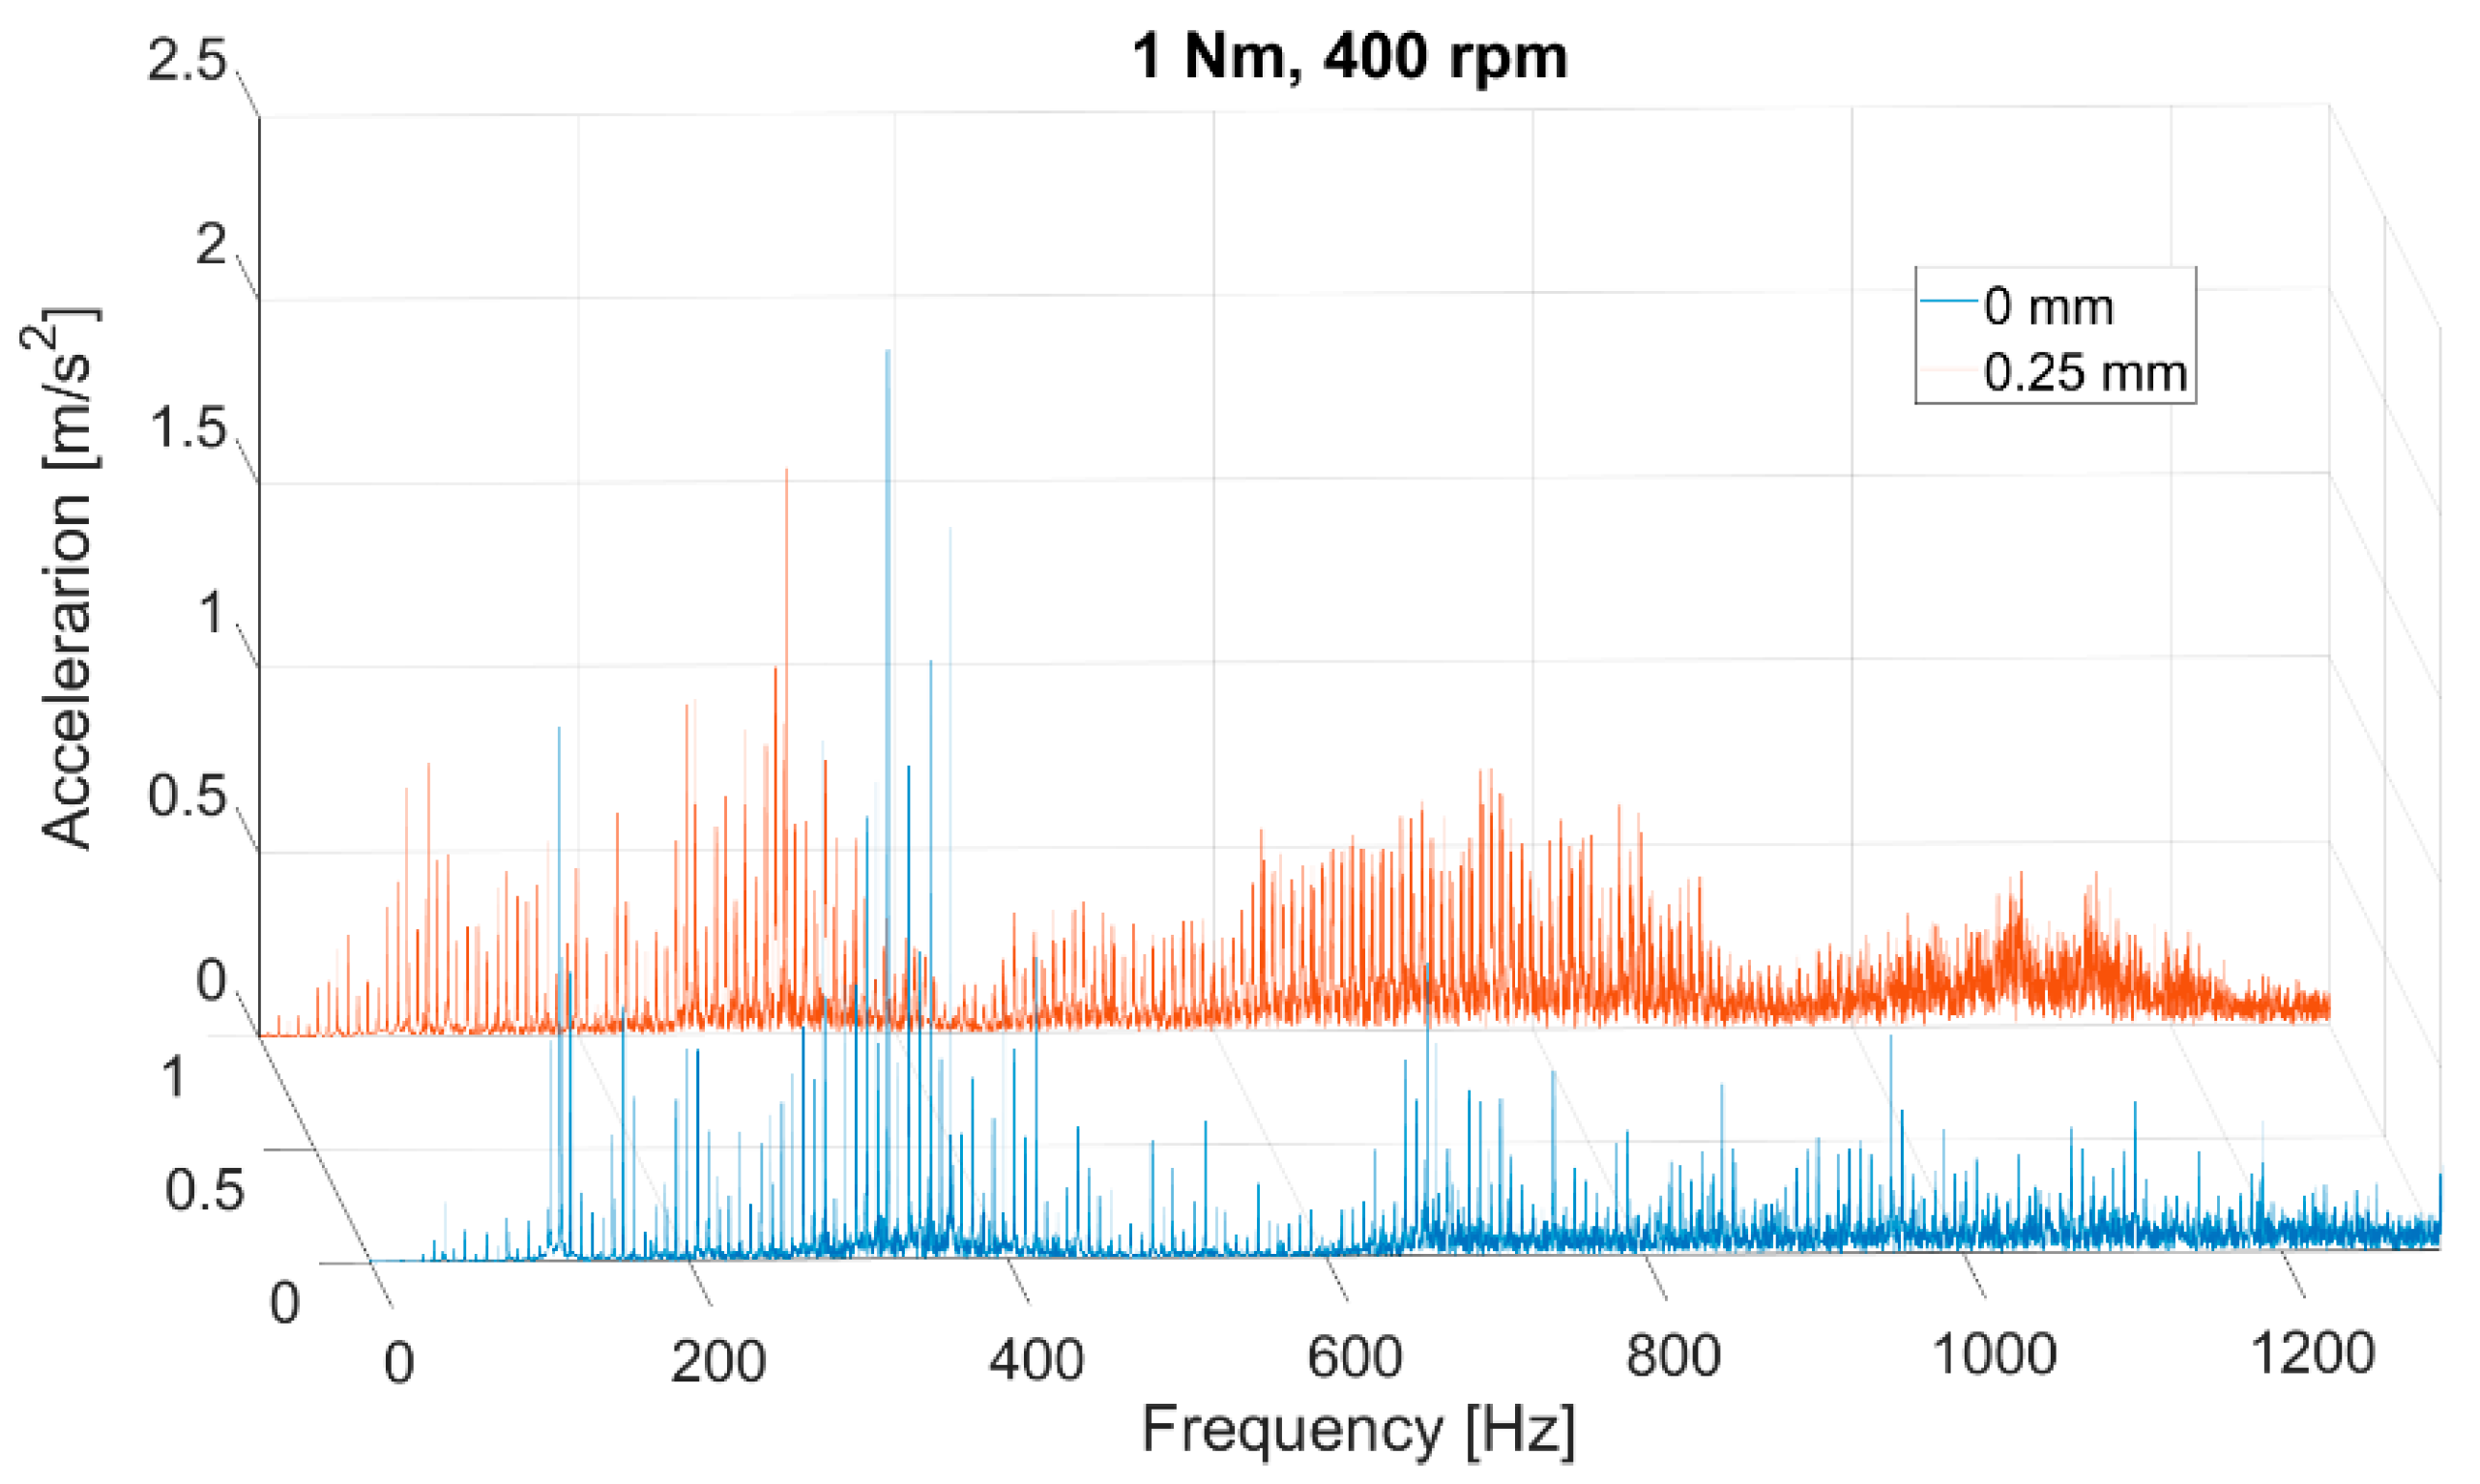
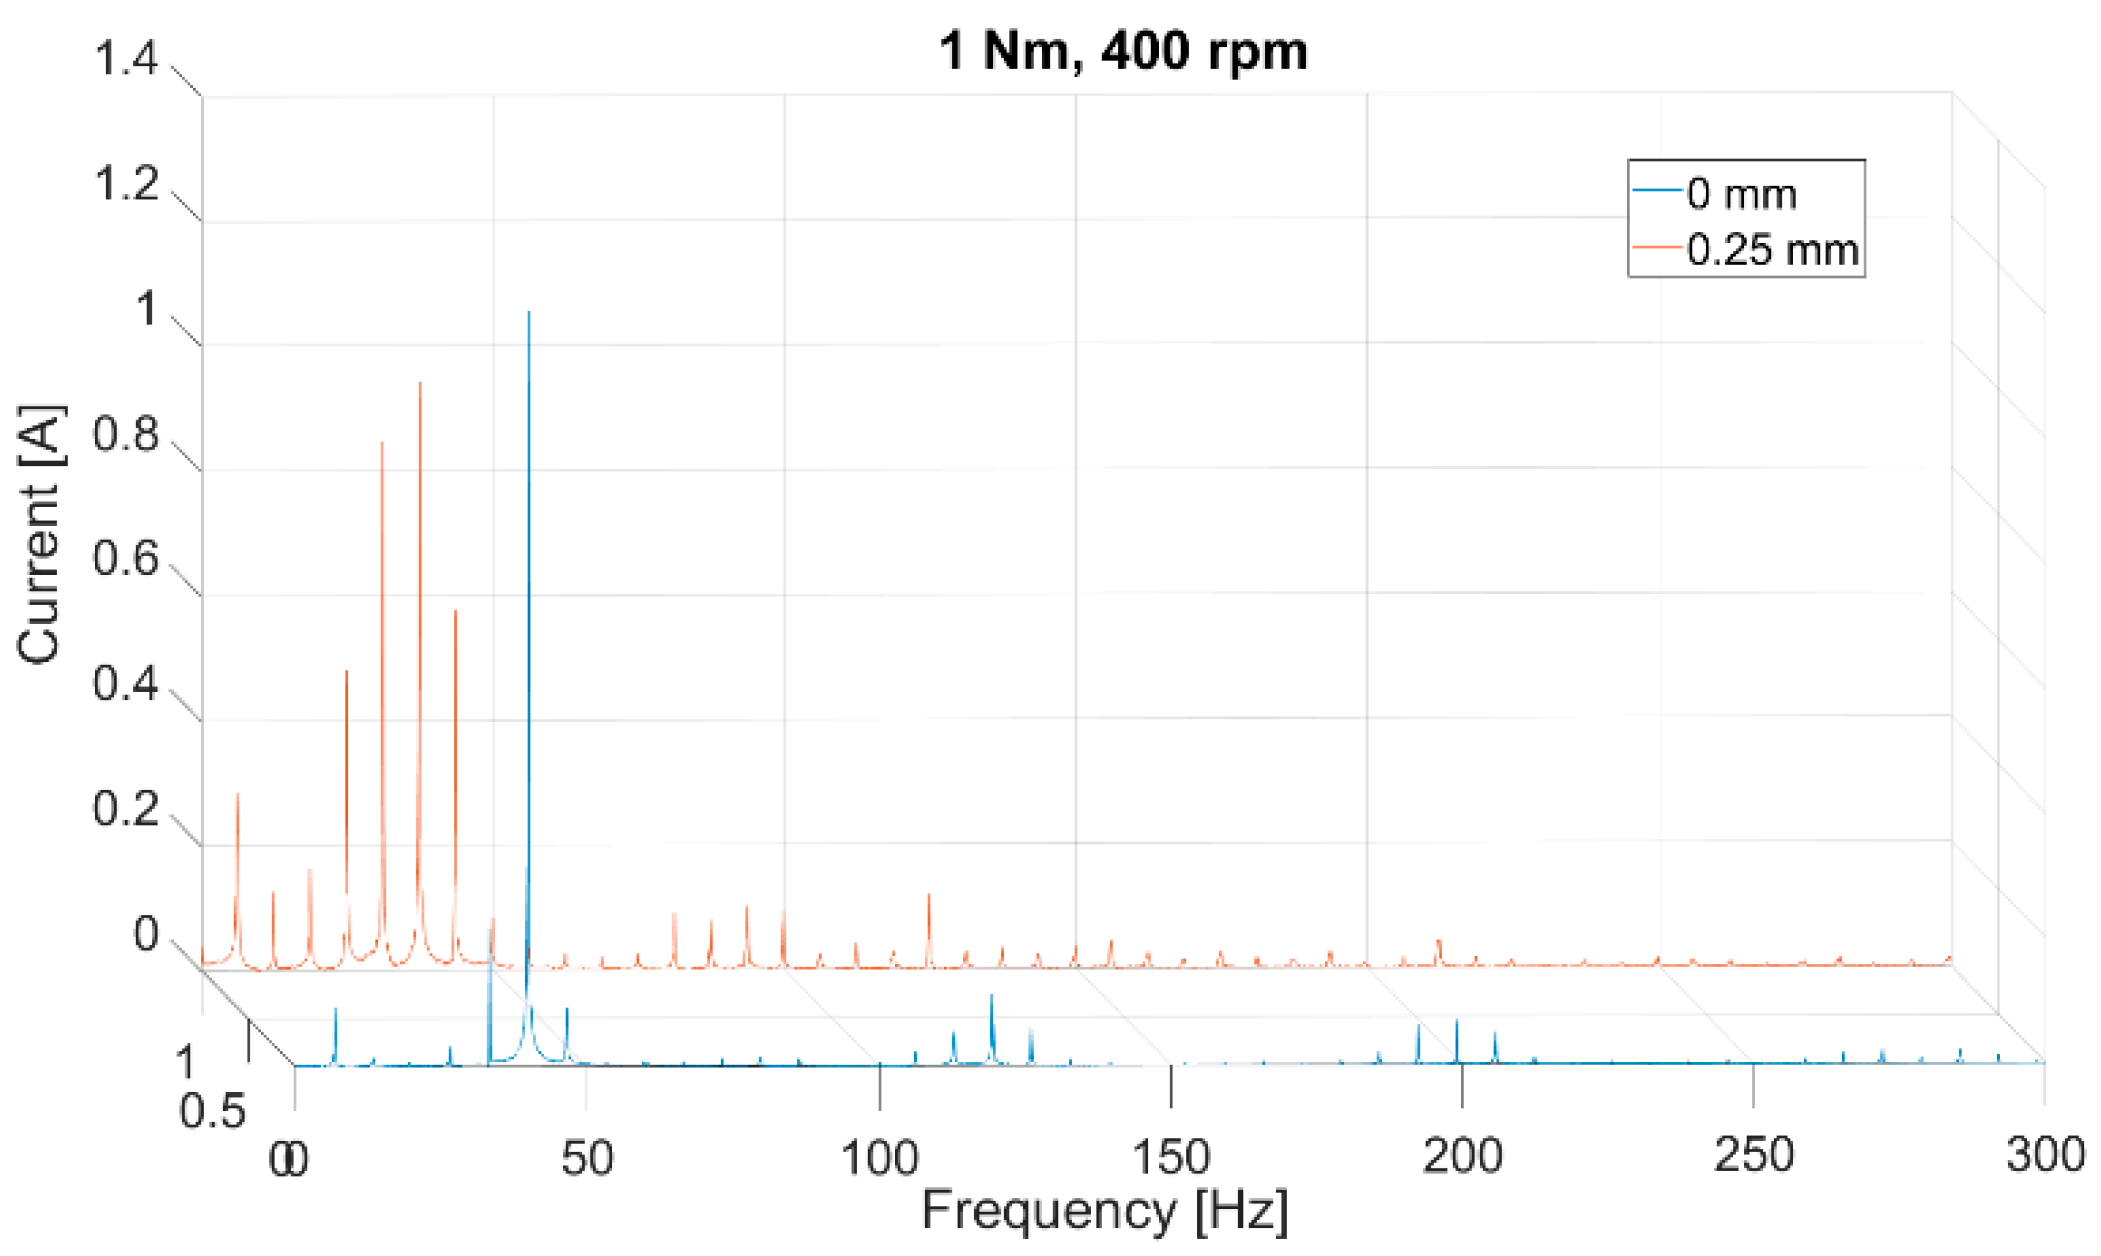
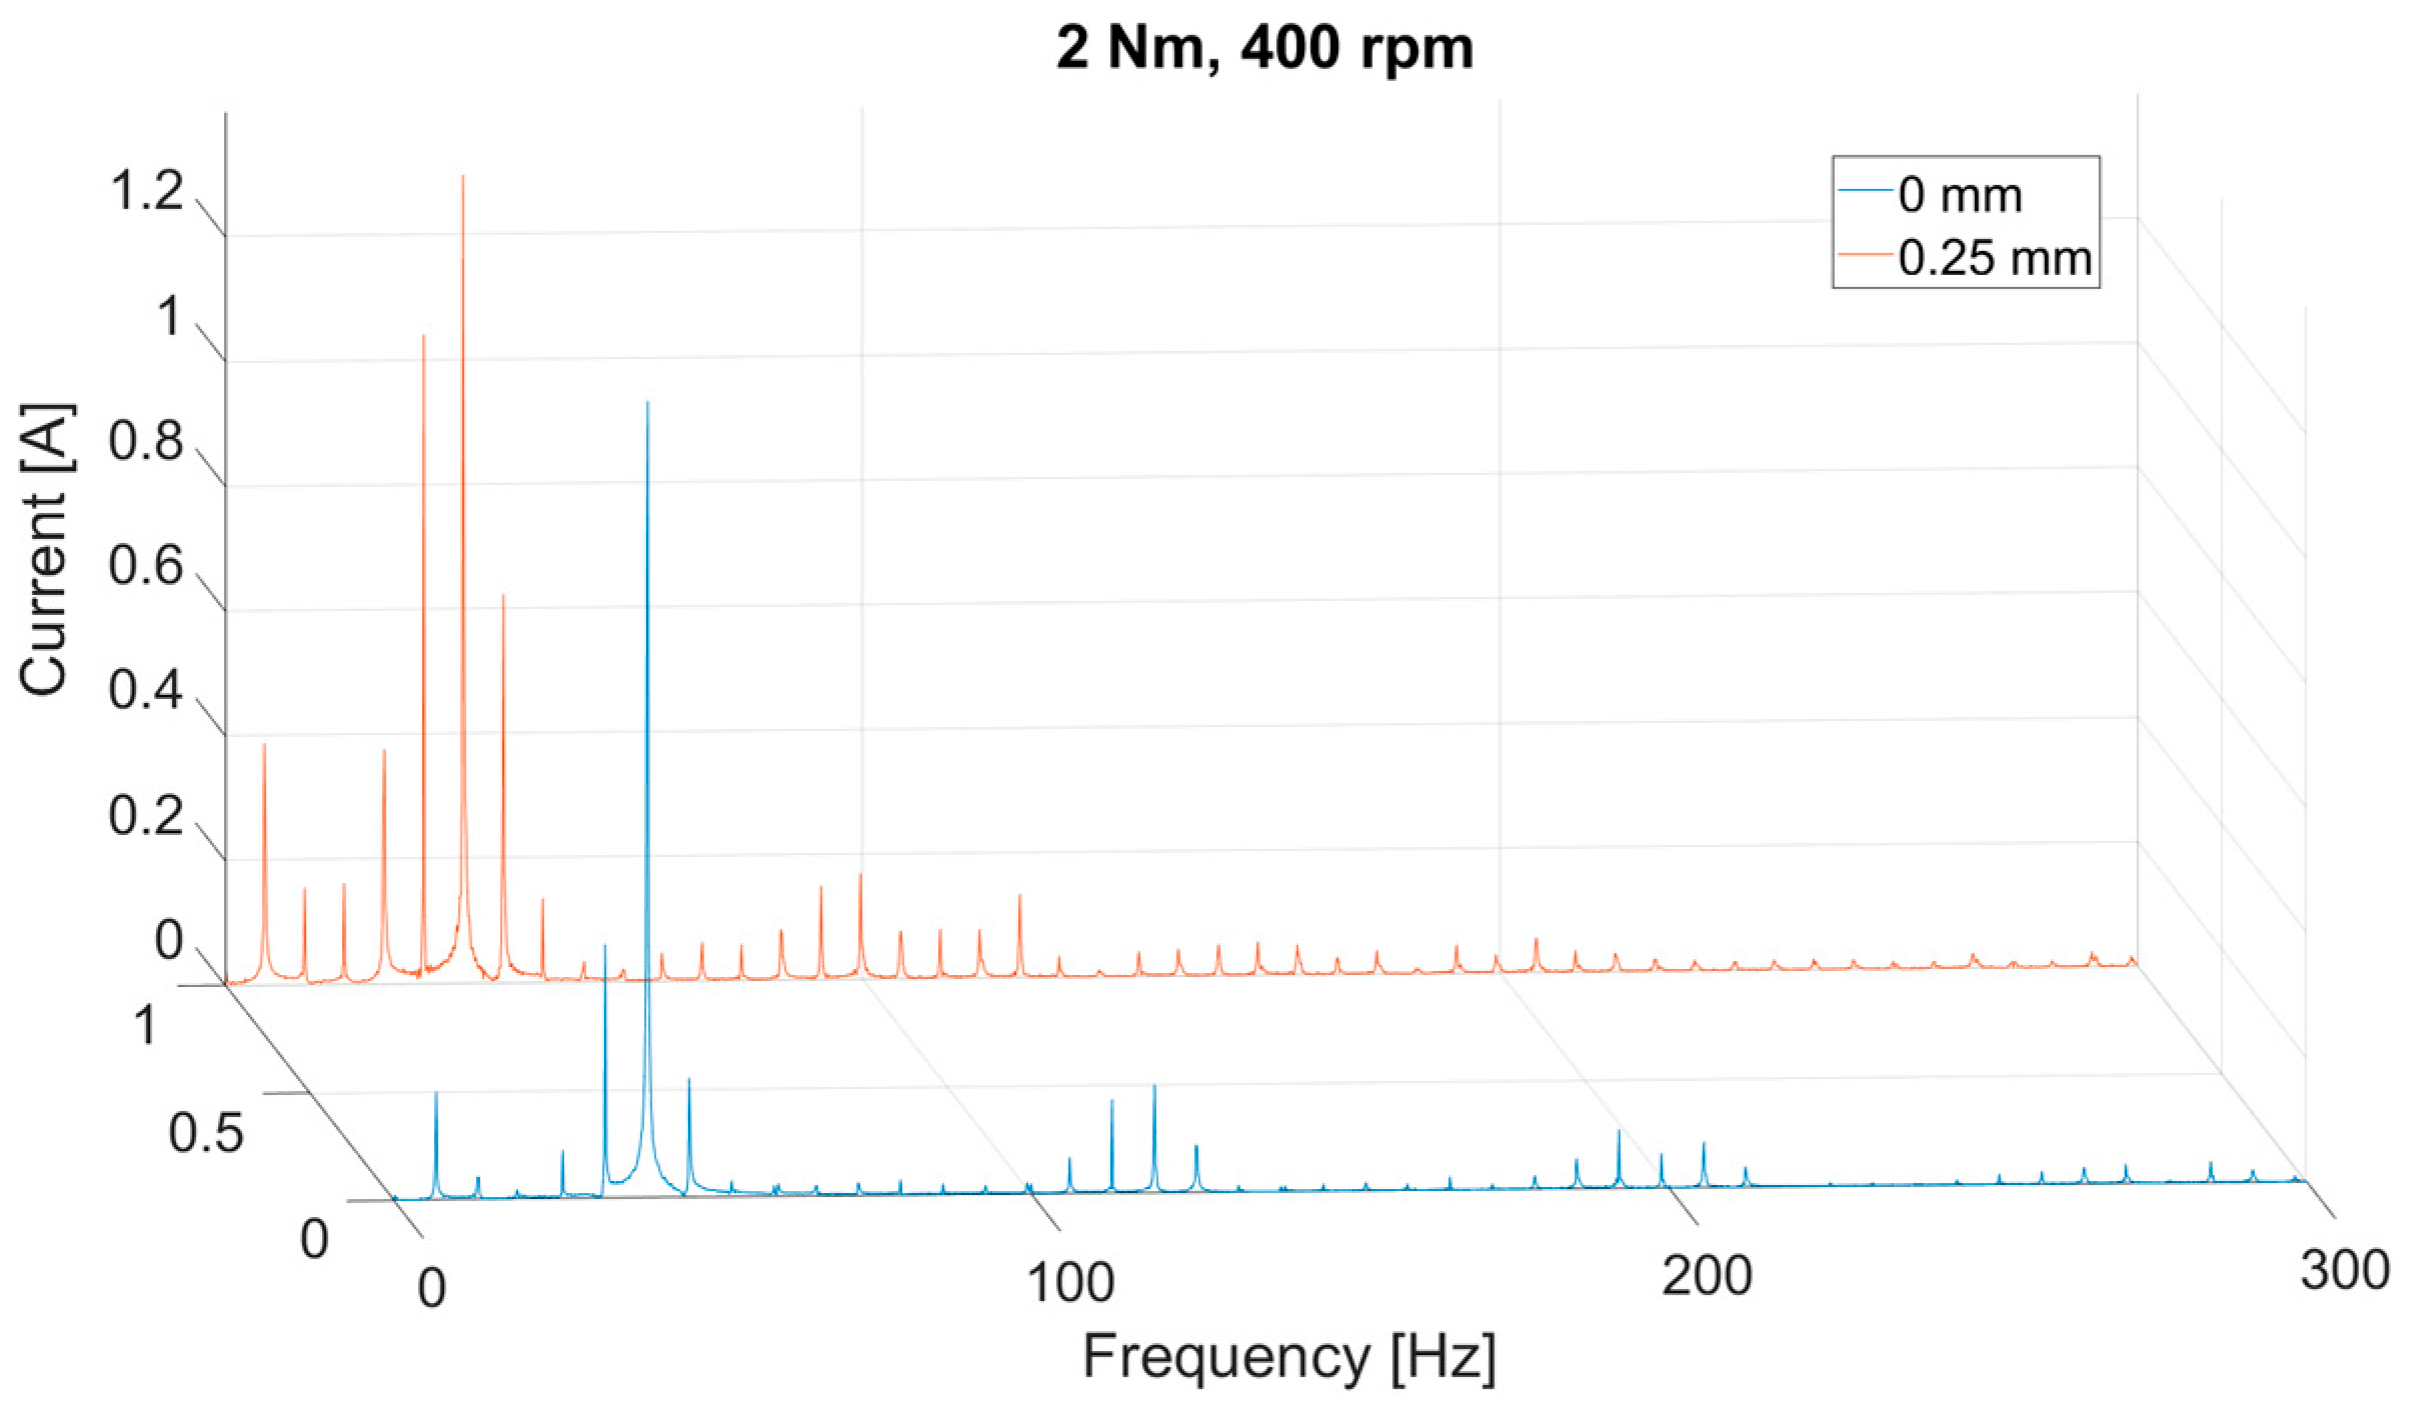
However, the results are precise and very similar for torque loads equal to 1 and 2 Nm. With an applied fault, all peaks, one through six, develop in high values, especially those adjacent to the sixth central peak. As the load increases, the signal amplitude increases only slightly.
Additionally, the prominent peak and the adjacent side peaks are reproduced to a lesser extent for subsequent, lower frequencies twice, as if for the third and fifth multiplication of the sixth harmonic.
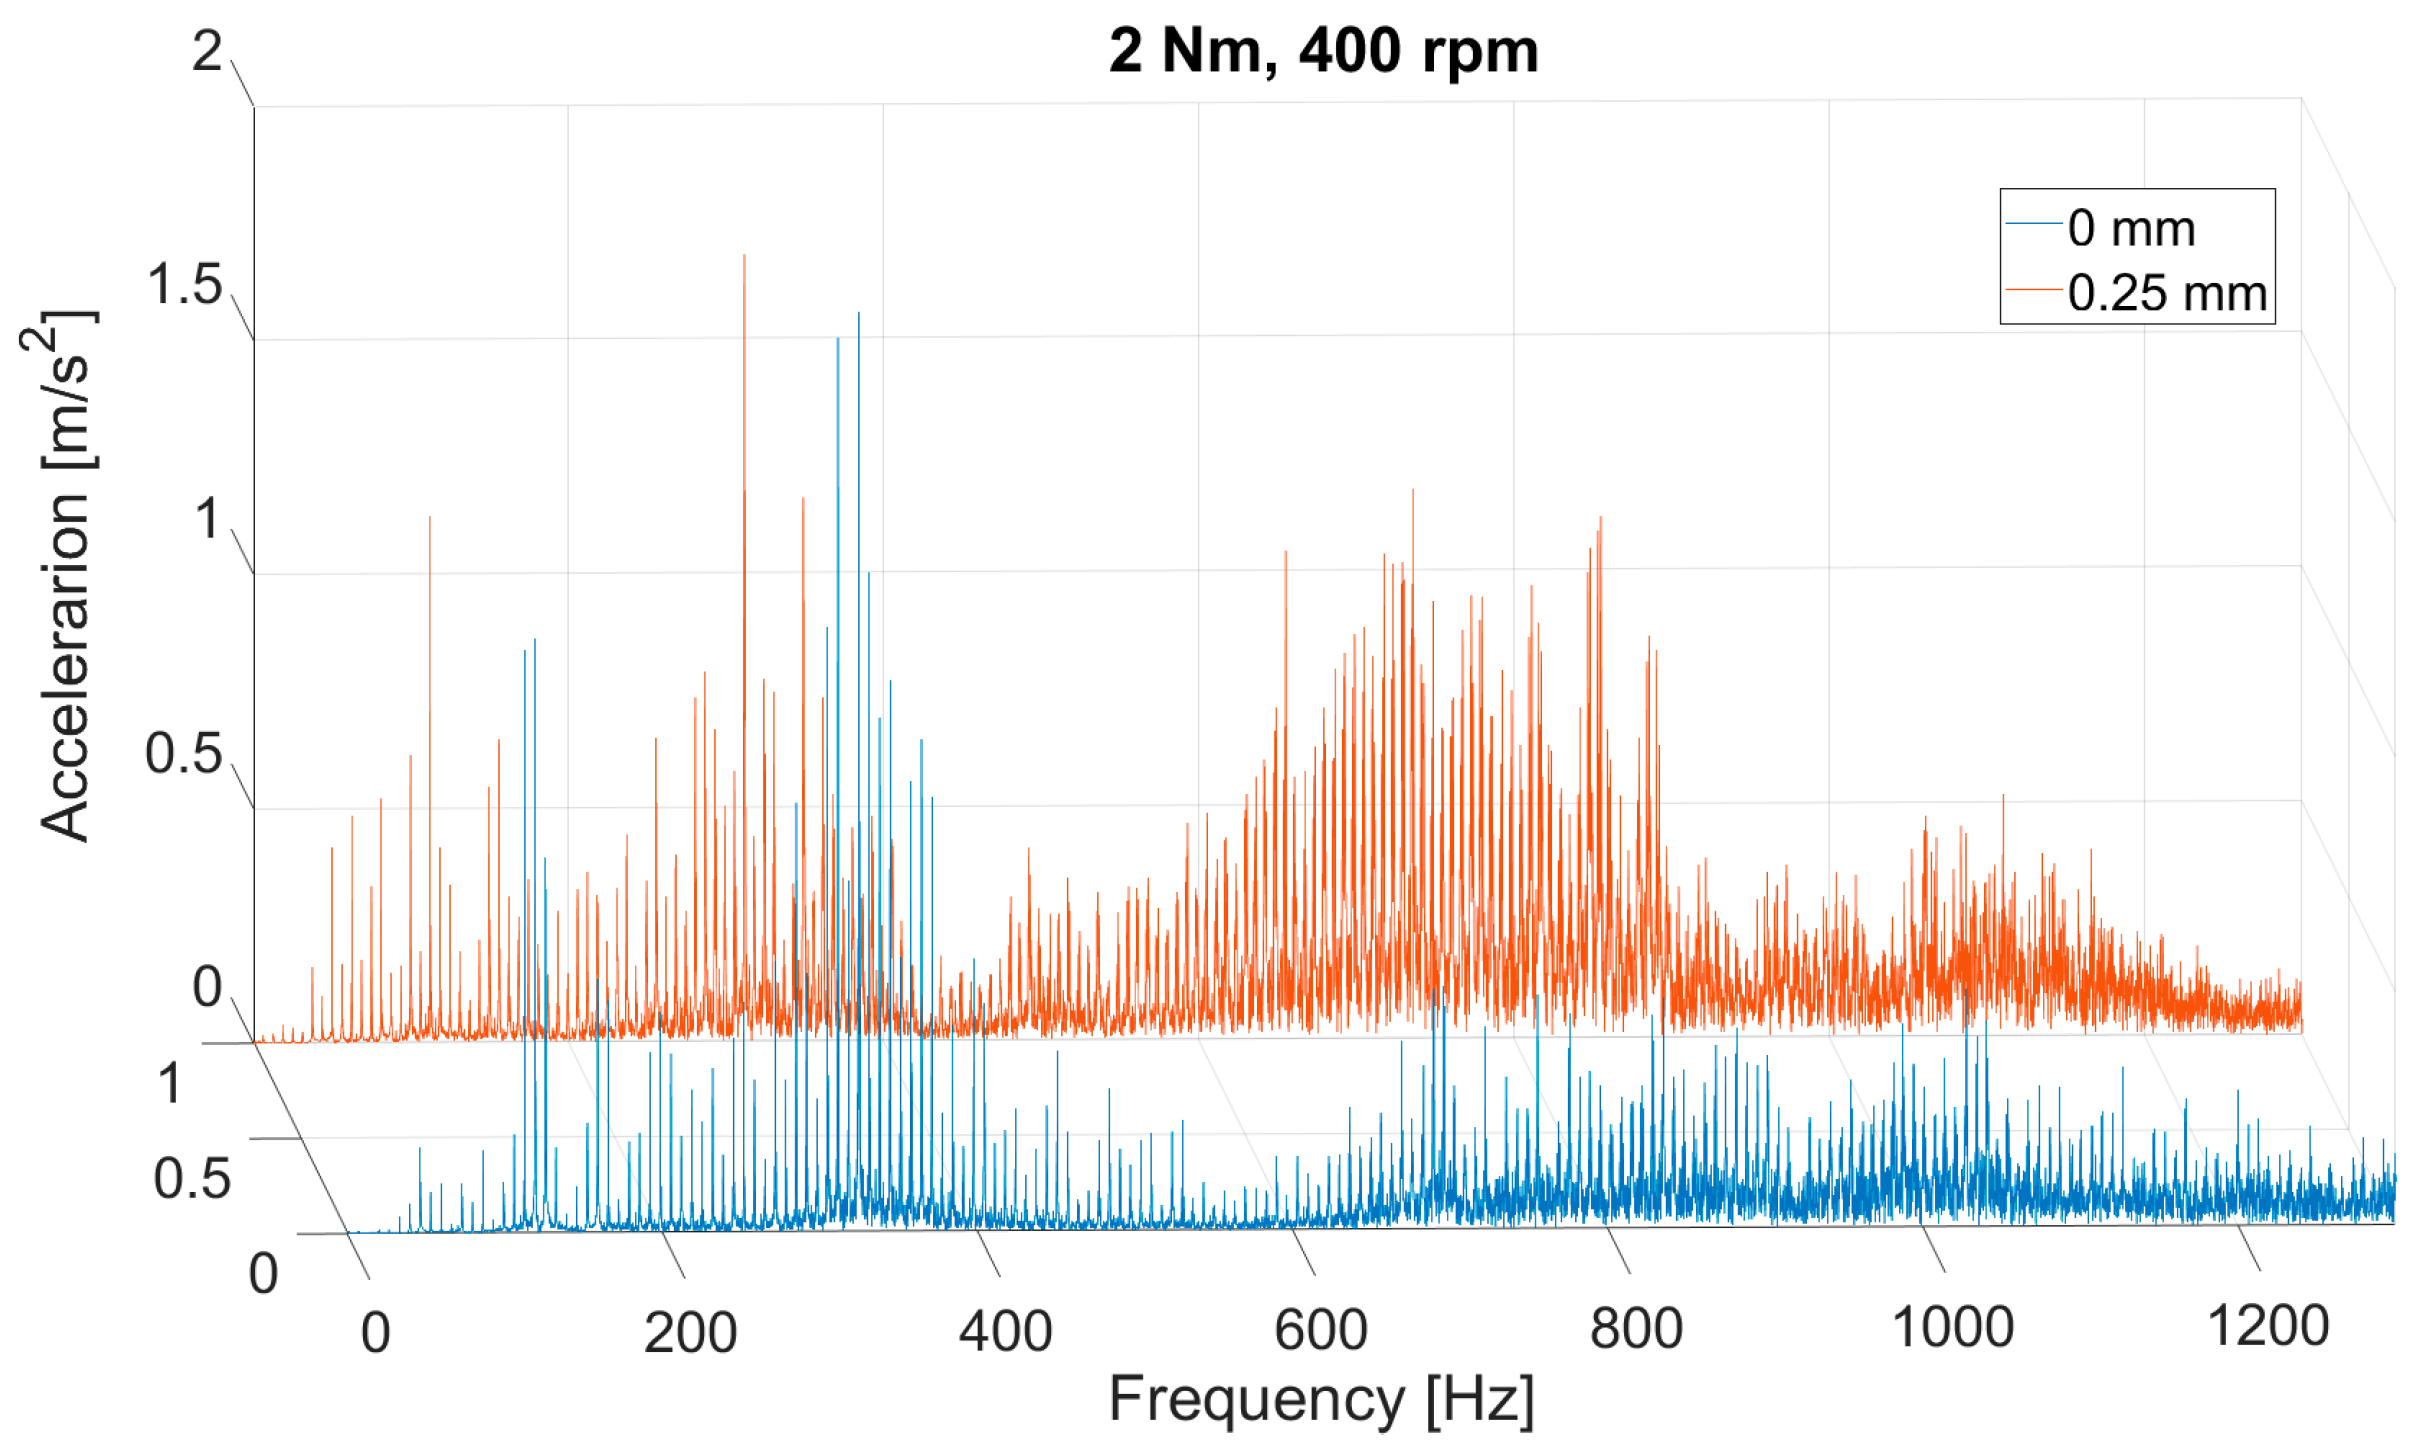
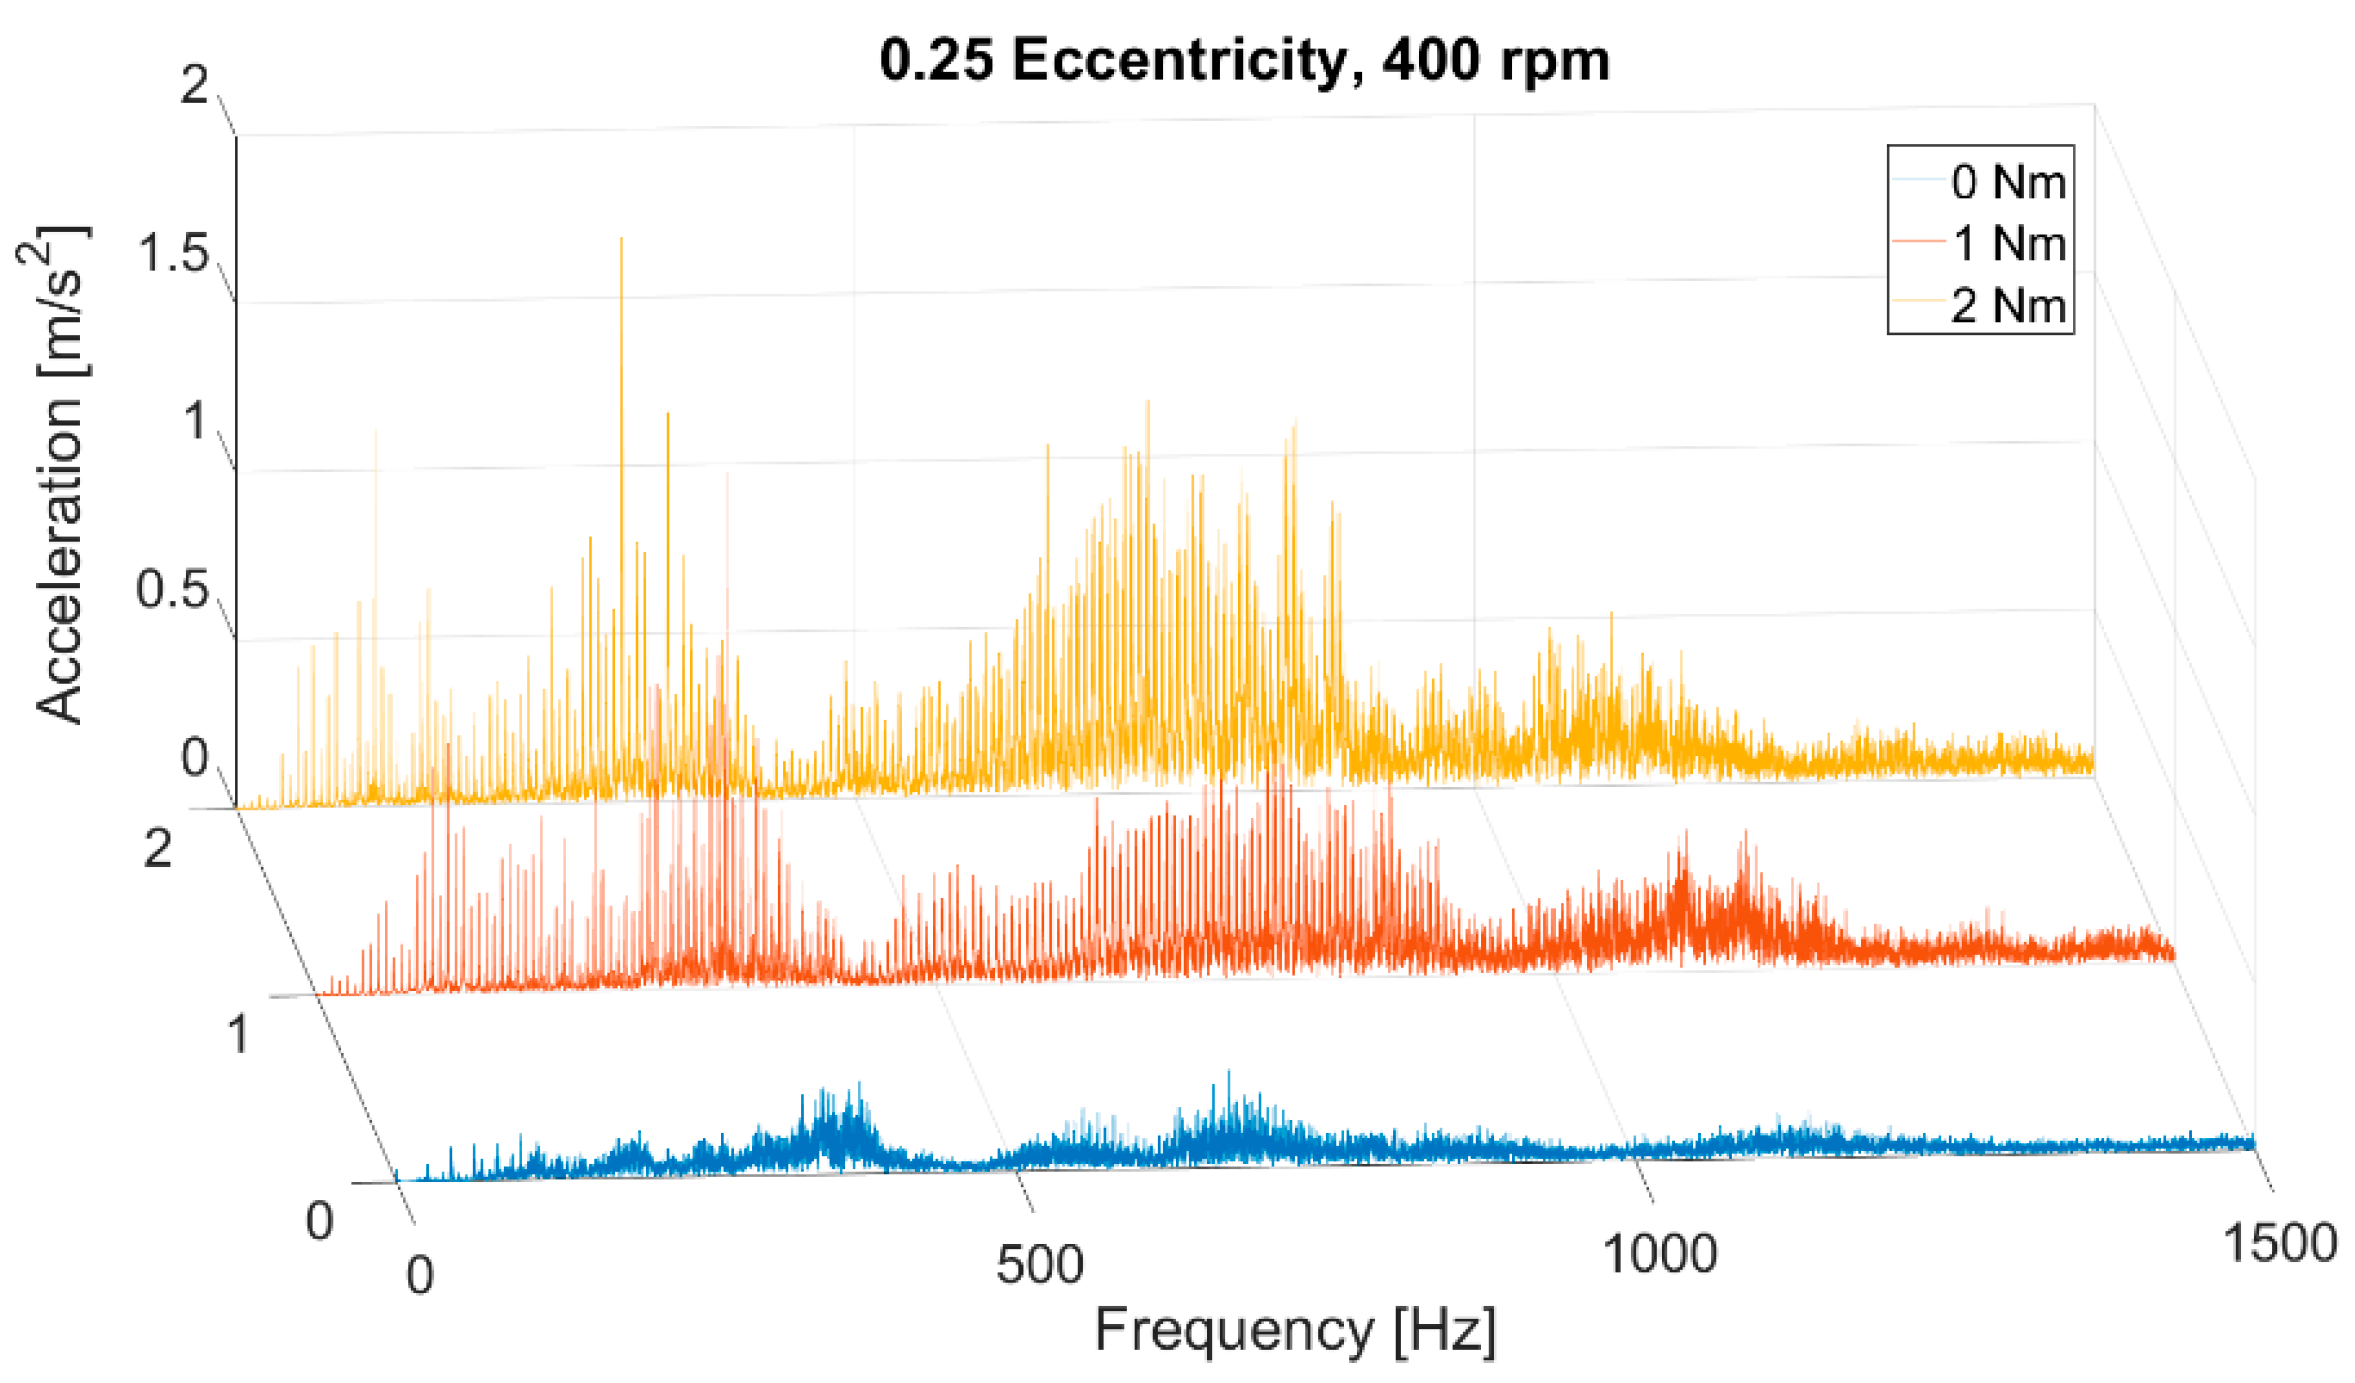
The graphs in
Figure 11,
Figure 12 and
Figure 13 illustrate analogous results for the acceleration signals. Generally, they are incomparably more distorted than the current results. Three areas increase the amplitude with increasing torque load, which is similar to the current spectra.
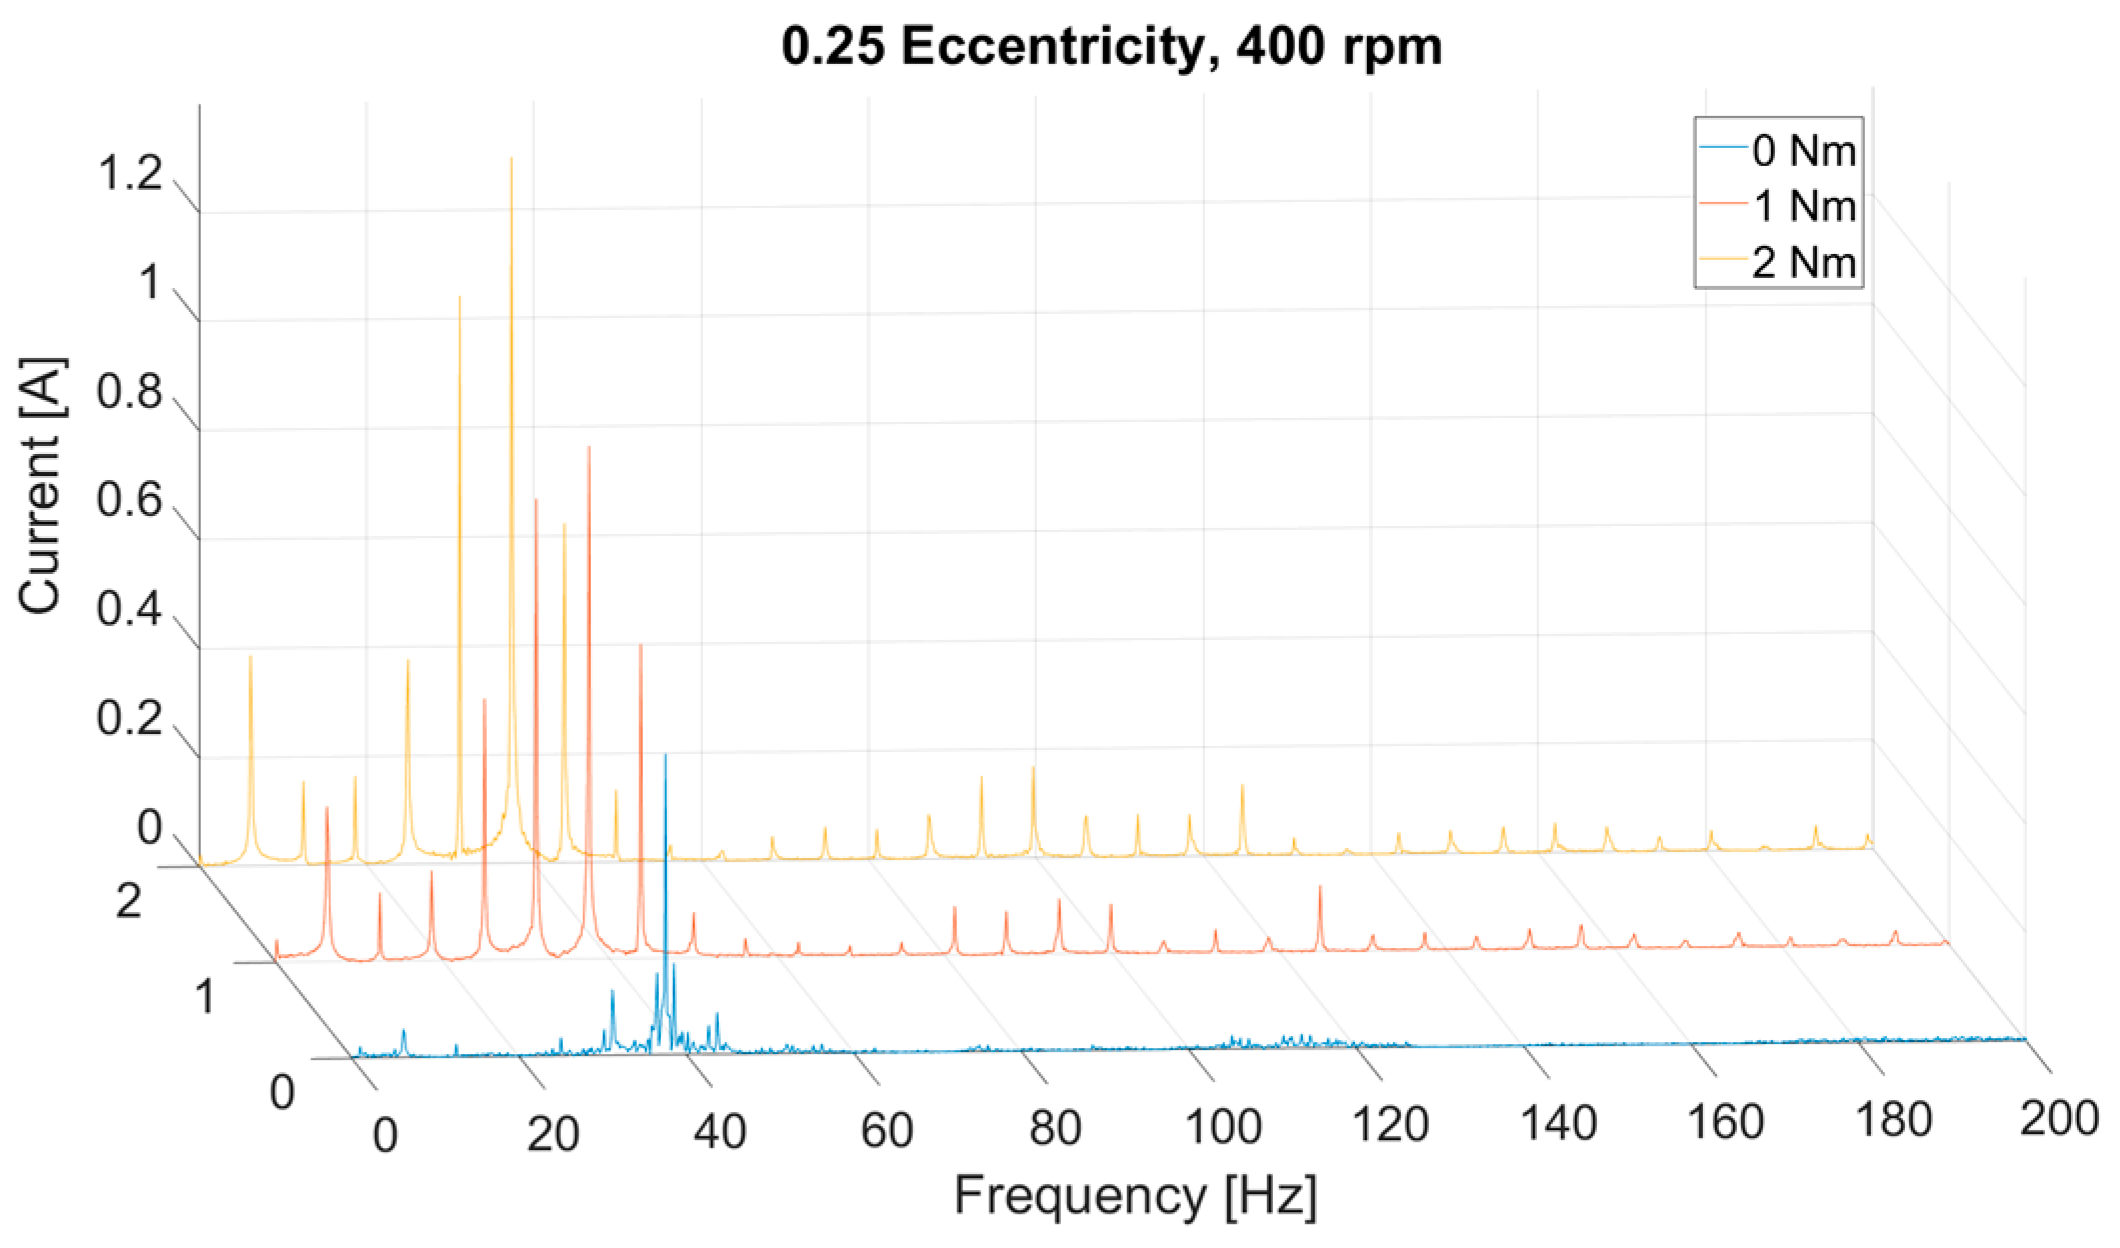
The charts below (
Figure 14 and
Figure 15) summarize the effect of the load increase in the applied fault condition for three measurements in one figure.
3.2. The Results of Imbalance Tests
The imbalance fault was set by mounting a disc with special openings on the motor shaft. A screw could be inserted into these openings to apply imbalance. In practice, there were three cases: no imbalance, imbalance A with screwing in the proximal screw, and imbalance B with screwing in the farther screw.
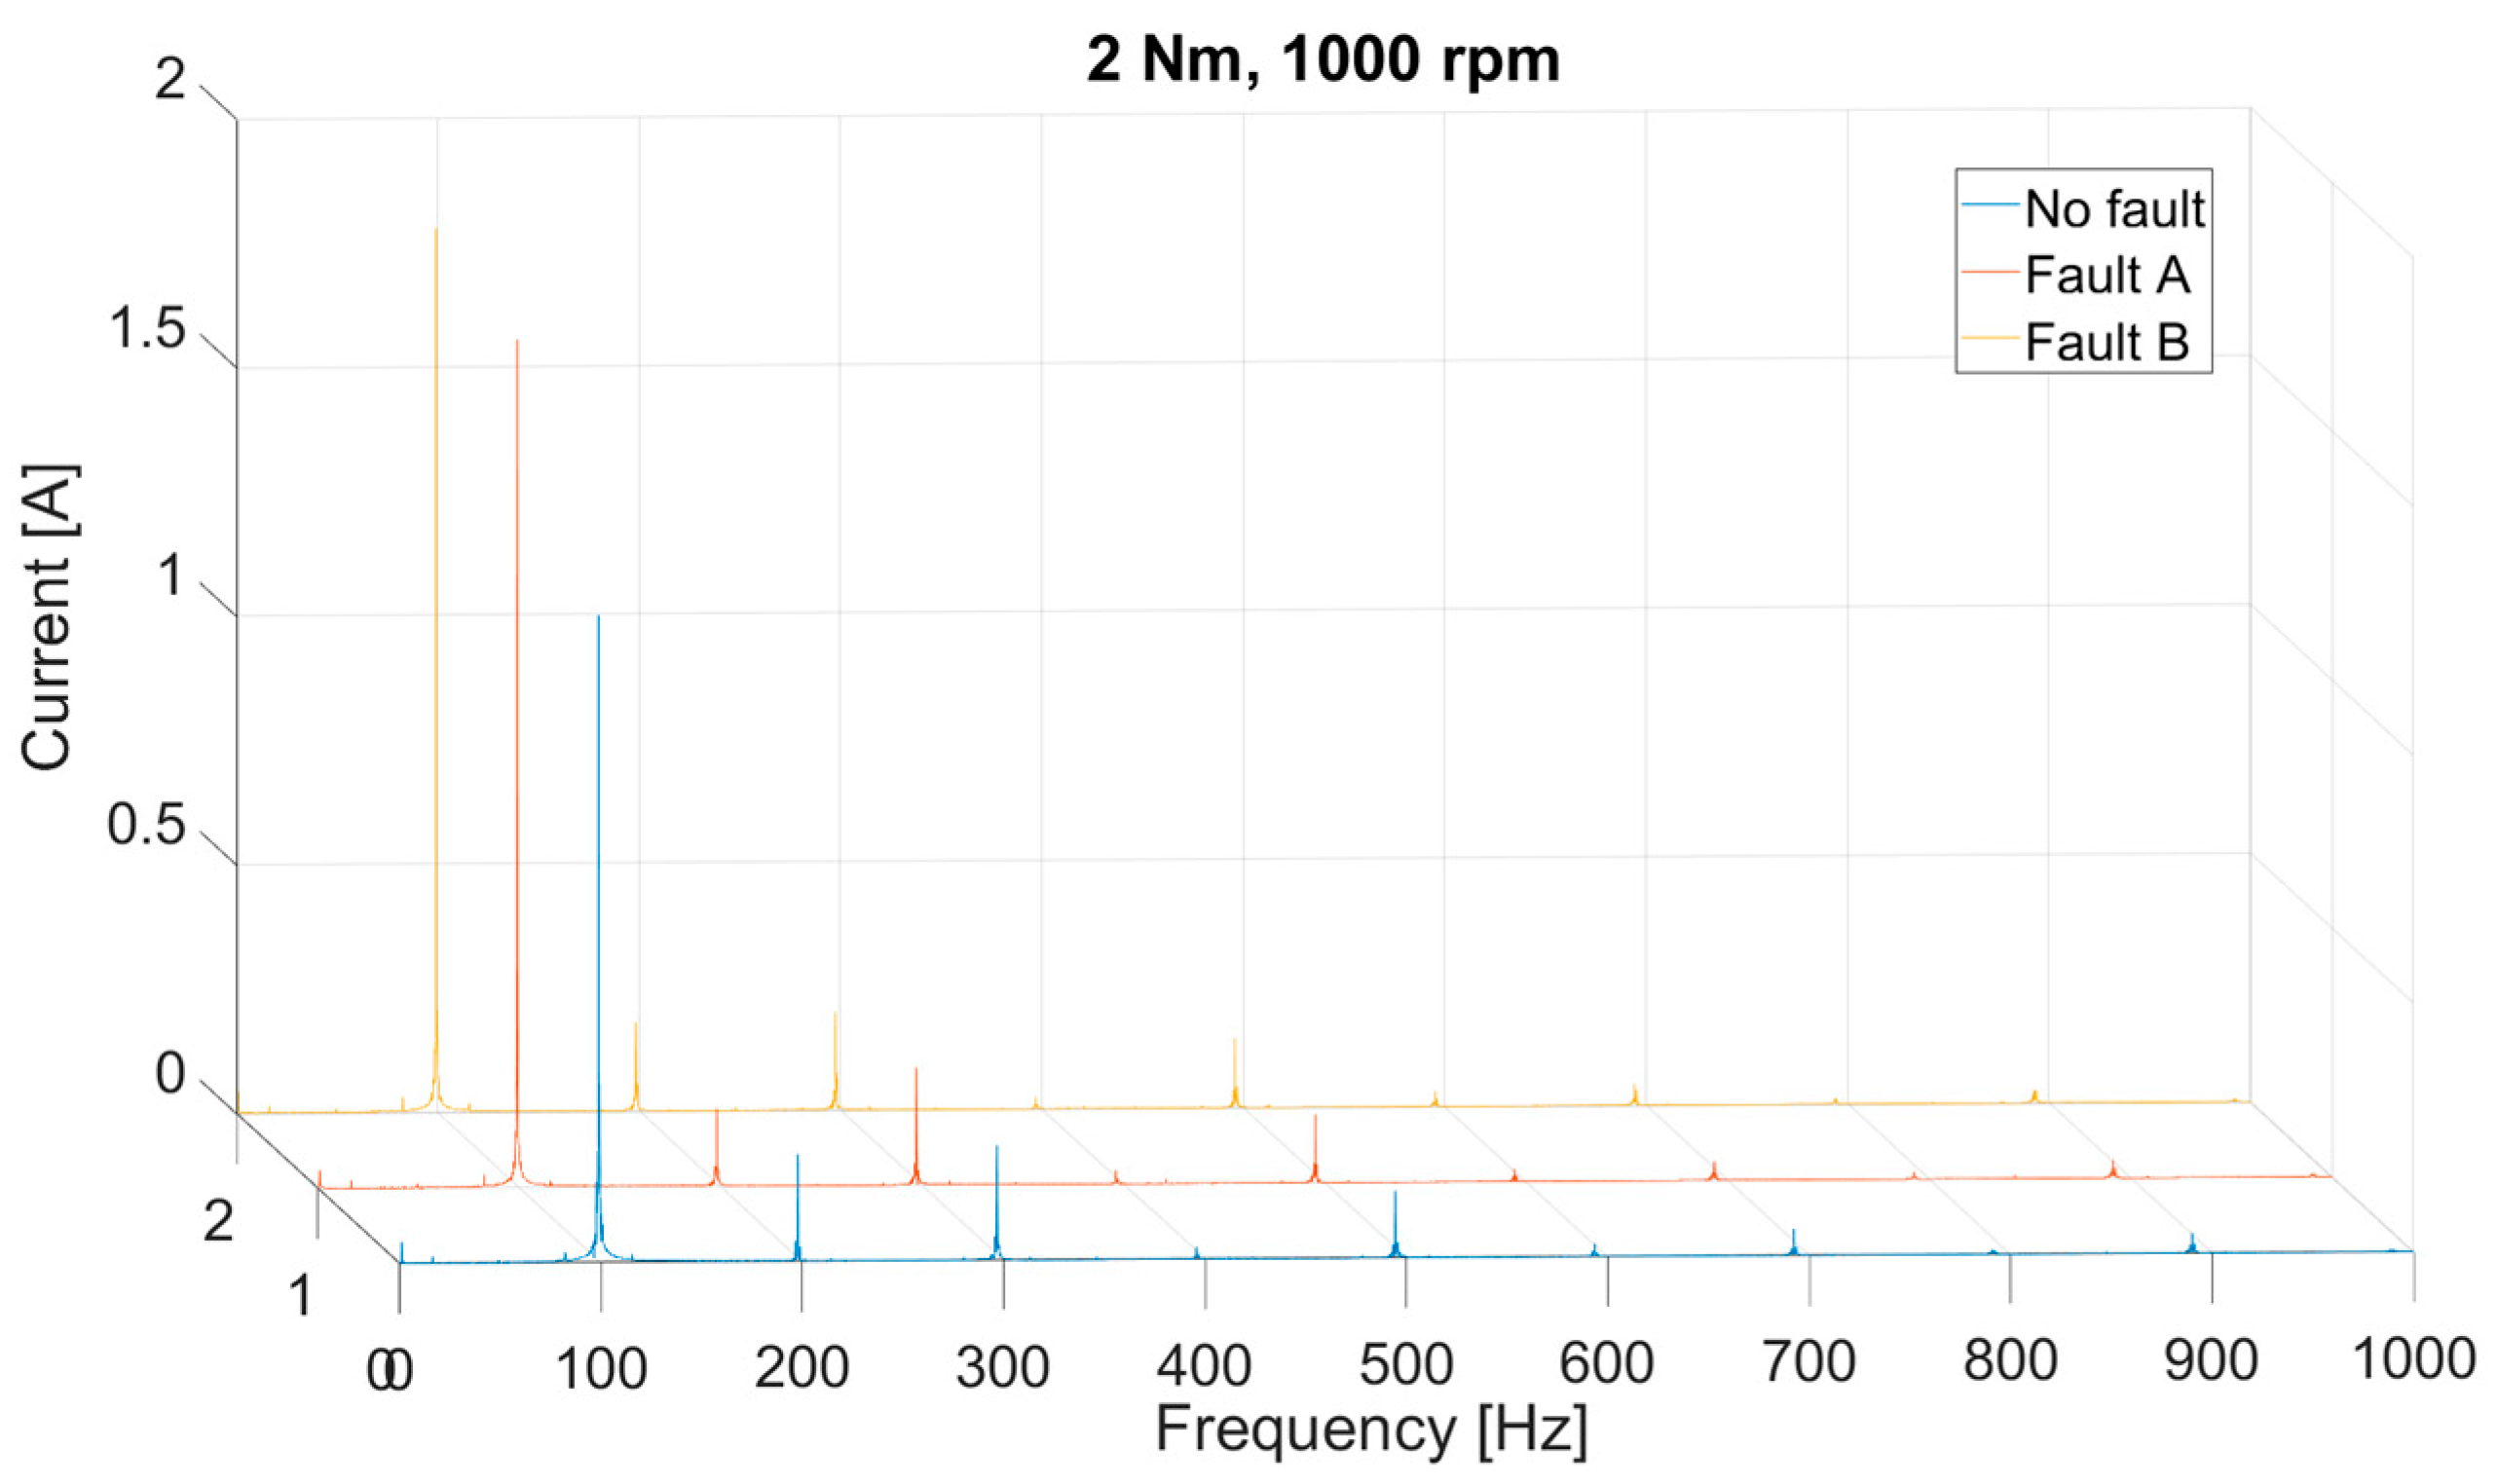
Figure 16 and
Figure 17 compare the healthy and faulty states at the highest load (2 Nm) at 1000 rpm for the acceleration and current signals.
In this case, the results are more transparent and less distorted than for the eccentricity fault, and there are no significant differences between the proper and faulty motor operations. The acceleration signal is also distorted. However, the current graph is much more apparent than in the case of the eccentricity fault. The sixth current peak and its second, third, and fifth multiples are visible here. There is virtually no difference between the results.
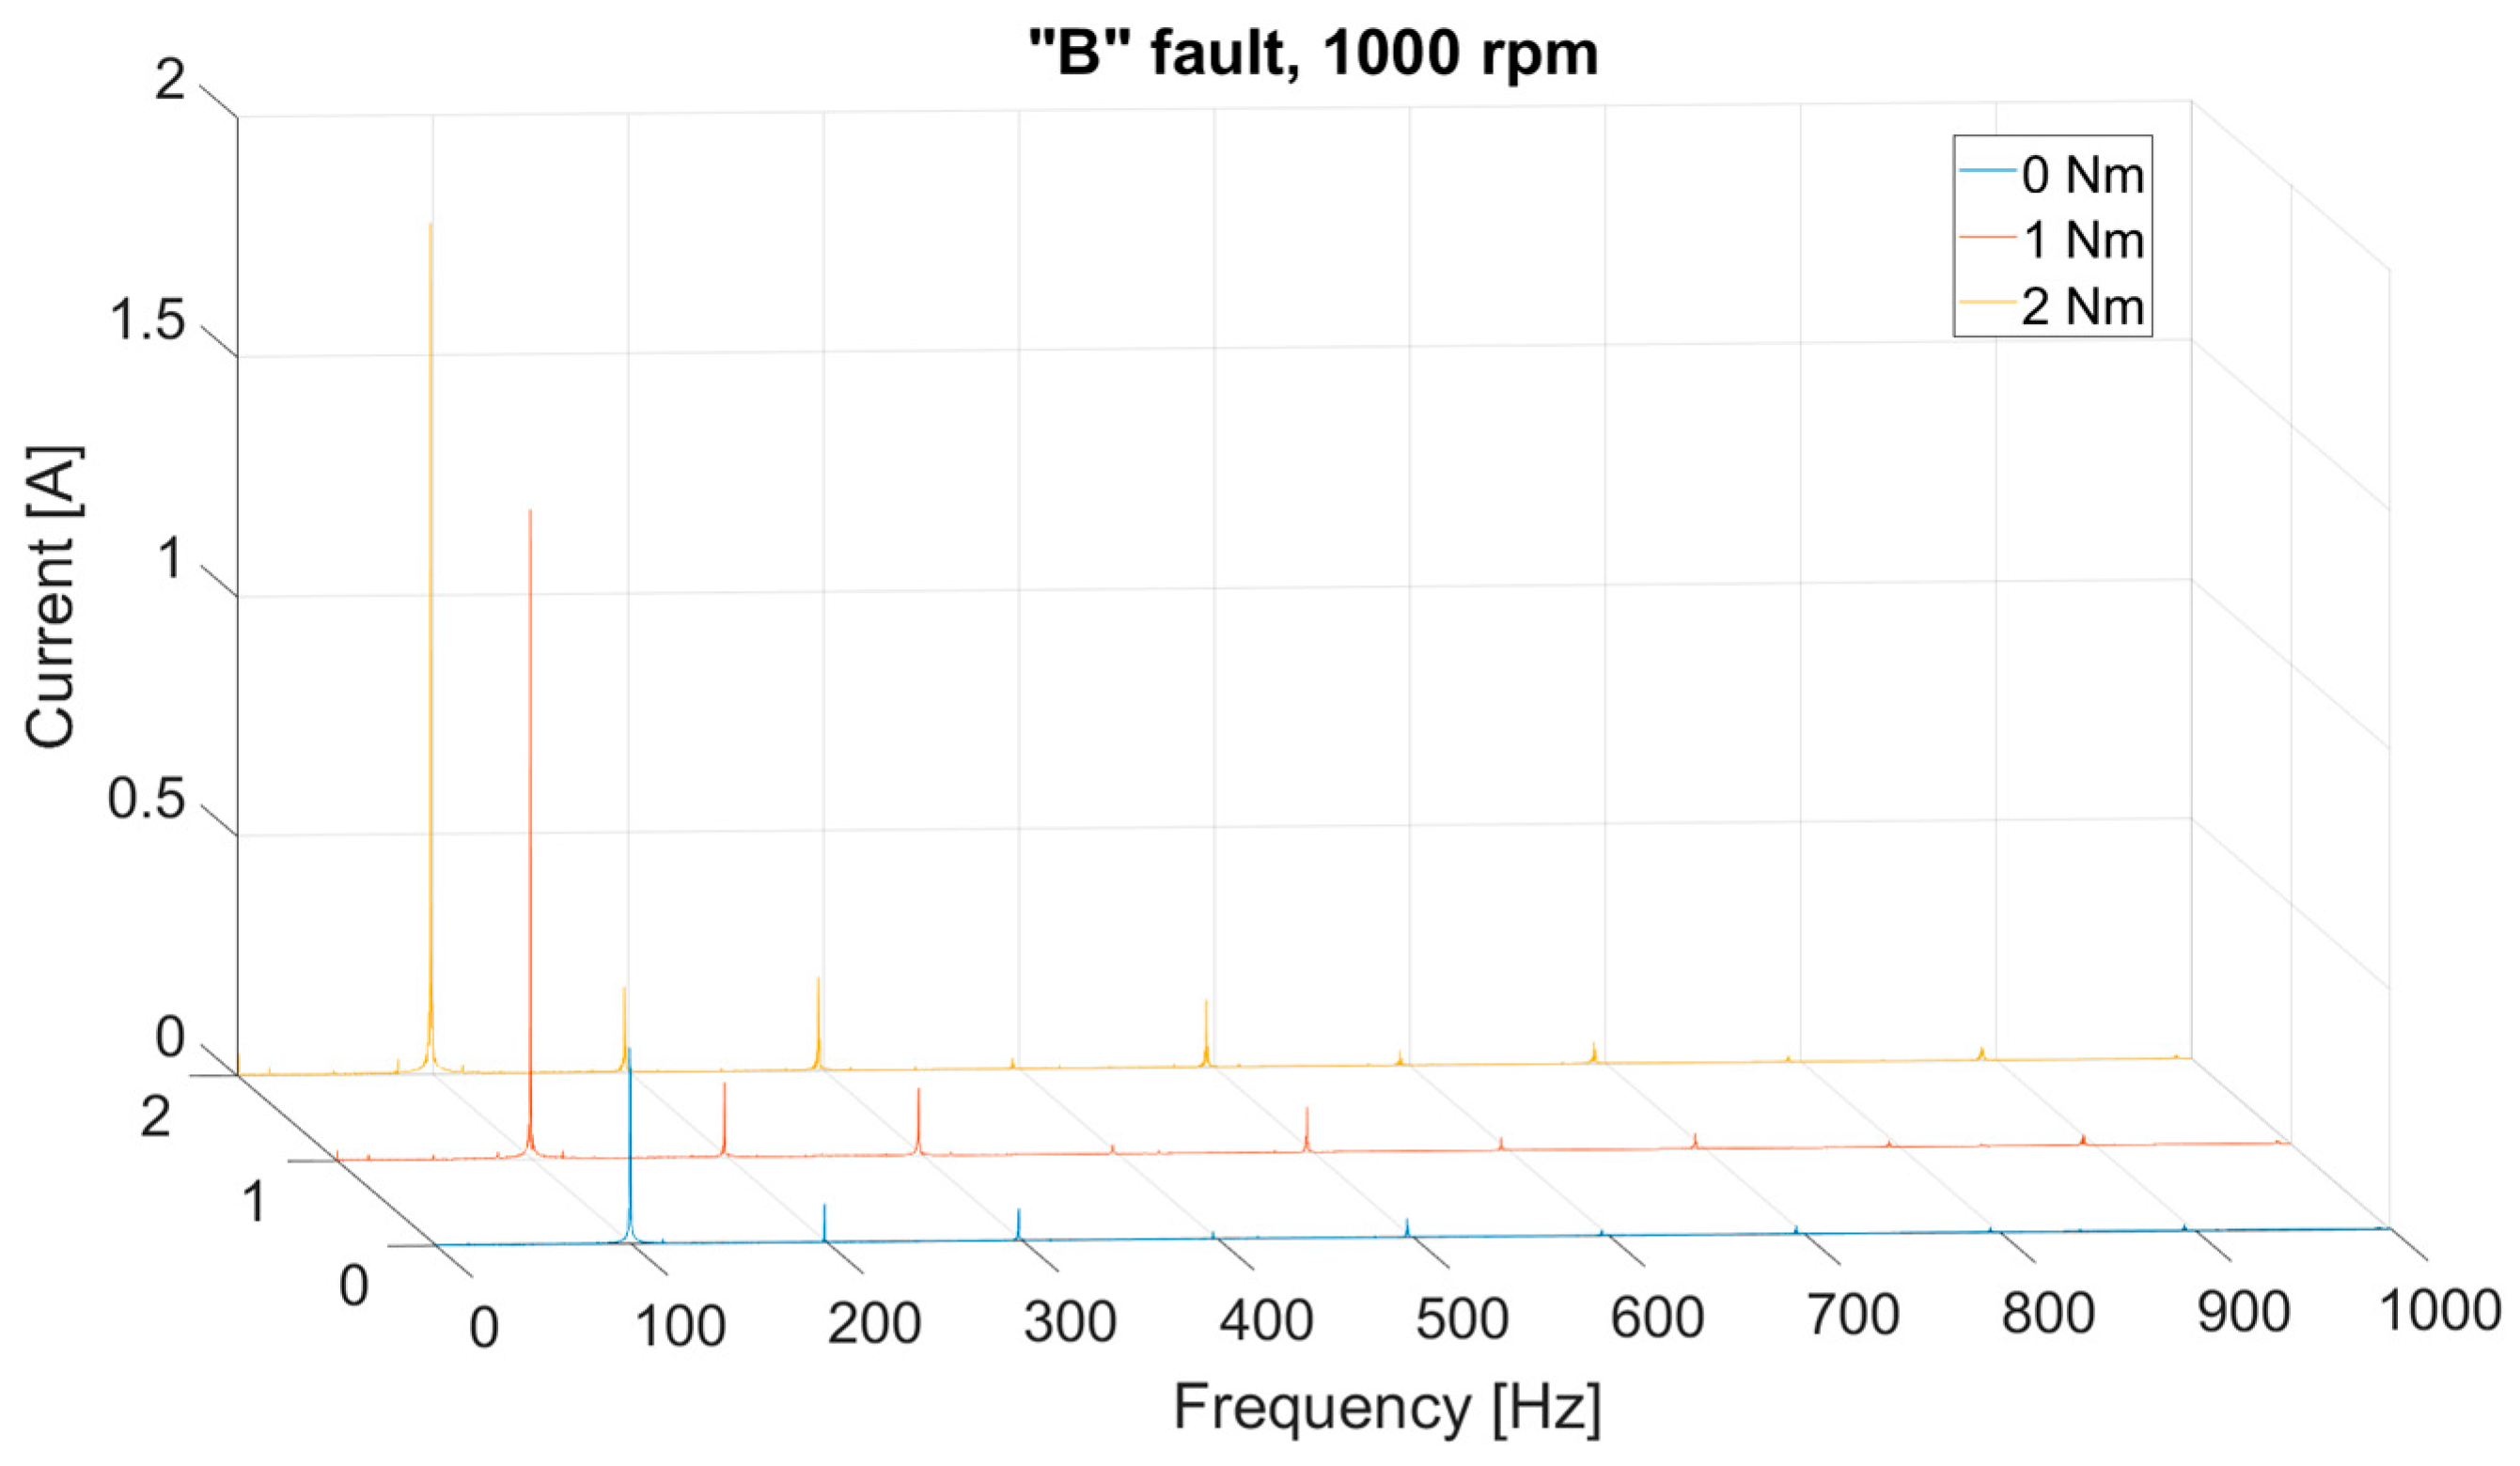
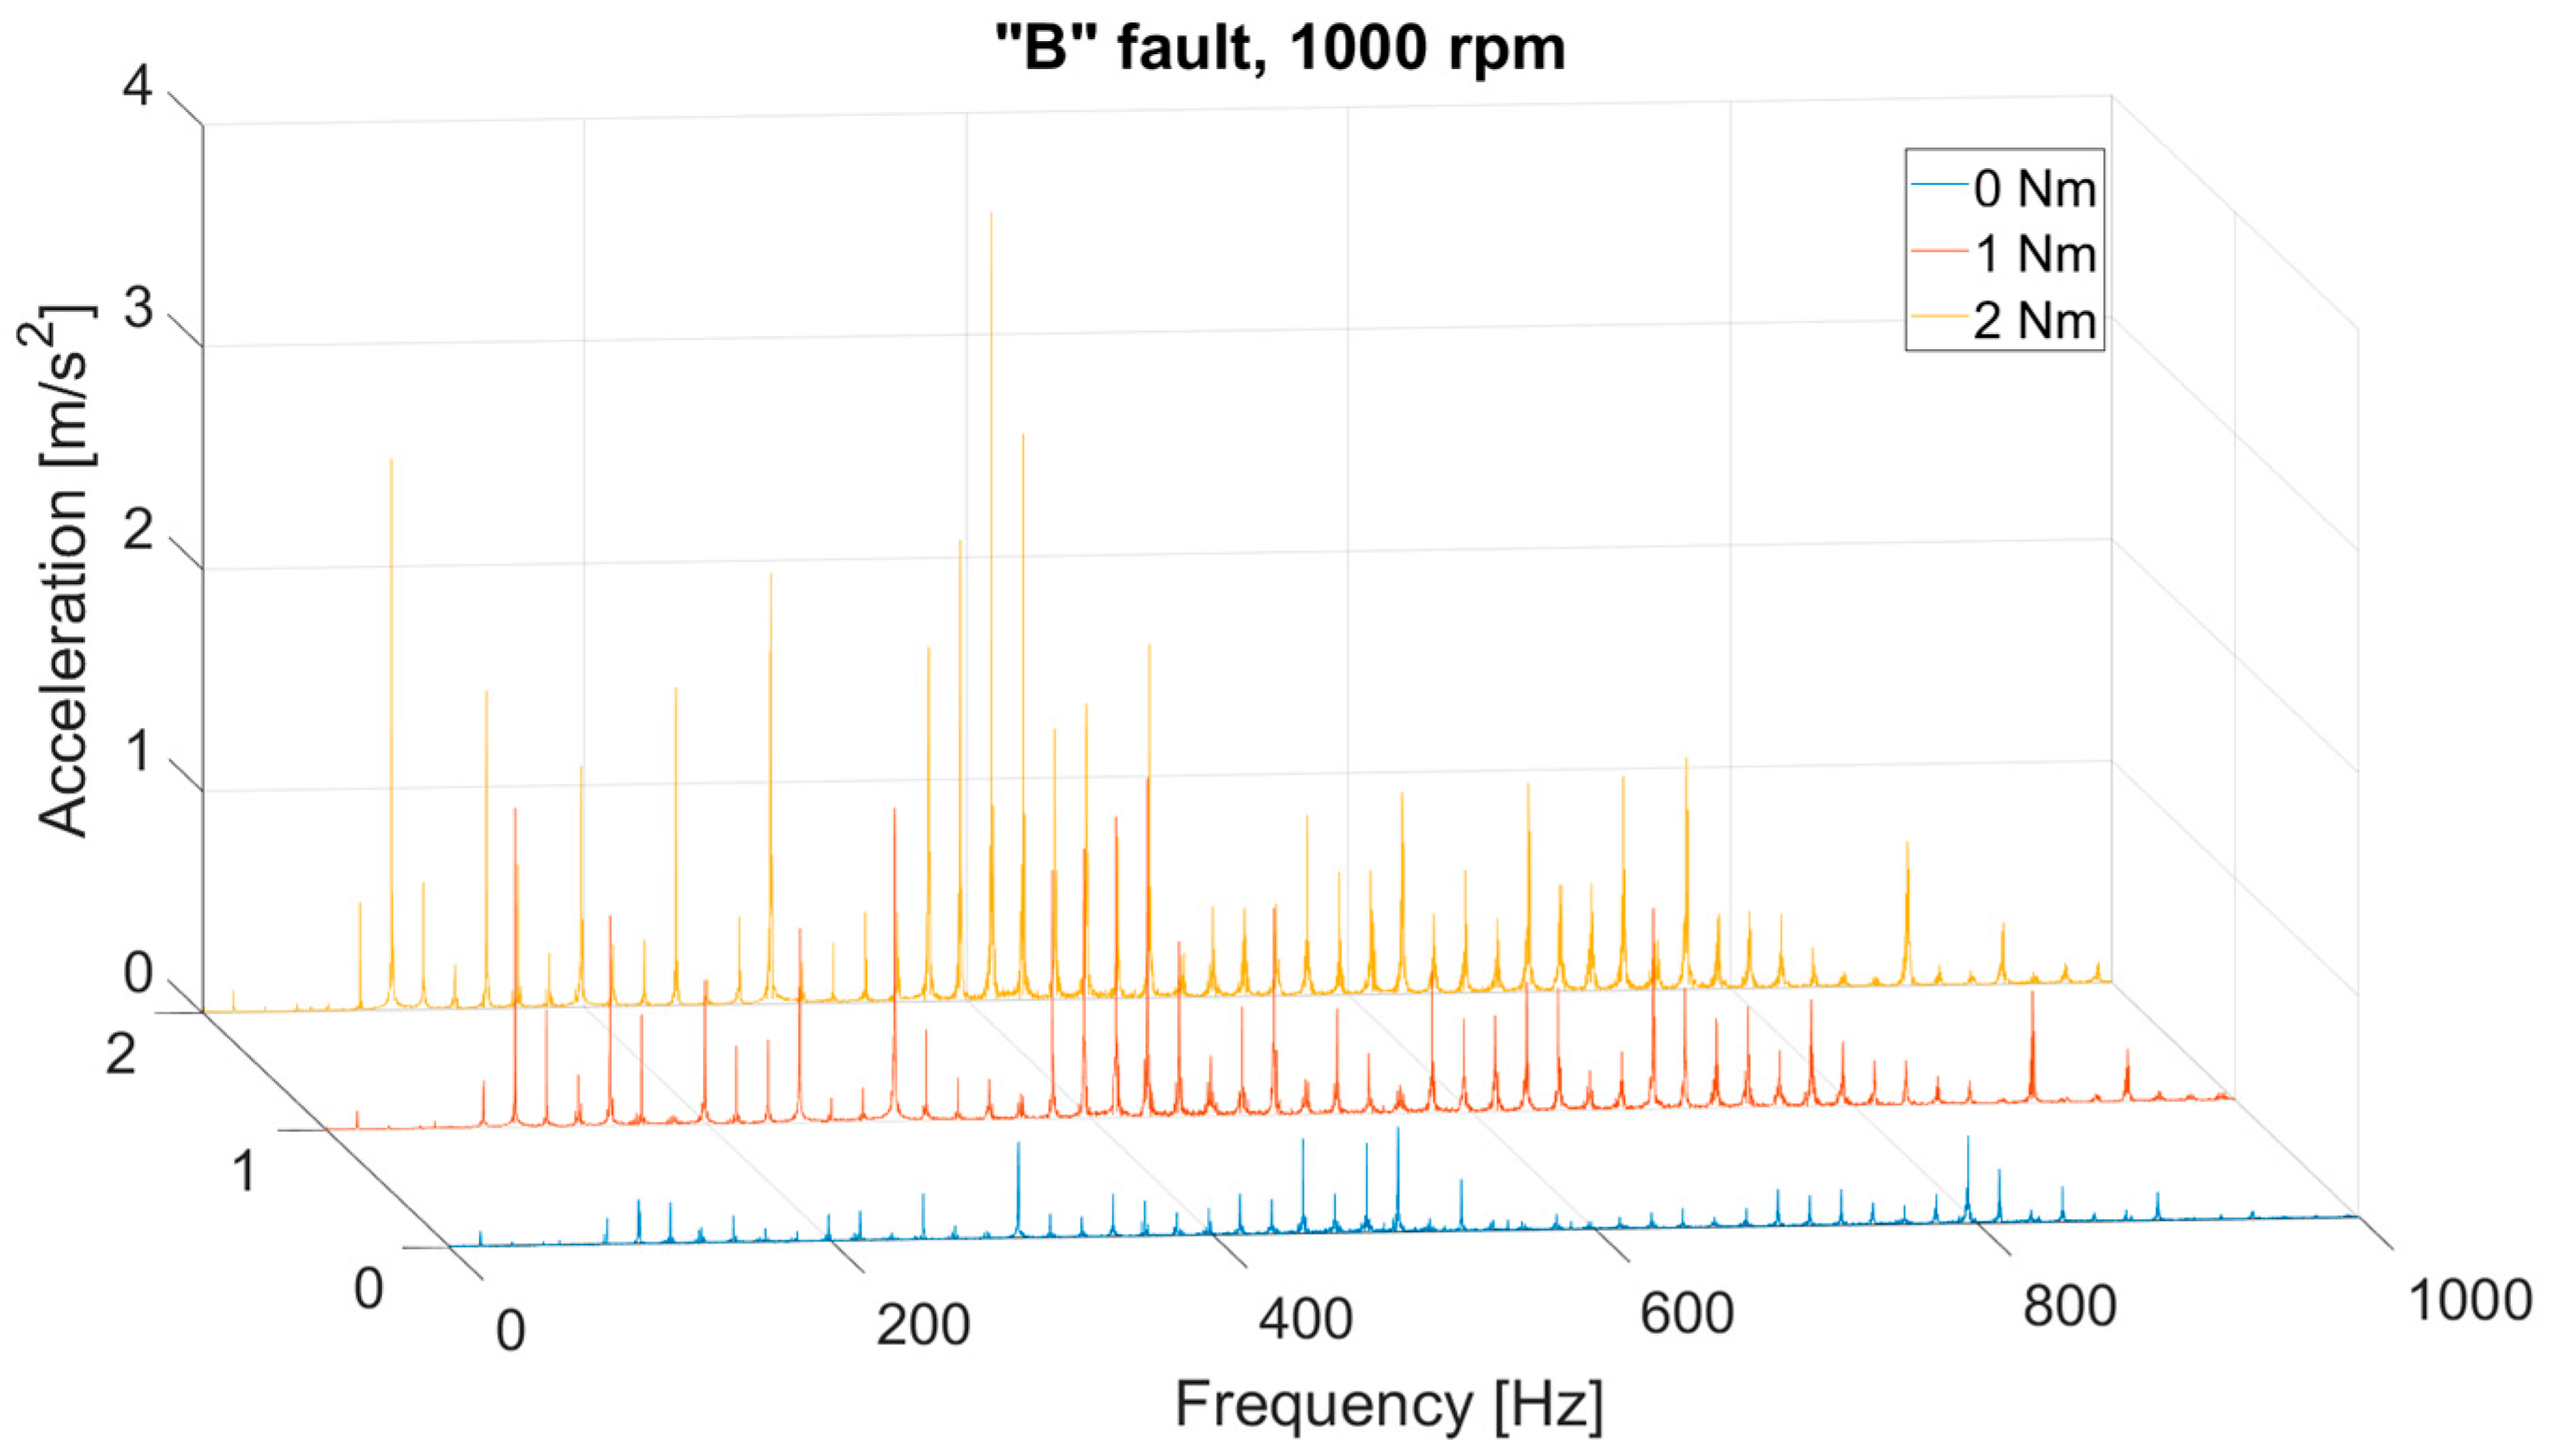
Figure 18 and
Figure 19 depict the results with the load increase at 1000 rpm. The graphs show that as the load increases, the amplitude of the current and vibration signal also increases. There are no nonlinearities nor signal disturbances as in the case of unbalance at 0 Nm.
4. Discussion
This work presents the results of two diagnostic experiments on a reluctance motor: dynamic eccentricity damage and imbalance. The test results were presented as the current signal and acceleration (vibration) spectra. The load torque and motor speed values were changed during each experiment.
The first test was the diagnosis of the dynamic eccentricity of the SRM for a displacement value of 0.25 mm. The most precise and interesting results could be observed in the current spectrum at the lowest SRM rotational speed of 400 rpm. For both motor operating states, the sixth and, to a lesser extent, eighteenth and thirtieth peaks (third and fifth multiplications of the sixth peak) are visible on the graph (since the SRM has six poles on the rotor); another interesting phenomenon appears in the state with a given fault. Namely, in the vicinity of the principal sixth harmonic, two high peaks (the fifth and seventh peaks, respectively) appear on both sides of it and, to a lesser extent, between the sixth and first harmonics, the value of which also increases noticeably. This phenomenon is an effect of amplitude modulation.
It is worth noting that this phenomenon decreases slightly at higher rotational speeds, but when there is no load, it disappears altogether.
The eccentricity experiment consisted of setting the length of the air gap varying in time, and the magnetic field also varied in time. This was the original physical reason for this fault, which also caused the remaining operating quantities, such as the current and electromagnetic torques, to be sinusoidally variable in time.
The phenomena of nonlinearity occurring in the motor was justified by amplitude modulation in the signal.
The vibration signal from the accelerometer confirmed these results. The exact correlation of the amplitude of the tested signal can be seen depending on the value of the load torque and the rotational speed, as in the case of the current signal. Indeed, the information from the acceleration sensor was more distorted, probably due to the test station’s impact and the motor’s inherent features. Nevertheless, because the current spectrum was incomparably more evident, the analysis was focused on it. However, there are some methods still to be used to study the spectrum of accelerations and their filtration; further research may be carried out.
Two types of damage were introduced for the imbalance experiment: A and B. The graphs show almost no differences between the motor operating states. The spectra are precise, with the sixth harmonic clearly visible (and its third and fifth multiples are slightly duplicated).
While studying dynamic eccentricity presents interesting nonlinear phenomena, the imbalance study does not illustrate any particular differences between the correct operation and the one with a given fault.
The design based on the disc did not allow the imbalance phenomenon to be shown reliably, or it did not show specific properties in the signal. To obtain more convincing results, it would be necessary to use larger screws to be screwed into the disc or to reconstruct the disc itself and the stand.
5. Conclusions
The paper demonstrated that the FFT analysis of the current signal alone may be sufficient to identify the dynamic eccentricity fault as a simple and inexpensive diagnostic method wherever the SRM is functioning.
Consequently, the results acquired in these experiments are a promising contribution to further analyses. Except for the stationary tests, starting or breaking the electric motor is also possible on the constructed test bench.
However, the most critical information will undoubtedly be the comparison of the dynamic eccentricity experiment with the model (FEM and mathematical). This will allow us to determine which factor in the disturbed signal comes only from motor malfunction and which may also result from station imperfections or external factors.
Author Contributions
Conceptualization, J.L. and S.R.; methodology, J.L. and S.R.; software, J.L.; validation, J.L. and S.R.; formal analysis, J.L. and S.R.; investigation, J.L.; resources, S.R.; data curation, J.L.; writing—original draft preparation, J.L.; writing—review and editing, J.L. and S.R.; visualization, J.L.; supervision, S.R.; project administration, S.R.; funding acquisition, J.L. and S.R.; All authors have read and agreed to the published version of the manuscript.
Funding
This research received no external funding.
Institutional Review Board Statement
Not applicable.
Informed Consent Statement
Not applicable.
Data Availability Statement
The raw data supporting the conclusions of this article will be made available by the authors on request.
Conflicts of Interest
The authors declare no conflict of interest.
References
- Miller, T.J.E. Switched Reluctance Motors and Their Control; Magna Physics Publishing: Hillsboro, OH, USA; Clarendo, TX, USA; Oxford, UK, 1993. [Google Scholar]
- Toliyat, H.A.; Nandi, S.; Choi, S.; Meshgin-Kelk, H. Electric Machines: Modeling, Condition Monitoring, and Fault Diagnosis, 1st ed.; CRC Press: Boca Raton, FL, USA, 2013. [Google Scholar] [CrossRef]
- Martin, B.; Pierre, G.; Bertrand, R.; Jeremi, R. Mechanical Fault Detection in Induction Motor Drives through Stator Current Monitoring—Theory and Application Examples. In Fault Detection; InTech: London, UK, 2010. [Google Scholar] [CrossRef]
- Ali, N.; Wang, Q.; Gao, Q.; Ma, K. Diagnosis of Multicomponent Faults in SRM Drives Based on Auxiliary Current Reconstruction Under Soft-Switching Operation. IEEE Trans. Ind. Electron. 2024, 71, 2265–2276. [Google Scholar] [CrossRef]
- Hu, Y.; Zhang, Z.; Sun, D.; Gu, C.; Li, Y. Fault Diagnosis of Full-Bridge Power Converter for SRMs Based on Modified Current Detection. IEEE J. Emerg. Sel. Top. Power Electron. 2024, 12, 1042–1053. [Google Scholar] [CrossRef]
- Zhang, L.; Song, J.; Wang, X.; Lu, J.; Lu, S. High-Resistance Connection Fault Diagnosis of SRM Based on Multisensor Calibrated Transformer with Shifted Windows. IEEE Sens. J. 2023, 23, 30971–30983. [Google Scholar] [CrossRef]
- Bouchareb, I.; Bentounsi, A.; Lebaroud, A. Torque Analysis of Faulty SRM using FEA-TFR Approach. Int. J. Comput. Appl. 2013, 61, 28–35. [Google Scholar] [CrossRef]
- Nazari, H.; Rostami, N. Diagnosis of Different Types of Air-Gap Eccentricity Fault in Switched Reluctance Motors Using Transient Finite Element Method. J. Oper. Autom. Power Eng. 2015, 3, 94–101. [Google Scholar]
- Li, J.; Choi, D.; Cho, Y. Analysis of Rotor Eccentricity in Switched Reluctance Motor with Parallel Winding Using FEM. IEEE Trans. Magn. 2009, 45, 2851–2854. [Google Scholar] [CrossRef]
- Faiz, J.; Pakdelian, S. Diagnosis of Static Eccentricity in Switched Reluctance Motors Based on Mutually Induced Voltages. IEEE Trans. Magn. 2008, 44, 2029–2034. [Google Scholar] [CrossRef]
- Torkaman, H.; Afjei, E.; Yadegari, P. Static, Dynamic, and Mixed Eccentricity Faults Diagnosis in Switched Reluctance Motors Using Transient Finite Element Method and Experiments. IEEE Trans. Magn. 2012, 48, 2254–2264. [Google Scholar] [CrossRef]
- Chindurza, I.; Dorrell, D.G.; Cossar, C. Vibration analysis of a switched-reluctance machine with the eccentric rotor. In Proceedings of the Second International Conference on Power Electronics, Machines, and Drives (PEMD 2004), Edinburgh, UK, 31 March–2 April 2004; Volume 2, pp. 481–486. [Google Scholar] [CrossRef]
- Jamil, M.U.; Kongprawechnon, W.; Chayopitak, N. Active fault diagnosis of a switched reluctance motor using sliding mode observer and average torque estimator for light electric vehicle applications. Int. Trans. Electr. Energy Syst. 2020, 30, e12602. [Google Scholar] [CrossRef]
- Xing, C.; Zhu, Y.; Wang, J.; Wu, H.; Huang, Y. Coordination control between vibration suppression and energy regeneration for vehicles driven by in-wheel motors under regenerative braking condition. Proc. Inst. Mech. Eng. Part D J. Automob. Eng. 2023. [Google Scholar] [CrossRef]
- Deng, Z.; Qin, H.; Chen, T.; Luo, X.; Wei, H. Integrated optimization of the in-wheel motor driving system considering the ride comfort of the electric vehicle under multiple operating conditions. Proc. Inst. Mech. Eng. Part D J. Automob. Eng. 2023. [Google Scholar] [CrossRef]
- Li, X.; Deng, Z.; Chen, T.; Zhang, Y.; Wei, H. Negative dynamics effect of in-wheel switched reluctance motor with inclined airgap eccentricity on handing stability for electric vehicle. Proc. Inst. Mech. Eng. Part D J. Automob. Eng. 2023. [Google Scholar] [CrossRef]
- Choudhary, A.; Mian, T.; Fatima, S.; Panigrahi, B.K. Multi-Sensor based Bearing Fault Diagnosis of Switched Reluctance Motor for Electric Vehicle. In Proceedings of the 2023 6th International Conference on Electronics, Communications and Control Engineering (ICECC 2′3). Association for Computing Machinery, New York, NY, USA, 24–26 March 2023; pp. 257–263. [Google Scholar] [CrossRef]
- Chen, H.; Yang, F.; Xu, L.; Lu, Q.; Chang, X.; Wang, X.; Dong, L.; Wen, Y.; Chen, J.; Miao, G.; et al. Reliability Analysis of a Switched Reluctance Starter/Generator. Prot. Control Mod. Power Syst. 2024, 9, 112–121. [Google Scholar] [CrossRef]
- Vibration Diagnostic Guide CM5003 SKF Reliability Systems. Available online: https://skftechnicalsupport.zendesk.com/hc/en-us/article_attachments/360042513054 (accessed on 16 April 2024).
Figure 1.
SRM cross-section—generated by 2D FEMM ® 4.2 software (a) and real motor installed on the test bench (b).
Figure 1.
SRM cross-section—generated by 2D FEMM ® 4.2 software (a) and real motor installed on the test bench (b).
Figure 2.
Eccentricity fault: (a) static (constant air-gap and angle θ) and (b) dynamic (dynamically varying air-gap with rotor rotating within the variable shaft centerline offset indicated by the arrow).
Figure 2.
Eccentricity fault: (a) static (constant air-gap and angle θ) and (b) dynamic (dynamically varying air-gap with rotor rotating within the variable shaft centerline offset indicated by the arrow).
Figure 3.
Test bench with SRM.
Figure 3.
Test bench with SRM.
Figure 4.
Bearing support with a unique sleeve (a), (b) NCTE 2200-5 torque meter, and (c) current probe.
Figure 4.
Bearing support with a unique sleeve (a), (b) NCTE 2200-5 torque meter, and (c) current probe.
Figure 5.
Triaxial piezoelectric CCLD accelerometer, type 4524-B (a) and NI-9234 card with NI compact DAQ-9172 (source: NI) (b).
Figure 5.
Triaxial piezoelectric CCLD accelerometer, type 4524-B (a) and NI-9234 card with NI compact DAQ-9172 (source: NI) (b).
Figure 6.
Block diagram of the measurement.
Figure 6.
Block diagram of the measurement.
Figure 7.
Block diagram of the measurement program written in LabView.
Figure 7.
Block diagram of the measurement program written in LabView.
Figure 8.
Current spectra for both operation states (with and w/o eccentricity) at 400 rpm and 0 Nm torque (no load).
Figure 8.
Current spectra for both operation states (with and w/o eccentricity) at 400 rpm and 0 Nm torque (no load).
Figure 9.
Current spectra for both operation states (with and w/o eccentricity) at 400 rpm and 1 Nm torque.
Figure 9.
Current spectra for both operation states (with and w/o eccentricity) at 400 rpm and 1 Nm torque.
Figure 10.
Current spectra for both operation states (with and w/o eccentricity) at 400 rpm and 2 Nm torque.
Figure 10.
Current spectra for both operation states (with and w/o eccentricity) at 400 rpm and 2 Nm torque.
Figure 11.
Acceleration spectra for both operation states (with and w/o eccentricity) at 400 rpm and 0 Nm torque (no load).
Figure 11.
Acceleration spectra for both operation states (with and w/o eccentricity) at 400 rpm and 0 Nm torque (no load).
Figure 12.
Acceleration spectra for both operation states (with and w/o eccentricity) at 400 rpm and 1 Nm torque.
Figure 12.
Acceleration spectra for both operation states (with and w/o eccentricity) at 400 rpm and 1 Nm torque.
Figure 13.
Acceleration spectra for both operation states (with and w/o eccentricity) at 400 rpm and 2 Nm torque.
Figure 13.
Acceleration spectra for both operation states (with and w/o eccentricity) at 400 rpm and 2 Nm torque.
Figure 14.
Current spectra for three torque load values with eccentricity and at 400 rpm rotational speed.
Figure 14.
Current spectra for three torque load values with eccentricity and at 400 rpm rotational speed.
Figure 15.
Acceleration spectra for three torque load values with eccentricity and at 400 rpm rotational speed.
Figure 15.
Acceleration spectra for three torque load values with eccentricity and at 400 rpm rotational speed.
Figure 16.
Acceleration spectra for three operational states torque at 1000 rpm rotational speed and 2 Nm torque load.
Figure 16.
Acceleration spectra for three operational states torque at 1000 rpm rotational speed and 2 Nm torque load.
Figure 17.
Current spectra for three operational states torque at 1000 rpm rotational speed and 2 Nm torque load.
Figure 17.
Current spectra for three operational states torque at 1000 rpm rotational speed and 2 Nm torque load.
Figure 18.
Current spectra for three torque load values with imbalance “B” and at 1000 rpm rotational speed.
Figure 18.
Current spectra for three torque load values with imbalance “B” and at 1000 rpm rotational speed.
Figure 19.
Acceleration spectra for three torque load values with imbalance “B” and at 1000 rpm rotational speed.
Figure 19.
Acceleration spectra for three torque load values with imbalance “B” and at 1000 rpm rotational speed.
Table 1.
SRM and DC braking motor parameters.
Table 1.
SRM and DC braking motor parameters.
| Motor Parameter | Value |
|---|
| number of phases | 4 |
| stator poles | 6 |
| rotor poles | 8 |
| coil turns per winding | 70 |
| motor length | 250 mm |
| stator outer diameter | 117 mm |
| air-gap length | 0.31 mm |
| rotor outer diameter | 60.79 mm |
| shaft diameter | 4.73 mm |
| stator inner diameter | 62 mm |
| height of tooth | 5.5 mm |
| width of the tooth tip | 3.5 mm |
| height of tooth foot | 0.5 mm |
| width of tooth | 3 mm |
| rotor inner diameter | 12.73 mm |
| width of lobe | 3 mm |
| height of lobe | 2.51 mm |
| rated power | 500 W |
| nominal speed | 1500 rpm |
| supply voltage | 315 V DC |
| DC Motor Parameter | Value |
| Symbol | EC600.240 |
| Type of operation | S1/S2 30′ |
| Power | 600 W S1 (800 W S2) |
| Voltage | 24 V |
| Current | 35.5 A S1 (47.2 A S2) |
| Torque | 1.91 Nm S1 (2.54 Nm S2) |
| Rotational speed | 3000 rpm |
| Disclaimer/Publisher’s Note: The statements, opinions and data contained in all publications are solely those of the individual author(s) and contributor(s) and not of MDPI and/or the editor(s). MDPI and/or the editor(s) disclaim responsibility for any injury to people or property resulting from any ideas, methods, instructions or products referred to in the content. |
© 2024 by the authors. Licensee MDPI, Basel, Switzerland. This article is an open access article distributed under the terms and conditions of the Creative Commons Attribution (CC BY) license (https://creativecommons.org/licenses/by/4.0/).


