Article

High-Spatial-Resolution Helium Detection and Its Implications for Helium Accumulation Mechanisms

1
State Key Laboratory of Lithospheric Evolution, Institute of Geology and Geophysics, Chinese Academy of Sciences, Beijing 100029, China
2
College of Earth and Planetary Sciences, University of Chinese Academy of Sciences, Beijing 100049, China
3
Institutes of Earth Science, Chinese Academy of Sciences, Beijing 100049, China
4
North China Measurement and Control Company of Sinopec Matrix Corporation, Zhengzhou 450042, China
5
Key Laboratory for Biomass Gasification Technology of Shandong Province, Energy Research Institute, Qilu University of Technology (Shandong Academy of Sciences), Jinan 250014, China
6
State Key Laboratory of Shale Oil and Gas Enrichment Mechanisms and Efficient Development, Beijing 102206, China
7
Institute of Energy Research, Peking University, Beijing 100871, China
*
Author to whom correspondence should be addressed.
Appl. Sci. 2024, 14(8), 3453; https://doi.org/10.3390/app14083453
Submission received: 19 March 2024 / Revised: 15 April 2024 / Accepted: 17 April 2024 / Published: 19 April 2024
(This article belongs to the Special Issue Technologies and Methods for Exploitation of Geological Resources)

Abstract

:
Helium is a scarce strategic resource. Currently, all economically valuable helium resources are found in natural gas reservoirs. Owing to helium’s different formation and migration processes compared to natural gas’s, the traditional method of collecting wellhead gas to detect helium concentration may miss helium-rich layers in the vertical direction, which will not only cause the waste of helium resources, but also restrict the study of helium migration and accumulation mechanisms. To solve this problem, we designed a helium detector based on a quadrupole mass spectrometer. Through the combination of different inlet valves, we avoided gas mixing between different vertical layers during the inlet process and realized high-spatial-resolution helium concentration detection. We applied the helium detector to the Dongsheng gas field in the northern Ordos Basin, and the instrumental detection results were consistent with the laboratory analysis results of the wellhead gas, which demonstrated the stability of the helium detector in the field environment and the reliability of the data. Meanwhile, the results showed that the distribution of helium in the plane is highly heterogeneous, and the natural gas dessert layers and the helium dessert layers do not coincide in the vertical direction. In addition, we found a good correlation between helium and hydrogen concentrations. Combining our results with previous data, we propose a hydrogen–helium migration and accumulation model, which enriches the understanding of helium accumulation mechanisms and provides a basis for future helium resource exploration.

1. Introduction

As a noble gas, helium is the lowest-melting-point and -boiling-point element known in nature. Due to its unique physical and chemical properties, helium is widely used in high-tech fields and applications such as nuclear industry, superconducting materials, medical treatments, aerospace, and so on. Especially in the ultra-low-temperature field (<1 k), helium has an irreplaceable position [1,2]. Although helium is the second most abundant element in the universe, after hydrogen, accounting for approximately 24% of the total elemental mass of the universe, helium concentration on earth is very low, and this gas is in short supply. Statistics show that the global helium supply in 2021 was about 167 million m3, while the demand was about 193 million m3 in the same period, with a supply gap of about 26 million m3 [3]. Furthermore, the United States, Canada, Russia, and other countries passed legislation to restrict helium exports, but the global helium demand is still growing at a rate of 4–6% per year, which further aggravates the global helium supply situation [1].
Up to now, no independently formed helium reservoir has been found. Helium is mainly coupled with hydrocarbon gas and sometimes with nitrogen and carbon dioxide [4,5,6,7,8,9], and most of the world’s commercial helium is extractfrom helium-rich natural gas reservoirs. Helium in helium-rich natural gas reservoirs is mainly generated by the radioactive decay of basement rocks, usually granite. Helium generated in a mineral lattice will enter the pore water. When gas passes through helium-containing pore water, helium dissolved in the water will enter the gas phase due to Henry’s law and further migrate and accumulate with the gas. This theory emphasizes the importance of external gas extraction and migration of helium, which is usually used to explain the coexistence of hydrocarbon gas and helium [7,10,11,12,13]. However, under normal circumstances, the process of natural gas generation and accumulation often occurs in the overlying strata of a basement. Hydrocarbon gases cannot directly extract helium from basement granite. If there are no other free gases, helium in basement granite is difficult to extract and accumulate. Previous studies suggested that nitrogen and carbon dioxide play a key role in the extraction of helium from the pore water of basement rocks, but there are many helium-rich gas reservoirs with low nitrogen and carbon dioxide concentrations. The gas that promotes the migration of helium from pore water in these gas reservoirs is still unclear and needs to be studied.
In the traditional exploration process, the detection of helium concentration in natural gas reservoirs requires collecting wellhead gas and sending it to the laboratory for analysis [14,15]. Usually, only a specific layer is analyzed (usually, the hydrocarbon enrichment layer), and the continuous vertical helium concentration cannot be obtained. This will not only cause the waste of helium resources, but also restrict the study of helium migration and accumulation mechanisms. Moreover, the sampling container is usually a steel cylinder. Due to the leakage of the steel cylinder itself, if the sample cannot be tested in time after sampling, errors in the results will be inevitable. Therefore, in order to accurately measure the continuous vertical helium concentration, real-time detection is required during drilling. Since the mid-1990s, researchers have employed gas chromatography and mass spectrometry to detect gas compositions during geothermal well drilling processes [16,17,18,19,20]. Gas chromatography is utilized for detecting gases such as CO2, CH4, and H2, while mass spectrometry is employed for detecting noble gases. In these studies, gas detection during drilling processes was primarily aimed at assessing potential gas hazards (typically, ATEX explosive atmospheres) and could also be utilized for monitoring fault fluid activities and underground fracture systems. But the spatial resolution of the available instruments is relatively low. In the exploration of helium resources, a low spatial resolution may lead to misjudgments regarding the extent of helium-rich layers, which is unfavorable for helium resource exploration. In order to achieve a high spatial resolution, we designed a helium detector based on a quadrupole mass spectrometer. Through the combination of different inlet valves, high-spatial-resolution helium concentration detection was achieved, which can not only avoid the omission of helium-rich layers, but also provide important information for the study of helium migration. In this paper, the helium detector was applied to the Dongsheng gas field in the northern Ordos Basin. Combining the instrument test results and previous research data, we discuss the spatial distribution characteristics of helium and provide a model of its migration and accumulation in this area.

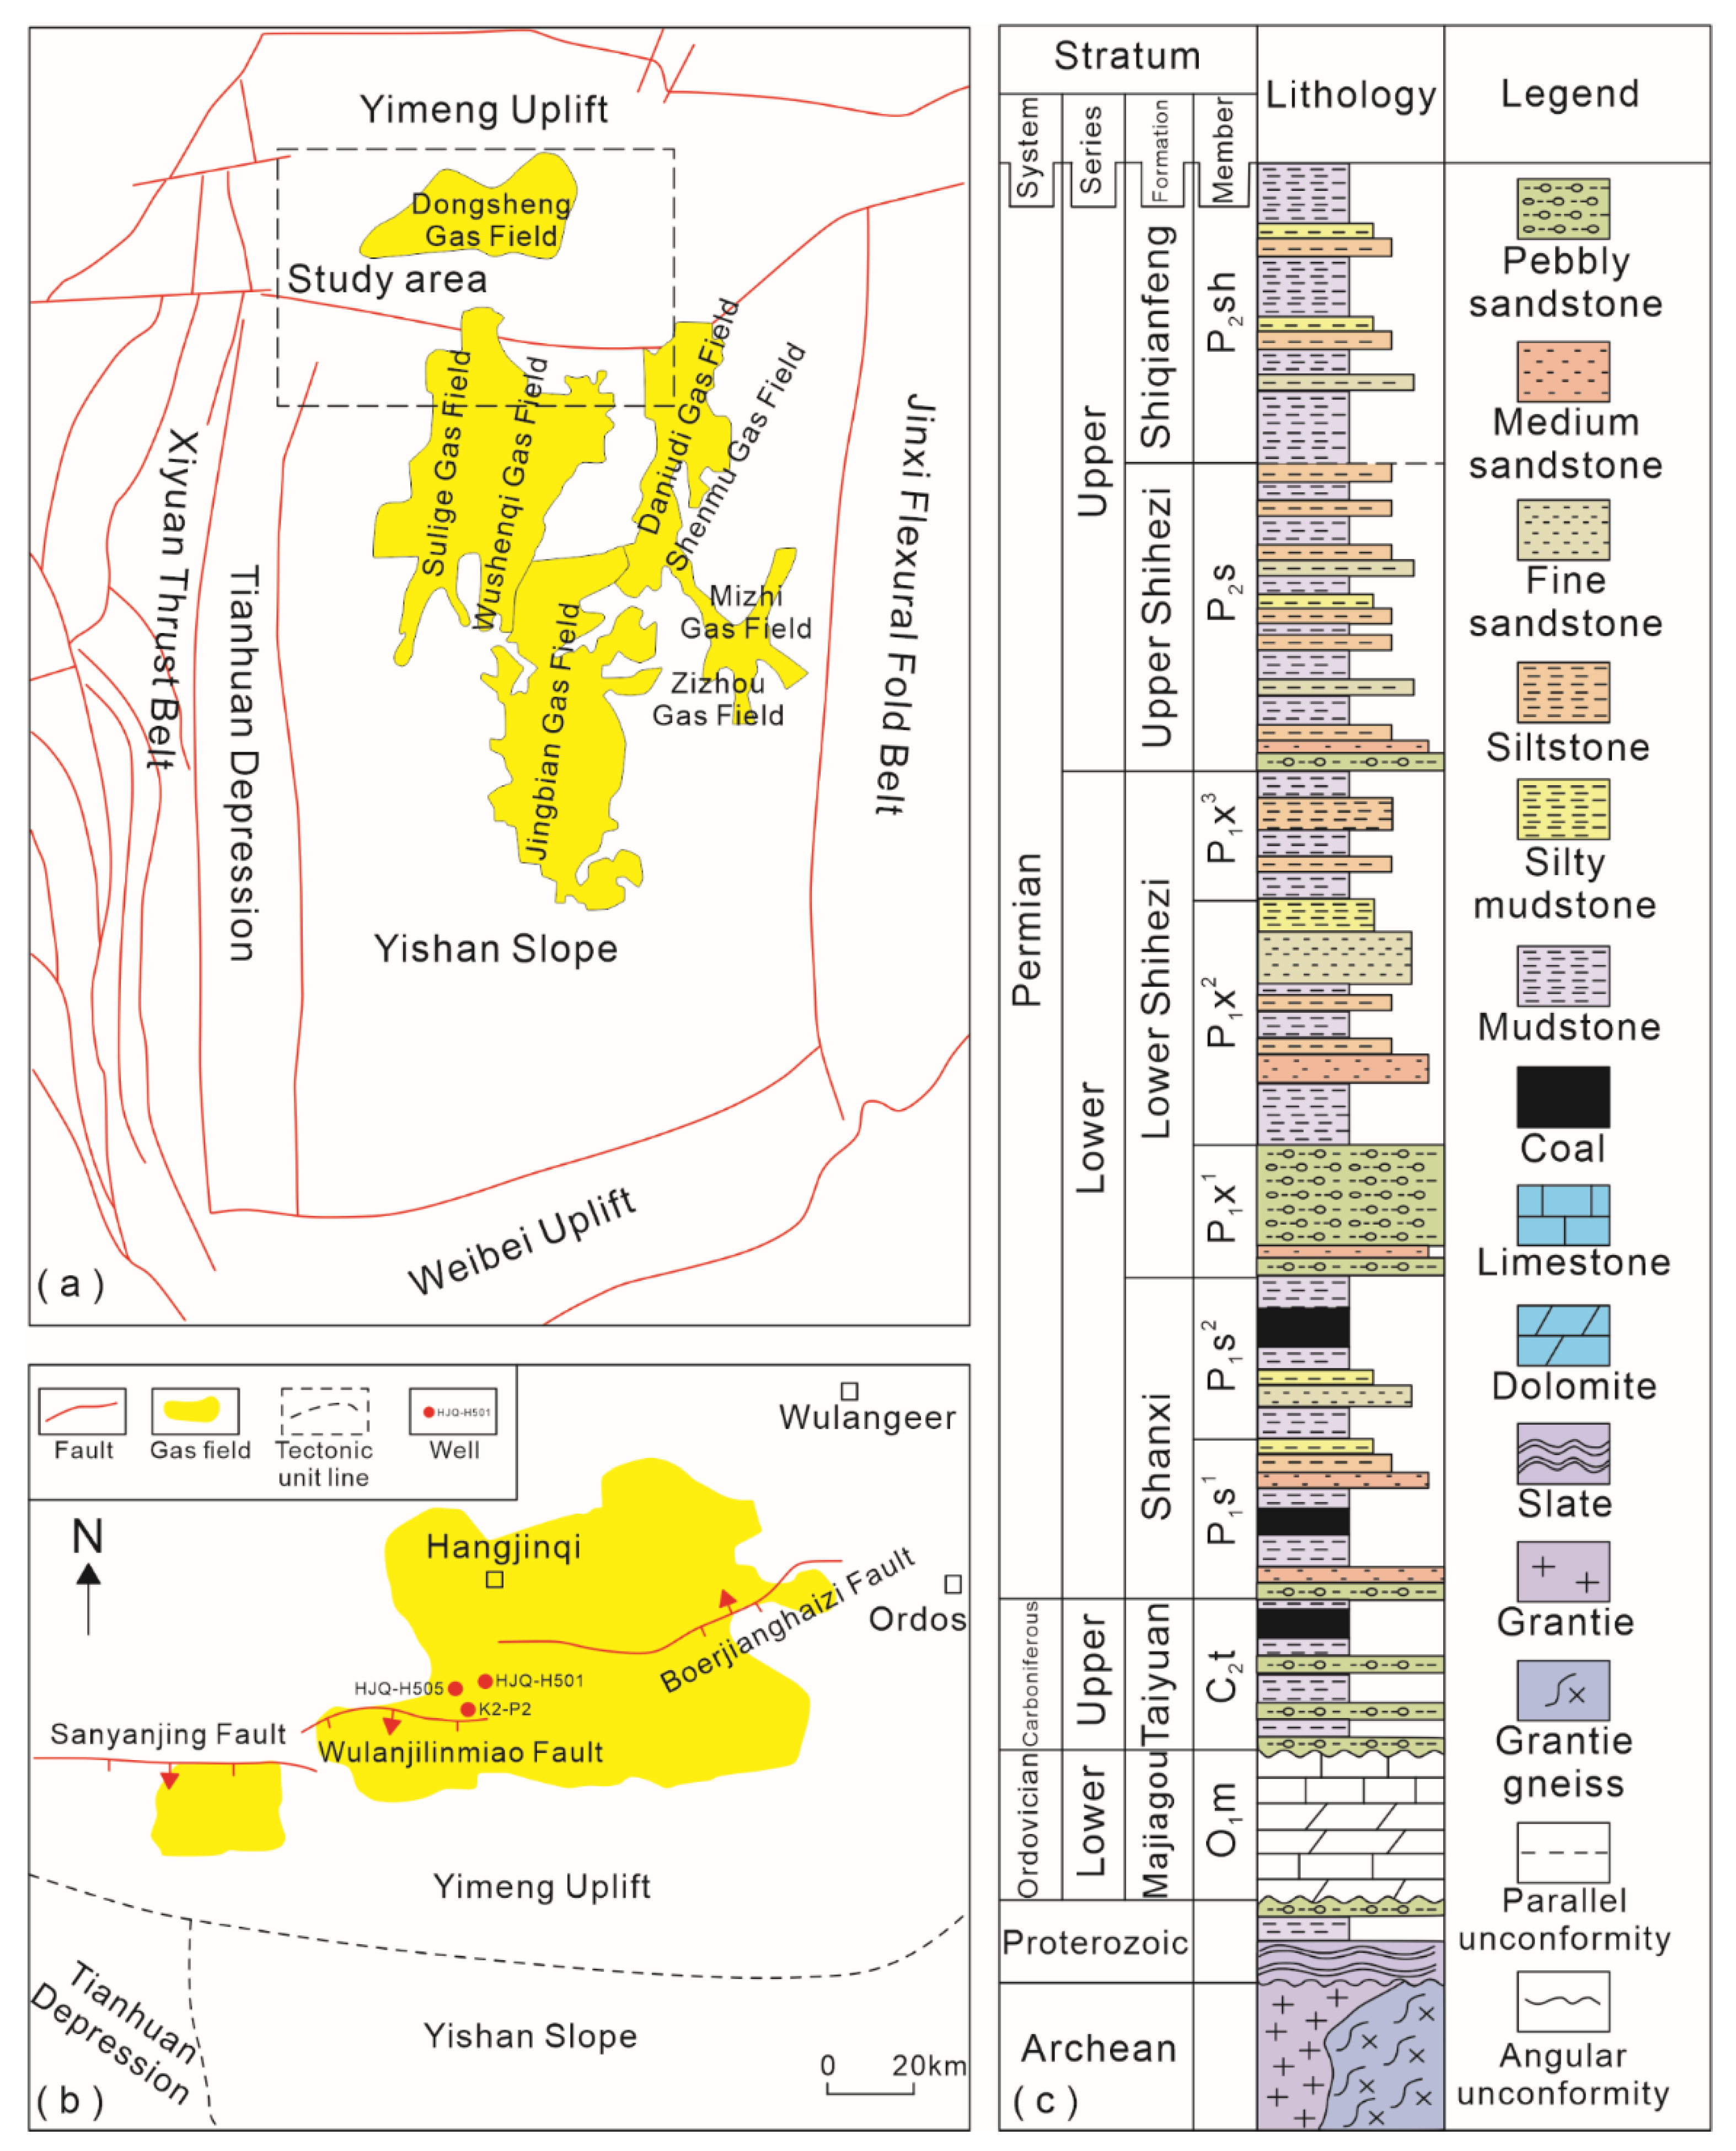
2. Geological Background

In recent years, a high concentration of helium was detected in the Dongsheng gas field at the northern margin of Ordos Basin. Peng Weilong collected 92 natural gas samples for helium concentration analysis. The results showed that the average helium concentration in the Dongsheng gas field is 0.133%, with over 70% of the helium concentration exceeding 0.1% [15]. Therefore, the Dongsheng gas field was selected for helium detection during drilling. The Dongsheng gas field is located in the northern part of the Ordos Basin, which spans three tectonic units: the Yishan slope, the Tianhuan depression, and the Yimeng uplift (Figure 1a) [21]. The test wells were located between the Boerjianghaizi fault and the Wulanjilinmiao fault (Figure 1b). Figure 1c shows a comprehensive stratigraphic histogram of the Permian and underlying strata in the area. The reservoir in this area is the Lower Shihezi Formation of the Lower Permian (P1x), and the source rocks are coal, carbonaceous mudstone, and dark mudstone of the Upper Carboniferous Taiyuan Formation and the Lower Permian Shanxi Formation [22,23]. The source rocks of the Taiyuan Formation and Shanxi Formation are basically shallow in the north and deep in the south, according to their geological history. Their vitrinite reflectance also increases gradually from northeast to southwest, with the Ro value exceeding 1.4%, and the rocks entering a high-maturity stage, typical of good gas source rocks [24]. Due to the influence of tectonic events, the source rocks were rapidly buried from the Late Triassic to the end of the Early Cretaceous, generating a large amount of gas. This was a critical period for the formation of gas reservoirs [25]. The lithology of the reservoir shows that is mainly composed of coarse-to-medium-grained lithic sandstone with gravel in the P1x section, and the cap rocks is composed of mudstone and sandy mudstone of the Upper Shihezi Formation and Shiqianfeng Formation [15,26,27].

3. Methods

3.1. Mud Gas Detection Principle

Helium has two stable isotopes, 3He and 4He. 4He is radiogenic, and 3He is cosmogenic. According to its source, helium can be classified into atmospheric helium, crustal helium, and mantle-derived helium, which have different helium isotope ratios, corresponding to 1.4 × 10⁻⁶, 2 × 10⁻⁸, and 1.1 × 10⁻⁵, respectively [7,9,28,29,30,31]. Helium in natural gas reservoirs primarily consists of crustal and mantle-derived helium. Since the gas measured during the drilling process is released from the mud, which comes in full contact with air in the mud tank, a mixture of air and gas will form (Figure 2a). Therefore, in order to detect helium anomalies in the mud gas, the minimum detection limit of the instrument needs to be at least greater than the helium concentration in air (5.24 ppm, [7,32,33]).
To meet this requirement, we used a mass spectrometer for helium detection. Compared with other instruments, mass spectrometers have lower detection limits, allow for real-time access to gas information, have a wider application range, and provide automated detection [34,35]. Different types of mass spectrometers have different detection cycles. Traditional large magnetic mass spectrometers usually perform static measurements, require complex gas purification processes and long detection cycles, with a single test lasting more than two hours, and cannot determine the helium concentration in the mud gas in real time during the drilling process; so, they are not suitable for helium detection during drilling. Compared to large magnetic mass spectrometers, small mass spectrometers are characterized by their ability to perform rapid and dynamic measurements and by their portability. The quadrupole mass spectrometer is one of the most advanced and widely used small mass spectrometers and is very suitable for drilling site detection [19,20]. The helium detector was designed based on the quadrupole mass spectrometer. During the measurement process, the mud gas followed two paths, one into the chromatograph to measure the concentration of total hydrocarbons, hydrogen, and carbon dioxide, and the other into the helium detector to measure helium concentration (Figure 2b).
In the determination of the helium isotope ratio (3He/4He), achieving accurate results is primarily constrained by the 3He+ signal value, which is generally several orders of magnitude lower than the 4He+ signal value. During the measurement, gas impurities are ionized by the ion source, generating charged ions with the same mass-to-charge ratio as the target ion. These ions will interfere with the measurement. The ion interfering with 3He+ is HD+, and that interfering with 4He+ is 12C3+ [36]. Typically, the resolution of a small mass spectrometer is too low to distinguish 3He+ and 4He+ from their corresponding interfering ions; only a large magnetic mass spectrometer can do this and thus accurately measure the helium isotope ratio [37]. In the field, the measured 4He concentration is usually used to represent the total helium concentration due to the low resolution of portable instruments. The determination of helium isotope ratios was beyond the scope of this paper.

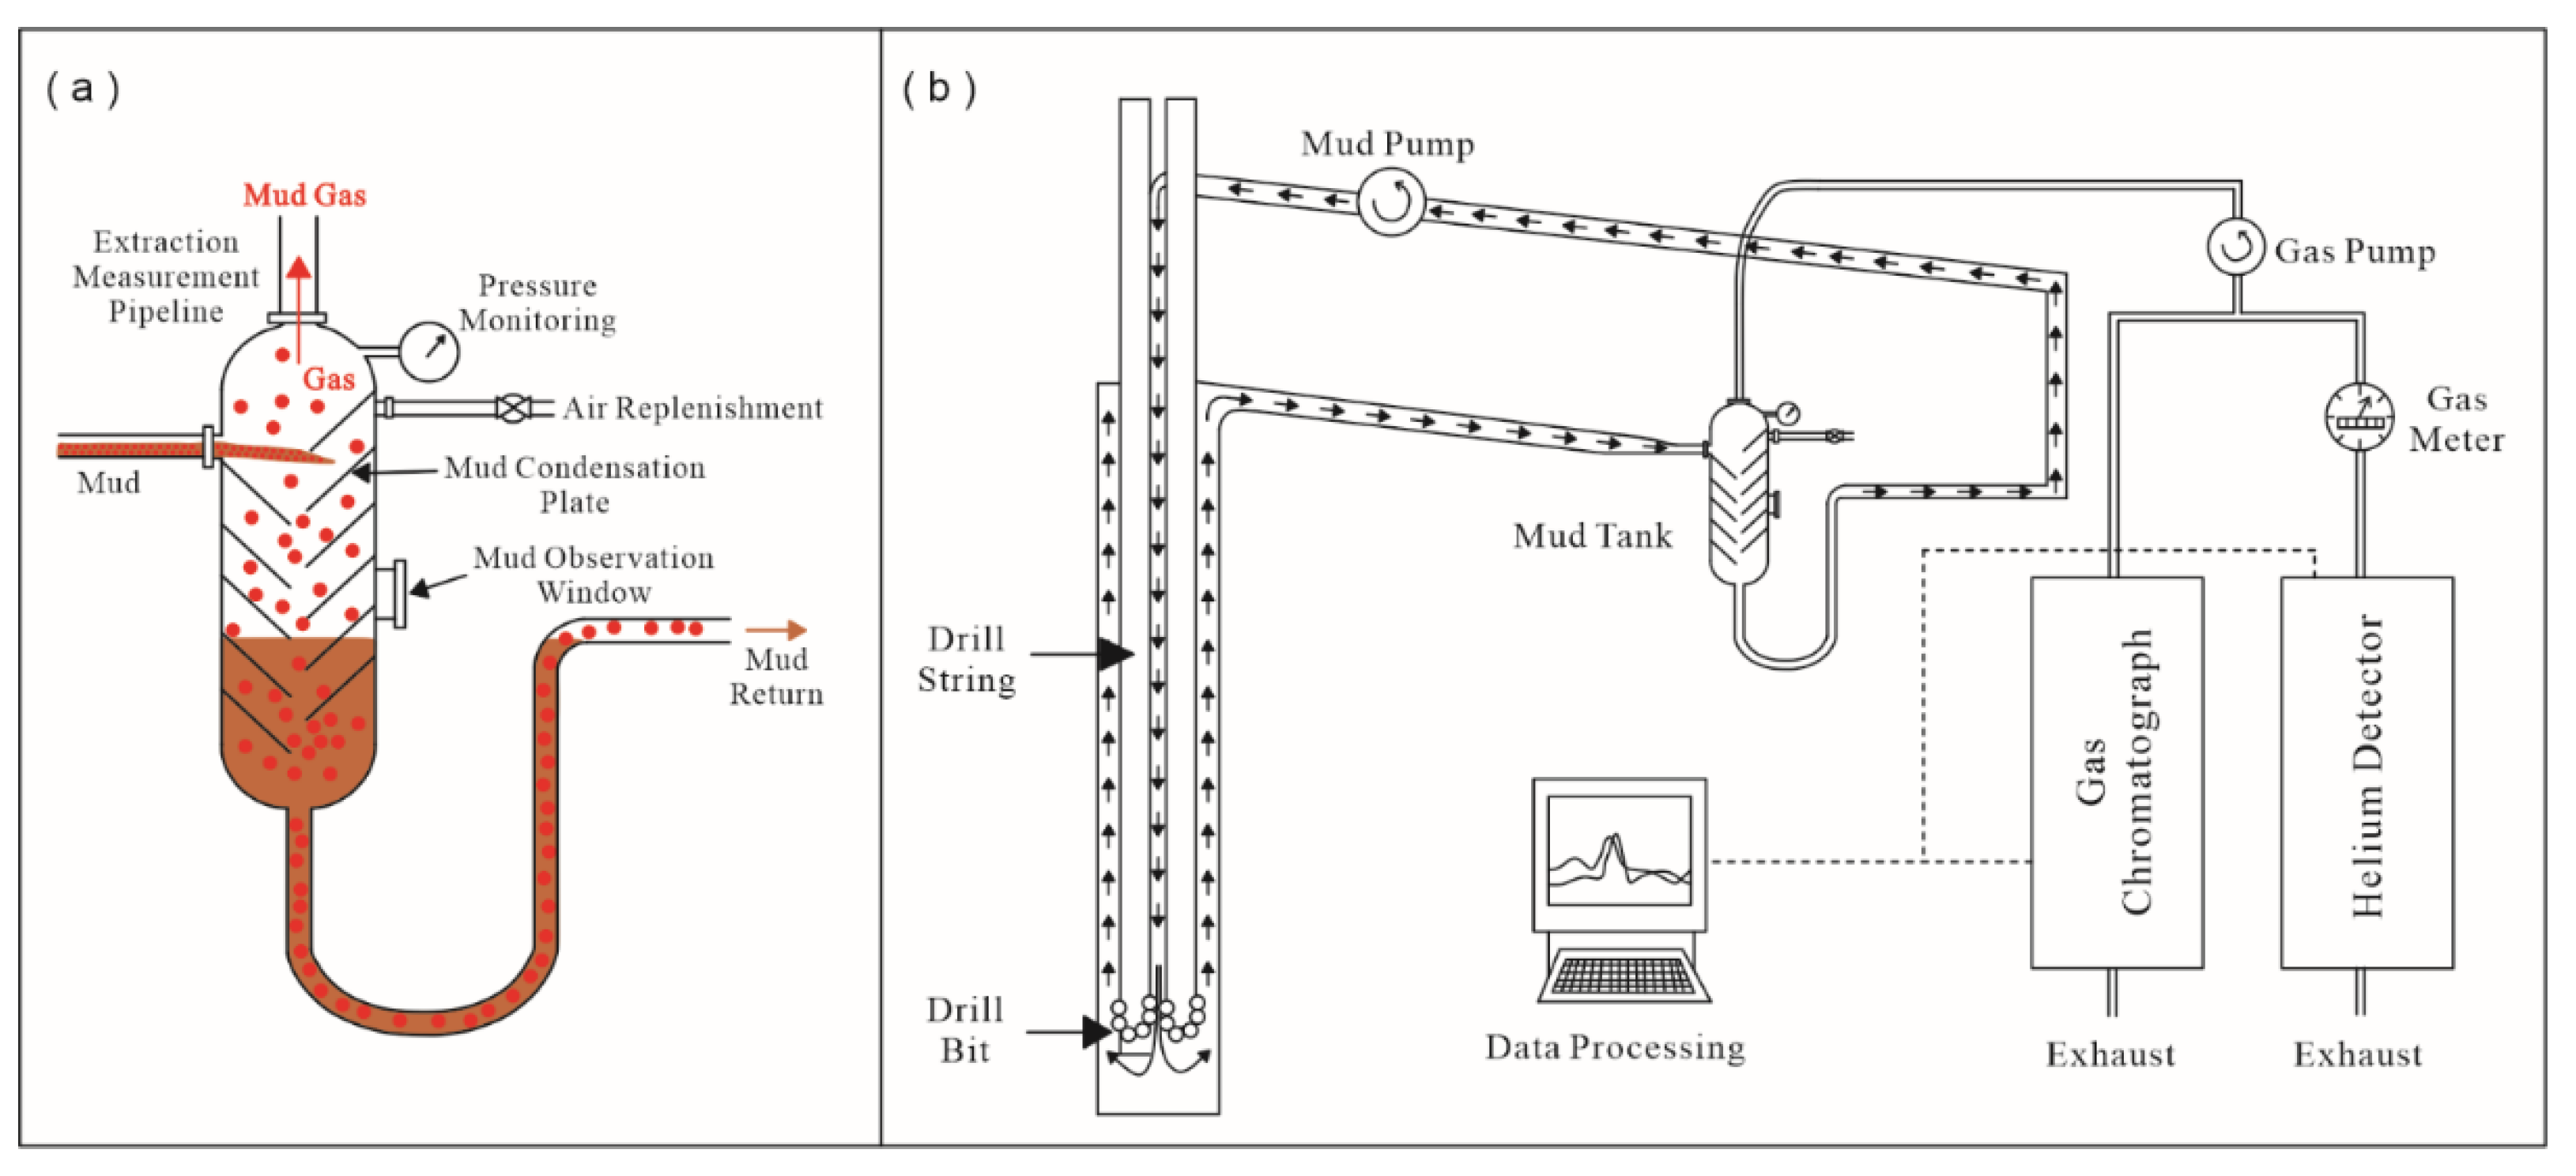
3.2. Instrument Design

The helium detector was designed based on a quadrupole mass spectrometer with a volume of 44 × 36 × 65 cm and a mass of 17.5 kg. It consists of three parts, which are the sample injection system, the detection system, and the control system. Its design is shown in Figure 3.
The sample injection system (Figure 3, ①, ②, ⑥) consists of a pressure-regulating valve, a chromatographic column, and an inlet valve box. The pressure-regulating valve is used to stabilize the pressure of the sample gas, and the inlet valve box contains a ten-port valve and a six-port valve, which can be switched automatically during the measurement process according to the set procedure. The chromatographic column can separate different gas components during the measurement process to avoid the interference of the remaining gas on the helium measurement. The detection system (Figure 3, ③) consists of a quadrupole mass spectrometer. The quadrupole mass spectrometer used was a Grand-He-001 from Suzhou Grand Energy Technology Co., Ltd (Suzhou, China). The analysis range of the instrument is 1–100 u, the resolution is 0.5 u, the scanning speed is 1 ms/u–16 s/u, and the detection limit is 1 ppm. The receiver types include an electron multiplier and a Faraday cup, and since helium concentration in the mud gas is usually low, all data in this study were provided by the electron multiplier. The vacuum of the mass spectrometer chamber during the operation was about 1.7 × 10⁻⁹ bar. The control system (Figure 3, ④, ⑤, ⑦) includes a power supply, a control module, and a temperature controller. The helium detector operates at 220 V, but the voltage at the drilling site typically fluctuates, so the helium detector was connected to the drilling site circuit for power supply through a UPS (Uninterruptible Power Supply) during the detection. The UPS can stabilize the voltage during the process to prevent any fluctuations that could affect test data accuracy. The control module is responsible for regulating the molecular pump and each solenoid valve within the instrument. It enables the real-time monitoring of the molecular pump’s operation and the automatic switching of the valves. The temperature controller is used to monitor the instrument’s operating temperature.
In traditional measurements, only one gas sample is measured at a time, the gas sample is usually stored in a steel cylinder, and the gas composition in it is homogeneous; so, the helium concentration obtained from the continuous measurement of one single sample remains unchanged. However, due to the continuity of the drilling process, the gas in the deep underground is continuously transported through the mud, from which it is released and then enters the helium detector for measurement. In this process, when the helium concentration between neighboring layers differs greatly, the continuous gas uptake will result in the mixing of helium at different concentrations, which will lead to a deviation of the measurement results from the real values and affect the helium prediction. To solve this problem, we designed separate inlet gas paths. Through the combination of a ten-port valve and a six-port valve, each gas injection is isolated from the others, avoiding the mixing of gas from different layers and improving the spatial resolution of the instrument.
The designed system’s gas flow diagram is shown in Figure 4, where the blue, red, and yellow lines represent carrier gas, sample gas, and carrier gas + sample gas, respectively. There are four working states. In the first one, shown in Figure 4a, the sample gas enters the ten-port valve from port 9 through the red gas path, then passes through port 8, the quantification ring (0.5 cm3), and port 1, and finally exits from port 10; the carrier gas follows three paths, two of which empty the residual gases in the pipeline, and the other one carries the carrier gas directly into the mass spectrometer. In the second working state (Figure 4b), the sample gas enters the ten-port valve from port 9 and then exits directly through port 10; at this time, one part of the carrier gas enters the ten-port valve through port 7 and then sends the sample gas stored in the quantification ring to the mass spectrometer for measurement. In the meantime, column 1 filters most of the hydrocarbon molecules, and the other two parts of the carrier gas are directly released. In the third working state (Figure 4c), the next sample gas enters the ten-port valve through port 9 and blows the carrier gas and the previous-round sample gas in the quantification ring out of the system, which avoids contamination between different sample gases and allows for continuously filling the quantification ring with the new sample gas; at this time, one part of the carrier gas blows the hydrocarbon molecules that were filtered out by the chromatographic column 1 in the previous working state out of the system, and another part of the carrier gas enters the ten-port valve through port 4, continuously sending the sample gas into the mass spectrometer for measurement. In this process, column 2 can filter most of the hydrogen and oxygen molecules, and the third part of the carrier gas is directly released. In the fourth working state (Figure 4d), the sample gas and the first part of the carrier gas follow the same paths as in Figure 4c. The second part of the carrier gas blows the hydrogen and oxygen molecules from the previous operating state out of the system after entering the ten-port valve through port 4, and the third part of the carrier gas continuously sends the sample gas into the mass spectrometer for measurement. The first, second, and third working states last for 10 s, while the fourth working state lasts for 30 s; the above four working states together constitute a complete test process.

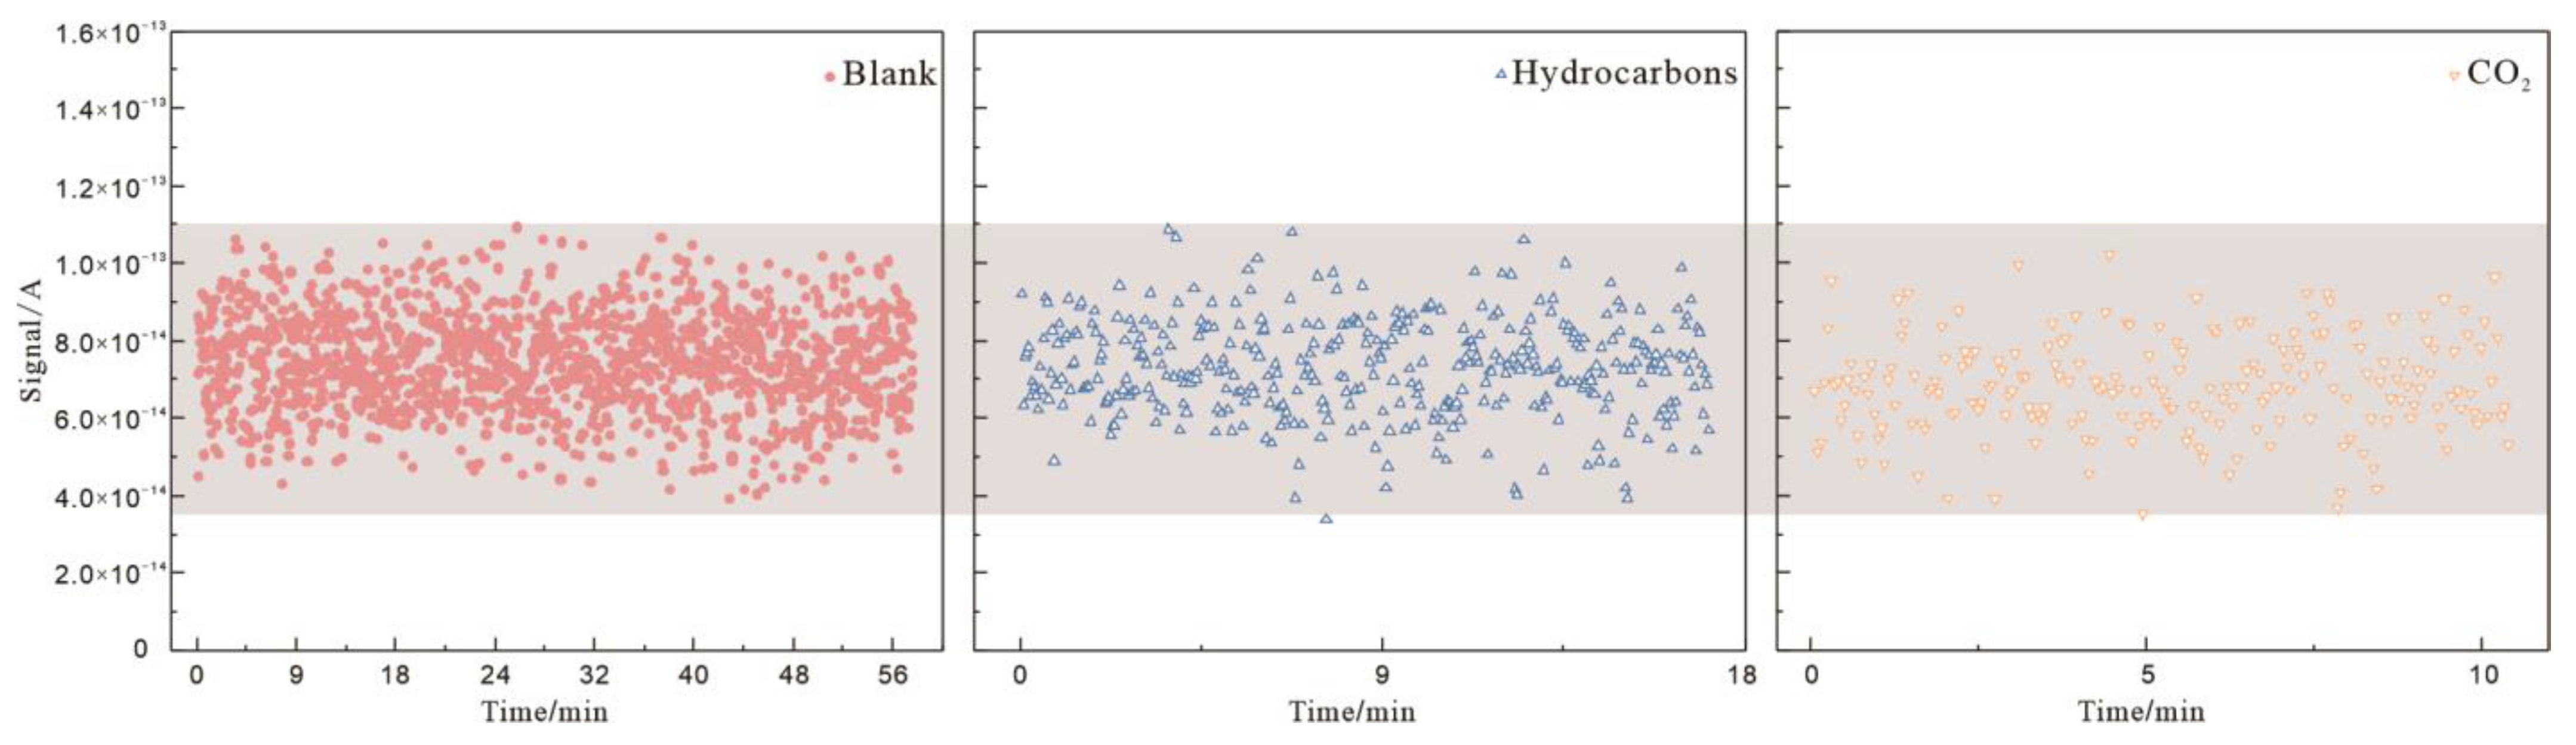
3.3. Instrument Parameter Test

We tested the instrument parameters in the laboratory before the system was applied to the drilling site, based on the results of the best ionization energy of helium obtained by Brennwald et al. using a MiniRuedi, which showed that the best ionization energy of helium is 70 eV [34]. The following tests were performed at that energy. Comparing the helium detector described in this paper and the MiniRuedi, both include a quadrupole mass spectrometer, but the difference is that the MiniRuedi detection system uses the membrane balance sampling method and performs measurements in rivers and lakes. The rate of gas penetration through the membrane will be affected by factors such as temperature, flow rate, and membrane aging. During the drilling process, because the drilling speed is usually high, the underground gas will continue to move up rapidly; however, the membrane balance gas penetration rate is too low to allow for the required fast measurements. Compared with the MiniRuedi, the helium detector employed in this study uses a gas pump to send gas into the injection system, and the injection rate is much higher than that of the membrane equilibrium method, allowing for meeting the gas detection requirements of the drilling site.
The instrument parameters were tested, starting from a blank sample. As the instrument operated in a dynamic detection mode, it was necessary to test a dynamic blank. This was achieved by measuring the signal when the inlet valve was closed, which is shown by solid red dots in Figure 5. This value was used to calibrate both the sample gas and the standard gas. Moreover, natural gas usually contains hydrocarbons and carbon dioxide. The fact that hydrocarbon and carbon dioxide molecules may produce 12C3+ ions during the ionization process, whose mass-to-charge ratio is the same as that of 4He+ ions, could potentially affect the measurement results. Therefore, we injected standard hydrocarbons (CH4: 1.49 × 10⁻², C2H6: 1.19 × 10⁻², C3H6: 0.991 × 10⁻², n-C4H10: 0.245 × 10⁻², n-C5H12: 0.255 × 10⁻²; the complete injection volume was achieved with N2) and carbon dioxide (500 ppm; the complete injection volume was achieved with N2) into the helium detector for interference peak measurement, and the test results are shown in Figure 5. It can be seen in the figure that the 12C3+ signals generated by the hydrocarbons and carbon dioxide molecules were within the same range as those of the dynamic blank. Hydrocarbons and carbon dioxide in the gas will not cause discernible interference with the 4He measurement results.
This study used the external standard method to calibrate the helium concentration in the mud gas [34,38]. We configured helium standard gas samples with concentrations of 11.5 ppm, 20 ppm, 40 ppm, 60 ppm, 80 ppm, 100 ppm, 200 ppm, 300 ppm, 400 ppm, and 500 ppm, injected and measured them 10 times, and plotted their average concentrations, obtaining a standard curve (Figure 6). It can be seen in the figure that there was a good linear relationship between the concentration of the standard gas and the integrated area, and the R-square of the equation was 0.99903, which is highly acceptable. So, the helium concentration in the tested gas could be deduced by using this concentration standard curve.
To test the analytical accuracy of the instrument, we calculated the RSD (Relative Standard Deviation) of the 10 concentrations mentioned above, and the results are presented in Table 1. In the table, it can be seen that the lower the standard gas concentration, the greater the RSD. When the concentration exceeded 100 ppm, the RSD value tended to be stable, corresponding to less than 3%. Additionally, we also compared the deviation of single measurement values from the average value for each concentration, and the results are shown in Figure 7. It can be seen in the figure that when the standard gas concentrations were 11.5 ppm and 20 ppm, the error of the single measurements could be more than 10%, and the deviation was large. However, with the increase in the concentration, the error of the single measurements tended to stabilize, approaching 3%. Through the above analysis, we found that the error of the instrument was relatively large at low concentrations and small at high concentrations. Therefore, during field detection, when low helium concentrations are detected, the scanning interval (usually 1 min) can be appropriately reduced to obtain more data and ensure their reliability; this problem does not exist at high concentrations.
Furthermore, during the laboratory test, we found that the instrument produced signal attenuation during long-term continuous measurements. Considering that the instrument needs to continuously detect the helium concentration in the mud gas for a long time during field measurements, it is necessary to measure the attenuation coefficient of the instrument to regress the error caused by signal attenuation. In this paper, a helium standard sample with a concentration of 85 ppm was used for continuous measurement testing for 57 h, and the results are shown in Figure 8. It can be seen in the figure that as time increased, the signal gradually decreased, showing a downward trend overall. By fitting the data points, we found that the signal value and the time showed a good linear relationship, and the R-square of the equation was 0.93925, which is highly acceptable. The helium detector can be successful deployed at drilling sites, as it can measure all day automatically and uninterruptedly without manual operation; it is only necessary to test the attenuation coefficient of the instrument once a day, which is used to calibrate the helium concentration.

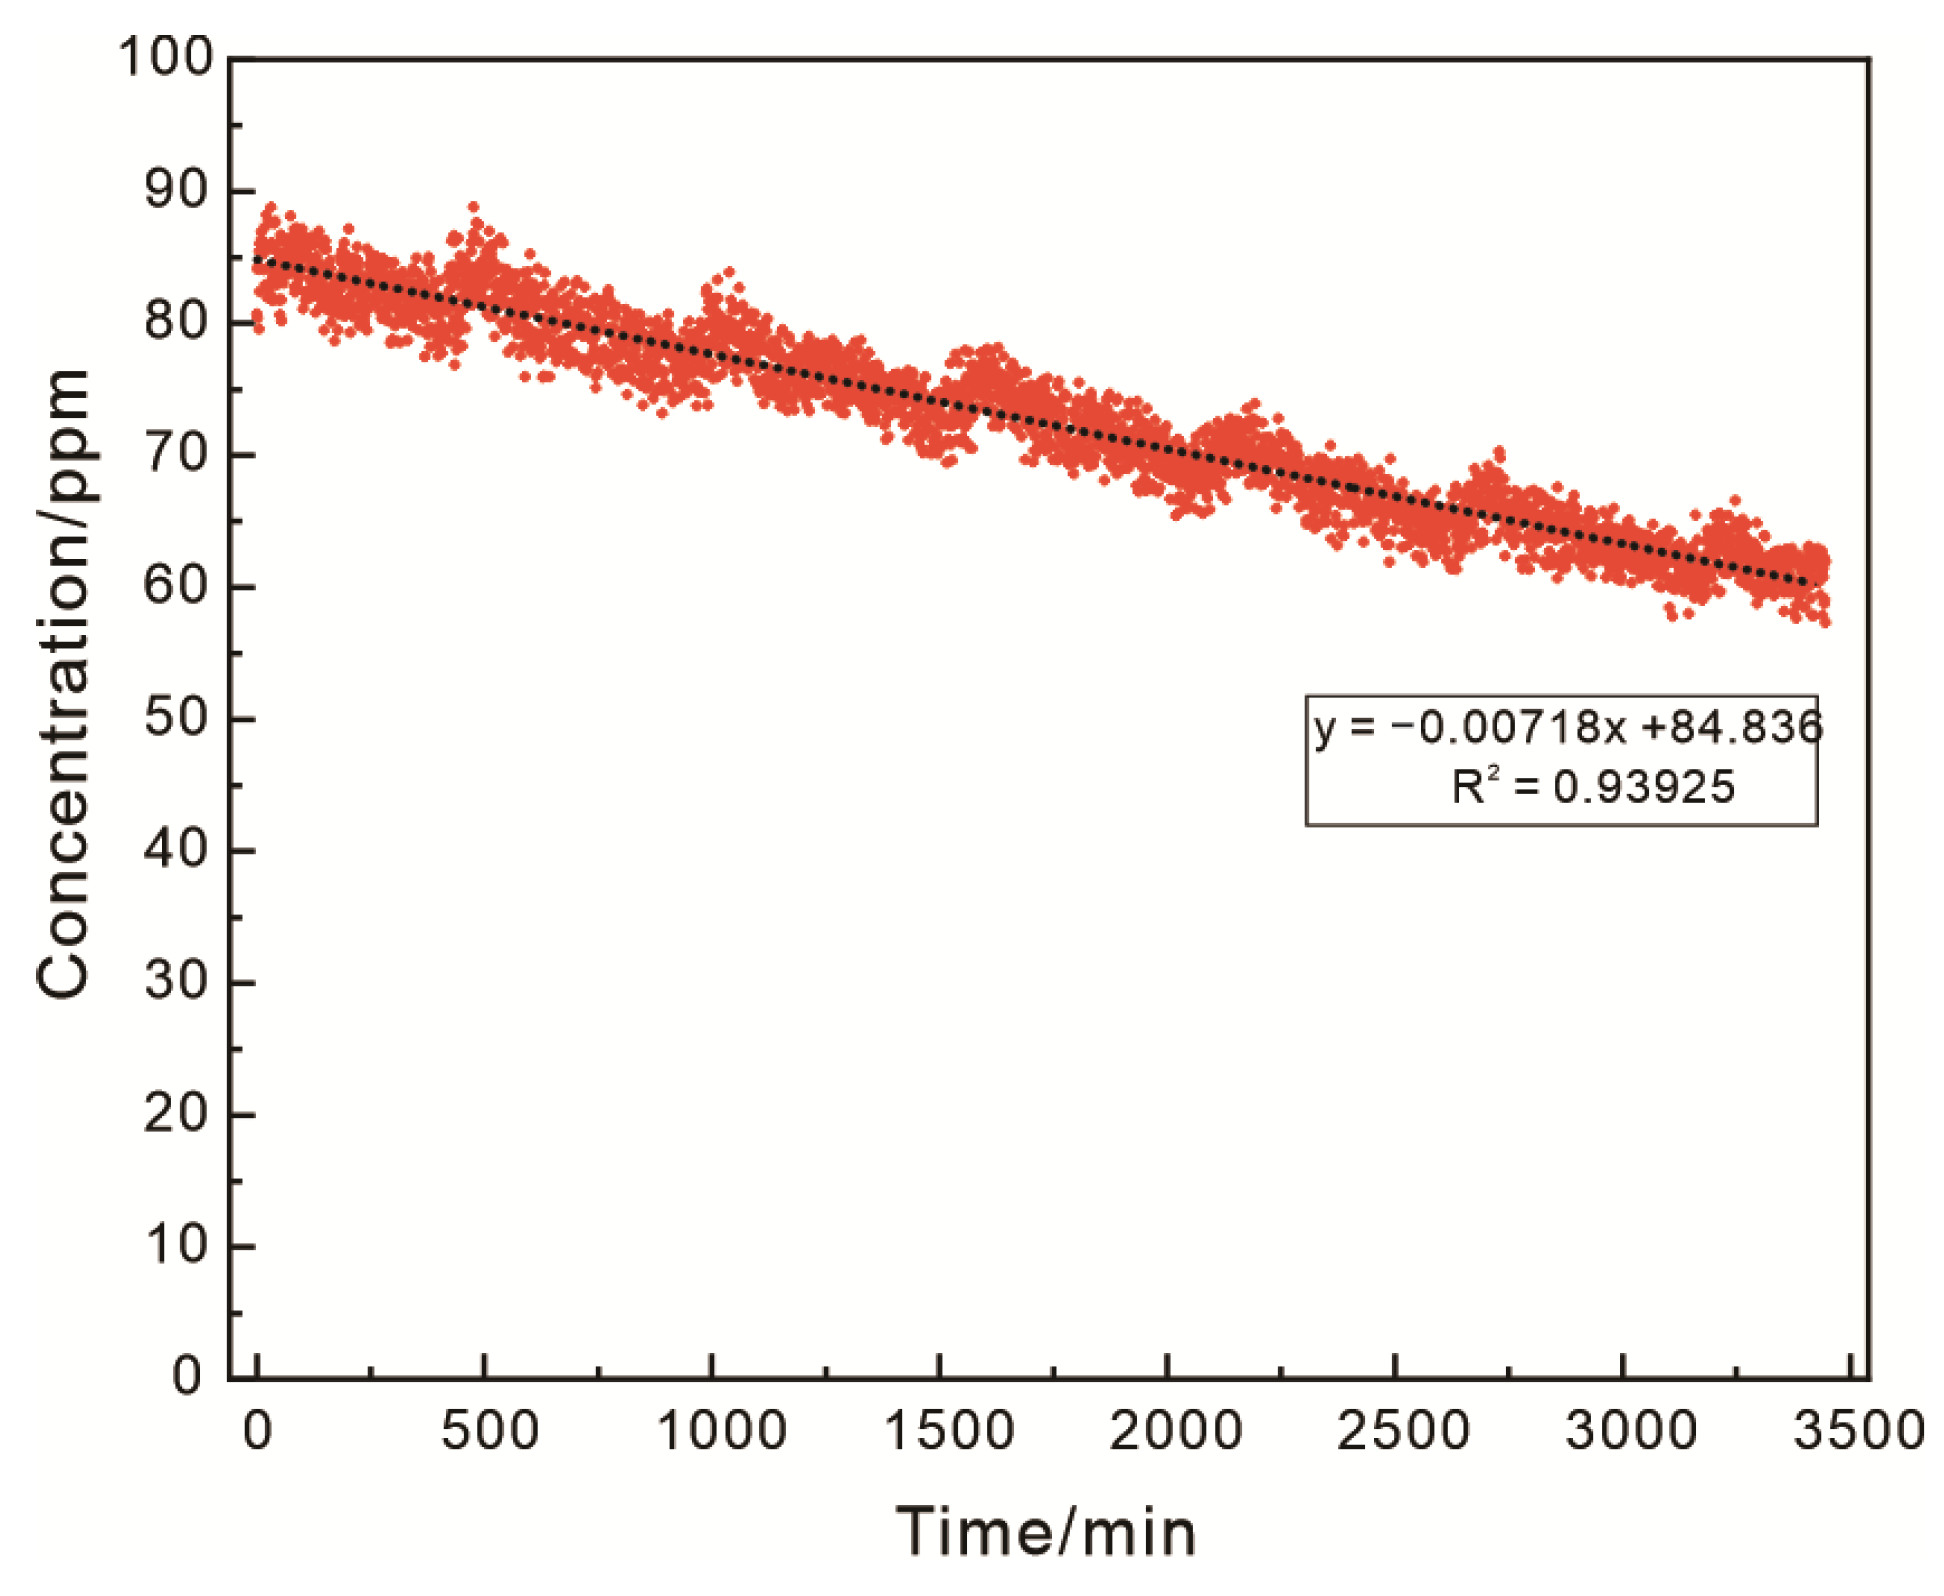
3.4. Air Contamination Calibration

The helium concentration measured by the helium detector at a drilling site is not the that in the examined formation, because the mud gas will be contaminated with air during the degassing process. Usually, the helium concentration in a formation is much higher than in air (5.24 ppm, [7]), and air mixing will lead to a lower measurement value. Therefore, the test results need to be corrected to obtain the actual helium concentration. Since the concentration of methane in air is extremely low, only 1.92 ppm [39], which is negligible compared to that in underground gas, we hypothesized that all the measured methane comes from the underground; so, the helium concentration can be corrected accordingly. The correction formula is as follows:
H e r = H e t H e a × 1 T G 100 T G × 10 2
In the formula, Her is the original helium concentration in the examined formation, in %; Het is the helium concentration measured in the mud gas, in ppm; Hea is the helium concentration in air, with a value of 5.24 ppm; and TG is the total hydrocarbon concentration measured in mud gas, in %. This formula is applicable when the predominant gas in the reservoir is composed of hydrocarbons.

4. Results

In this paper, the designed helium detector was applied to the Dongsheng gas field in the northern Ordos Basin, and helium concentration was determined in three wells in the same area, namely, the wells HJQ-H501, HJQ-H505, and K2-P2. The software used could automatically integrate the signal curve into the concentration standard curve and use the integrated values to obtain the helium concentration in the mud gas. It was found that the time required by the mud gas to pass from the mud tank to the helium detector was 3.5 min; this delay time was taken into account when processing the data.
Helium detection in well HJQ-H501 started from the Shiqianfeng Formation, and the results showed that in the Lower Shihezi Formation, the helium concentration had a good correlation with the total hydrocarbon concentration. In this formation, the average total hydrocarbon concentration was 8.9%, with a maximum of 42.7%, and the average helium concentration was 190 ppm, with a maximum of 830 ppm. Meanwhile, hydrogen was also detected in the well, with a maximum concentration of 3.7%, and no carbon dioxide was detected. It is worth mentioning that a few high-helium-concentration layers were also detected above the main producing layer of the gas reservoir, in which the helium concentration was up to 199 ppm. Helium detection in well HJQ-H505 started from the Yan’an Formation, and no helium was detected during the whole drilling process. A high total hydrocarbon concentration was found in the Shanxi Formation and Lower Shihezi Formation, with a maximum concentration of 28.1% and an average concentration of 7.7%, and no hydrogen and carbon dioxide were detected. Helium detection in well K2-P2 started from the Lower Shihezi Formation, and no helium was detected during the whole drilling process. A high total hydrocarbon concentration was found in the Lower Shihezi Formation, with a maximum concentration of 71.3% and an average concentration of 24.8%. Hydrogen was not detected in the well, and carbon dioxide with a maximum concentration of 2% was detected. The above three wells are all located in the Duguijiahan area of the Dongsheng gas field and are relatively close to each other.

5. Discussion

5.1. Inhomogeneity of Helium Distribution

Among the above three wells, helium was detected only in the HJQ-H501 well; so, we will mainly analyze this well. Since the mud gas is contaminated by atmospheric components during the degassing process, it is necessary to correct the measurement results considering the air pollution to determine the true helium concentration in the examined formation. It is generally believed that the reliability of the data is low when the total hydrocarbon concentration in the mud gas is less than 0.2%. Therefore, the corresponding value needs to be removed when correcting the helium concentration. The corrected helium concentration is indicated as Her (%). After data processing, the helium detection results for the HJQ-H501 well are shown in Figure 9.
It can be seen in Figure 9 that there was very good consistency between the helium concentration and the total hydrocarbon concentration. This was due to the fact that because of their small size and of the poor sealing of the caprock, helium atoms could not remain isolated. Helium is usually coupled with hydrocarbon gases in reservoirs and further enriched in natural gas reservoirs. The helium concentration in the natural gas field in this area was tested by previous researchers, and the results showed that the average helium concentration in the Dongsheng gas field is higher than 0.1%, which, basically, is industrially valuable. Moreover, the Duguijiahan area has a higher helium concentration and, therefore, a greater potential for helium exploration and development [15,21]. We used the helium detector to measure the helium concentration in the P1x section of the HJQ-H501 well in the Duguijiahan area, which was found to be about 0.27% ± 0.0081%. This area has industrial value and can be classified as a helium-rich natural gas field (helium concentration between 0.15% and 0.5%, Dai et al., 2017). The detection results are comparable to previous test results by other researchers in the same section of this area, which further verifies the stability of the helium detector in field drilling sites and the reliability of the data.
Through further analysis, it can be seen in Figure S1 (the a–f layers in Figure S1 correspond to the a–f layers in Figure 9) that some non-natural gas layers showed a higher helium concentration, with an average of 1%, which is generally higher than the concentration in the P1x section (average 0.3%), far exceeding the helium industrial concentration standard. These layers mainly appeared in the Shiqianfeng Formation, Upper Shihezi Formation, and Lower Shihezi Formation. By analyzing the logging curves, it can be seen that the sandstone section had low natural gamma-ray values, negative spontaneous potential anomalies, and low neutron and interval transit time values. In contrast, the mudstone section showed properties opposite to those of the sandstone section, and resistivity was lower than in the adjacent sandstone section, making it easy to distinguish between sandstone and mudstone. Combining the analyses of lithology and helium concentration, it was found that there was an obvious positive correlation between them. Almost all high helium concentrations appeared in the sandstone section. This is because sandstone has higher porosity and better reservoir properties than mudstone, which usually forms reservoirs. It is worth noting that these sandstone sections appeared often overlain and underlain by mudstone, which is particularly obvious in Figure S1a,c,e,f, and the helium concentration showed an increasing trend in the sandstone sections sandwiched by mudstone.
By observing the logging curves, it can be seen that the mudstone had a high natural gamma-ray value, indicating that the concentrations of uranium, thorium, and potassium were high. Helium in gas fields is mainly supplied by the mantle and the crust. In the mantle, it is mainly produced by the degassing of mantle magmas, and in the crust it is produced by the radioactive decay of uranium and thorium. Previous studies showed that the proportion of mantle-derived helium in the Ordos Basin is very small and can be ignored; so, helium in the Ordos Basin is mainly crust-derived [15,21]. There are two main sources of crust-derived helium, one consists of uranium-rich and thorium-rich metamorphic rocks and granitoids in the basin basement undergoing decay, and the other consists of uranium-rich and thorium-rich sedimentary rocks within the basin, usually organic-rich mud shales, undergoing decay. In this study, the mudstones appeared to supply helium to the sandstone and could also act as a cap layer, reducing the upward helium transport, which is important for helium preservation. In addition, these high-helium-concentration sandstone sections showed poor hydrocarbon generation capacity and could not generate large amounts of hydrocarbon gases. Since they are located far from the main hydrocarbon-rich rocks of the reservoir, they showed a small dilution effect of hydrocarbon gas on helium and a relatively high helium concentration.
The three wells for helium concentration detection in this study are all located in the same work area, have the same geological background, and are close to each other. According to the traditional oil and gas accumulation theory, the three wells should provide similar detection results [21]. Although a high hydrocarbon gas concentration was detected in all three wells, helium was detected in only one well, which is inconsistent with traditional knowledge, indicating that helium has a more complex accumulation mechanism. This phenomenon may be related to the different molecular kinetic features of methane and helium. Previous studies found that the molecular mean free path of helium is greater than that of methane. Therefore, in rock formations, the adsorption of methane reduces the channel size, increases surface roughness, and thus suppresses the molecular slip phenomenon. This results in a lower apparent permeability of methane compared to helium. Therefore, helium has a greater migration capacity relative to methane [40], which leads to a more complex accumulation mechanism for helium. Through the above analysis, we found that in the examined natural gas field, the horizontal distribution of helium was not uniform, showing a high degree of heterogeneity. At the same time, in the vertical direction, we found that the natural gas dessert layer might not coincide with the helium dessert layer. The helium concentration in the helium dessert layer was often 1 to 2 times higher than in the natural gas dessert layer, but these layers are not the traditional natural gas target layers, so they are easy to be missed in the traditional exploration process. Using the helium detector to conduct real-time helium detection during drilling processes can promptly allow for detecting abnormally high levels of helium, compensating for the deficiencies of the traditional exploration process, and is of great significance for helium exploration.

5.2. Implications for the Helium Accumulation Mechanism

At present, no independent helium gas reservoir has been found. Helium is mostly coupled with hydrocarbon gases, and sometimes with nitrogen and carbon dioxide. Helium in natural gas reservoirs is mainly produced by the radioactive decay of basement granite and then dissolved in pore water [4,5,6]. When free gas passes through pore water, helium dissolved in water will enter the gas phase due to Henry‘s law and follow the gas, further migrating and accumulate. Free gas plays an important role in the migration and accumulation of helium [7,10,11,12,13]. The formation and accumulation of hydrocarbon gases often occur in the overlying strata far from the basement; so, it is impossible to directly extract helium from basement granite. In addition to hydrocarbon gases, nitrogen and carbon dioxide play an important role in the extraction of helium. However, previous studies showed that the concentration of nitrogen and carbon dioxide in the natural gas of the Ordos Basin is very low, and the test results of this paper further verified this phenomenon [41]. Therefore, the extraction of helium by nitrogen and carbon dioxide in this area is very limited.
Through further analysis of the data, we found an obvious relationship between hydrogen and helium. Figure 10 shows the correlation diagram of hydrogen and helium concentrations. Figure 10a,b represent the first member of the Lower Shihezi Formation in the HJQ-H501 well and the high-helium-concentration area at the top of this member, respectively. Figure 10c,d represent the Huoshiling Formation to the basement and the Huoshiling Formation of well SK-2, respectively. The data of well SK-2 are quoted from Han et al., 2023 [42]. The SK-2 well is located in the Songliao Basin and was drilled through the Cretaceous strata into the underlying basement. In previous works, interval gas sampling was conducted during the drilling process, and these test data could be used to analyze the vertical gas migration. It can be seen in Figure 10a,b that the correlation between hydrogen and helium concentrations in the first member of the Lower Shihezi Formation was poor, but there was a good correlation in the high-helium-concentration area at the top of the formation. The SK-2 well showed the same pattern. The correlation between hydrogen and helium concentrations in the Huoshiling Formation was obviously better than that in the Huoshiling Formation, including the basement (Figure 10c,d). Generally, there was no correlation between hydrogen and helium concentrations from different sources, and these gases also appeared diluted to different degrees by the main gas components in the later stage. However, the positive correlation between hydrogen and helium concentrations in Figure 10b,d shows that hydrogen and helium were mixed before their upward migration, which was observed also in previous studies on the correlation between nitrogen, carbon dioxide, and helium concentrations [7,10,11,12,13] and proves that hydrogen plays an important role in the migration of helium.
At present, it is generally believed that the inorganic genesis of hydrogen mainly occurs in three ways, which are serpentinization, deep degassing, and irradiation of water. Serpentinization refers to the process of generating hydrogen by the reaction between Fe2+-rich minerals (olivine or pyroxene) and water in basal ultramafic rocks; deep degassing refers to the process of releasing hydrogen from the mantle and the earth’s core, excluding the process of degassing within the earth’s crust; water irradiation refers to the process of decomposing hydrogen from water by the energy generated by the decay of radioactive elements (e.g., uranium and thorium) in the earth’s crust, which is also considered to be an important source of hydrogen [43,44,45,46]. Previous studies on hydrogen isotopes in the SK-2 well suggested that the hydrogen in the basement and the Huoshiling Formation mainly derives from the mantle [42]. Since for the HJQ-H501 well the hydrogen isotope test was not conducted, it was impossible to determine the hydrogen source in this well based on isotope data. Usually, the helium isotope ratio can be used to determine whether there is a mixture of mantle-derived fluids. A large number of previous test results showed that the helium isotope ratio in the Ordos Basin suggests a typical crustal source for helium [14,41]. No mantle-derived fluid was found in the basin; so, a deep source of hydrogen can be excluded. In addition, the basement of the Hangjinqi area is mainly composed of Archean and Paleo–Mesoproterozoic granitic gneiss, quartzite, and quartz sandstone. These rocks contain less Fe2+ minerals (olivine and pyroxene), and the contribution of serpentinization to hydrogen production is also extremely limited. Therefore, hydrogen in the HJQ-H501 well is mainly produced by the irradiation of water. Through logging curve analysis and by examining the results of previous studies, it can be seen that the distribution of groundwater in this area is complex [47], and the granite rocks widely distributed in the basement of this area are rich in radioactive elements such as uranium and thorium. The energy generated by the decay of uranium and thorium and the widely distributed water provide sufficient conditions for the irradiation of water to produce hydrogen.
During the late Mesozoic and early Cenozoic, the Ordos Basin experienced a series of tectonic uplift events, particularly during the early Cenozoic period. Continual subduction and compression of the Pacific plate and Indian Ocean plate led to a sustained uplift along the basin margins [48,49]. This resulted in a decrease in the original formation temperature and pressure, causing gases dissolved in groundwater to exsolve, allowing hydrogen and helium to migrate upward together. This process is akin to that observed in the Weiyuan gas field in the Sichuan Basin, which underwent a significant tectonic uplift of nearly 4000 m during the Himalayan orogeny [50]. Consequently, the pressure and temperature of the gas field significantly decreased, leading to the migration of helium, previously trapped in fractures and pores of the granite basement, from high-pressure zones to reservoirs, where it accumulated at normal pressure [51]. However, because of its high reactivity, hydrogen may react with unsaturated long-chain hydrocarbons during its upward migration to form saturated short-chain hydrocarbons [52,53,54], thus decreasing the hydrogen concentration. Nonetheless, regardless of whether hydrogen is transformed into hydrocarbon gases, helium remains inert during this process. Therefore, both hydrogen and hydrocarbon gases can serve as carrier gas for transporting helium upward.
Based on the above discussion, this paper proposes a hydrogen–helium migration and accumulation model (Figure 11). In the diagram, Well-1 represents the situation of a sedimentary basin, where there is no obvious mantle-derived material. Helium is mainly derived from the crust and is produced by the radioactive decay of the basement granite of the basin, and hydrogen is mainly derived from the irradiation of water. Under the influence of the basin tectonic movements, hydrogen produced by water irradiation extracts the helium dissolved in pore water, and the complex hydrodynamic conditions and fracture distribution in the basin provide a migration path for hydrogen and helium, so that they continue to migrate upward along the faults and accumulate in structural high points and hydrocarbon gas reservoirs, which become enriched in helium; this process was observed in well HJQ-H501. Well-2 represents a situation in which the faults in the basin communicate with the overlying mantle, where helium has a crust–mantle mixed origin, and hydrogen mainly comes from mantle degassing. During the upward migration of mantle-derived hydrogen and helium along the fault, crust-derived helium is continuously extracted from the rock, and hydrogen and helium migrate upward to the structural high points together to form a reservoir; this process was observed in well SK-2.

6. Conclusions

In this paper, we designed a helium detector based on a quadrupole mass spectrometer. Through the combination of different inlet valves, we avoided the mixing of gas from different vertical layers during the inlet process and realized high-spatial-resolution helium concentration detection. We applied the helium detector to the Dongsheng gas field in the northern Ordos Basin, and the instrumental detection results were consistent with the laboratory analysis results of the wellhead gas, which demonstrated the stability of the helium detector in the field environment and the reliability of the data. The instrumental results showed that the spatial distribution of helium was different from that traditionally assumed; in fact, the distribution appeared highly uneven in the plane, and the natural gas dessert layer and helium dessert layer did not coincide in the vertical direction. In addition, by comparing these results with previous data, we propose a hydrogen–helium migration and accumulation model, which enriches the understanding of the helium accumulation mechanism and provides a theoretical basis for future helium resource exploration.

Supplementary Materials

The following supporting information can be downloaded at: https://www.mdpi.com/article/10.3390/app14083453/s1, Figure S1: Analysis diagram of high-helium-concentration layers.

Author Contributions

Conceptualization, B.W., D.Z., Q.L. and H.H.; data curation, C.L., B.W., D.Z., X.Z. and H.H.; funding acquisition, H.H.; methodology, C.L.; project administration, H.H.; resources, B.W.; supervision, H.H.; writing—original draft, C.L.; writing—review and editing, Q.L., X.Z. and H.H. All authors have read and agreed to the published version of the manuscript.

Funding

This study was funded by the National Natural Science Foundation of China (Nos. 42141021) and the Project of Stable Support for Youth Team in Basic Research Field, CAS (Nos. YSBR-017).

Institutional Review Board Statement

Not applicable.

Informed Consent Statement

Not applicable.

Data Availability Statement

The original contributions presented in the study are included in the article, further inquiries can be directed to the corresponding authors.

Acknowledgments

We would like to express our gratitude to Yifeng Jing, Jiannan Li, Runchuan Liu, Ziheng Liu, Fei Su, Ye He, Wei Guo, and Yulong Geng for their contribution in data processing.

Conflicts of Interest

The authors declare that they have no known competing financial interests or personal relationships that could have appeared to influence the work reported in this paper. Author Bang Wang was employed by the company North China Measurement and Control Company of Sinopec Matrix Corporation. The remaining authors declare that the research was conducted in the absence of any commercial or financial relationships that could be construed as a potential conflict of interest.

References

  1. Anderson, S.T. Economics, helium, and the US Federal helium reserve: Summary and outlook. Nat. Resour. Res. 2018, 27, 455–477. [Google Scholar] [CrossRef]
  2. Halford, D.T.; Karolytė, R.; Barry, P.H.; Whyte, C.J.; Darrah, T.H.; Cuzella, J.J.; Sonnenberg, S.A.; Ballentine, C.J. High helium reservoirs in the Four Corners area of the Colorado Plateau, USA. Chem. Geol. 2022, 596, 120790. [Google Scholar] [CrossRef]
  3. Molly, B. 2021b-07-07/2021-12-19. Noble Helium: There’s Going to Be Plenty of Helium Available over the Next Decade [EB/OL]. Available online: https://www.gasworld.com/noble-helium-theres-going-to be-plenty-of-helium-available-over-the-next-decade/2021240.article (accessed on 7 July 2021).
  4. Gilfillan, S.M.V.; Ballentine, C.J.; Holland, G.; Blagburn, D.; Lollar, B.S.; Stevens, S.; Martin, S.; Cassidy, M. The noble gas geochemistry of natural CO2 gas reservoirs from the Colorado Plateau and Rocky Mountain provinces, USA. Geochim. Cosmochim. Acta 2008, 72, 1174–1198. [Google Scholar] [CrossRef]
  5. Merrill, M.D.; Hunt, A.G.; Lohr, C.D. Noble gas geochemistry investigation of high CO2 natural gas at the LaBarge Platform, Wyoming, USA. Energy Procedia 2014, 63, 4186–4190. [Google Scholar] [CrossRef]
  6. Yakutseni, V.P. World helium resources and the perspectives of helium industry development. Pet. Geol. 2014, 9, 1–22. [Google Scholar] [CrossRef] [PubMed]
  7. Danabalan, D. Helium: Exploration Methodology for a Strategic Resource; Durham University: Durham, UK, 2017. [Google Scholar]
  8. Cheng, A.R.; Sherwood Lollar, B.; Gluyas, J.G.; Ballentine, C.J. Primary N2–He gas field formation in intracratonic sedimentary basins. Nature 2023, 615, 94–99. [Google Scholar] [CrossRef] [PubMed]
  9. Wang, X.F.; Liu, Q.Y.; Liu, W.H.; Li, X.B.; Tao, C.; Li, X.F.; Zhao, D.; Zhang, J.Y.; Zhu, D.Y.; Meng, Q.Q.; et al. Helium accumulation in natural gas systems in Chinese sedimentary basins. Mar. Pet. Geol. 2023, 150, 106155. [Google Scholar] [CrossRef]
  10. Ballentine, C.J.; Lollar, B.S. Regional groundwater focusing of nitrogen and noble gases into the Hugoton-Panhandle giant gas field, USA. Geochim. Cosmochim. Acta 2002, 66, 2483–2497. [Google Scholar] [CrossRef]
  11. Brown, A.A. PS Formation of High Helium Gases: A Guide for Explorationists. W. 2010. Available online: https://www.searchanddiscovery.com/pdfz/documents/2010/80115brown/ndx_brown.pdf.html (accessed on 29 October 2010).
  12. Zhang, W.; Li, Y.H.; Zhao, F.H.; Han, W.; Li, Y.; Wang, Y.P.; Holland, G.; Zhou, Z. Using noble gases to trace groundwater evolution and assess helium accumulation in Weihe Basin, central China. Geochim. Cosmochim. Acta 2019, 251, 229–246. [Google Scholar] [CrossRef]
  13. Wang, X.F.; Liu, Q.Y.; Liu, W.H.; Zhang, D.D.; Li, X.F.; Zhao, D. Accumulation mechanism of mantle-derived helium resources in petroliferous basins, eastern China. Sci. China Earth Sci. 2022, 65, 2322–2334. [Google Scholar] [CrossRef]
  14. Dai, J.X.; Ni, Y.Y.; Qin, S.F.; Huang, S.P.; Gong, D.Y.; Liu, D.; Feng, Z.Q.; Peng, W.L.; Han, W.X.; Fang, C.C. Geochemical characteristics of He and CO2 from the Ordos (cratonic) and Bohaibay (rift) basins in China. Chem. Geol. 2017, 469, 192–213. [Google Scholar] [CrossRef]
  15. Peng, W.L.; Liu, Q.Y.; Zhang, Y.; Jia, H.C.; Zhu, D.Y.; Meng, Q.Q.; Wu, X.Q.; Deng, S.; Ma, Y.S. The first extra-large helium-rich gas field identified in a tight sandstone of the Dongsheng Gas Field, Ordos Basin, China. Sci. China Earth Sci. 2022, 65, 874–881. [Google Scholar] [CrossRef]
  16. Aquilina, L.; Brach, M. WELCOM: Evolution of chemical monitoring of drilling fluids and industrial perspectives. SPE Drill. Complet. 1995, 10, 158–164. [Google Scholar] [CrossRef]
  17. Sanjuan, B.; Pinault, J.L.; Rose, P.; Gerard, A.; Brach, M.; Braibant, G.; Crouzet, C.; Foucher, J.C.; Gautier, A.; Touzelet, S. Geochemical fluid characteristics and main achievements about tracer tests at Soultz-sous-Forêts (France). In Proceedings of the EHDRA Scientific Conference, Soultz-sous-Forêts, France, 15–16 June 2006; p. 13. [Google Scholar]
  18. Dezayes, C.; Sanjuan, B.; Gal, F.; Lerouge, C. Fluid Geochemistry Monitoring and Fractured Zones Characterization in the GRT1 Borehole (ECOGI Project, Rittershoffen, Alsace, France). Deep Geothermal Days. 2014. Available online: https://www.researchgate.net/publication/278736533_Fluid_geochemistry_monitoring_and_fractured_zones_characterization_in_the_GRT1_borehole_ECOGI_project_Rittershoffen_Alsace_France (accessed on 24 April 2014).
  19. Carcione, E.; Easow, I.; Chiniwala, B. Alkenes Detection From Drill Bit Metamorphism and Real-Time Geochemical Elemental Analysis on Drill Cuttings Aids Drilling Optimization and Geo-steering in Tight Unconventional Laterals. In Proceedings of the 5th Unconventional Resources Technology Conference, Austin, TX, USA, 24–26 July 2017; American Association of Petroleum Geologists: Tulsa, OK, USA, 2017. [Google Scholar] [CrossRef]
  20. Magro, G.; Gherardi, F.; Giudetti, G.; Costantino, N.; Carcione, E. DESCRAMBLE Project: Gas Logging While Drilling the Venelle_2 Geothermal Well. In Proceedings of the World Geothermal Congress, Larderello, Italy, 11–12 May 2020; p. 1. [Google Scholar]
  21. He, F.Q.; Wang, F.B.; Wang, J.; Zou, Y.R.; An, C.; Zhou, X.Y.; Ma, L.B.; Zhao, Y.Q.; Zhang, J.; Liu, D.M.; et al. Helium distribution of Dongsheng gas filed in Ordos Basin and discovery of a super large helium-rich gas field. Pet. Geol. Exp. 2022, 44, 1–10. (In Chinese) [Google Scholar]
  22. Peng, W.L.; Hu, G.Y.; Huang, S.P.; Fang, C.C.; Liu, D.; Feng, Z.Q.; Han, W.X.; Jiang, R.; Chen, H.J. Natural gas geochemical characteristics and genetic analysis: A case study of the Dongsheng gas field in the Ordos basin of China. J. China Univ. Min. Technol. 2017, 46, 74–84. (In Chinese) [Google Scholar]
  23. Wang, J.; Jia, H.C.; Tao, C.; Zhao, Y.Q.; An, C.; Ma, L.B.; Sun, X.; Dong, Q.W.; Wang, F.B. Source and enrichment regularity of helium in Dongsheng Gas Field of Hangjinqi area, Ordos Basin. Nat. Gas Geosci. 2023, 34, 566–575. [Google Scholar]
  24. Ni, C.H.; Zhu, J.H.; Liu, G.X.; Wang, F.B.; Jia, H.C.; Zhang, W.; Wu, Y.L.; Miao, J.J. Re-evaluation of hydrocarbon generation potential of the Upper Paleozoic coal-measure source rocks in the Hangjinqi area of Ordos Basin. Pet. Geol. Exp. 2021, 43, 826–834. [Google Scholar]
  25. Yang, Z.; He, S.; Zou, C.N.; Li, Q.Y.; Chen, Z.Y. Coupling relationship between reservoir diagenesis and natural gas accumulation of Daniudi Gas Field in North Ordos Basin. Acta Pet. Sin. 2010, 31, 373–378+385. (In Chinese) [Google Scholar]
  26. Wang, J.H.; Wang, H.B. Analysis of Oil and Gas Preservation Conditions in the Upper Paleozoic in Hangjinqi Area. Inn. Mong. Petrochem. Ind. 2008, 34, 136–137. (In Chinese) [Google Scholar]
  27. Zhang, W.Q.; Wang, Z.Z.; Hou, X.L.; Xu, F.; Liu, L.; Li, C.L. Influences of caprock sealing capacity on natural gas accumulation: An example from D-12 wellblock of Daniudi gas field in Ordos Basin. Oil Gas Geol. 2011, 32, 880–889. (In Chinese) [Google Scholar]
  28. Lupton, J. Terrestrial inert gases: Isotopic trace studies and clues to primordial components in the mantle. Annu. Rev. Earth Planet. Sci. Lett. 1983, 11, 371–414. [Google Scholar] [CrossRef]
  29. Oxburgh, E.R.; O’nions, R.K.; Hill, R.I. Helium isotopes in sedimentary basins. Nature 1986, 324, 632–635. [Google Scholar] [CrossRef]
  30. Ballentine, C.J.; Mazurek, M.; Gautschi, A. Thermal constraints on crustal rare gas release and migration: Evidence from Alpine fluid inclusions. Geochim. Cosmochim. Acta 1994, 58, 4333–4348. [Google Scholar] [CrossRef]
  31. Ballentine, C.J.; Burnard, P.G. Production, release and transport of noble gases in the continental crust. Rev. Mineral. Geochem. 2002, 47, 481–538. [Google Scholar] [CrossRef]
  32. Porcelli, D.; Ballentine, C.J. Models for distribution of terrestrial noble gases and evolution of the atmosphere. Rev. Mineral. Geochem. 2002, 47, 411–480. [Google Scholar] [CrossRef]
  33. Birner, B.; Severinghaus, J.; Paplawsky, B.; Keeling, R.F. Increasing atmospheric helium due to fossil fuel exploitation. Nat. Geosci. 2002, 15, 346–348. [Google Scholar] [CrossRef]
  34. Brennwald, M.S.; Schmidt, M.; Oser, J.; Kipfer, R. A portable and autonomous mass spectrometric system for on-site environmental gas analysis. Environ. Sci. Technol. 2016, 50, 13455–13463. [Google Scholar] [CrossRef] [PubMed]
  35. Yu, C.X.; Wang, J.D.; Huang, Z.J.; Tian, D. Research progress of portable mass spectrometer. Chin. J. Anal. Lab. 2021, 40, 1480–1488. [Google Scholar]
  36. Schwanethal, J. Minimising 12C3+ interference on 4He+ measurements in a noble gas mass spectrometer. J. Anal. At. Spectrom. 2015, 30, 1400–1404. [Google Scholar] [CrossRef]
  37. He, H.Y.; Zhu, R.X.; Saxton, J. Noble gas isotopes in corundum and peridotite xenoliths from the eastern North China Craton: Implication for comprehensive refertilization of lithospheric mantle. Phys. Earth Planet. Inter. 2011, 189, 185–191. [Google Scholar] [CrossRef]
  38. Hites, R.A. Gas chromatography mass spectrometry. Handb. Instrum. Tech. Anal. Chem. 1997, 1, 609–625. [Google Scholar]
  39. Lan, X.; Thoning, K.W.; Dlugokencky, E.J. Trends in Globally-Averaged CH4, N2O, and SF6 Determined from NOAA Global Monitoring Laboratory Measurements; Version 2023-10. 2022. Available online: https://gml.noaa.gov/ccgg/trends_ch4/ (accessed on 1 October 2023).
  40. Sun, Z.X.; Li, P.P.; Zhou, S.X. A laboratory observation for gases transport in shale nanochannels: Helium, nitrogen, methane, and helium-methane mixture. Chem. Eng. J. 2023, 472, 144939. [Google Scholar] [CrossRef]
  41. Liu, Q.Y.; Wu, X.Q.; Jia, H.C.; Ni, C.H.; Zhu, J.H.; Miao, J.J.; Zhu, D.Y.; Meng, Q.Q.; Peng, W.L.; Xu, H.Y. Geochemical characteristics of helium in natural gas from the Daniudi gas field, Ordos Basin, Central China. Front. Earth Sci. 2022, 10, 823308. [Google Scholar] [CrossRef]
  42. Han, S.B.; Xiang, C.H.; Du, X.; Xie, L.F.; Huang, J.; Wang, C.S. Geochemistry and origins of hydrogen-containing natural gases in deep Songliao basin, China: Insights from continental scientific drilling. Pet. Sci. 2023, 21, 741–751. [Google Scholar] [CrossRef]
  43. Goebel, E.D.; Coveney, R.M.; Angino, E.E.; Zeller, E.J.; Dreschhoff, G.A.M. Geology, composition, isotopes of naturally occurring rich gas from wells near Junction City, Kans. Oil Gas J. 1984, 82, 215–222. [Google Scholar]
  44. Guélard, J.; Beaumont, V.; Rouchon, V.; Guyot, F.; Pillot, D.; Jézéquel, D.; Ader, M.; Newell, K.; Deville, E. Natural H2 in Kansas: Deep or shallow origin? Geochem. Geophys. Geosystems 2017, 18, 1841–1865. [Google Scholar] [CrossRef]
  45. Klein, F.; Grozeva, N.G.; Seewald, J.S. Abiotic methane synthesis and serpentinization in olivine-hosted fluid inclusions. Proc. Natl. Acad. Sci. USA 2019, 116, 17666–17672. [Google Scholar] [CrossRef]
  46. Klein, F.; Tarnas, J.D.; Bach, W. Abiotic sources of molecular hydrogen on Earth. Elem. Int. Mag. Mineral. Geochem. Petrol. 2020, 16, 19–24. [Google Scholar] [CrossRef]
  47. Zhang, Z.Y. Characteristics and control factors of gas-water distribution in the Lower Shihezi Formation, northern margin of Ordos Basin. Nat. Gas Technol. Econ. 2021, 15, 1–7. (In Chinese) [Google Scholar]
  48. Liu, C.Y.; Wang, J.Q.; Zhang, D.D.; Zhao, H.G.; Zhao, J.F.; Huang, L.; Wang, W.Q.; Qin, Y. Genesis of rich hydrocarbon resources and their occurrence and accumulation characteristics in the Ordos Basin. Oil Gas Geol. 2021, 42, 1011–1029. [Google Scholar]
  49. Yu, H.W. Mechanism of Natural Gas Differential Enrichment in the Transition Zone at the Margin of the Basin: A Case Study on the Hangjinqi Area in the Northern Ordos Basin; China University of Geosciences: Wuhan, China, 2023. [Google Scholar]
  50. Liu, S.G.; Sun, W.; Zhao, Y.H.; Wang, G.Z.; Song, L.K.; Deng, B.; Liang, F.; Song, J.M. Differential accumulation and distribution of natural gas and its main controlling factors in the Sinian Dengying Fm, Sichuan Basin. Nat. Gas Ind. B 2015, 2, 24–36. [Google Scholar] [CrossRef]
  51. Wang, X.F.; Liu, W.H.; Li, X.B.; Liu, Q.Y.; Tao, C.; Xu, Y.C. Radiogenic helium concentration and isotope variations in crustal gas pools from Sichuan Basin, China. Appl. Geochem. 2020, 117, 104586. [Google Scholar] [CrossRef]
  52. Seewald, J.S. Organic–inorganic interactions in petroleum-producing sedimentary basins. Nature 2003, 426, 327–333. [Google Scholar] [CrossRef] [PubMed]
  53. Wang, W.Q.; Liu, C.Y.; Liu, W.H.; Zhao, D.D. Factors influencing hydrogen yield in water radiolysis and implications for hydrocarbon generation: A review. Arab. J. Geosci. 2018, 11, 542. [Google Scholar] [CrossRef]
  54. Milkov, A.V. Molecular hydrogen in surface and subsurface natural gases: Abundance, origins and ideas for deliberate exploration. Earth-Sci. Rev. 2022, 230, 104063. [Google Scholar] [CrossRef]
  55. Hand, E. Hidden Hydrogen: Earth May Hold Vast Stores of a Renewable, Carbon-Free Fuel. 2023. Available online: https://www.science.org/content/article/hidden-hydrogen-earth-may-hold-vast-stores-renewable-carbon-free-fuel (accessed on 16 February 2023).
Figure 1. Location of the Dongsheng Gas Field in the Ordos Basin (a), location of the test wells (b), and comprehensive stratigraphic histogram (c). (Modified after [15]).
Applsci 14 03453 g001
Figure 2. Schematic diagram of the mud gas real-time detection device. (a) Degassing process of mud gas in mud tank, (b) overall mud gas testing process at drilling site.
Applsci 14 03453 g002
Figure 3. Design of the helium detector. ①: Pressure-regulating valve; ②: chromatographic column; ③: quadrupole mass spectrometer; ④: power supply; ⑤: control module; ⑥: inlet valve box; ⑦: temperature controller.
Applsci 14 03453 g003
Figure 4. Instrument gas flow diagram. The blue, red, and yellow lines represent carrier gas, sample gas, and carrier gas + sample gas, respectively. And (ad) represent the first, second, third, and fourth working states respectively.
Applsci 14 03453 g004
Figure 5. Instrument blank and interference peak signal diagram.
Applsci 14 03453 g005
Figure 6. Helium concentration standard curve.
Applsci 14 03453 g006
Figure 7. Single measurement deviation analysis.
Applsci 14 03453 g007
Figure 8. Instrument signal attenuation test.
Applsci 14 03453 g008
Figure 9. Detection results for helium, C1–C4, and total hydrocarbon components in the HJQ-H501 well.
Applsci 14 03453 g009
Figure 10. Correlation of hydrogen and helium concentrations. (a) The first member of the Lower Shihezi Formation in the HJQ-H501 well, (b) the high-helium-concentration area at the top of the first member of the Lower Shihezi Formation in the HJQ-H501 well, (c) the Huoshiling Formation and basement in the SK-2 well, (d) the Huoshiling Formation in the SK-2 well.
Applsci 14 03453 g010
Figure 11. Hydrogen–helium migration and accumulation model (modified after [55]).
Applsci 14 03453 g011
Table 1. Test data of helium standard samples at various concentrations.
Conc
/ppm
11.520406080100200300400500
216.06489.871113.441655.322227.782717.815452.348128.7610,214.3612,526.37
206.94487.521119.001718.252231.402688.565489.848011.9310,496.6312,576.73
204.70457.731029.811667.752303.242739.665476.918001.1710,161.6713,143.76
212.84488.041111.861694.242170.982799.835516.298029.0410,560.7013,113.57
185.18456.761017.851503.532323.412882.535388.678112.9710,586.1213,102.60
187.14451.801043.911693.032371.862708.835524.528204.9710,751.6413,173.48
205.48483.451070.141699.052349.792845.905396.388191.5110,399.0813,022.04
205.15502.191051.761677.832310.092787.585766.088205.7710,571.1513,243.08
178.84481.671070.561719.302315.902859.425511.458210.3810,502.7213,010.30
203.18511.611085.951687.232322.802838.355396.498263.5710,648.6813,069.48
STDEV11.7918.8334.0959.1559.2665.93103.8789.50175.13232.84
AVERAGE200.55481.061071.431671.552292.732786.855491.908136.0110,489.2812,998.14
RSD5.883.913.183.542.582.371.891.101.671.79
Disclaimer/Publisher’s Note: The statements, opinions and data contained in all publications are solely those of the individual author(s) and contributor(s) and not of MDPI and/or the editor(s). MDPI and/or the editor(s) disclaim responsibility for any injury to people or property resulting from any ideas, methods, instructions or products referred to in the content.

