Article

Aqueous Theta-Phase Aluminum Oxide Nanofluid for Energy Applications: Experimental Study on Thermal Conductivity

by
Alejandro Zacarías
1,
Mercedes de Vega
2,
Néstor García-Hernando
2 and
María Venegas
3,*
1
ESIME Azcapotzalco, Instituto Politécnico Nacional, Mexico City 02550, Mexico
2
ISE Research Group, Department Thermal and Fluids Engineering, UC3M, 28911 Madrid, Spain
3
ISE and GTADS Research Groups, Department Thermal and Fluids Engineering, UC3M, 28911 Madrid, Spain
*
Author to whom correspondence should be addressed.
Appl. Sci. 2024, 14(8), 3225; https://doi.org/10.3390/app14083225
Submission received: 20 March 2024 / Revised: 5 April 2024 / Accepted: 8 April 2024 / Published: 11 April 2024
(This article belongs to the Section Applied Thermal Engineering)

Abstract

:

Featured Application

Heat transfer improvement using alumina-water nanofluid.

Abstract

The use of nanofluids in energy systems allows for increasing efficiency and developing more economic systems. Alumina-water is one of the most common nanofluids used but little information is available about the aqueous theta-phase aluminum oxide. Given the lack of thermal conductivity data for this nanofluid, in this research, this property is experimentally evaluated. Nanofluid is prepared using the two-step method, employing a magnetic stirrer and a sonication bath. A high-precision sensor is employed for measuring thermal conductivity, using the method of transient hot wire. The thermal conductivity measurements for the base fluid (water) are compared with data provided by NIST. Nanoparticle mass fraction in the nanofluid is increased from 1 to 10% and the temperature from 22.1 to 59.3 °C. Three sonication times (1.5, 4 and 16.5 h) are used. A strong dependence between the thermal conductivity and the temperature and nanoparticles concentration has been found, while the sonication time has a negligible influence on the thermal conductivity in the range of times tested. A correlation to obtain the thermal conductivity of the water-based nanofluid using theta-phase aluminum oxide has been developed, including nanoparticle volume concentration and temperature. An excellent agreement is obtained between predicted and experimental data.

1. Introduction

The use of nanofluids in many applications has received an increasing interest in recent years, mainly because their thermal properties are better than those of conventional fluids. Its use in the field of renewable and sustainable energy technologies allows for creating high-efficient and more economic systems. In this regard, many research studies [1,2,3,4,5,6,7,8] have evaluated, theoretically and experimentally, the increase in performance in heat transfer applications and solar thermal systems associated with the use of alumina-water as working fluid.
With the aim of providing an optimum design of the energy system, thermal properties of the nanofluid should be known beforehand, including thermal conductivity and viscosity, among other properties. Many researchers, in recent years, have evaluated these thermodynamic properties using different types of nanoparticles. Refs. [9,10] presented extensive reviews on theoretical and experimental studies about nanofluids. In a more recent review, and related to the thermal conductivity of nanofluids containing nanoparticles of alumina and water as base fluid, ref. [11] summed up the results of [12,13,14,15,16], who assessed the influence of nanoparticle concentration on thermal conductivity. The same authors also summarized, in the review, the works of [17,18,19,20] which evaluated the impact of nanofluid temperature on the thermal conductivity of the same fluid. In addition to the previous works included in the review of [11], refs. [21,22,23,24,25,26,27,28,29,30,31,32] evaluated the way in which the temperature and nanoparticle volume fraction modify the thermal conductivity of nanofluids containing water and alumina.
Table 1 summarizes experimental research found in the open literature evaluating the effect of temperature and nanoparticle concentration on the thermal conductivity of nanofluids composed of alumina and water. This table includes the ranges of the volume concentration and temperature used in their experiments, the nanoparticle phase and size and the test method used to measure the thermal conductivity. In the table, it can be observed that very large differences exist in the experimental conditions, and also in the size of the nanoparticles used.
The effect of other variables has also been experimentally evaluated. For example, in [31], the authors have assessed the influence of surfactants on nanofluids thermal conductivity. The authors have shown that, after adding the surfactant to the aluminum oxide-water nanofluid, the stabilization of nanoparticles improves, and thermal conductivity rises when the nanoparticle volume fraction and the temperature increase.
In their review, ref. [33] presented a summary of the published literature on the effects of the ultrasonication time on the thermophysical properties of nanofluids, including the thermal conductivity of aluminum oxide-water. Specifically, ref. [30] studied the effect of the sonication time on this nanofluid thermal conductivity using concentrations of alumina between 0.1 and 20 vol% and temperatures in the range from 25 to 65 °C. Sonication time was modified approximately between 25 and 115 min. The authors found no significant effect on the thermal conductivity of the nanofluid, with this property remaining almost constant for each alumina concentration. In a similar way, ref. [28] observed that for sonication times starting at 90 min and going up to 150 min, thermal conductivity remained approximately constant. However, in the range from 30 to 90 min, an increase in thermal conductivity is observed. In this case, the experiments were developed using 2 and 3 vol% of nanoparticles and the temperature changed from 15 to 45 °C. Higher values of thermal conductivities were reported by [28] in comparison to [30], using the same temperature and volume concentration of nanoparticles, and also without ultrasonication.
In [29], the authors evaluated experimentally the effect of the ultrasonication time (from 0 to 5 h) using 0.5 vol% of nanoparticles and temperatures from 10 to 50 °C. In this case, a slight increase in thermal conductivity was observed for sonication times larger than 1 h and up to the 5 h tested. Also, in [29], higher values of thermal conductivities were obtained in comparison to [30]. Again, as in [28], an increase in thermal conductivity was obtained when the time increased from 1 to 2 h.
According to [34], seven phases of alumina (transition alumina) are available, denoted by the following Greek symbols: gamma (γ), delta (δ), eta (η), theta (θ), kappa (κ), rho (ρ) and chi (χ). In addition to this, they showed that the formation sequence of the different phases is a strong function of the raw materials used at the beginning and the way in which they are formed. ref. [35] shows that the surface area per gram of nano-powder depends on the phase (alpha: specific surface > 10 m2/gr, average particle size of 40 nm; gamma: specific surface > 40 m2/gr, average particle size of 40 nm; theta: specific surface > 100 m2/gr, average particle size of 15 nm). According to [36], phase transformations of alumina reduce the specific surface area of the nanoparticles. This result is associated with a structural collapse and decrease in the amount of surface electron–acceptor or electron–donor sites. However, as stated by [37], in spite of the high scientific interest in these nanoparticles, little is known yet about the physicochemical properties of their several morphological variations, which remain largely unexplored until now. Table 1 also summarizes the phase of the alumina nanoparticles used in different experimental studies. In four cases, the γ-phase was used, while, in the rest of works, the phase was not specified.
The literature review presented allows for concluding that some experimental studies evaluating the impact of nanoparticle concentration, sonication time and temperature on the thermal conductivity of nanofluids containing water and alumina are available. In the special case of theta-phase alumina, no research has been found in the open literature. In the present work, the effect of these three independent parameters on the thermal conductivity of a nanofluid composed of water and this alumina phase is experimentally evaluated. For the first time, a sonication time as high as 16.5 h has been used. A correlation is derived to estimate thermal conductivity using, as independent variables, the most influencing parameters identified in this research: nanoparticle concentration and temperature.

2. Materials and Methods

The experimental research performed to assess the thermal conductivity of nanofluids incorporating water and nanoparticles of theta-phase aluminum oxide has been developed using the materials, equipment and procedure described in the following.

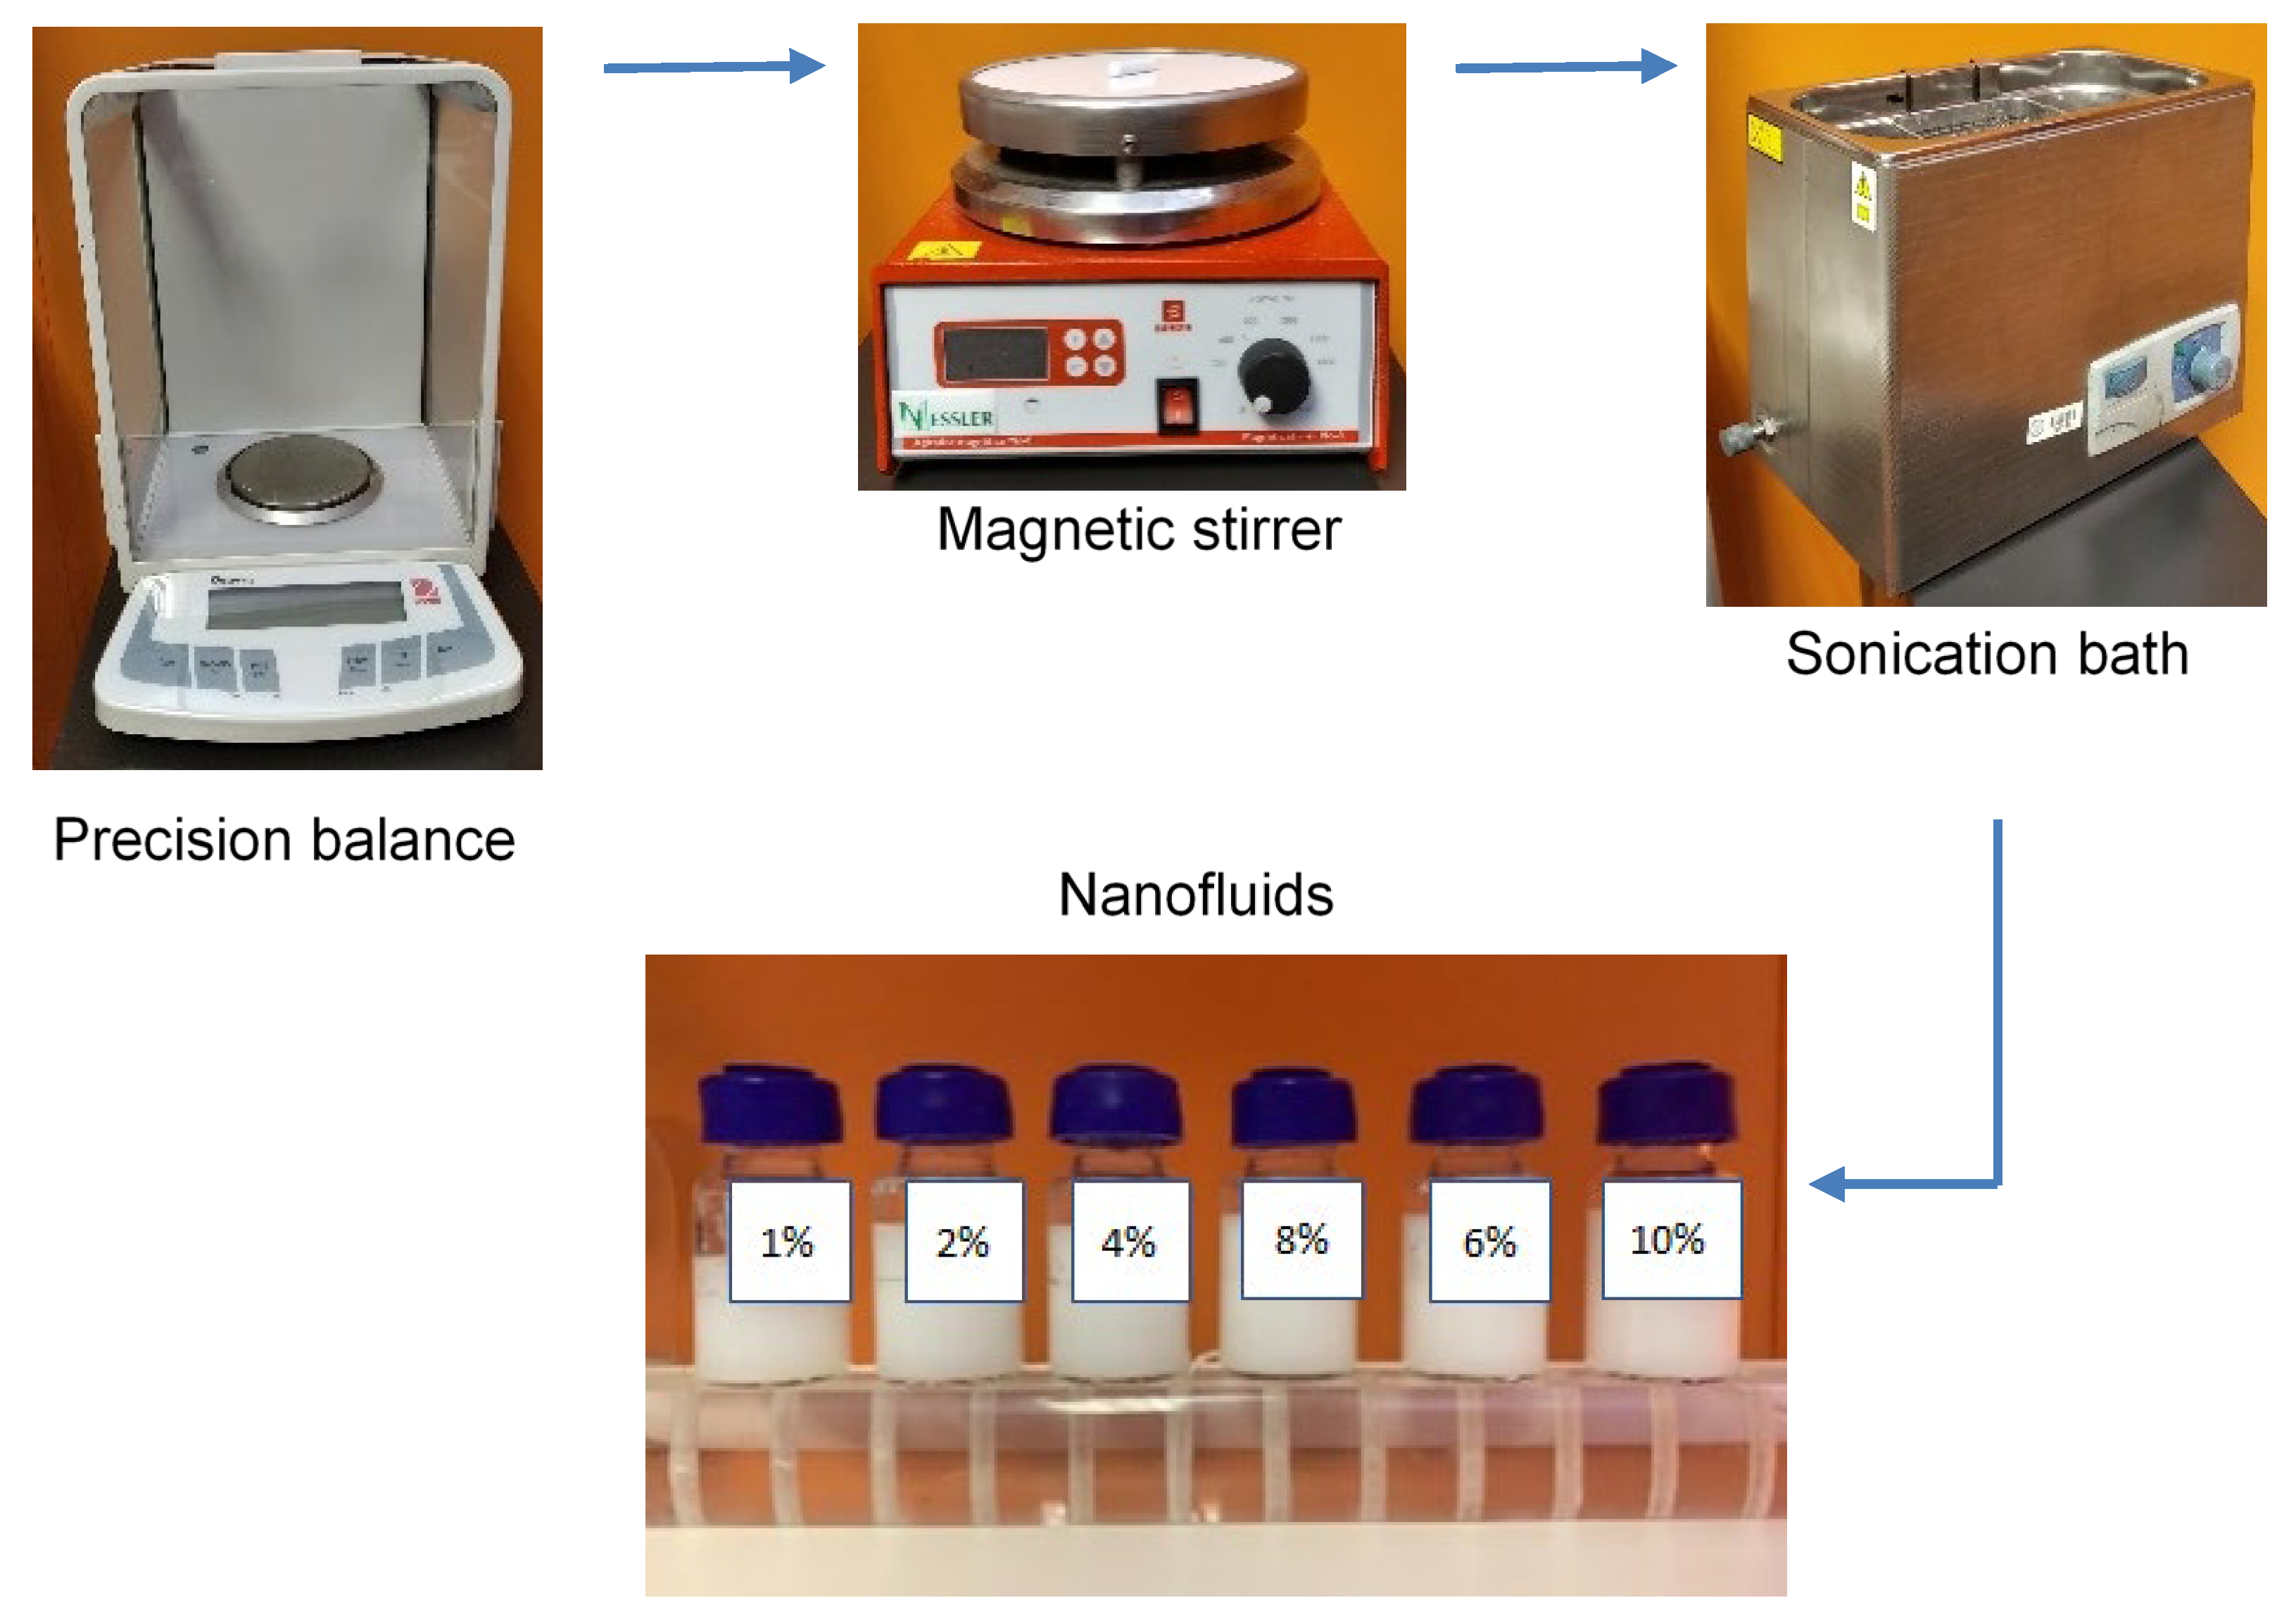
2.1. Preparation of the Nanofluids

Aluminum oxide nanopowder, theta-phase (purity > 99.8% after ignition, loss after ignition < 3%) was purchased from [35]. The average particle size (BET) was 15 nm. Deionized water was employed to prepare the aqueous-based aluminum oxide nanofluids. Table 2 summarizes the main data of the nanoparticles used in the experiments.
The two-step method was employed to prepare dissimilar nanofluid compositions, including 1, 2, 4, 6, 8 and 10 wt% of theta-phase aluminum oxide. A precision balance (OHAUS DV215CD, Nänikon, Switzerland) was used to weigh the samples. The quantity of aluminum oxide needed for the preparation of nanofluids was obtained using the following mixture law:
X w t = m n p m n p + m b
where m b and m n p represent, respectively, the mass of base fluid and nanoparticles.
The weighted quantity of aluminum oxide was dispersed in deionized water using a magnetic stirrer (BUNSEN, Madrid, Spain, 10 L, 500 W, 2100 rpm) and a sonication bath (JP SELECTA, Barcelona, Spain, 3000513, 360 W) to get a good dispersion in the base fluid of the nanoparticles. Figure 1 shows a scheme of the procedure followed for the preparation and pictures of the equipment used and the samples tested. Magnetic stirring was carried out for a few minutes until a uniform mixing of aluminum oxide nanoparticles in the deionized water was visually checked. To reach a homogeneous dispersion in the base fluid of the nanoparticles, the prepared suspensions were sonicated for 1.5, 4 and 16.5 h. Homogenization times were selected, first, considering previous experiments: typical values (1.5 h) and values closed to the maximum (4 h). A much higher value than previously reported to evaluate the possible influence of using larger sonication times (16.5 h) was finally explored. After sonication, the prepared samples were stable for more than 30 days. Stability was assessed by visual inspection, and no sedimentation was noticed at the bottom.

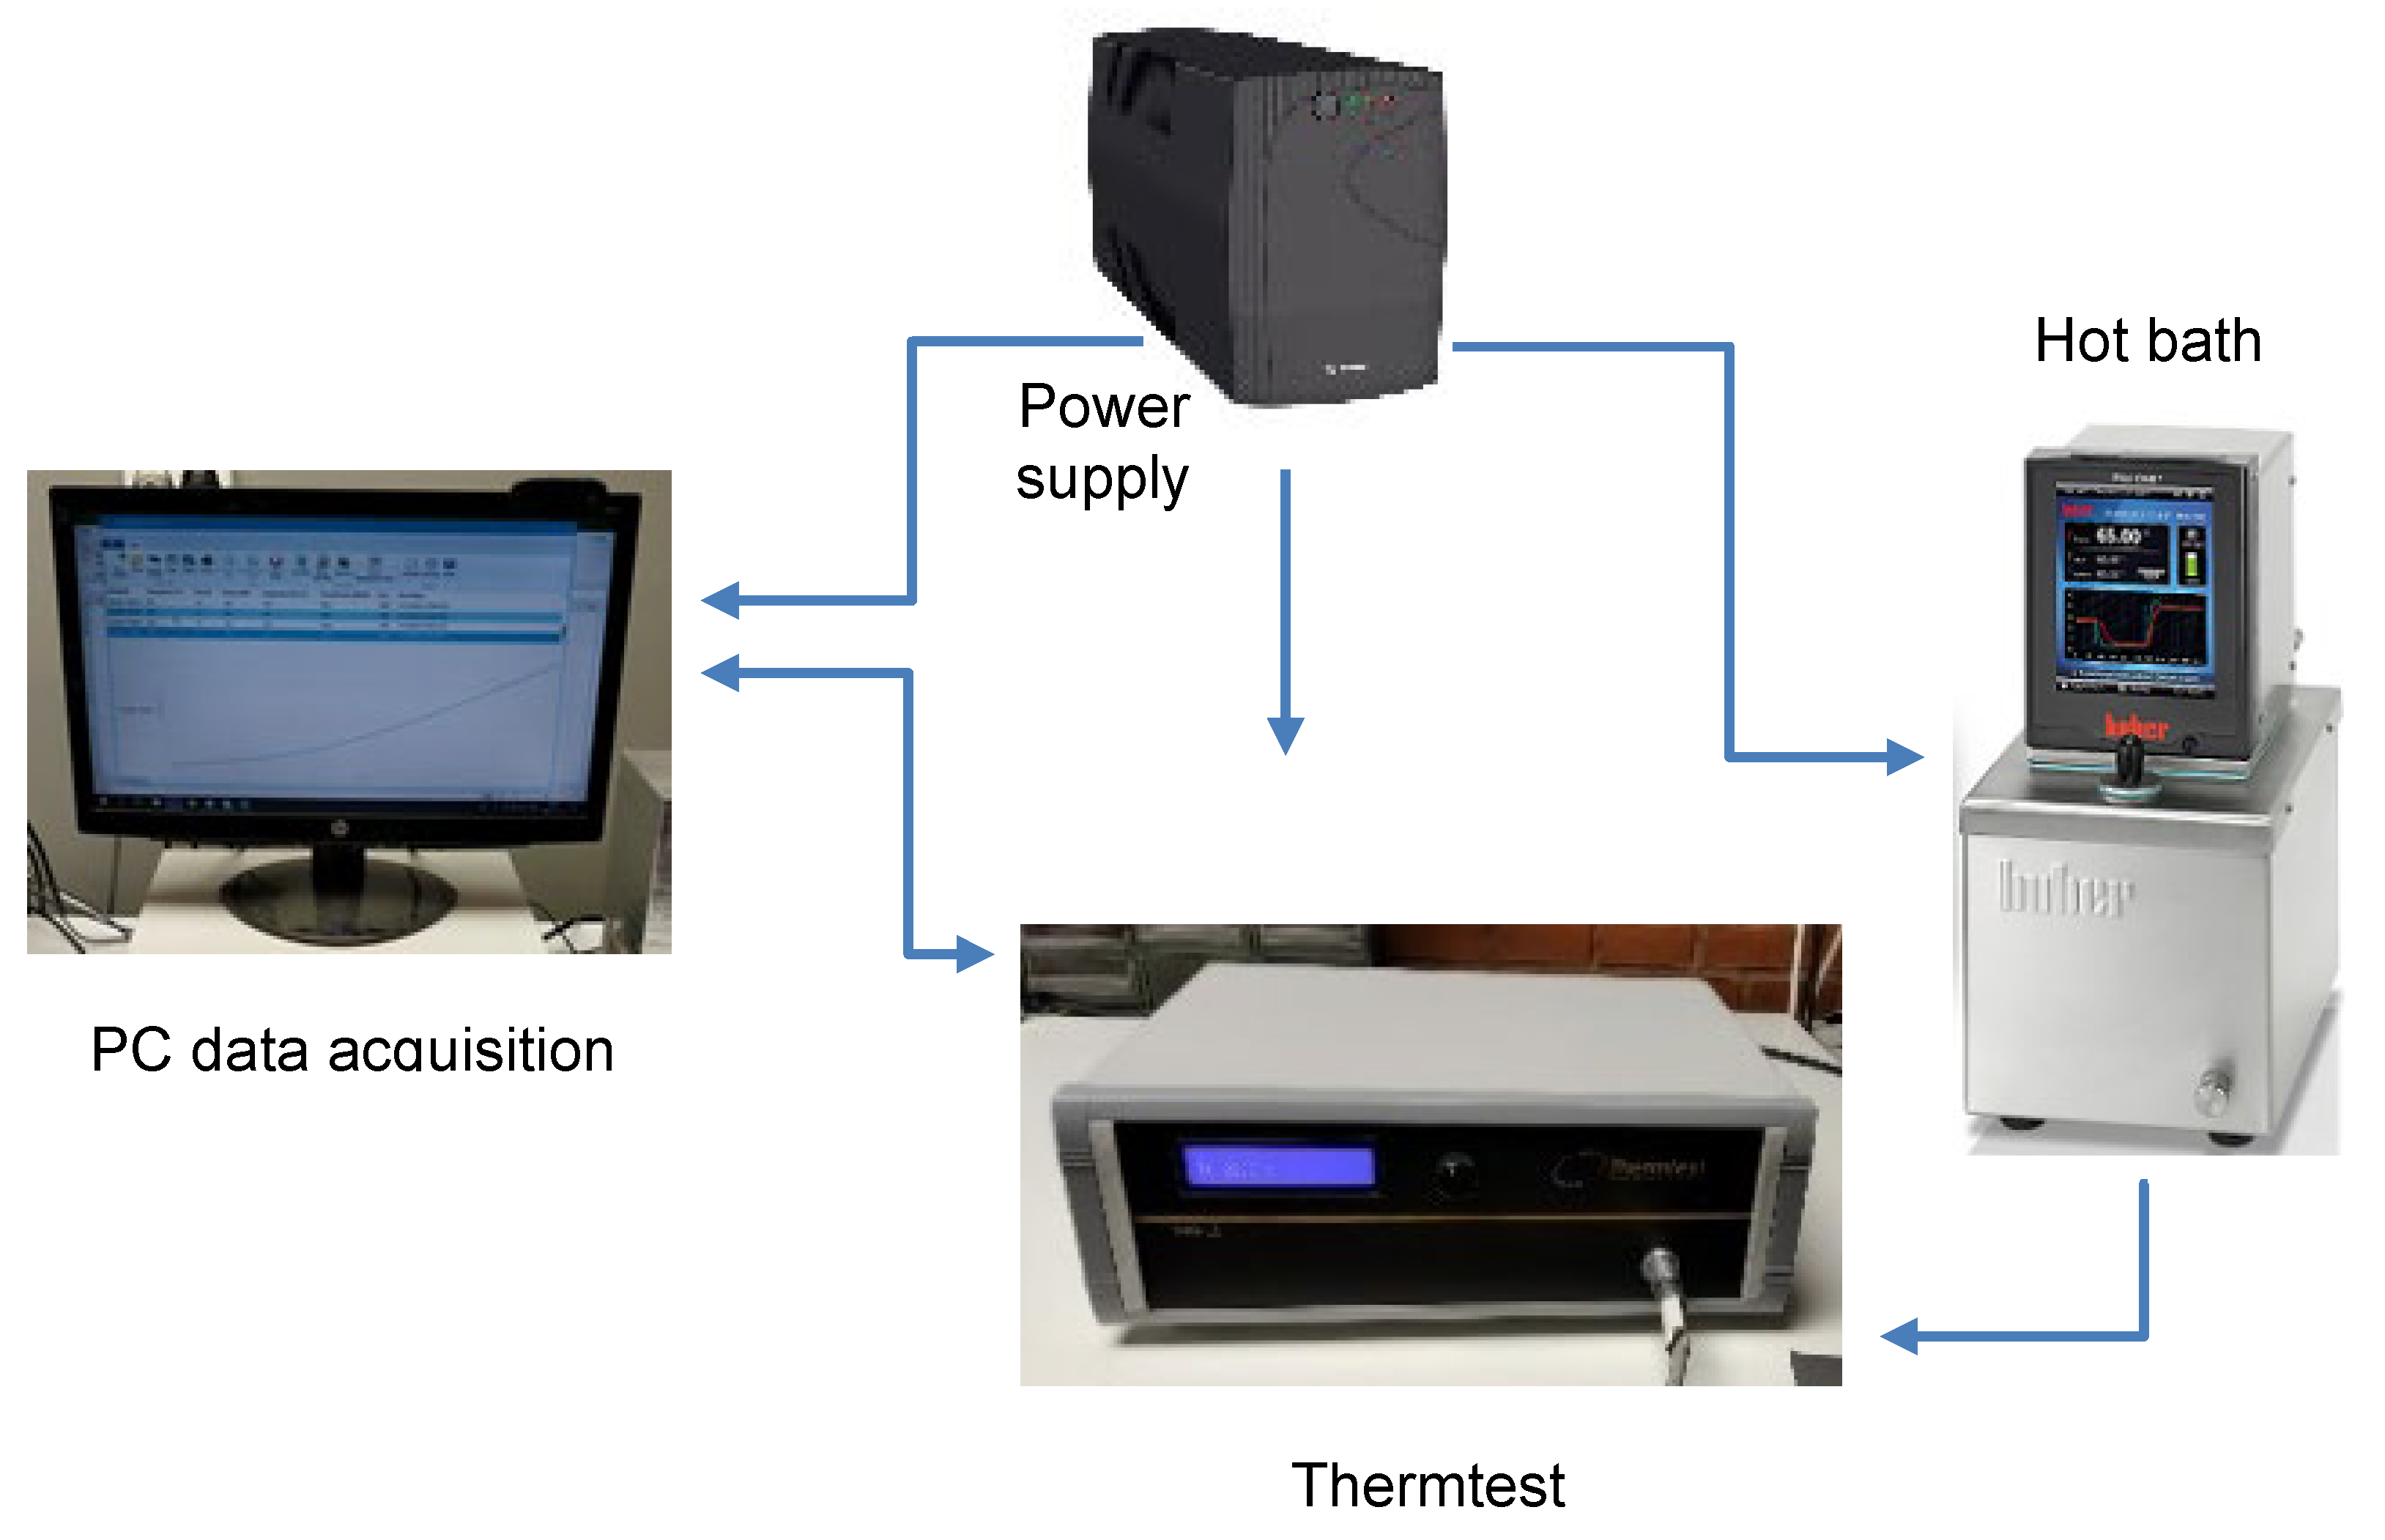
2.2. Equipment and Measurement Procedure
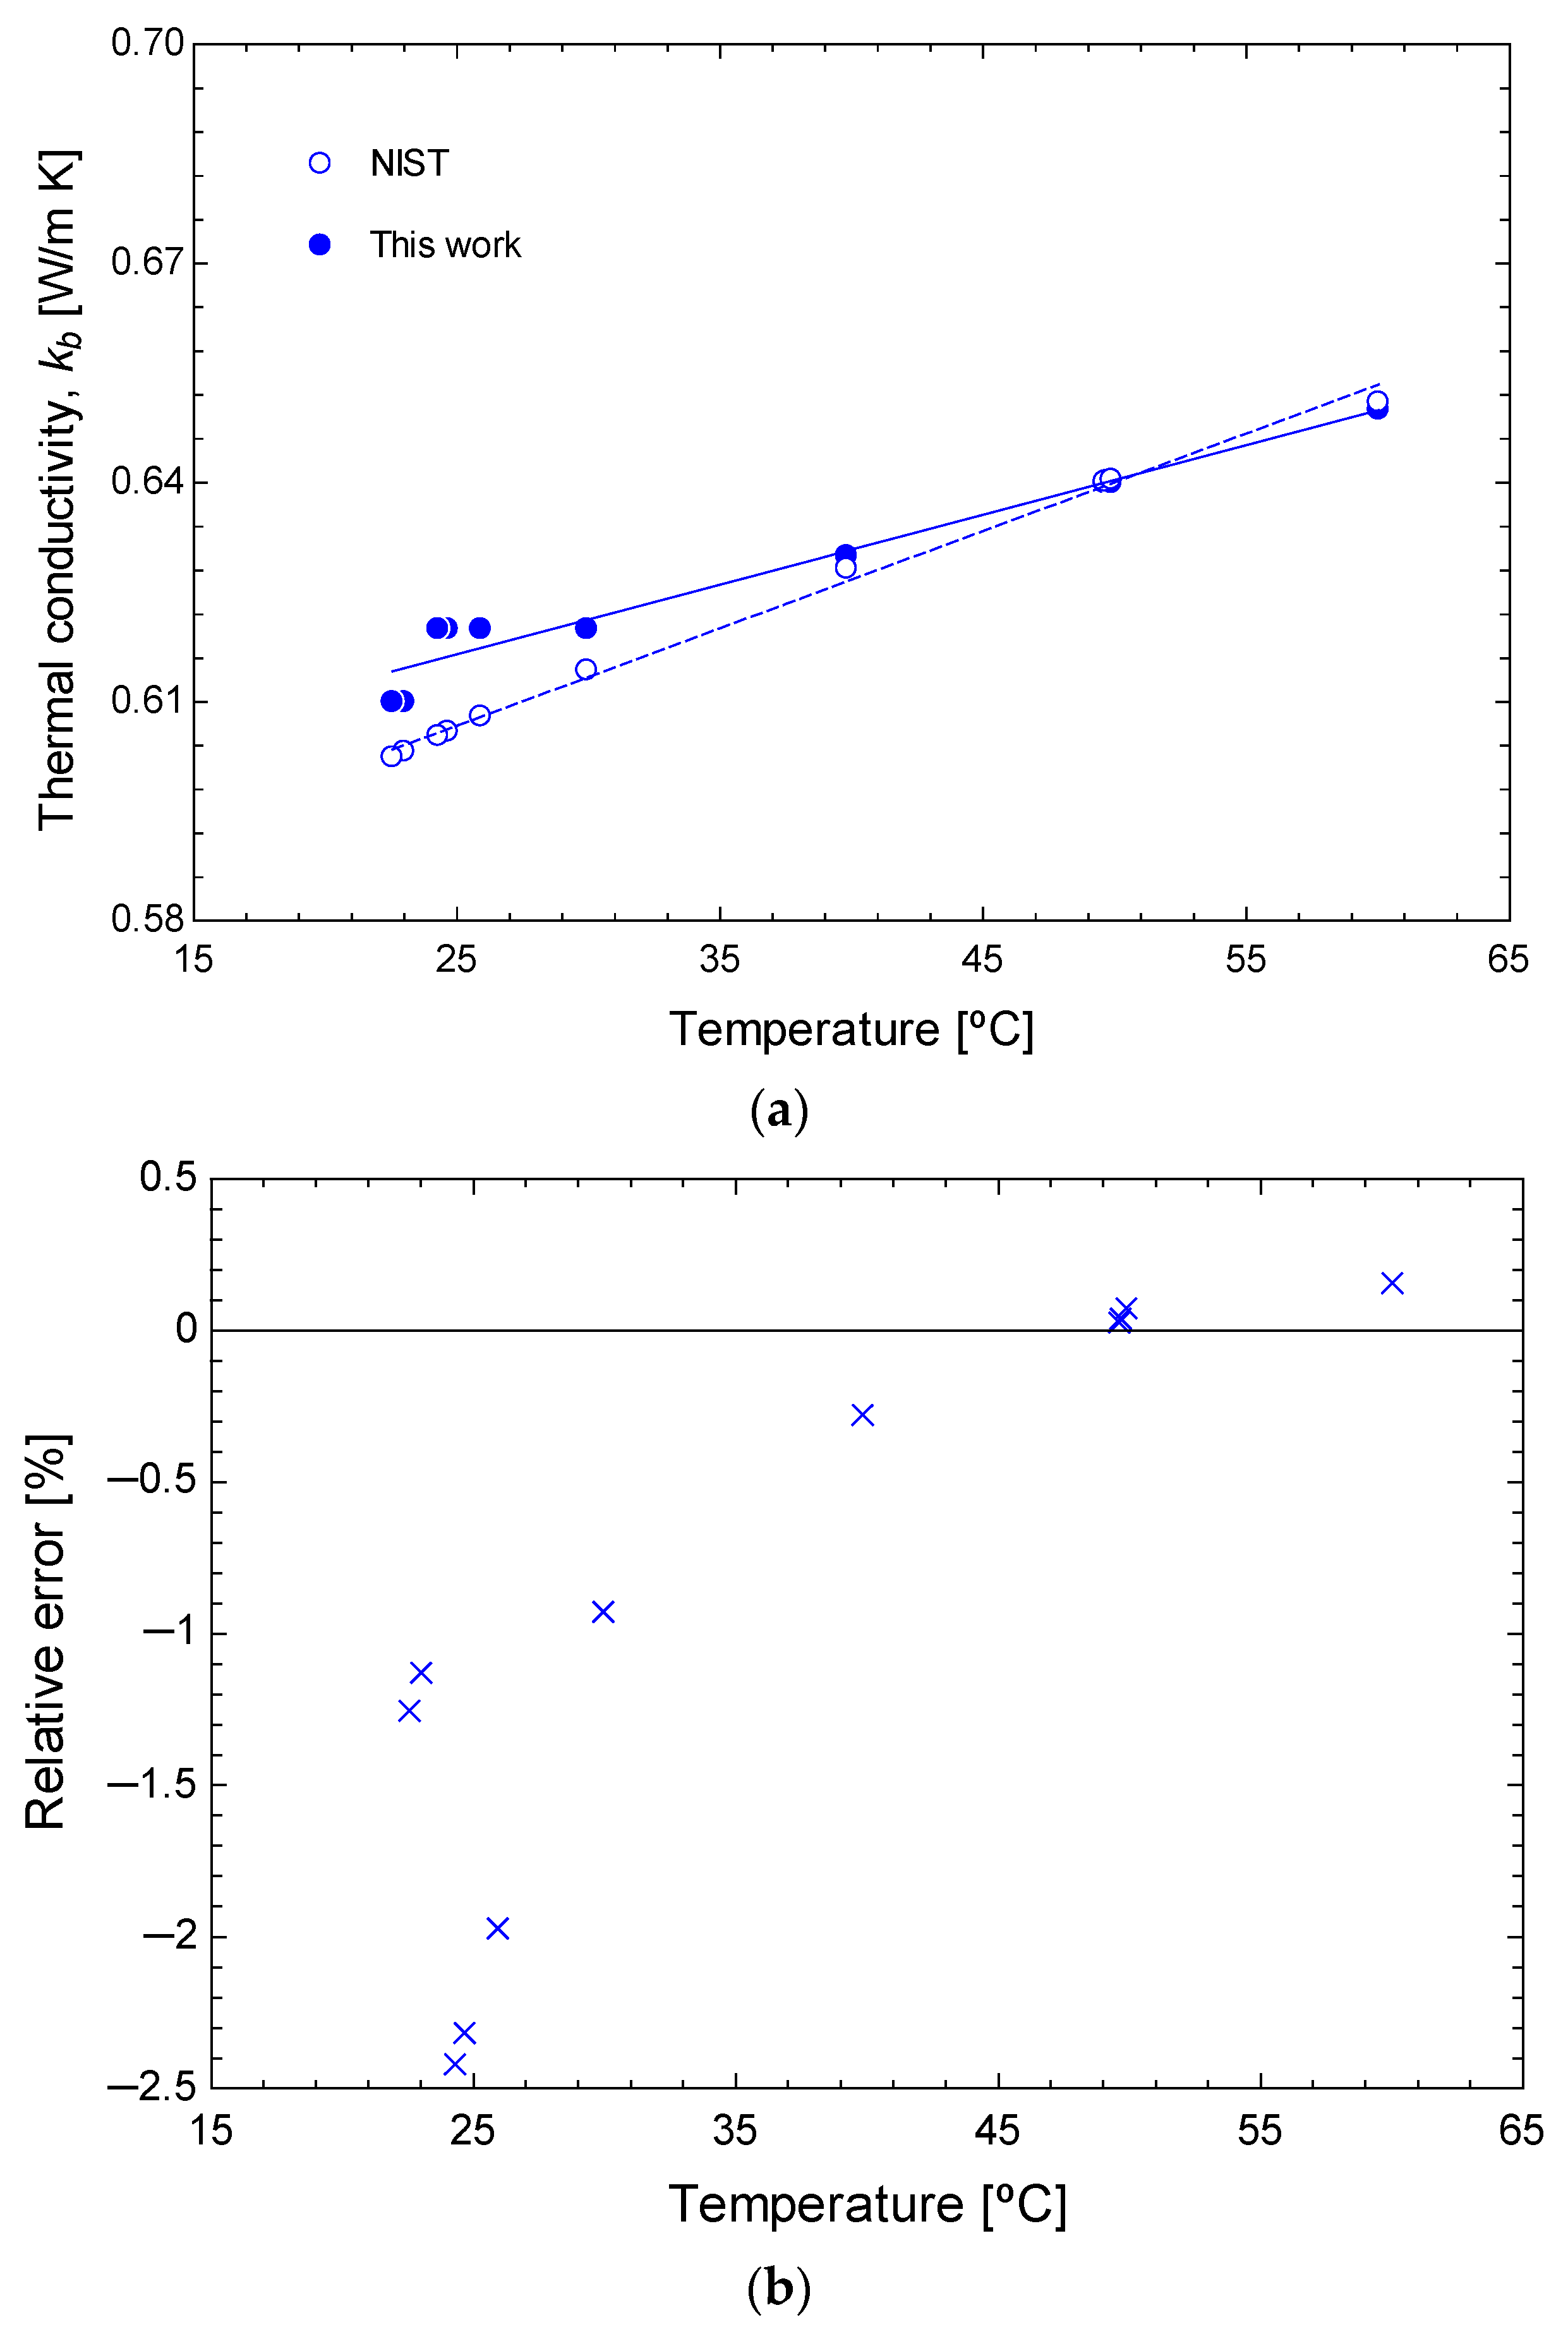
The technique of transient hot-wire was employed for determining the thermal conductivity of the aqueous theta-phase aluminum oxide nanofluids. This method has been broadly employed for determining the thermal conductivity of nanofluids. In this case, a Thermtest THW-L2 device (Hanwell, NB, Canada) (Figure 2) was used. The 60 mm length sensor wire was composed of platinum, which acts as a heating element. The sensor was introduced into the sample holder of a cylindrical shape (of 15 cm3 volume) that contains the nanofluid. For measuring thermal conductivity at different temperatures, the sample holder was submerged into a hot bath (Huber CC with Pilot One Heating circulation bath, Huber, Offenburg, Germany). The range and accuracy of the measured thermal conductivity and temperature are presented in Table 3.
Recently, ref. [24] have detected that, when metallic nanofluids (NiAl, Ag) are used, the thermal conductivity determined, employing the technique of transient hot-wire, is a strong function of the material used for manufacturing the container. However, it was not observed for oxide (Al2O3) nanofluids. Therefore, it is expected that the sample holder used in the current work does not influence the measurements.
Each measurement of thermal conductivity was repeated at least 4 times, and the average values are those provided in this work. Random uncertainties of measured data were calculated using a confidence interval of 95% and are included in the figures using error bars.

2.3. Calibration

Validation of thermal conductivity data for deionized water, measured using the Thermtest device, was performed, comparing the experimental data with those reported by NIST [38]. In Figure 3, the experimental values and data retrieved from NIST are reported. A good agreement is obtained, with a maximum deviation equal to 2.4% (lower than the accuracy given by the Thermtest manufacturer, Hanwell, NB, Canada). As it is observed in Figure 3b, the error reduces as the fluid temperature increases. The range of temperatures tested is the same as the one used to measure the thermal conductivity of the alumina-water nanofluid.

3. Results and Discussion

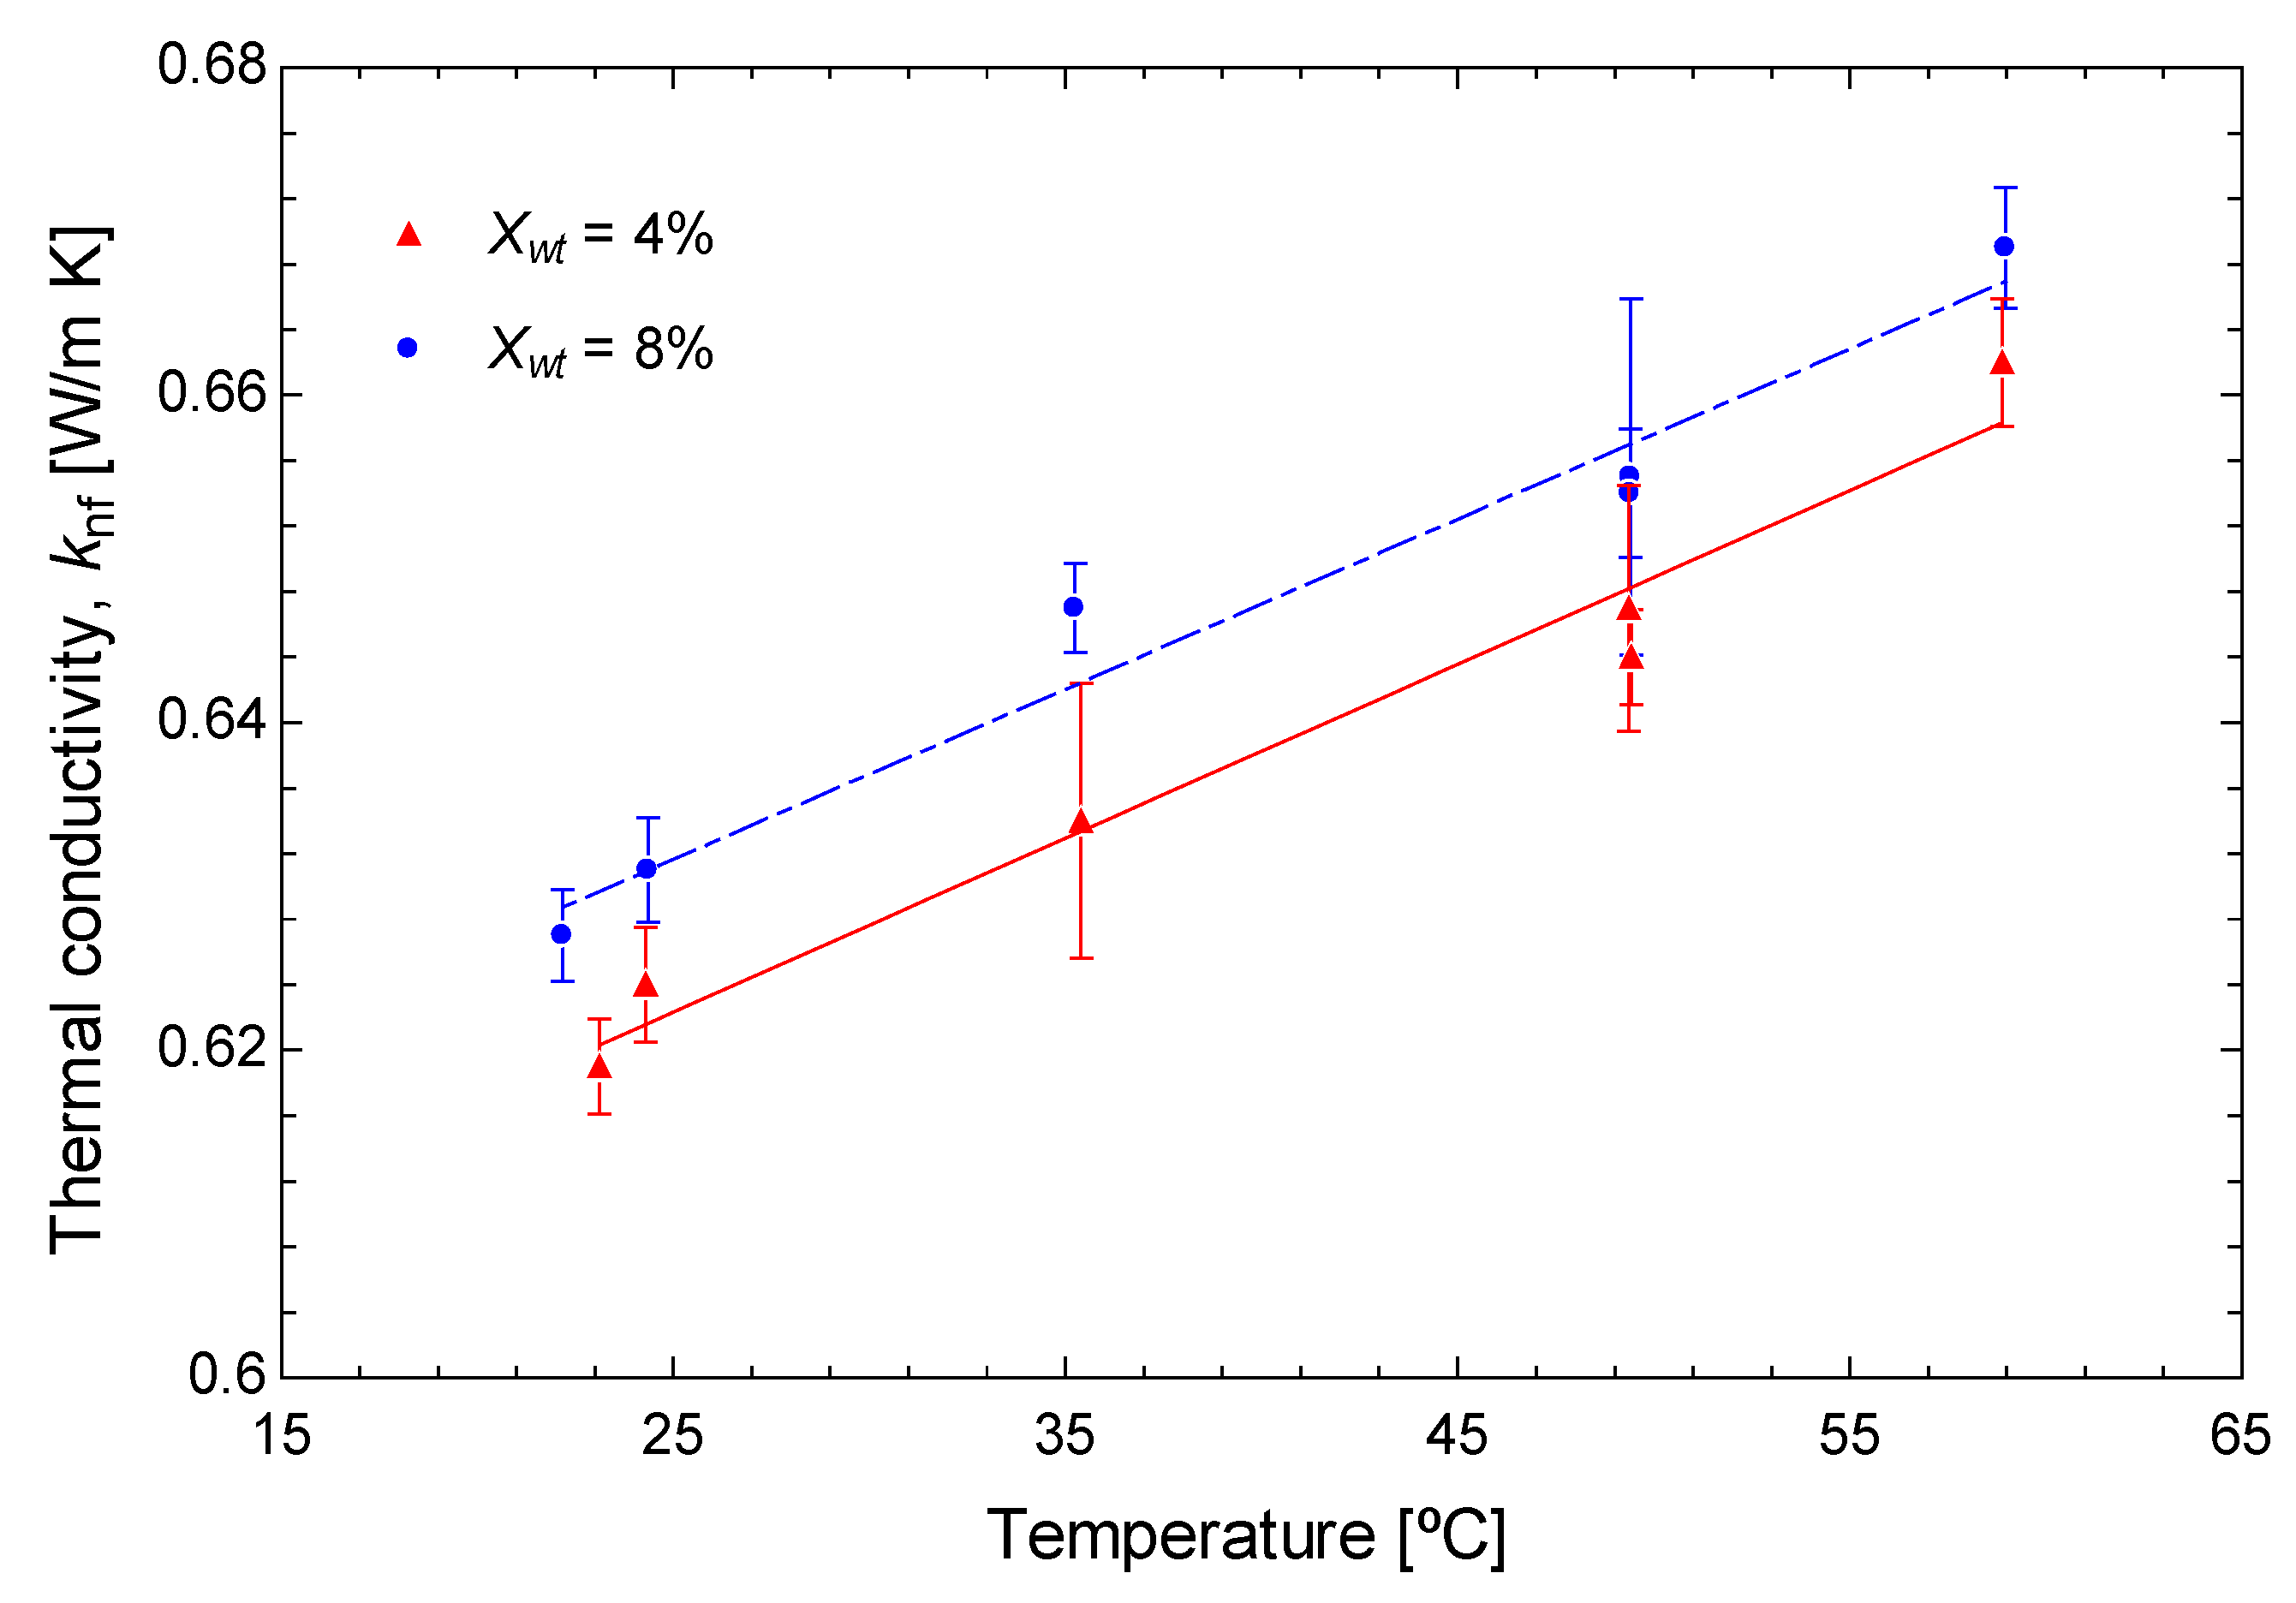
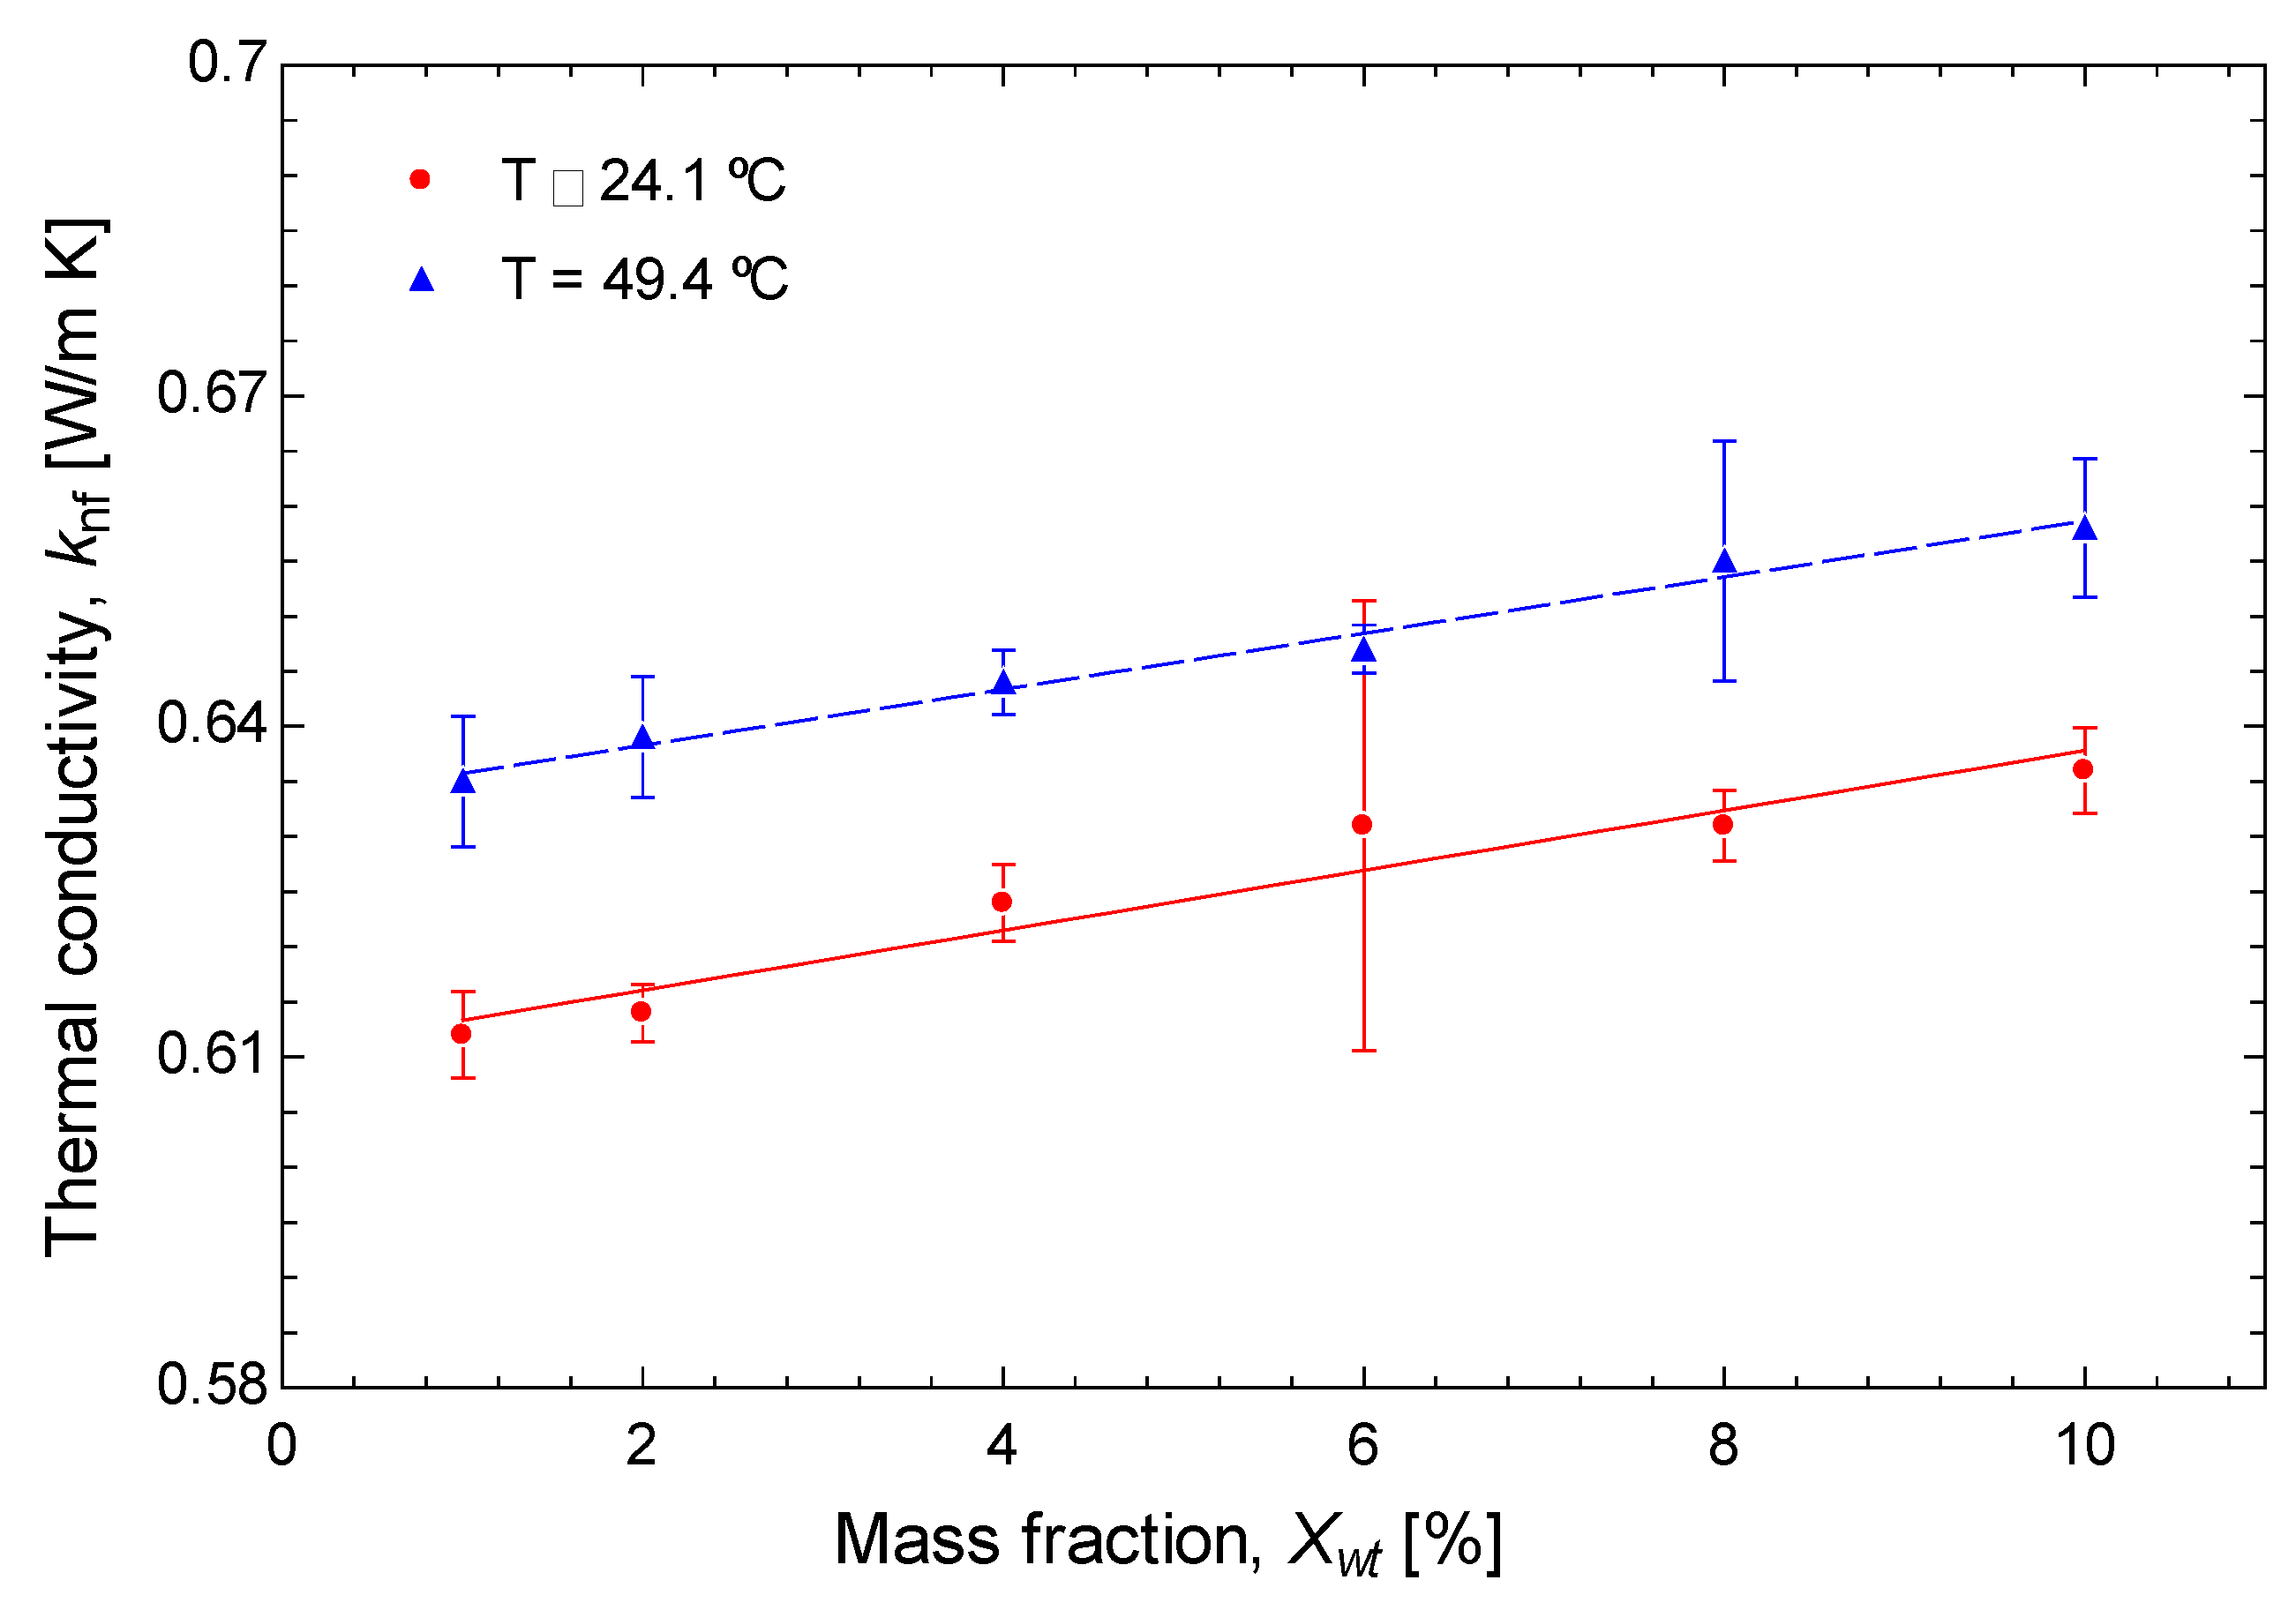
3.1. Experimental Results

Figure 4 shows the thermal conductivity of the nanofluid containing 4 and 8 wt% of nanoparticles for several temperatures and three sonication times (ST): 1.5, 4, and 16.5 h. From Figure 4, it can be observed that a higher nanofluid temperature is associated with a higher thermal conductivity and the temperature dependence can be approximated as linear. A good agreement with the linear fit is obtained for both nanoparticle concentrations. Moreover, both straight lines are nearly parallel, indicating that the temperature influence on the thermal conductivity is the same; so, it is independent of the nanoparticle concentration. In these experiments, the improvement obtained in the thermal conductivity is about a 0.001 W/m·K per °C increase.
In the experimental tests performed in this research, the increment in the sonication time had no appreciable effect on the thermal conductivity. Similar results were obtained by [28,30] using other types of nanoparticles. Table 4 contains the average values for the temperature and thermal conductivity obtained at different sonication times and the corresponding standard deviations. The statistical analysis of data modifying the sonication times shows that the changes are not statistically significant. Standard deviations are negligible in comparison with the thermal conductivity values.
The impact of the nanoparticle concentration on the nanofluid thermal conductivity, for two different temperatures (around 24.1 and 49.4 °C), is presented in Figure 5. Data shown correspond to a sonication time of 1.5 h. As reported in previous studies, thermal conductivity enhances as the concentration of nanoparticles rises. In this case, the improvement obtained in the thermal conductivity is about 0.0027 W/m·K per unit of wt% increase.
Thermal conductivity results obtained in the current research for the aqueous theta-phase aluminum oxide nanofluids are compared with the results available in the open literature for other water-based aluminum oxide nanofluids. The comparison is shown in Figure 6, representing the effect of the nanoparticle volume concentration. For the conversion from wt% to vol%, the density of the nanoparticles considered was 3970 kg/m3, according to [39], and the following formula was applied:
1 X v = 1 + ρ n p ρ b 1 X w t X w t
where Xwt and Xv are the mass and volume fraction, respectively. ρ b and ρ n p are the base fluid and nanoparticles density. The base fluid density, at different temperatures, was computed using EES [40].
Figure 6 presents the thermal conductivity variation of the studied nanofluid with respect to the nanoparticle volume fraction for two temperature ranges. In Figure 6a, the range from 23 to 32 °C is used, while, in Figure 6b, temperature varies between 47 and 52 °C. Taking into account the demonstrated temperature influence on thermal conductivity, data from the literature were retrieved by selecting temperatures as close as possible to the present experimental values.
In addition to these criteria, the closest possible nanoparticle sizes were chosen. In this case, nanoparticles sizes from the literature were in the range from 10 to 20 nm, while 15 nm were used in the present research. As the literature demonstrates, for example [25], a strong effect of particle size reduction on the enhancement of the thermal conductivity of alumina-water nanofluid was observed. This can be related to the higher specific surface obtained using smaller size nanoparticles, as shown by [35].
From Figure 6, it can be observed that a high dispersion of thermal conductivity data exists, evenly using the same nanoparticle volume fraction and close temperatures and nanoparticle sizes. For both temperatures evaluated, thermal conductivities obtained in the present experimental work are near to the results reported by [14,21,32]. The volume fraction dependence of thermal conductivity seems to be approximately similar in these cases. Observing the summary presented in Table 1, it can be seen that the phase of the nanoparticle used in these studies was not specified. The rest of the studies shown in Figure 6 report a much higher increase in thermal conductivity with the nanoparticle volume fraction. In particular, purple and red curves [24,26] show larger slopes. This performance could be associated with the nanoparticle phase used in these experiments, corresponding to the gamma-phase, as shown in Table 1. In the rest of the experiments shown in the figure, the phase was not specified.
The linear trend of curves in Figure 6 indicates a direct relationship between nanoparticle concentration and nanofluid thermal conductivity. This performance is valid when the type of nanoparticle and the nanofluid temperature remain constant and, also, when a good dispersion of nanoparticles occurs in the base fluid. In other conditions, the dependence between concentration and thermal conductivity is modified.

3.2. Empirical Correlation

Up to now, it has been shown that the thermal conductivity of the aqueous theta-phase aluminum oxide nanofluids depends on the temperature and nanoparticle concentration, while the effect of sonication time is negligible. In order to use these results for possible industrial or research applications, a predictive correlation is considered a useful tool. With this objective, the thermal conductivity ratio defined in Equation (3) is used as follows:
k r = k n f k b
In previous studies [17,23,27,41], correlations including the nanoparticle volume fraction, Xv, have been presented. In addition to these, some correlations also include the temperature, T [19,25]. These correlations are shown in Table 5, which also includes the size and volume fraction of the nanoparticles and the temperature used in the experiments to derive each correlation. It can be observed that many of the empirical correlations use a single value for the temperature, while the maximum temperature is limited to 50 °C [25]. In addition to this, only two correlations use small nanoparticle sizes (10 and 13 nm, in [25,41], respectively).
Thermal conductivity experimental data obtained in this work for the alumina-water nanofluid have been compared with those predicted by the empirical correlations shown in Table 5. The relative errors between predicted and experimental data are shown in Table 6. Very large deviations are obtained between predicted and experimental values, with the best agreement obtained using the correlation of [27], even though this correlation was developed for a different nanoparticle size and a very small temperature range.
In this work, by means of statistical analysis of multiple linear correlation, using the specialized Engineering Equation Solver software (Professional version V10.612-3D), the correlation presented in Equation (4) for the thermal conductivity as a function of the nanoparticle mass fraction, Xwt, and the temperature, T, has been obtained as follows:
k n f = a + b X w t T + i = 1 2 c i X w t i + d i T i
The validity ranges of the variables used in this equation are as follows: 1% < Xwt < 10% and 22.1 °C < T < 59.3 °C. The numerical values of the constants that appear in Equation (4) are shown in Table 7. This correlation is characterized by a goodness of fit parameter R2 = 94%.
The comparison presented in Figure 7 shows experimental values of the ratio between thermal conductivities, kr, and values predicted using Equation (4). An excellent agreement between predicted and experimental data can be seen, with a mean absolute percentage error of 0.55%. The new correlation significantly improves agreement with respect to previous empirical correlations, as shown in Table 6.
Taking into account the experimental conditions used in [14,21,32], where the alumina phase is not specified, the thermal conductivity of the alumina-water nanofluid is predicted using the empirical correlation obtained in the present work, Equation (4). Figure 8 shows a comparison between the values predicted and the experimental data obtained by the authors in [14,21,32]. Results show a very good agreement between predictions and experimental values, with a maximum relative error of 5.3% and a mean absolute percentage error of 2.9%, indicating that the new correlation can be used to obtain accurate predictions in other experimental conditions.

4. Conclusions

In this research, the thermal conductivity of aqueous theta-phase aluminum oxide nanofluids was measured for temperatures between 22.1 and 59.3 °C, mass fractions of nanoparticles from 1 to 10%, and using sonication times of 1.5, 4 and 16.5 h. The following conclusions have been derived from this research:
  • Thermal conductivity is improved by the temperature increase (0.001 W/m·K per °C increase) and nanoparticle concentration increment (0.0027 W/m·K per unit of wt% increase).
  • A high sonication time (16.5 h), not used before in the open literature, was tested. The increase in the sonication time in the range investigated (from 1.5 to 16.5 h) has a negligible effect on the enhancement of thermal conductivity.
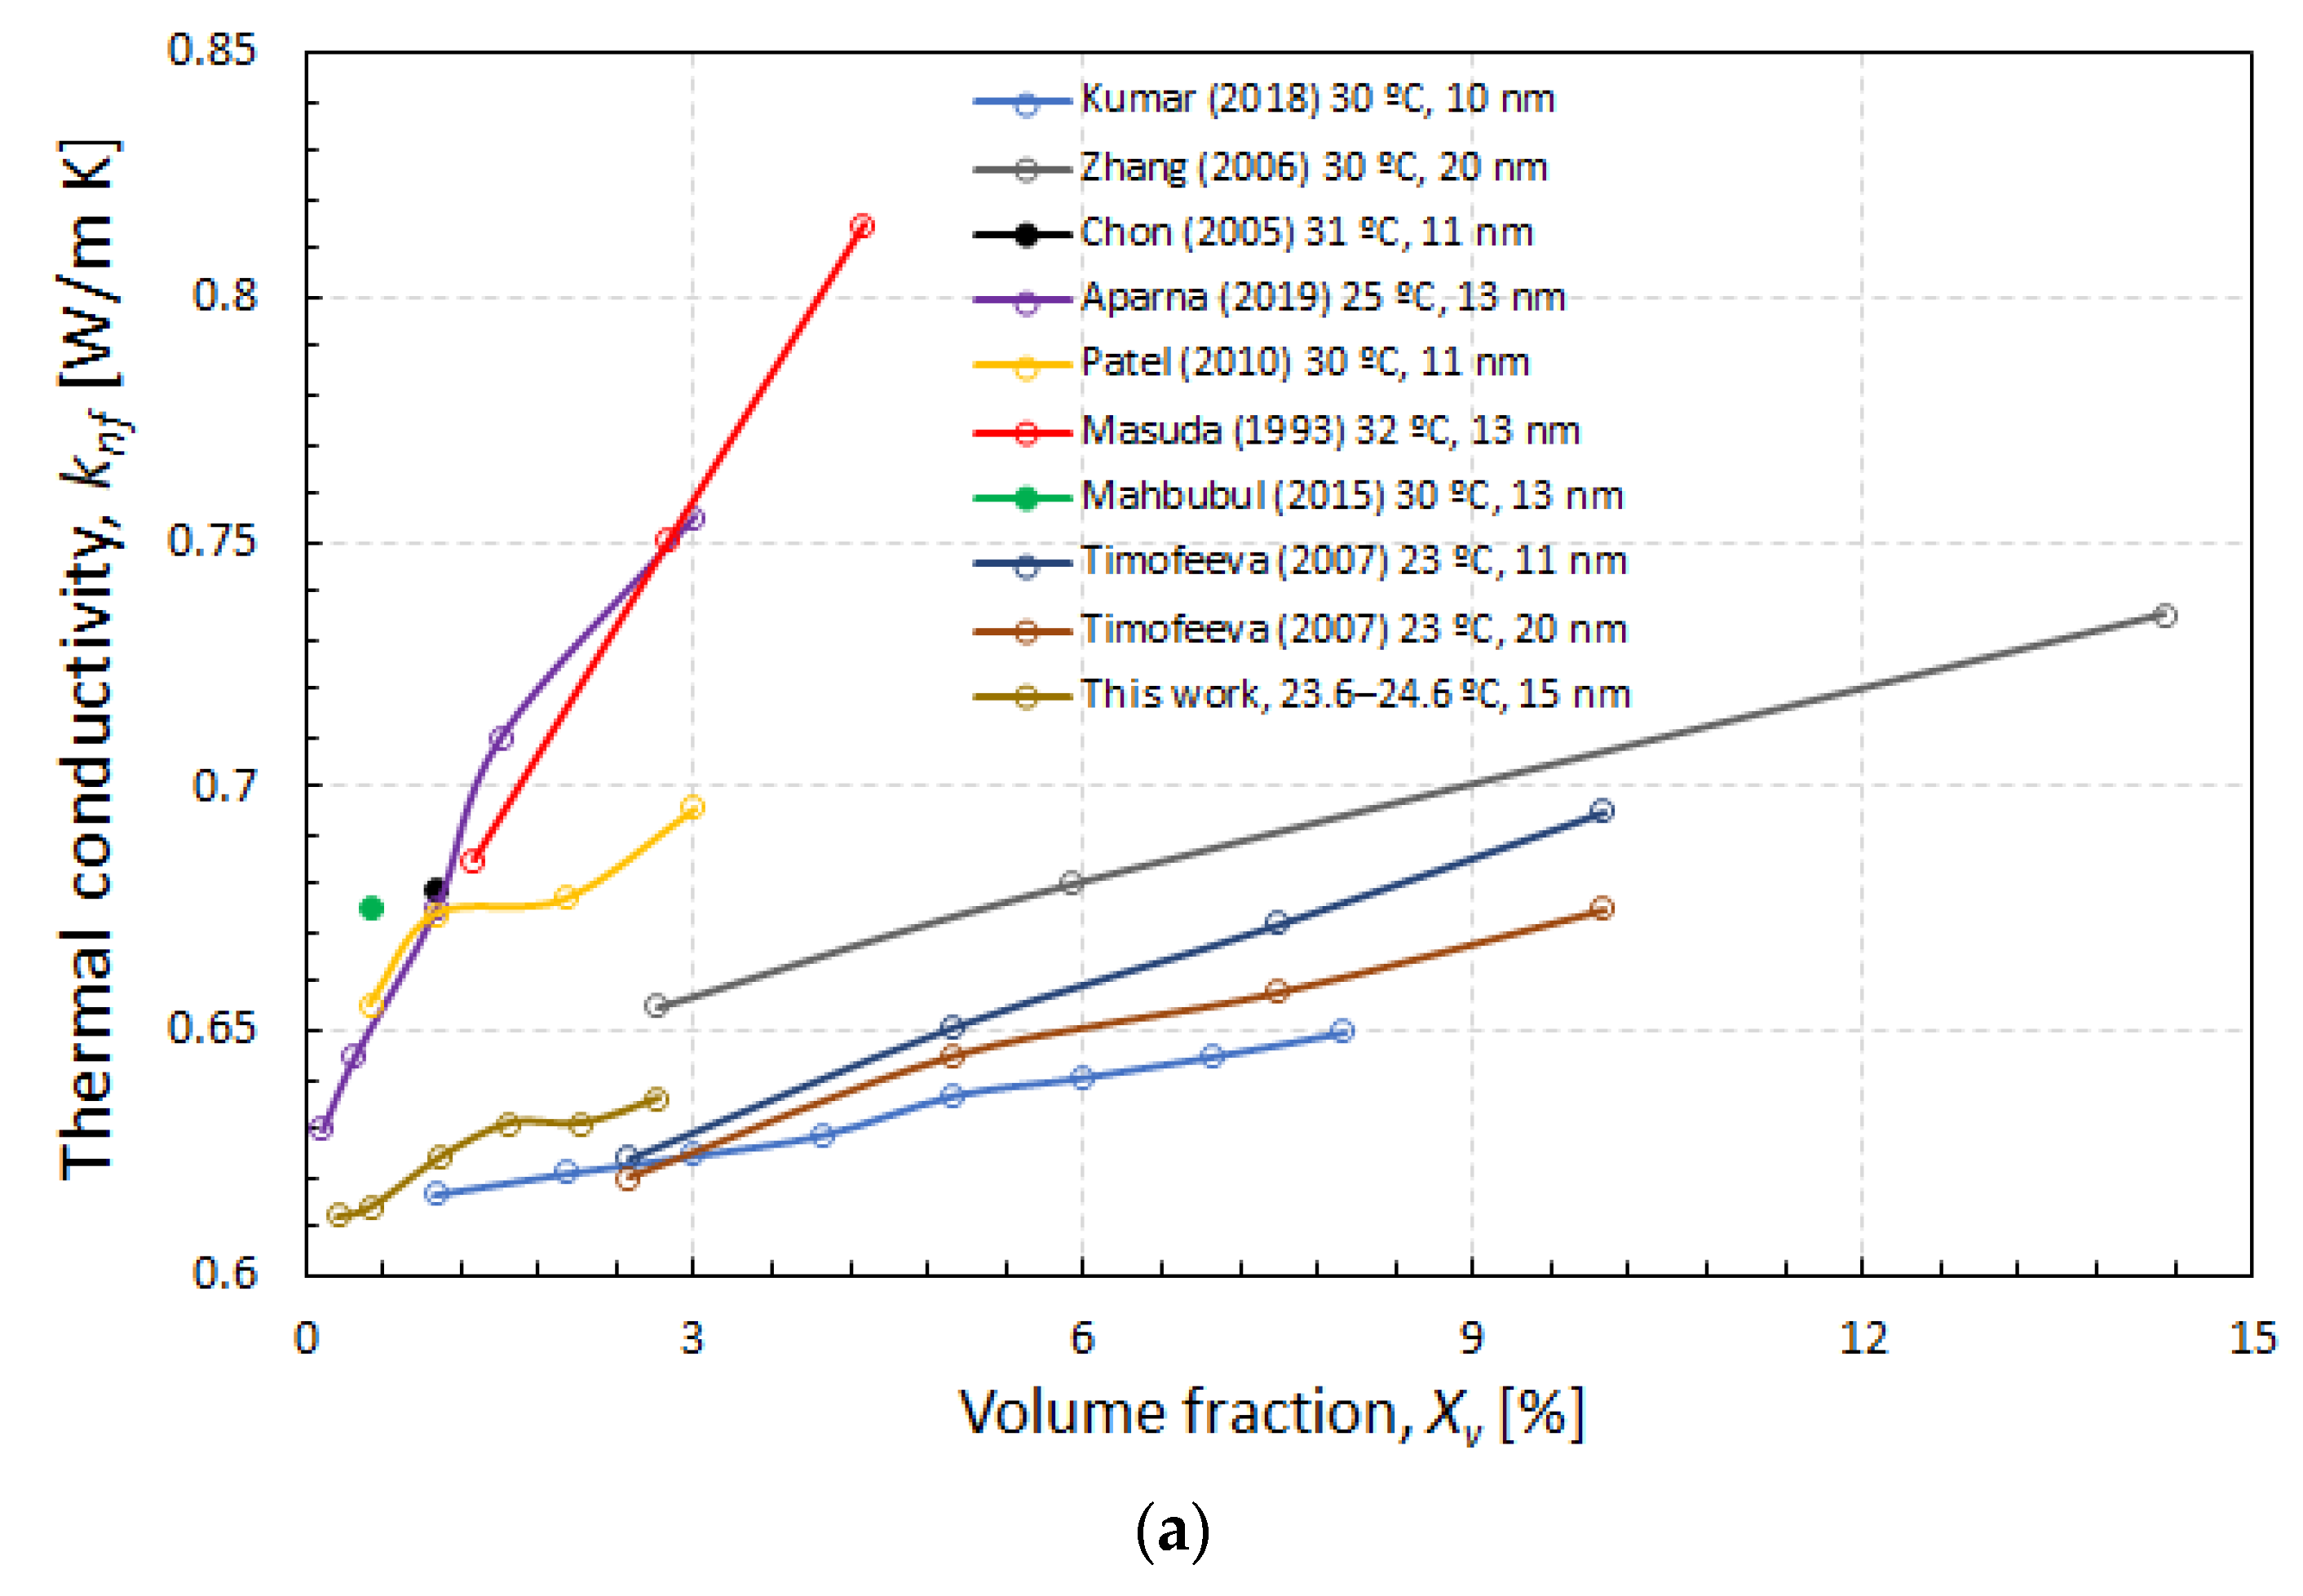
  • Comparing current experimental data with values taken from the literature, it can be concluded that a high dispersion of thermal conductivity data exists, evenly using the same nanoparticle volume fraction, close temperatures, and nanoparticle sizes. The volume fraction dependence of the thermal conductivity obtained in this work seems to be approximately similar to the one obtained in some of the previous reported data (three works). In the rest of cases (five works), a much higher increase in thermal conductivity with the nanoparticle volume fraction was obtained. Two of these last studies used gamma-phase nanoparticles, while, in the rest of investigations, the phase was not specified.
  • A new correlation has been derived for the thermal conductivity that provides an excellent agreement with respect to experimental data. This correlation can be used to accurately predict the thermal conductivity of the aqueous theta-phase aluminum oxide nanofluid. The correlation significantly improves predictions with respect to the empirical correlations available in the open literature.
  • Experimental data obtained and the correlation derived can be used to predict the performance of energy systems using theta-phase alumina-water nanofluids as working fluid.

Author Contributions

Conceptualization, M.V. and M.d.V.; methodology, M.V., M.d.V. and N.G.-H.; software, A.Z. and M.V.; validation, A.Z. and M.V.; formal analysis, A.Z., M.V., M.d.V. and N.G.-H.; investigation, A.Z., M.V., M.d.V. and N.G.-H.; resources, M.V., M.d.V. and N.G.-H.; data curation, A.Z. and M.V.; writing—original draft preparation, A.Z.; writing—review and editing, A.Z., M.V., M.d.V. and N.G.-H.; visualization, A.Z., M.d.V., N.G.-H. and M.V.; supervision, M.V. and M.d.V.; project administration, M.d.V. and M.V.; funding acquisition, M.V. and M.d.V. All authors have read and agreed to the published version of the manuscript.

Funding

This research was funded by FEDER/Ministerio de Ciencia, Innovación y Universidades–Agencia Estatal de Investigación/_Proyecto (DPI2017-83123-R). A. Zacarías acknowledges the research grant SIP20240435, by Instituto Politécnico Nacional of Mexico, and the scholarship 740638 granted by CONACYT.

Institutional Review Board Statement

Not applicable.

Informed Consent Statement

Not applicable.

Data Availability Statement

The data presented in this study are available on request from the corresponding author.

Conflicts of Interest

The authors declare no conflicts of interest.

References

  1. Chilambarasan, L.; Thangarasu, V.; Ramasamy, P. Solar flat plate collector’s heat transfer enhancement using grooved tube configuration with alumina nanofluids: Prediction of outcomes through artificial neural network modeling. Energy 2024, 289, 129953. [Google Scholar]
  2. Ram, S.; Yadav, S.K.; Kumar, A. Recent advancement of nanofluids in solar concentrating collectors: A brief review. Mater. Today Proc. 2023, 72, 2032–2038. [Google Scholar] [CrossRef]
  3. Lee, Y.; Jeong, H.; Park, J.T.; Delgado, A.; Kim, S. Experimental investigation on evaluation of thermal performance of solar heating system using Al2O3 nanofluid. Appl. Sci. 2020, 10, 5521. [Google Scholar] [CrossRef]
  4. Venegas, M.; García-Hernando, N.; Zacarías, A.; de Vega, M. Performance of a solar absorption cooling system using nanofluids and a membrane-based microchannel desorber. Appl. Sci. 2020, 10, 2761. [Google Scholar] [CrossRef]
  5. Hosseini, S.M.S.; Dehaj, M.S. An experimental study on energetic performance evaluation of a parabolic trough solar collector operating with Al2O3/water and GO/water nanofluids. Energy 2021, 234, 121317. [Google Scholar]
  6. Ali, A.M.; Angelino, M.; Rona, A. Physically consistent implementation of the mixture model for modelling nanofluid conjugate heat transfer in minichannel heat sinks. Appl. Sci. 2022, 12, 7011. [Google Scholar] [CrossRef]
  7. Hatami, M.; Mosayebidorcheh, S.; Jing, D. Thermal performance evaluation of alumina-water nanofluid in an inclined direct absorption solar collector (IDASC) using numerical method. J. Mol. Liq. 2017, 231, 632–639. [Google Scholar] [CrossRef]
  8. Ojeda, J.A.; Messina, S. Enhancing energy harvest in a constructal solar collector by using alumina-water as nanofluid. Sol. Energy 2017, 147, 381–389. [Google Scholar] [CrossRef]
  9. Eastman, J.A.; Phillpot, S.R.; Choi, S.U.S.; Keblinski, P. Thermal transport in nanofluids. Annu. Rev. Mater. Res. 2004, 34, 219–246. [Google Scholar] [CrossRef]
  10. Das, S.K.; Choi, S.U.S.; Patel, H.E. Heat transfer in nanofluids-A review. Heat Transf. Eng. 2006, 27, 3–19. [Google Scholar] [CrossRef]
  11. Akilu, S.; Sharma, K.V.; Baheta, A.T.; Mamat, R. A review of thermophysical properties of water based composite nanofluids. Renew. Sust. Energ. Rev. 2016, 66, 654–678. [Google Scholar] [CrossRef]
  12. Lee, S.; Choi, S.U.S.; Li, S.; Eastman, J.A. Measuring thermal conductivity of fluids containing oxide nanoparticles. J. Heat Transf. 1999, 121, 280–289. [Google Scholar] [CrossRef]
  13. Wang, X.; Xu, X. Thermal conductivity of nanoparticle-fluid mixture. J. Thermophys. Heat Transf. 1999, 13, 474–480. [Google Scholar] [CrossRef]
  14. Zhang, X.; Gu, H.; Fujii, M. Experimental study on the effective thermal conductivity and thermal diffusivity of nanofluids. Int. J. Thermophys. 2006, 27, 569–580. [Google Scholar] [CrossRef]
  15. Chandrasekar, M.; Suresh, S.; Chandra Bose, A. Experimental investigations and theoretical determination of thermal conductivity and viscosity of Al2O3/water nanofluid. Exp. Therm. Fluid Sci. 2010, 34, 210–216. [Google Scholar] [CrossRef]
  16. Kim, S.H.; Choi, S.R.; Kim, D. Thermal conductivity of metal-oxide nanofluids: Particle size dependence and effect of laser irradiation. J. Heat Transf. 2007, 129, 298–307. [Google Scholar] [CrossRef]
  17. Ho, C.J.; Liu, W.K.; Chang, Y.S.; Lin, C.C. Natural convection heat transfer of alumina-water nanofluid in vertical square enclosures: An experimental study. Int. J. Therm. Sci. 2010, 49, 1345–1353. [Google Scholar] [CrossRef]
  18. Chon, C.H.; Kihm, K.D.; Lee, S.P.; Choi, S.U. Empirical correlation finding the role of temperature and particle size for nanofluid (Al2O3) thermal conductivity enhancement. Appl. Phys. Lett. 2005, 87, 153107. [Google Scholar] [CrossRef]
  19. Li, C.H.; Peterson, G.P. Experimental investigation of temperature and volume fraction variations on the effective thermal conductivity of nanoparticle suspensions (nanofluids). J. Appl. Phys. 2006, 99, 141–148. [Google Scholar] [CrossRef]
  20. Murshed, S.M.S.; Leong, K.C.; Yang, C. Investigations of thermal conductivity and viscosity of nanofluids. Int. J. Therm. Sci. 2008, 47, 560–568. [Google Scholar] [CrossRef]
  21. Kumar, N.; Sonawane, S.S.; Sonawane, S.H. Experimental study of thermal conductivity, heat transfer and friction factor of Al2O3 based nanofluid. Int. Commun. Heat Mass Transf. 2018, 90, 1–10. [Google Scholar] [CrossRef]
  22. Das, S.K.; Putra, N.; Thiesen, P.; Roetzel, W. Temperature dependence of thermal conductivity enhancement for nanofluids. J. Heat Transf. 2003, 125, 567–574. [Google Scholar] [CrossRef]
  23. Moldoveanu, G.M.; Huminic, G.; Minea, A.A.; Huminic, A. Experimental study on thermal conductivity of stabilized Al2O3 and SiO2 nanofluids and their hybrid. Int. J. Heat Mass Transf. 2018, 127, 450–457. [Google Scholar] [CrossRef]
  24. Aparna, Z.; Monisha, M.; Pabi, S.K.; Ghosh, S. Thermal conductivity of aqueous Al2O3/Ag hybrid nanofluid at different temperatures and volume concentrations: An experimental investigation and development of new correlation function. Powder Technol. 2019, 343, 714–722. [Google Scholar] [CrossRef]
  25. Patel, H.E.; Sundararajan, T.; Das, S.K. An experimental investigation into the thermal conductivity enhancement in oxide and metallic nanofluids. J. Nanopart. Res. 2010, 12, 1015–1031. [Google Scholar] [CrossRef]
  26. Masuda, H.; Ebata, A.; Teramae, K.; Hishinuma, N. Alteration of thermal conductivity and viscosity of liquid by dispersing ultra-fine particles. Netsu Bussei 1993, 7, 227–233. [Google Scholar] [CrossRef]
  27. Mintsa, H.A.; Roy, G.; Nguyen, C.T.; Doucet, D. New temperature dependent thermal conductivity data for water-based nanofluids. Int. J. Therm. Sci. 2009, 48, 363–371. [Google Scholar] [CrossRef]
  28. Sadeghi, R.; Etemad, S.G.; Keshavarzi, E.; Haghshenasfard, M. Investigation of alumina nanofluid stability by UV–vis spectrum. Microfluids Nanofluids 2015, 18, 1023–1030. [Google Scholar] [CrossRef]
  29. Mahbubul, I.M.; Shahrul, I.M.; Khaleduzzaman, S.S.; Saidur, R.; Amalina, M.A.; Turgut, A. Experimental investigation on effect of ultrasonication duration on colloidal dispersion and thermophysical properties of alumina–water nanofluid. Int. J. Heat Mass Transf. 2015, 88, 73–81. [Google Scholar] [CrossRef]
  30. Buonomo, B.; Manca, O.; Marinelli, L.; Nardini, S. Effect of temperature and sonication time on nanofluid thermal conductivity measurements by nano-flash method. Appl. Therm. Eng. 2015, 91, 181–190. [Google Scholar] [CrossRef]
  31. Das, P.K.; Islam, M.; Santra, A.K.; Ganguly, R. Experimental investigation of thermophysical properties of Al2O3–water nanofluid: Role of surfactants. J. Mol. Liq. 2017, 237, 304–312. [Google Scholar] [CrossRef]
  32. Timofeeva, E.V.; Gavrilov, A.N.; Mc Closkey, J.M.; Tolmachev, Y.V.; Sprunt, S.; Lopatina, L.M.; Selinger, J.V. Thermal conductivity and particle agglomeration in alumina nanofluids: Experiment and theory. Phys. Rev. E 2007, 76, 061203. [Google Scholar] [CrossRef] [PubMed]
  33. Asadi, A.; Pourfattah, F.; Szilágyi, I.M.; Afrand, M.; Żyła, G.; Ahn, H.S.; Wongwises, S.; Nguyen, H.M.; Arabkoohsar, A.; Mahian, O. Effect of sonication characteristics on stability, thermophysical properties, and heat transfer of nanofluids: A comprehensive review. Ultrason. Sonochem. 2019, 58, 104701. [Google Scholar] [CrossRef] [PubMed]
  34. Jbara, A.S.; Othaman, Z.; Ati, A.A.; Saeed, M.A. Characterization of γ-Al2O3 nanopowders synthesized by co-precipitation method. Mater. Chem. Phys. 2017, 188, 24–29. [Google Scholar] [CrossRef]
  35. PlasmaChem. Nanomaterials and Related Products. Catalogue & Price-List, PlasmaChem Surface and Nanotechnology, 3rd ed.; PlasmaChem GmbH: Berlin, Germany, 2018. [Google Scholar]
  36. Yakovlev, I.V.; Volodin, A.M.; Zaikovskii, V.I.; Stoyanovskii, V.O.; Lapina, O.B.; Vedyagin, A.A. Stabilizing effect of the carbon shell on phase transformation of the anocrystalline alumina particles. Ceram. Int. 2018, 44, 4801–4806. [Google Scholar] [CrossRef]
  37. Vainer, B.G.; Volodin, A.M.; Shepelin, A.V. Hydration-induced thermal behavior of crystalline and amorphous dispersed alumina. Thermochim. Acta 2021, 706, 179066. [Google Scholar] [CrossRef]
  38. Lemmon, E.W.; Huber, M.L.; Mc Linden, M.O. NIST Standard Reference Database 23, Reference Fluid Thermodynamic and Transport Properties (REFPROP), version 9.0; National Institute of Standards and Technology: Gaithersburg, MD, USA, 2010. [Google Scholar]
  39. Dawood, H.K.; Mohammed, H.A.; Sidik, N.A.C.; Munisamy, K.M. Numerical investigation on heat transfer and friction factor characteristics of laminar and turbulent flow in an elliptic annulus utilizing nanofluid. Int. Commun. Heat Mass Transf. 2015, 66, 148–157. [Google Scholar] [CrossRef]
  40. Klein, S.A. Engineering Equation Solver © 1992–2019, Professional V10.612-3D (2019/03/06). License #5491. F-Chart Software: Madison, WI, USA, 2019.
  41. Buongiorno, J. Convective transport in nanofluids. J. Heat Transf. 2006, 128, 240–250. [Google Scholar] [CrossRef]
Figure 1. Procedure used for nanofluid preparation.
Applsci 14 03225 g001
Figure 2. Layout of the experimental setup.
Applsci 14 03225 g002
Figure 3. (a) Experimental thermal conductivity of the base fluid compared with data from NIST. (b) Deviation of experimental with respect to NIST data.
Applsci 14 03225 g003
Figure 4. Thermal conductivity as a function of temperature for two mass fractions of nanoparticles.
Applsci 14 03225 g004
Figure 5. Thermal conductivity vs. nanoparticles wt% for two temperatures, ST = 1.5 h.
Applsci 14 03225 g005
Figure 6. Thermal conductivity vs. nanoparticle volume fraction at different temperatures [14,18,21,24,25,26,29,32]. (a) Temperatures between 23 and 32 °C. (b) Temperatures between 47 and 52 °C.
Applsci 14 03225 g006aApplsci 14 03225 g006b
Figure 7. Predicted vs. experimental thermal conductivity ratio of the aqueous theta-phase aluminum oxide nanofluid.
Applsci 14 03225 g007
Figure 8. Predicted vs. experimental thermal conductivity of the aluminum oxide-water nanofluid [14,21,32].
Applsci 14 03225 g008
Table 1. Summary of research on thermal conductivity of Al2O3-water nanofluids. THW: transient hot-wire, SS: steady-state, TO: temperature oscillation, NF: nano-flash.
ReferencePhaseSize (nm)Fraction (%)Temperature (°C)Method
[12]n/a38.40–4.3 volRoom temperatureTHW
[13]γ282.4–5.5 vol24SS
[14]n/a200–40 wt10–50THW
[15]n/a430–3 volRoom temperatureTHW
[16]n/a380.3–3 voln/aTHW
[17]n/a330–4 vol5–40THW
[18]n/a11, 47, 1501–4 vol21–71THW
[19]n/a362–10 vol27.2–35.7SS
[20]n/a80, 1501 vol20–60THW
[21]n/a101–8 vol30–50THW
[22]n/a38.40–4 vol21–51TO
[23]n/a431–3 vol20–50THW
[24]γ130.1–3 vol25–52THW
[25]n/a11, 45, 1500–3 vol20–50THW, TO
[26]γ131.2–4.3 vol32–67THW
[27]n/a36, 470–18 vol20–48THW
[28]γ252–3 vol15–45THW
[29]n/a130.5 vol10–50THW
[30]n/a400.1–20 vol25–65NF
[31]n/a~500.1–2 vol20–60THW
[32]n/a11, 20, 400–10 vol23THW
Table 2. Data of the chemical used in this research.
ComponentCAS Reg. No.SupplierPurityPurification Method
Alumina1344-28-1PlasmaChem GmbH
(Berlin, Germany)
>99.8%Ignition
Table 3. Range and accuracy of the measured thermal conductivity and temperature.
VariableRangeAccuracy
Thermal conductivity, k (W/m K)0.01–2±5%
Temperature, T (°C)−50–100±5%
Table 4. Standard deviation (SD) of measurements corresponding to different sonication times.
Nanoparticle Mass Fraction (%)Temperature (°C)Thermal Conductivity (W/m K)
AverageSDAverageSD
223.500.400.6150.003
249.380.080.6430.007
423.70.620.6220.004
449.390.080.6450.005
649.410.080.6510.007
823.271.140.6290.003
849.410.080.6550.007
1023.371.310.6340.004
1049.430.070.6590.004
Table 5. Summary of empirical correlations for the thermal conductivity ratio of Al2O3-water nanofluid. Xv in percentage.
ReferenceCorrelationParticle Size (nm)Fraction, Xv (vol%)Temperature (°C)
[17] 1 + 2.944 X v / 100 + 19.672 X v / 100 2 331–426
[19] 0.537852825 + 0.764481464 X v / 100 + 0.018688867 T 362–1027.2–35.7
[23] 1.0112 + 0.0454 X v 431–325
[25] 1 + 0.135 k p / k b 0.273 X v 0.467
T / 20 0.547 100 / d p 0.234
10–1500.1–320–50
[27] 1 + 1.72 X v / 100 36, 470–1821–23
[41] 1 + 7.47 X v / 100 131.34–4.3327
Table 6. Relative error between empirical correlations in Table 5 and current experimental data.
ReferenceRelative Error (%)
Average of Absolute ValuesRange
[17]21.71.8–45
[19]31.4−3.5–65.8
[23]23.64.3–42.5
[25]20.27–32.2
[27]7.00.4–14
[41]38.76.1–69.9
Table 7. Constants in Equation (4).
icd
12.72 × 10−35.54 × 10−4
24.80 × 10−67.20 × 10−6
a = 5.94 × 10⁻¹b = −8.28 × 10⁻⁶
Disclaimer/Publisher’s Note: The statements, opinions and data contained in all publications are solely those of the individual author(s) and contributor(s) and not of MDPI and/or the editor(s). MDPI and/or the editor(s) disclaim responsibility for any injury to people or property resulting from any ideas, methods, instructions or products referred to in the content.

