Abstract
In the context of rapid product iteration, design conflicts arise from discrepancies in designers’ understanding of user needs, influenced by subjective preferences, behavioural stances, and other factors. This paper proposes a product conceptual design approach based on the design conflict perspective. First, user comments and design documents are collected. Natural language processing (NLP) methods, including cleaning, filtering, lexical segmentation, feature clustering, and sentiment analysis, are employed to identify design themes. The intuitionistic fuzzy sets (IFSs) and term frequency–inverse document frequency (TF-IDF) algorithms are then utilized to obtain evaluation matrices for the products from both users and designers. Subsequently, design conflicts between users and designers are calculated, and an optimal configuration for product conceptual design is determined through regression analysis and planning methods. Finally, the proposed method is validated using a mobile phone as a product example, and suggestions for product improvement are presented. The results indicate that considering design conflicts as a factor in product design and synthesizing designer and user product concepts enhance the accuracy and reliability of product conceptual design generation. The findings of this study offer new insights into the conceptual design configuration for product iteration.
1. Introduction
With the development of the Internet era, customer demands are increasingly inclined towards personalization and diversification, and product requirements exhibit characteristics of small batches, multiple specifications, and personalization [1]. To meet the personalized needs of users, the product design pattern of enterprises has shifted from the traditional closed design to an open design [2]. The conceptual design phase in product design aims to transform user requirements into achievable product functionalities and build the overall framework of the product, playing a crucial role in product development, where approximately 70% to 80% of the product lifecycle cost is influenced by conceptual design [3,4,5]. Given the intricacies of product design, customers’ anticipated performance expectations introduce a multifaceted demand preference into the scheme. Precisely evaluating these schemes constitutes a crucial aspect of the conceptual scheme (CS) [6,7].
The essence of the conceptual decision-making process is a user-centric, multi-objective balancing problem [8,9]. Due to the differing perspectives of designers and users, conflicts inevitably arise in conceptual design scheme generation. Effectively quantifying and resolving these conflicts not only aids businesses in enhancing product performance but also positions them advantageously in the competitive product market. Subsequently, many scholars have approached conceptual scheme design with designers as the primary focus, particularly in the realm of large-scale equipment design [10,11]. Several scholars have emphasized user-centric requirements analysis to construct design schemes for reference [12,13]. However, there is relatively limited research that concurrently considers the perspectives of both designers and users.
Currently, a significant factor in transitioning products from original designs to iterative designs is the inability of designer-created products to match user demands effectively, leading to many conflicts throughout the product lifecycle. These conflicts encompass not only objective design conflicts related to physical and technical aspects but also subjective design conflicts arising from values and design philosophies [14]. In the context of rapidly iterating products, identifying and reasonably resolving conflicts are crucial problems that need urgent solutions in the product design process [15].
The theoretical framework and system for product design conflicts are not sufficiently comprehensive, with relevant research mainly existing in technological innovation theory [16,17], computer-supported collaboration [18,19], and R&D management [20]. For instance, the theory of inventive problem solving (TRIZ) initially proposed problem description and solution methods for technical conflicts in products [21]. Guilin Jin [22] established a mathematical model for resource conflicts based on the causes of conflicts in collaborative design, while Yiwei D [23] presented management strategies for conflicts between online and offline channels in traditional manufacturing enterprises from the perspective of resource allocation. In conflict resolution research in product design, scholars worldwide have proposed strategies such as optimization, negotiation, and game theory. José C. Alvarez [24], based on TRIZ theory, analysed and resolved knowledge conflicts in renewable energy products. Zia Bashir [25] designed a conflict resolution model based on game theory and rough set theory and analysed specific cases. Xiaoyun F [26] proposed a constraint-driven conceptual design model based on the FBS model.
Natural language processing (NLP) finds extensive application in product design, aiding in better understanding, processing, and generating natural language text [27]. NLP can enhance search engine capabilities by improving semantic understanding, enabling more accurate interpretation of user queries and returning relevant results [28]. Yiru J [29] used natural language processing to search for design requirements to build a recommendation system. Julian [30] uses natural language processing for innovation research. Sentiment analysis employs NLP techniques to identify and analyse emotions and sentiments in text [31]. It can monitor user sentiment on social media, analyse product reviews, evaluate customer feedback, etc., helping businesses understand user attitudes and emotional inclinations better. Yiming Z [32] used natural language processing tools to conduct sentiment analysis of Sina Weibo users under the influence of Super Typhoon Lekima.
In computer-aided conceptual design solution generation, scholars are currently focused on user requirement exploration, aided by patent databases, knowledge repositories, and other tools. Liting J [33] used the interval value intuitionistic fuzzy set method to analyse different customer preference distributions and market values. Chengshuo Y [34] explored user psychological behaviours based on cumulative prospect theory and generated conceptual design solutions accordingly. Longfan L [35] and Shihyao Y [36] utilized patent data to assist in generating new product conceptual design solutions. Dhiman G et al. [37] proposed a multi-objective seagull optimization algorithm that incorporates the concept of dynamic archiving and is characterized by caching nondominated Pareto optimal solutions.
In summary, the theory of design conflicts has not been sufficiently refined; research in various related fields has focused primarily on knowledge, information/data, and resource conflicts. The emphasis is generally on surface conflict resolution methods using functional and structural product parameters. Scholars mostly approach conceptual design solution generation from the perspectives of user needs and knowledge repository assistance, giving less consideration to the design philosophies of the designer from the standpoint of design conflicts. Therefore, this paper, based on the designer–user perspective, quantifies design conflicts and generates strategies for product conceptual design solution configurations, ultimately validating feasibility through practical examples. The overall architecture of the method for product conceptual design solution configuration based on the designer–user design conflict perspective is illustrated in Figure 1.
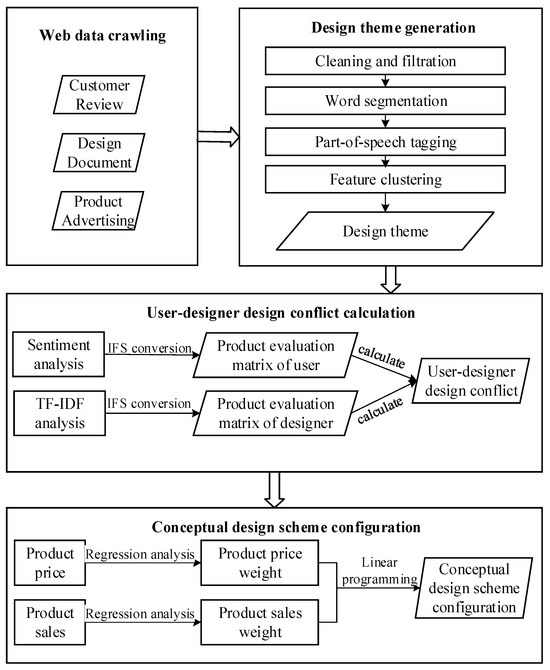
Figure 1.
Architecture of the product conceptual scheme configuration method based on the designer–user design conflict perspective.
2. Materials and Methods
2.1. Data Acquisition and Data Preprocessing
With the development of Internet technology, the methods for users to express their needs and product experiences have increased, and social media has become the primary platform for user information expression. Compared to traditional demand data processing methods, the key characteristics of online text data preprocessing lie in recognizing valuable comments and structuring text. The primary sources of online product data include user forums, user reviews, and product evaluation articles. Due to limitations in the quantity of user review and evaluation article data, user comment data were collected on similar products with similar prices and diverse configurations from online forums using Python. Considering the scarcity of designer-related data, design data are analysed and studied in this paper through product promotional advertisements and design documents.
Due to the diversity and ambiguity of user comment data, to ensure the accuracy of the research results, it is necessary to clean the data by eliminating irrelevant information. To ensure the research value of the collected user comment data, it is necessary to clean out useless data. The cleaned data includes:
Duplicate comment data: When users repeatedly post identical comments, it can introduce a “false high” interference in the process of data mining and analysis. Therefore, it is necessary to delete duplicate comment data and only retain one of the repeated comments from each user as the comment text for storage and analysis.
Missing comment data: Due to factors such as time, environment, and network, user-posted comment texts may have significant missing portions or even appear blank. This portion of the data has no research value and needs to be selectively removed to reduce the interference of noisy data.
After the comment data were cleaned, lexical segmentation and part-of-speech determination were performed using ROSTCM6 software (version 5.8.0.603).
2.2. Product Attribute Extraction and Evaluation
2.2.1. Product Attribute Extraction
After lexical segmentation and part-of-speech determination, the TF-IDF algorithm was used for the identification and frequency calculation of product attributes. The TF-IDF method is commonly used to quantify attribute words in documents, particularly in areas such as keyword extraction and document similarity calculation.
Based on the frequency of product attributes in the noun part of speech of comment data, similar keywords are merged, and irrelevant keywords are removed. The top 40 keywords are selected as product attributes , with their frequencies denoted as .
For the extracted product attributes , similarity clustering is applied to determine the optimal number of clusters, denoted as m. Analysing the clustered content helps identify design themes , and a thematic word library is established.
For instance, after clustering, a certain category of attribute words may include = “shell colour” and = “phone shape”. If the determined theme for this category is = “aesthetic perception”, the thematic word library is established.
2.2.2. Construction of Conceptual Design Scheme Form Matrix
To effectively assess product attributes and formulate the final conceptual design, the first step is to construct a conceptual design matrix for the product.
Each product attribute can be realized through different conceptual design solutions. By referencing existing products in the market and applying morphological matrix methods, all possible conceptual solutions can be explored, as shown in Table 1. In the morphological matrix, various solutions for each subfunction can be listed horizontally. Then, by selecting suitable main solutions from each subfunction, effective conceptual design solutions can be generated through combination.

Table 1.
Morphological matrix for product conceptual design.
2.2.3. User Perspective Product Attribute Evaluation
In the product evaluation process, users make subjective judgements based on their experiences, perspectives, skills, and backgrounds, leading to ineffective data and inaccurate assessment information that cannot be precisely expressed in numerical terms. To reliably obtain evaluation data for different solutions and to quantify the vague judgements of each user and designer using rough numbers, this study employs intuitionistic fuzzy sets (IFSs) to support three states—support, oppose, and neutral—in evaluating conceptual design solutions. The intuitionistic fuzzy sets (IFSs) can objectively describe customer attitudes as natural attributes in the decision-making process.
When the product attribute is a fixed set,
This function was initially proposed by Professor Atanassov [38], where , , and . Here, represents the user’s satisfaction with the product attribute, represents the user’s dissatisfaction with the product attribute, and represents the user’s hesitancy about the judgement. The formula is characterized by the following expression:
Since the comments used in this paper are structured data and the amount of data is small, this paper uses a rule-based method for sentiment analysis. Compared with the machine learning model of sentiment analysis, the accuracy is higher, and the calculation is simpler.
First, it locates the words related to product attributes in the sentences and identifies the presence of sentiment, degree, and negation words in the sentences. The quantification is detailed in Table 2.
Table 2.
Quantitative representation of word sentiment polarity.
The total sentiment for product attributes in user comments can be calculated as follows:
For example, the sentiment value of “I am very satisfied with the appearance of my phone” is 1 × 1 = 1. The sentiment value for “I’m a little disappointed with plastic phone cases” is 0.5 × (−1) = −0.5.
The calculated total sentiment has a range of {−1, −0.5, 0, 0.5, 1}. To better represent the uncertainty of users’ feelings towards product attributes, following the transformation method proposed by scholar Liting J [33], the user sentiment V is represented using IFSs.
Results of the transformation are shown in Table 3.
Table 3.
Transformation between total emotional value and intuitionistic fuzzy sets (IFSs).
Therefore, the overall user assessment value for product attributes is calculated by the following equation:
where represents the user total sentiment of user k for design attribute , and K is the number of comments for design attribute .
The construction of the product conceptual design scheme assessment matrix is shown in Table 4.
Table 4.
User perspective product attribute evaluation matrix.
After obtaining the user assessment matrix for product attributes, based on the relationship between product attributes and design themes, assuming that design theme includes m product attributes, the formula for calculating the user assessment matrix for design themes is as follows:
After obtaining the overall user assessment matrix for product attributes, it is presented in Table 5.
Table 5.
User perspective design topic evaluation matrix.
2.2.4. Designer Perspective Product Attribute Evaluation
To further analyse the opinions and attitudes of designers towards product attributes, this study collected data such as analytical data from designers on official product websites, including product promotional materials and documentation. Typically, these data describe the advantages and features of the product. Therefore, the sentiment associated with the collected product attributes from designers tends to be consistently positive.
Hence, based on the TF-IDF algorithm, this paper calculates sentiment scores that represent designers’ evaluations of the emotional tone associated with product attributes:
where is the frequency of occurrence of the attribute word in the document, is the sum of the number of all attribute words in the document, S is the number of product description documents, and is the number of documents containing the attribute word.
The normalization of is performed to serve as the satisfaction assessment value of designers for the product attributes. Subsequently, based on the relationship between product attributes and design themes, the satisfaction assessment value of designers for design themes can be calculated. As designers are generally more familiar with products, and dissatisfaction is typically low, this paper, following the research of relevant scholars, considers as the dissatisfaction measure for product evaluation. The hesitation degree is then calculated to construct the intuitionistic fuzzy set form of the designer assessment matrix, as illustrated in Table 6.
Table 6.
Design theme evaluation matrix from designer perspective.
2.3. Conflict Calculation
Based on the designer’s design theme assessment matrix and the user’s assessment matrix of design themes, a dissimilarity function was constructed to calculate the conflict between them.
The calculation results are shown in Table 7. Thus, the conflict matrix provides insights into the degree of conflict between users and designers for each design theme in the design proposal. A higher conflict value indicates a larger gap between the designer’s design concept and the user’s perception of that design theme. Conversely, a lower conflict value implies a smaller gap between the designer’s design concept and the user’s perception.
Table 7.
User and designer conflict matrix.
2.4. Optimal Solution Configuration
Product pricing information Pri and sales volume Sai were collected for products with the same sales cycle, where i represents the conceptual design scheme of the product.
Linear regression was performed separately for both product pricing and sales volume using the conflict values calculated in Section 2.3 for each design theme of the product scheme. The calculation formula is represented by the following equation:
where and represent the pricing weight and sales volume weight for each product design scheme in the design theme, and and are constants.
Subsequently, the optimal prices ( and ) for the improved products were determined. The calculation involves identifying the product configuration scheme that maximizes the expected sales volume among a limited set of product configurations.
The obtained optimal configuration scheme represents the combination of optimal design solutions for each product within each design theme.
3. Case Validation
Currently, mobile phone design is undergoing a trend towards shifting from a singular operational approach to a more stylish and user-centric direction. User satisfaction with mobile phones has become a pivotal factor driving innovation in product design. However, the discrepancy between the designer’s understanding of user needs and the real needs of users can sometimes lead to an excessive understanding of user needs, which leads to deviation of the final product design from market reality. Therefore, this study takes conceptual design schemes for mobile phones as decision-making objects, aiming to maximize market demand objectives and seek optimal conceptual solutions, thereby providing high-quality input for subsequent designs.
This section selects mobile phones as a case study to validate the effectiveness of the proposed method. With the development of the economy and technology, a plethora of different mobile phone models have emerged on the market, accelerating the competition and iteration of mobile phone designs among different manufacturers. The evolution of new media technologies has diversified the methods in which users express their needs, making the Internet the primary platform for consumers to articulate their product usage experiences and perceptions. Constantly emerging user comment data on mobile phones on forums have become a valuable source for extracting continuously evolving user demands, providing an effective avenue for improving mobile phone designs. Mobile phone designs typically involve modelling components and functionalities that significantly enhance user experiences. Throughout the entire lifecycle of a mobile phone, these components not only garner attention from manufacturers but also receive substantial consideration from users.
3.1. Data Acquisition and Preprocessing
The Chinese mobile phone industry has experienced rapid development in recent decades [39]. With the rapid growth of the Chinese economy and the drive for technological innovation, Chinese mobile phone manufacturers have emerged as major players in the global market.
Among them, Chinese mobile phone brands such as Huawei, Xiaomi, OPPO, and Vivo have achieved significant success in both domestic and international markets. These brands have attracted a large number of consumers with their high cost-effectiveness, innovative designs, and advanced technology.
According to the price comparison on JD.com [40], 43% of users choose prices ranging from 2136 to 3573 RMB. Products in this price range are mostly mid- to low-end mobile phones, possessing advantages in certain features to meet diverse user needs. Therefore, considering factors such as brand, sales, reviews, and prices, this study selects smartphones in the price range of 2500–3500 RMB, which are commonly chosen by young people, as the target for case analysis. Seven mobile phone products were chosen as the design schemes for case analysis: CS1: OnePlus Ace2 Pro; CS2: Honor 90 Pro; CS3: OPPO Reno10; CS4: Vivo iQOO Neo8; CS5: Realme GT5; CS6: Huawei Nova 11; and CS7: Redmi K60 Supreme Edition.
These seven models were released between September 2022 and April 2023. Regarding the selection of user comments, we initially filtered comments based on their length, selecting those with more than 30 words as our user sample. Additionally, comments on JD.com [40] followed a standardized format for describing five aspects of the product. Thus, after removing duplicate and missing comments, we chose the first 1000 comments posted after the release of each smartphone model as our sample.
As for the design documents from designers, we obtained them from the official websites of the smartphone brands. Additionally, designer data included official promotional materials for the products. This approach aimed to ensure the reliability of the data.
The data used in this study have been anonymized to remove user IDs, geographical locations, and other personal information. All methods were performed in accordance with the Chinese Data Security Management Measures and the crawling protocol of the JD website. All experimental protocols have been approved by JD Company, Beijing, China, and the experimental data were used with the informed consent of all experimental personnel.
ROSTCOM6 was employed for segmentation, and key terms were extracted, followed by the generation of a word cloud for visualization. The word cloud is generated as shown in Figure 2.
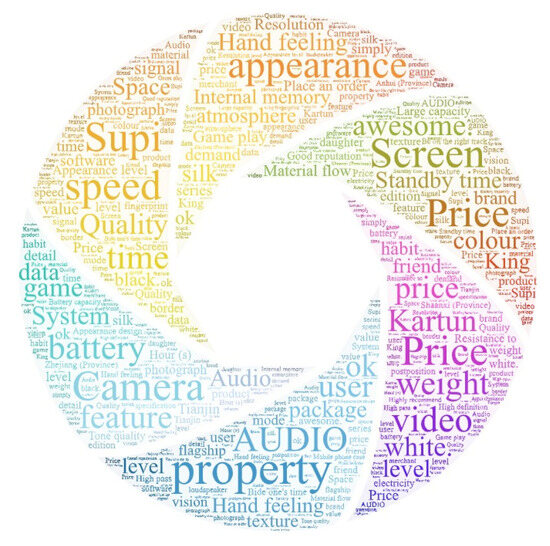
Figure 2.
Keywords word cloud image of users’ comments.
Similar keywords are merged, and irrelevant keywords are excluded. The top 40 keywords were selected as product attributes . Utilizing the relevant literature on mobile phone design in recent years and based on product attributes, semantic clustering has been applied to obtain design themes (DPm) for mobile phones. The classification results are presented in Table 8.
Table 8.
Design theme and inclusion design attributes.
The connected experience refers to the user’s self-expression and self-value demonstrated through the use of the product. It can serve as a symbol of identity, establishing unique social recognition for consumers.
3.2. User-Centric Design Concept Evaluation
Due to individual differences in shopping experiences, backgrounds, cultural contexts, personality traits, and other factors, users form unique emotional inclinations, leading to significant variations in their perceptions of product design concepts. This diversity extends beyond individual differences, encompassing the impact of shopping environments, societal factors, and psychological and physiological factors on individual shopping experiences.
By extracting emotional and qualitative terms from design attribute keywords and the calculation of users’ emotional inclinations represented by IFSs, an evaluation matrix for users’ perceptions of design themes is then computed.
Taking CS2 (Honor 90 Pro) and CS7 (Redmi K60 Ultra) as examples, as shown in Figure 3, the Honor 90 Pro is relatively balanced, with lower user evaluations in terms of aesthetic experience and phone endurance. In contrast, the Redmi K60 Ultra excels in performance, receiving consistent praise from users. However, outstanding performance comes at the expense of decreased phone endurance, leading to a decrease in user satisfaction with phone endurance. The calculation results are shown in Table 9.
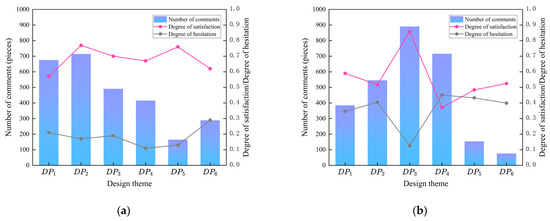
Figure 3.
User evaluation diagram of two conceptual design schemes: (a) CS2 (Honor), (b) CS7 (Redmi K60 Ultra).
Table 9.
User evaluation matrix.
3.3. Designer-Centric Product Design Concept Evaluation
When it comes to the unique design concepts of different designers, various design schemes are indeed likely to emerge. Each designer possesses their own aesthetic preferences, values, and creative perspectives, which are reflected in their designs.
In product introductions and design documents, designers often emphasize the strengths and features of the product to attract potential consumers and investors. This emphasis can make it challenging to provide a comprehensive and objective evaluation of design concepts.
Based on the TF-IDF algorithm, the evaluation values of the designer’s sentiment towards product attributes were calculated. The designer evaluation matrix for design concepts was constructed as shown in Table 10.
Table 10.
Designer evaluation matrix.
3.4. Calculation of Conflict Degree
Based on the evaluation matrices of design concepts by designers and the perception matrices of design concepts by users, the dissimilarity function was constructed using Formula (6) to calculate the degree of conflict between the two. The results are shown in Table 11.
Table 11.
The designer–user design conflict matrix.
3.5. Decision Making Based on Conflict Degree
3.5.1. Analysis of the Conflict Degree and Product Sales
The conflict degree between users and designers regarding product attributes can have a profound impact on product sales. Designers strive for innovation and aesthetics, dedicating themselves to adding novel features and unique design elements to products. However, these innovations may conflict with users’ needs and expectations, as users often prioritize practicality and functionality.
When designers excessively pursue innovation, and product attributes deviate from users’ actual needs, it may lead to a decline in sales. Users are generally more willing to purchase products that meet their needs, rather than those with unique appearances alone. Therefore, conflicts in product attributes between designers and users may negatively impact sales.
However, some successful products manage to strike a balance by combining attractive design features with functionality, meeting a wide range of user needs. Such products often achieve good sales performance in the market. Hence, product sales in relation to the conflict degree of product attributes depend on successfully integrating design innovation and user needs, directly influencing the product’s market performance.
This section explores the impact of user–designer conflicts on product sales based on the degree of conflict of the product attributes to determine the importance of these conflicts. First, sales data for the abovementioned seven design schemes were collected. As smartphones are primarily sold online, data were integrated from major official stores on platforms such as JD.com, Tmall, Taobao, and various brand-specific mobile phone shops. Sales are denoted as Sai (i = 1, 2, …, 7), with the Redmi K60 Supreme Edition having the highest sales at approximately 760,000 units [40], followed by the OPPO Reno10 at approximately 670,000 units [40]. The OnePlus Ace2 Pro and Huawei Nova 11 have lower sales, approximately 450,000 units and 430,000 units [40], respectively. A regression model was then constructed with the degree of conflict as the independent variable.
The coefficient is the weight of the design attribute conflict degree . The results are as Table 12:
Table 12.
The relationship between conflict degree and sales.
3.5.2. Analysis of the Conflict Degree and Product Pricing
Consumers typically expect products to possess superior qualities, rich features, and a convenient user experience. However, they also desire relatively lower prices to ensure good value for their money. This user expectation can potentially clash with the desires of designers who may seek to incorporate more advanced features and innovations into products, which often increases production costs and subsequently raises prices.
Therefore, in the process of product development, designers must find a balance to meet user expectations while ensuring the product remains reasonably priced. This requires a comprehensive consideration of factors such as costs, market competition, target audiences, and brand positioning. In some cases, products may adopt a differentiation strategy by offering various versions to meet the diverse needs of different user groups, thereby resolving conflicts.
This section delves into the impact of user–designer conflicts regarding product attribute conflict degrees on pricing, aiming to determine the pricing weight of this design attribute conflict. Initial data collection includes the prices of the seven design schemes mentioned in this paper, with JD.com’s self-operated prices used as a reference (denoted as Pri for i = 1, 2, …, 6), all falling within the [2500, 3500] RMB price range. Utilizing conflict degree as the independent variable, a regression model was constructed according to Formula (11). The calculation results are shown in Table 13.
Table 13.
The relationship between conflict degree and pricing.
3.5.3. Calculating the Optimal Design Solution
Using the design themes covered by the seven design schemes as references for product selection, and considering the product price range [2500, 3500] as a constraint, the optimal product configuration scheme was calculated that maximizes the expected sales under limited product types based on Formulas (9) and (10).
The optimal configuration scheme is shown in Table 14.
Table 14.
Optimal conceptual design scheme.
3.5.4. Analysis of Design Improvement Directions
To understand the specific directions for improving the product, this study conducted a comparative analysis based on the optimal solution. Using CS7 (Redmi K60 Ultra) as an example, we aimed to identify areas for enhancement.
As shown in Figure 4, in DP1, DP2, DP4, and DP6, the conflict degree of CS7 is higher than the product’s optimal configuration CSnew. This indicates that in these four design themes, the design approach adopted by CS7 will result in more conflicts, leading to a decrease in sales. Therefore, significant improvements are needed in these four aspects. The larger the difference, the higher the priority for improvement. Thus, the priority for improvement in product themes is DP1 > DP2 > DP4 > DP6.
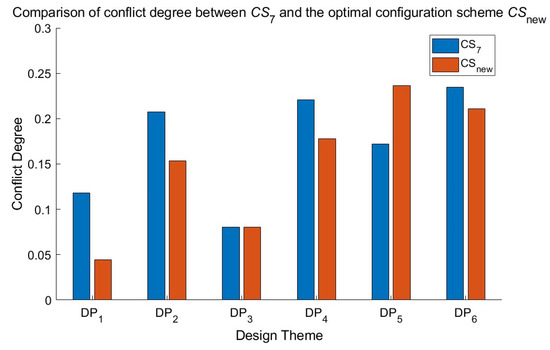
Figure 4.
Comparison of the degree of conflict between CS7 and the optimal configuration scheme CSnew.
Based on the raw data captured in Section 3.1, negative comments related to four CS7 design themes were selected for manual labelling. The comments were analysed to extract elements such as “product features” and “product issues”, and their frequency and percentage were calculated. For brevity, the analysis results are presented for DP1 (aesthetic experience) as an example in Table 15; similar analyses were conducted for DP2, DP4, and DP6 but are not listed here.
Table 15.
CS7 visual experience negative review information statistics table.
After identifying the issues mentioned above, specific improvement strategies can be proposed through consultations with experts, such as:
- (1)
- Consider using higher-quality, tactile plastics or exploring the use of premium materials such as metal or glass. Special surface treatments can be applied to enhance the touch and texture, reducing the perception of low cost. A wider range of colours can be chosen to increase product appeal. Moreover, gradient colours, frosted textures, or other unique designs can be explored to enhance visual distinctiveness. The curvature and design of the shell should be adjusted to improve ergonomic comfort. The addition of anti-slip features should be considered to enhance grip stability.
- (2)
- Implementing anti-fingerprint coatings to reduce fingerprint and dust adhesion. The screen colour accuracy and saturation should be increased to ensure clearer and more vivid display effects.
- (3)
- A smoother camera module seamlessly integrated with the shell design is used to reduce protrusion. Consider adopting a concealed design or unique shape to maintain aesthetics.
- (4)
- Consider using more robust materials, such as metals, to improve durability. Edge protection designs have been introduced to reduce the risk of collision damage to the mid-frame.
4. Conclusions
For practitioners in product design, our study offers valuable insights into the importance of considering both user needs and designer design concepts when determining design conflicts in the product design process. By understanding and addressing these conflicts, practitioners can develop more holistic and user-centred design solutions. Additionally, the incorporation of natural language processing and machine learning techniques to assist in product conceptualization can significantly enhance work efficiency and the reliability of design solutions. Practitioners can benefit from adopting these computational approaches to streamline their design processes and improve the overall quality of their products.
For researchers in the field of product design, our study contributes to the growing body of knowledge on the integration of user needs and designer design concepts in the design process. The exploration of design conflicts and their resolution mechanisms provides researchers with valuable insights into the dynamics of the design process and the factors that influence design outcomes. Moreover, the application of computational techniques such as natural language processing and machine learning opens up new avenues for research in product design methodology and computational design approaches. Researchers can build upon our findings to further investigate the effectiveness of these computational tools in supporting the design process and explore novel methods for enhancing design creativity and innovation.
This paper has some limitations. Firstly, it focuses on highly modular products heavily influenced by designer design concepts, which are common industrial goods, applicable not only to smartphones but also to computers, televisions, and even automobiles. However, for specialized equipment with complex designs, this study still has certain limitations. Secondly, the target group selected during data collection was young people, overlooking the effects of advertising, celebrity endorsements, etc., leading to potential biases in the product data and possibly not being applicable to products for users of all ages. Lastly, the natural language processing methods employed in this study are suitable for small-scale structured data but are less efficient when applied to large databases.
Our next work is to continue this research, focusing on building a model of design conflict and user preferences. Considering the multiple reasons behind design conflict between designers and users, such as values, knowledge structure, motivation, etc., the model to be constructed is indeed a complex model, as it will be used to balance different design elements and user preferences through design conflicts.
Author Contributions
H.S.: writing, reviewing, project administration, and supervision. S.P.: methodology, software, data analysis, and writing—original draft preparation. Y.S.: conceptualization, methodology, and software. Q.L.: methodology and reviewing. All authors have read and agreed to the published version of the manuscript.
Funding
This study was supported by the National Key Research and Development Projects of China (No. 2018YFB1701700).
Institutional Review Board Statement
Ethical review and approval were waived for this study, due to the implementation of all methods in accordance with China’s Data Security Management Measures and Jingdong Website Crawler Agreement. All experimental agreements were approved by Jingdong Company.
Informed Consent Statement
The experimental data have been informed consent of all experimental personnel.
Data Availability Statement
The raw data supporting the conclusions of this article will be made available by the authors on request.
Conflicts of Interest
The authors declare no conflicts of interest.
References
- Xiao, J.-W.; Xie, Y.; Fang, H.; Wang, Y.-W. A New Deep Clustering Method with Application to Customer Selection for Demand Response Program. Int. J. Electr. Power Energy Syst. 2023, 150, 109072. [Google Scholar] [CrossRef]
- Chesbrough, H. Open Innovation: The New Imperative for Creating and Profiting from Technology; Harvard Business Press: Boston, MA, USA, 2003; Volume 21, ISBN 978-1-57851-837-1. [Google Scholar]
- Ali, S.M.; Qamar, A.; Phuntsho, S.; Ghaffour, N.; Vrouwenvelder, J.S.; Shon, H.K. Conceptual Design of a Dynamic Turbospacer for Efficient Low Pressure Membrane Filtration. Desalination 2020, 496, 114712. [Google Scholar] [CrossRef]
- Sziroczak, D.; Jankovics, I.; Gal, I.; Rohacs, D. Conceptual Design of Small Aircraft with Hybrid-Electric Propulsion Systems. Energy 2020, 204, 117937. [Google Scholar] [CrossRef]
- Huang, Z.; Guo, X.; Liu, Y.; Zhao, W.; Zhang, K. A Smart Conflict Resolution Model Using Multi-Layer Knowledge Graph for Conceptual Design. Adv. Eng. Inf. 2023, 55, 101887. [Google Scholar] [CrossRef]
- Ma, J.; Kremer, G.E.O.; Ray, C.D. A Comprehensive End-of-Life Strategy Decision Making Approach to Handle Uncertainty in the Product Design Stage. Res. Eng. Des. 2018, 29, 469–487. [Google Scholar] [CrossRef]
- Lin, C.-T.; Lee, C.; Chen, W.-Y. Using Fuzzy Analytic Hierarchy Process to Evaluate Service Performance of a Travel Intermediary. Serv. Ind. J. 2007, 29, 281–296. [Google Scholar] [CrossRef]
- Jing, L.; Li, Z.; Peng, X.; Li, J.; Jiang, S. A Relative Equilibrium Decision Approach for Concept Design Through Fuzzy Cooperative Game Theory. J. Comput. Inf. Sci. Eng. 2019, 19, 1. [Google Scholar] [CrossRef]
- Shidpour, H.; Da Cunha, C.; Bernard, A. Group Multi-Criteria Design Concept Evaluation Using Combined Rough Set Theory and Fuzzy Set Theory. Expert Syst. Appl. 2016, 64, 633–644. [Google Scholar] [CrossRef]
- Champasak, P.; Panagant, N.; Pholdee, N.; Bureerat, S.; Rajendran, P.; Yildiz, A.R. Grid-Based Many-Objective Optimiser for Aircraft Conceptual Design with Multiple Aircraft Configurations. Eng. Appl. Artif. Intell. 2023, 126, 106951. [Google Scholar] [CrossRef]
- Jing, L.; Zhan, Y.; Li, Q.; Peng, X.; Li, J.; Gao, F.; Jiang, S. An Integrated Product Conceptual Scheme Decision Approach Based on Shapley Value Method and Fuzzy Logic for Economic-Technical Objectives Trade-off under Uncertainty. Comput. Ind. Eng. 2021, 156, 107281. [Google Scholar] [CrossRef]
- Jing, L.; Zhang, H.; Dou, Y.; Feng, D.; Jia, W.; Jiang, S. Conceptual Design Decision-Making Considering Multigranularity Heterogeneous Evaluation Semantics with Uncertain Beliefs. Expert Syst. Appl. 2024, 244, 122963. [Google Scholar] [CrossRef]
- Jing, L.; Yang, J.; Ma, J.; Xie, J.; Li, J.; Jiang, S. An Integrated Implicit User Preference Mining Approach for Uncertain Conceptual Design Decision-Making: A Pipeline Inspection Trolley Design Case Study. Knowl.-Based Syst. 2023, 270, 110524. [Google Scholar] [CrossRef]
- Guo, X.; Liu, Y.; Zhao, W.; Wang, J.; Chen, L. Supporting Resilient Conceptual Design Using Functional Decomposition and Conflict Resolution. Adv. Eng. Inf. 2021, 48, 101262. [Google Scholar] [CrossRef]
- Slimani, S.; Ferreira da Silva, C.; Médini, L. Conflicts Mitigation in Collaborative Design. Int. J. Prod. Res. 2006, 44, 1681–1702. [Google Scholar] [CrossRef]
- Yu, K.; Qian, C.; Chen, J. How Does Intelligent Manufacturing Reconcile the Conflict between Process Standards and Technological Innovation? J. Eng. Tech. Manag. 2022, 65, 101698. [Google Scholar] [CrossRef]
- Qu, G.; Chen, J.; Zhang, R.; Wang, L.; Yang, Y. Technological Search Strategy and Breakthrough Innovation: An Integrated Approach Based on Main-Path Analysis. Technol. Forecast. Soc. 2023, 196, 122879. [Google Scholar] [CrossRef]
- Lescano, G.; Torres-Jimenez, J.; Costaguta, R.; Amandi, A.; Lara-Alvarez, C. Detecting Conflicts in Collaborative Learning through the Valence Change of Atomic Interactions. Expert Syst. Appl. 2021, 183, 115291. [Google Scholar] [CrossRef]
- Lescano, G.; Lara-Alvarez, C.; Collazos, C.; Costaguta, R. A Technique for Conflict Detection in Collaborative Learning Environment by Using Text Sentiment. Lect. Notes Comput. Sci. 2020, 12469, 39–50. [Google Scholar] [CrossRef]
- Xie, J.; Song, X.M.; Stringfellow, A. Interfunctional Conflict, Conflict Resolution Styles, and New Product Success: A Four-Culture Comparison. Manag. Sci. 1998, 44, S192–S206. [Google Scholar] [CrossRef]
- Al’tshuller, G.S. Creativity as an Exact Science: The Theory of the Solution of Inventive Problems; Studies in cybernetics; Gordon and Breach Science Publishers: New York, NY, USA, 1984; ISBN 978-0-677-21230-2. [Google Scholar]
- Jin, G.; Ying, B.; Rong, Z. A Conflict Resolution Algorithm Considering Design Objective Optimization in Collaborative Design. In Proceedings of the 2009 16th International Conference on Industrial Engineering and Engineering Management, Beijing, China, 21–23 October 2009; pp. 1669–1674. [Google Scholar]
- Du, Y.; Cui, M.; Su, J. Implementation Processes of Online and Offline Channel Conflict Management Strategies in Manufacturing Enterprises: A Resource Orchestration Perspective. Int. J. Inf. Manag. 2018, 39, 136–145. [Google Scholar] [CrossRef]
- José, C.A.; Hatakeyama, K.; Carvalho, M.; Marçal, R.C.; Inche, J.; de Melo, N. A Model for Renewable Energy-Based Product Innovation Based on TRIZ Methodology, Exergy Analysis and Knowledge Management: Case Study. Energy Rep. 2022, 8, 1107–1114. [Google Scholar] [CrossRef]
- Bashir, Z.; Mahnaz, S.; Abbas Malik, M.G. Conflict Resolution Using Game Theory and Rough Sets. Int. J. Intell. Syst. 2021, 36, 237–259. [Google Scholar] [CrossRef]
- Fu, X.; Zhang, H.; Jing, L.; Fan, X.; Lu, C.; Jiang, S. A Constraint-Driven Conceptual Design Approach for Product Based on Function-Behavior-Structure Design Process. Comput. Ind. Eng. 2024, 189, 109994. [Google Scholar] [CrossRef]
- Sala, R.; Pirola, F.; Pezzotta, G.; Cavalieri, S. Leveraging Natural Language Processing for Enhanced Remote Troubleshooting in Product-Service Systems: A Case Study. Procedia Comput. Sci. 2024, 232, 1259–1268. [Google Scholar] [CrossRef]
- Das, S.; Deb, N.; Cortesi, A.; Chaki, N. Extracting Goal Models from Natural Language Requirement Specifications. J. Syst. Softw. 2024, 211, 111981. [Google Scholar] [CrossRef]
- Jiao, Y.; Qu, Q.-X. A Proposal for Kansei Knowledge Extraction Method Based on Natural Language Processing Technology and Online Product Reviews. Comput. Ind. 2019, 108, 1–11. [Google Scholar] [CrossRef]
- Just, J. Natural Language Processing for Innovation Search—Reviewing an Emerging Non-Human Innovation Intermediary. Technovation 2024, 129, 102883. [Google Scholar] [CrossRef]
- Giménez, M.; Palanca, J.; Botti, V. Semantic-Based Padding in Convolutional Neural Networks for Improving the Performance in Natural Language Processing. A Case of Study in Sentiment Analysis. Neurocomputing 2020, 378, 315–323. [Google Scholar] [CrossRef]
- Zhang, Y.; Sun, M.; Ren, Y.; Shen, J. Sentiment Analysis of Sina Weibo Users Under the Impact of Super Typhoon Lekima Using Natural Language Processing Tools: A Multi-Tags Case Study. Procedia Comput. Sci. 2020, 174, 478–490. [Google Scholar] [CrossRef]
- Jing, L.; Yao, J.; Gao, F.; Li, J.; Peng, X.; Jiang, S. A Rough Set-Based Interval-Valued Intuitionistic Fuzzy Conceptual Design Decision Approach with Considering Diverse Customer Preference Distribution. Adv. Eng. Inf. 2021, 48, 101284. [Google Scholar] [CrossRef]
- Ying, C.; Li, Y.-L.; Chin, K.-S.; Yang, H.-T.; Xu, J. A New Product Development Concept Selection Approach Based on Cumulative Prospect Theory and Hybrid-Information MADM. Comput. Ind. Eng. 2018, 122, 251–261. [Google Scholar] [CrossRef]
- Liu, L.; Li, Y.; Xiong, Y.; Cavallucci, D. A New Function-Based Patent Knowledge Retrieval Tool for Conceptual Design of Innovative Products. Comput. Ind. 2020, 115, 103154. [Google Scholar] [CrossRef]
- Yang, S.-Y.; Soo, V.-W. Extract Conceptual Graphs from Plain Texts in Patent Claims. Eng. Appl. Artif. Intell. 2012, 25, 874–887. [Google Scholar] [CrossRef]
- Dhiman, G.; Singh, K.K.; Soni, M.; Nagar, A.; Dehghani, M.; Slowik, A.; Kaur, A.; Sharma, A.; Houssein, E.H.; Cengiz, K. MOSOA: A New Multi-Objective Seagull Optimization Algorithm. Expert Syst. Appl. 2021, 167, 114150. [Google Scholar] [CrossRef]
- Atanassov, K.T. Intuitionistic Fuzzy Sets. Fuzzy Sets Syst. 1986, 20, 87–96. [Google Scholar] [CrossRef]
- Zhang, Y.; Song, Y.; Zhang, W.; Wang, X. Working and Residential Segregation of Migrants in Longgang City, China: A Mobile Phone Data-Based Analysis. Cities 2024, 144, 104625. [Google Scholar] [CrossRef]
- JD.com, Inc. Available online: https://www.jd.com/ (accessed on 21 March 2024).
Disclaimer/Publisher’s Note: The statements, opinions and data contained in all publications are solely those of the individual author(s) and contributor(s) and not of MDPI and/or the editor(s). MDPI and/or the editor(s) disclaim responsibility for any injury to people or property resulting from any ideas, methods, instructions or products referred to in the content. |
© 2024 by the authors. Licensee MDPI, Basel, Switzerland. This article is an open access article distributed under the terms and conditions of the Creative Commons Attribution (CC BY) license (https://creativecommons.org/licenses/by/4.0/).